
 Open Access Article
 This Open Access Article is licensed under a Creative Commons Attribution-Non Commercial 3.0 Unported Licence
Imaging margins of skin tumors using laser-induced breakdown spectroscopy and machine learning
Kateřina
Kiss
abc,
Anna
Šindelářová
d,
Lukáš
Krbal
be,
Václav
Stejskal
 be,
Kristýna
Mrázová
b,
Jakub
Vrábel
df,
Milan
Kaška
bc,
Pavlína
Modlitbová
d,
Pavel
Pořízka
*df and
Jozef
Kaiser
df
be,
Kristýna
Mrázová
b,
Jakub
Vrábel
df,
Milan
Kaška
bc,
Pavlína
Modlitbová
d,
Pavel
Pořízka
*df and
Jozef
Kaiser
df
aCharles University, Third Faculty of Medicine, Department of Plastic Surgery, Ruská 2411, 100 00 Praha 10, Czech Republic
bCharles University, Faculty of Medicine in Hradec Kralove, Šimkova 870, 500 03 Hradec Králové, Czech Republic
cSurgical Department, University Hospital Hradec Králové, Sokolská 571, 500 05 Hradec Králové, Czech Republic
dCEITEC Brno University of Technology (CEITEC) Brno University of Technology, Purkyňova 656/123, 612 00 Brno, Czech Republic. E-mail: pavel.porizka@ceitec.vutbr.cz
eThe Fingerland Department of Pathology, University Hospital Hradec Kralove, Sokolská 581, 500 05 Hradec Kralove, Czech Republic
fFaculty of Mechanical Engineering, Brno University of Technology, Technická 2896/2, 616 69 Brno, Czech Republic
First published on 1st April 2021
Abstract
Nowadays, laser-based techniques play a significant role in medicine, mainly in the ophthalmology, dermatology, and surgical fields. So far, they have presented mostly therapeutic applications, although they have considerable potential for diagnostic approaches. In our study, we focused on the application of laser-based spectroscopy in skin cancer assessment. Recently, lengthy and demanding pathological investigation has been improved with modern techniques of machine learning and analytical chemistry where elemental analysis provides further insight into the investigated phenomenon. This article deals with the complementarity of Laser-Induced Breakdown Spectroscopy (LIBS) with standard histopathology. This includes discussion on sample preparation and feasibility to perform 3D imaging of a tumor. Typical skin tumors were selected for LIBS analysis, namely cutaneous malignant melanoma, squamous cell carcinoma and the most common skin tumor basal cell carcinoma, and a benign tumor was represented by hemangioma. The imaging of biotic elements (Mg, Ca, Na, and K) provides the elemental distribution within the tissue. The elemental images were correlated with the tumor progression and its margins, as well as with the difference between healthy and tumorous tissues and the results were compared with other studies covering this topic of interest. Finally, self-organizing maps were trained and used with a k-means algorithm to cluster various matrices within the tumorous tissue and to demonstrate the potential of machine learning for processing of LIBS data.
1. Introduction
Skin cancer is the most common type of malignancy in the Caucasian population with ever-increasing incidence leading to escalation of health-care costs.1,2 Skin cancer is classified into two groups: (A) non-melanomatous skin cancers (NMSC) represented by two major forms, (i) Basal Cell Carcinoma (BCC) and (ii) Squamous Cell Carcinoma (SCC) with slower evolution as well as rarer metastatic spreading;3 and (B) Malignant Melanoma (MM) for which early diagnosis is an essential factor in the treatment and in the prognosis of this disease.4Histopathological examination remains the gold standard of skin cancer diagnosis. The tissue after biopsy is processed typically via formaldehyde fixing and paraffin embedding (FFPE), cut into thin sections and stained with hematoxylin and eosin (H&E) to visualize the structure of cells. The examination itself and determining the type and extent of the skin lesion depend on the pathologist's experience. In our work we present a potential method coupled with advanced processing of spectroscopic data that could be a supportive tool for the diagnosis of skin tumors.
Advanced analytical techniques have been intensively developed and implemented in the diagnostic process for the imaging of structural or chemical changes within a tissue.5 Obtained results complement and even extend the outputs of a classical optical microscope with an intended goal to mitigate the number of recurrences. The bioimaging of metals and non-metals and their distribution within a tissue is of particular importance in life sciences. A deficiency or an increased concentration of individual elements leads to diseases or influences biological processes. Laser Ablation Inductively Coupled Plasma Mass Spectrometry (LA-ICP-MS) is a standard technique established for bioimaging and metallomics.6 LA-ICP-MS enables performing elemental layout analysis with high sensitivity; its applications were recently reviewed by Becker et al.7–10 and Konz et al.11 This method was successfully used to differentiate the tumor areas in paraffin embedded breast tumors.12 The elemental layout in tissues can be determined by using both LA-ICP-MS and LIBS. Even though LA-ICP-MS is more sensitive, its utilization as a high-throughput analytical method is burdened by the cost of novel time-of-flight MS systems and the cost of service and maintenance in general.
Laser-Induced Breakdown Spectroscopy (LIBS) established its position in bioimaging due to the significant improvements in instrumentation. LIBS excels in terms of cost-to-performance, providing a high repetition rate and satisfactory sensitivity. Thus, its utilization is advocated as a preliminary scanning of a vast number of samples prior to a more accurate and sensitive analysis which is yet slower and more expensive. The latest achievements in elemental mapping by LIBS were reviewed by Limbeck et al. and Motto-Ros et al.13,14 The whole slide imaging and analysis of large scale samples found its purpose in the analysis of whole plant samples (from the root to leaf).15,16 Recently, the feasibility of LIBS in the elemental imaging of hard and soft tissues was repeatedly proved and comprehensively reviewed.17–20 Both methods LA-ICP-MS and LIBS can assess samples pretreated (FFPE) or intact (frozen cryosections).
Considerable effort has been invested in the implementation of LIBS in cancer research and histopathological routine. LIBS suffers from a relatively poor sensitivity compared to its analytical counterparts (namely LA-ICP-MS); hence, it is used in tumor analysis to detect major (C, H, O) and minor (Mg, Ca, Na, and K) elements. Particularly the major elements serve as representative biomarkers for LIBS related research in tumor diagnosis.21 Therefore, LIBS is also considered as a complementary technique to LA-ICP-MS and their tandem utilization seems to be beneficial.22,23
Several studies have already proved the feasibility of LIBS in the bioimaging of various tumor tissues showing another extension of classical histopathology. LIBS images enable the visualization of the tissue structure from the chemical point of view (e.g. Ca, Fe, Mg, Na, P, and Zn) and the investigation of differences between the non-tumor and tumor (malignant melanoma, squamous cell carcinoma, and Merkel cell carcinoma) human tissue.24 In the histological praxis, hyperspectral imaging can also reveal the presence of exogenous elements accumulated within the tissue.25 This metal imbalance is direct evidence of various diseases.
It is mandatory to accurately determine the tumor margins in order to verify the sufficiency of the biopsy and mitigate the possibility of recurrence. This is the next step in a successful implementation of LIBS in cancer related research. The Mg/C intensity ratio was investigated as a rough estimate of the boundary between healthy and malignant murine cutaneous tissue.26 This simple step points out individual elements as potential biomarkers dependent on the malignancy of the tissue. This is used as an advantage in our work; appropriately selected four light metal elements (Mg, Ca, Na, and K) serve as full-fledged indicators of healthy or cancerous tissues.
In this article, we implement LIBS bioimaging further in terms of whole slide imaging of selected human cancerous tissues, including 3D imaging. The novelty lies in the advanced processing of collected hyperspectral data and in the consequent application of multivariate algorithms. The cluster analysis results in discrimination of diseased cutaneous tissue from its healthy surrounding. In turn, the utilization of machine learning opens new paradigms in LIBS-related cancer research.
2. Experimental
2.1 Tissue processing
Patients of the University Hospital Hradec Kralove diagnosed with a skin tumor were selected for this study. Based on a dermatologist's recommendation, a surgical procedure was planned – a wide local excision with a certain safety margin of healthy skin. All patients signed the informed consent form and the study was approved by the Ethics Committee of the University Hospital Hradec Kralove under the reference number 201805 S08P. At the plastic surgery department, surgical removal (biopsy) was performed under local or general anesthesia in accordance with the standard practice. The sampled tissues were immersed in formaldehyde and transported to the pathological department. All samples were histologically examined, and the final diagnosis was determined.For our study, we selected representative samples (Table 1) of various tumors (cutaneous biopsies) based on the detailed histopathological diagnosis. The tissue was embedded in melted paraffin (FFPE) and in the form of blocks they were consequently cut using a sliding microtome (SM2010 R, Leica, Germany) into slices of thickness (i) 1 μm for the standard histopathology after H&E staining, and (ii) 10 μm for further LIBS analyses. The slices were affixed to microscope slides (IHC adhesive glass slide TOM-14; Matsunami, Japan). For consecutive LIBS analysis, slices mounted on glass slides and original biopsies in paraffin blocks were considered without using any histological staining and any covering glass.
| ID | Tumor | X × Y number of spots | Spectra collected from sample |
|---|---|---|---|
| MM | Malignant melanoma | 210 × 76 | 15![[thin space (1/6-em)]](https://www.rsc.org/images/entities/char_2009.gif) 690 690 |
| BCC | Basal cell carcinoma | 147 × 197 | 28959 |
| HM | Haemangioma | 230 × 210 | 48300 |
| SCC | Squamous cell carcinoma | 94 × 140 | 13160 |
2.2 LIBS
All measurements were performed using the LIBS discovery instrument, developed at the Central European Institute of Technology, Brno University of Technology (Czech Republic). The experimental apparatus for LIBS analysis consisted of a Q-switched Nd:YAG laser CFR Ultra 400 (Quantel by Lumibird, France; 532 nm, 10 ns, 20 Hz). The laser beam was focused on the sample surface by a triplet lens (Sill Optics, Germany) with a focal length of 24.5 mm forming a spot size of 100 microns. Plasma emission was collected by wide-angle optics and transferred through an optical fiber to the entrance slit of a Czerny–Turner spectrometer (SR-500i-B2-R, Andor, Northern Ireland) equipped with a grating of 1200 lines per mm and 50 μm entrance slit. Plasma emission was detected using a gated sCMOS detector (iSTAR-sCMOS-18F-E3, Andor, Northern Ireland; 0.5 μs gate delay, 50 μs gate width, 4000 gain). The samples were analyzed under an Ar purge.The whole slide images (WSI) of the selected samples (Table 1) were provided in the mapping with a 100 μm step in both directions. LIBS analysis was performed directly in the paraffin blocks similar to ref. 24 and 25. For each sample (MM, BCC, HM) we conducted 4 measurements with a different spectral range. The sizes of individual maps for each sample were kept constant with respect to detection of all the elements of interest (Mg, Ca, Na, and K). In between LIBS analyses, the sample paraffin blocks were treated with a sliding microtome (HM430, Thermo Scientific, UK). A rotary microtome was used to provide a fresh, smooth surface in between LIBS analyses of consecutive layers. Approx. 150 μm were cut-off after each LIBS analysis and this gives the depth resolution.
The spectrometer enabled analysis only in limited spectral windows (approx. 25 nm), and therefore each element (Mg, Ca, Na, and K; Table 2) was analyzed in individual layers for individual wavelength ranges depending on the selected spectral line (Table 2) for each element. These measurements were then combined for clustering. A narrow spectral range was selected for each element allowing analysis of other elements also (Ar from gas purge) and molecular bands (such as CN). However, only selected elements were considered for this study. Furthermore, as it was evidenced in the literature,21,24,26 only the variance in the presence of selected metals could serve as a full-fledged indicator of healthy or cancerous tissues.
| Element and ionization level | Wavelength (nm) | Einstein coefficient (×108 s−1) | Upper energy (eV) |
|---|---|---|---|
| Mg II | 279.55 | 2.60 | 4.43 |
| Ca II | 393.37 | 1.47 | 3.15 |
| Na I | 589.00 | 0.62 | 2.10 |
| K I | 766.49 | 0.38 | 1.62 |
After each measurement, the background was corrected using the moving minimum function. The size of the minimum window was set at 80 points and the smoothing window at 30 points. Subsequently, the signal-to-noise ratio for the selected peak and noise range was calculated. The signal was defined as the maximum intensity of an inspected spectral line in the selected range and noise was determined as a standard deviation of all points in the background range.
An automatized data processing procedure was added to the exploration of hyperspectral images.27 Spectral ranges-of-interest were cropped around specific lines (Mg, Ca, Na, and K) and later processed using a self-organizing map (SOM) algorithm, which had already been introduced to LIBS data processing,28 for each sample and range separately. A closer description of SOM in the context of LIBS-data processing can be found in ref. 29. In the present case, the architecture used for the SOM network consisted of a grid (5 × 5 neurons) of rectangular topology. The representative subset for training was 100 spectra. The output of the model was clustered using the k-means algorithm into 5 clusters.
3. Results and discussion
3.1 Optimization
Sample preparation is a necessary and crucial step in bio-imaging. The optimization of sample preparation reflected was suggested in the LIBS literature.30,31 We chose the formaldehyde fixing and paraffin embedding (FFPE) approach as it is the golden standard in the histological routine, and it was successfully used in many studies dealing with bioimaging of soft tissues.32–34Prior to any further analyses, we compared laser ablation with respect to the amount of ablated mass. Basically, the more ablated mass the better in the case of LIBS which struggles with sensitivity. Thus, we experimented with the width of the thin section, adjusting it in a range from 1 to 20 microns. Thinner sections (less than 10 microns) did not provide enough material and laser-induced plasma (LIP) radiation was weak with a poor signal-to-noise ratio (SNR). For thicker sections (more than 10 microns), the cutting and fixing of a section were tedious and hardly repeatable. Moreover, the results were biased when the thin sections mounted on glass slides were investigated. The ablation of such specimens involves the glass material itself, which in turn leads to the introduction of unwanted spectral interferences in the characteristic LIP radiation. Note that in each case (a thin section or a block), the LIBS experiment was extensively optimized in terms of the laser pulse energy, defocus, gate delay, atmosphere and ablation gas, and the results of this optimization are covered in our previous article on imaging of soft tissues. Here we measured the samples with the already optimized parameter settings.35
The direct analysis of a paraffin block is a vital alternative to the analysis of thin sections.24,25 This approach involves a higher amount of ablated mass and avoids any sectioning when still being related to FFPE preparation. A visual comparison of images obtained from the analysis of thin sections and paraffin blocks (Fig. 1) of BCC samples (basal-cell carcinoma) reveals a higher SNR and contrasting contours through an enhanced dynamic range in the case of the tissue analyzed directly in a paraffin block. The optimized parameters are given in Section 2.2. Based on the results, we centered all our further analyses around the direct laser ablation of paraffin blocks.
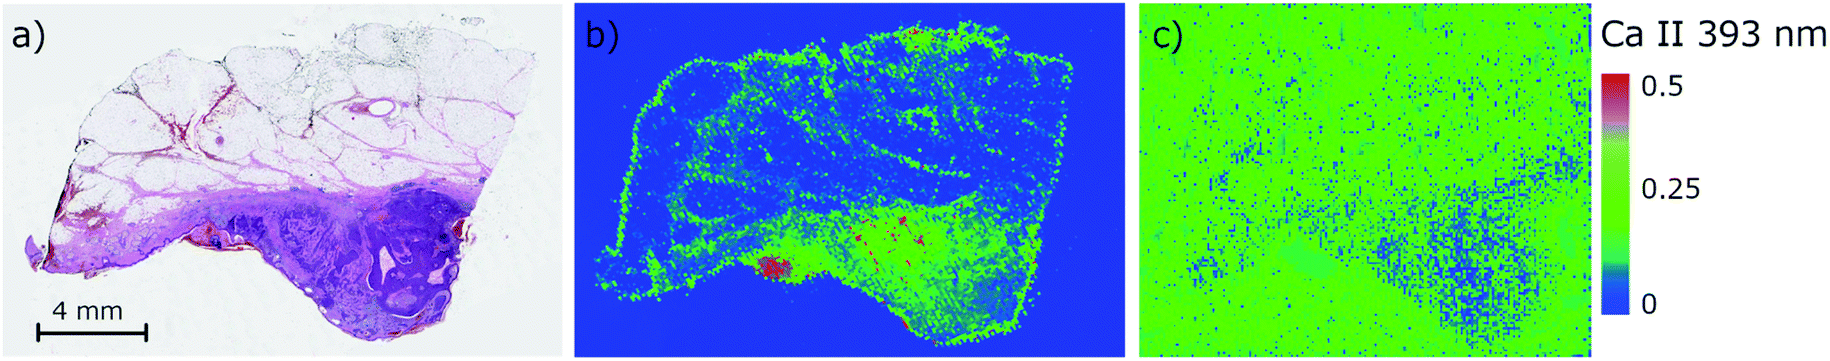 | ||
| Fig. 1 The analyses of BCC samples (basal-cell carcinoma) depicted in the histological image (a) in terms of Ca intensity maps: (b) block and (c) 10 μm thin cross-section when analyzed with the optimized LIBS parameters. | ||
3.2 3D imaging
The higher throughput of LIBS enables scanning of the sample layer by layer. This feature is beneficially utilized in bioimaging on the scale of the entire sample, e.g. cutaneous tumor, and providing information on the structural changes within the sample in terms of chemical (elemental) composition. The 3D imaging of soft tissues can be performed with two basic approaches; (i) depth-profiling without any treatment of the sample surface between layers, and (ii) analysis of consecutive slices.36 In the present work, we analyzed the sample embedded in the paraffin block; the sample was finely cut prior to each analysis on a microtome giving a depth resolution of approx. 150 microns.The depth-resolved analysis of a SCC sample yielded 14 images showing the distribution of Ca II 393.37 nm line intensity within the tumor sample and a total depth of greater than 2.2 mm (Fig. 2). For smaller depths, the distribution seemed uniform and did not change rapidly. Naturally, this approach justifies the measurements of consecutive slices and combining data together when the analysis of larger tumors is taking place. The depth-resolved structure of the sample is evident for deeper layers. The dense region of squamous cell carcinoma is continuously vanishing and the intensity of the elements (in this case Ca) is approaching the level of the surrounding non-tumor tissue. A further pathological investigation is necessary so that it could prove that the tissue has not invaded in deeper layers. Moreover, a distribution of other elements can be provided when giving further information about the tumor and its progression.
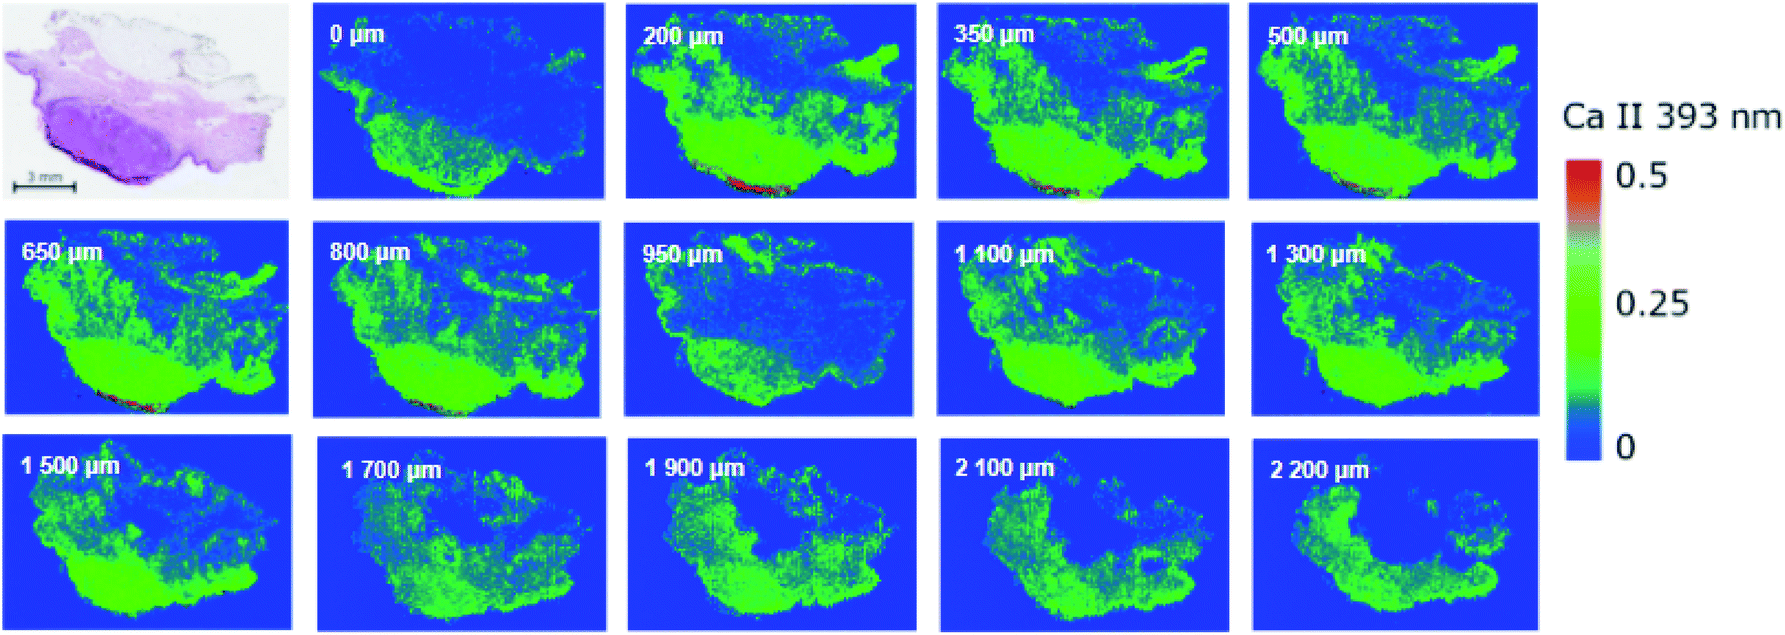 | ||
| Fig. 2 The analysis of the SCC sample (squamous cell carcinoma) depicting the histological image with H&E staining (top left), followed by a series of Ca images analyzed in individual layers with a depth step of 150 to 200 microns as indicated in the consecutive image. | ||
3.3 Imaging skin cancer
The primary aim of this work is to detect the differences in the distribution of biogenic elements in skin tumors. The elemental imaging of various skin lesions has already been proved feasible.24–26 Despite all the pioneering efforts, the evidence on the distribution of elements in skin tumors and its biologically relevant correlation remains sparse.In our case, we chose three different lesions (two malignant represented by malignant melanoma and basal cell carcinoma, and one benign represented by haemangioma) in order to demonstrate mutual differences in elemental composition. All three samples were analyzed directly in the bulk of the paraffin blocks to ascertain a sufficient amount of ablated material. The paraffin blocks were sliced between measurements with different wavelength ranges as previously stated to provide a fresh and flat surface for the laser–matter interaction and consequent laser ablation. Herein we describe the distribution of the chosen individual elements (Mg, Ca, Na, and K) in WSI (Fig. 3).
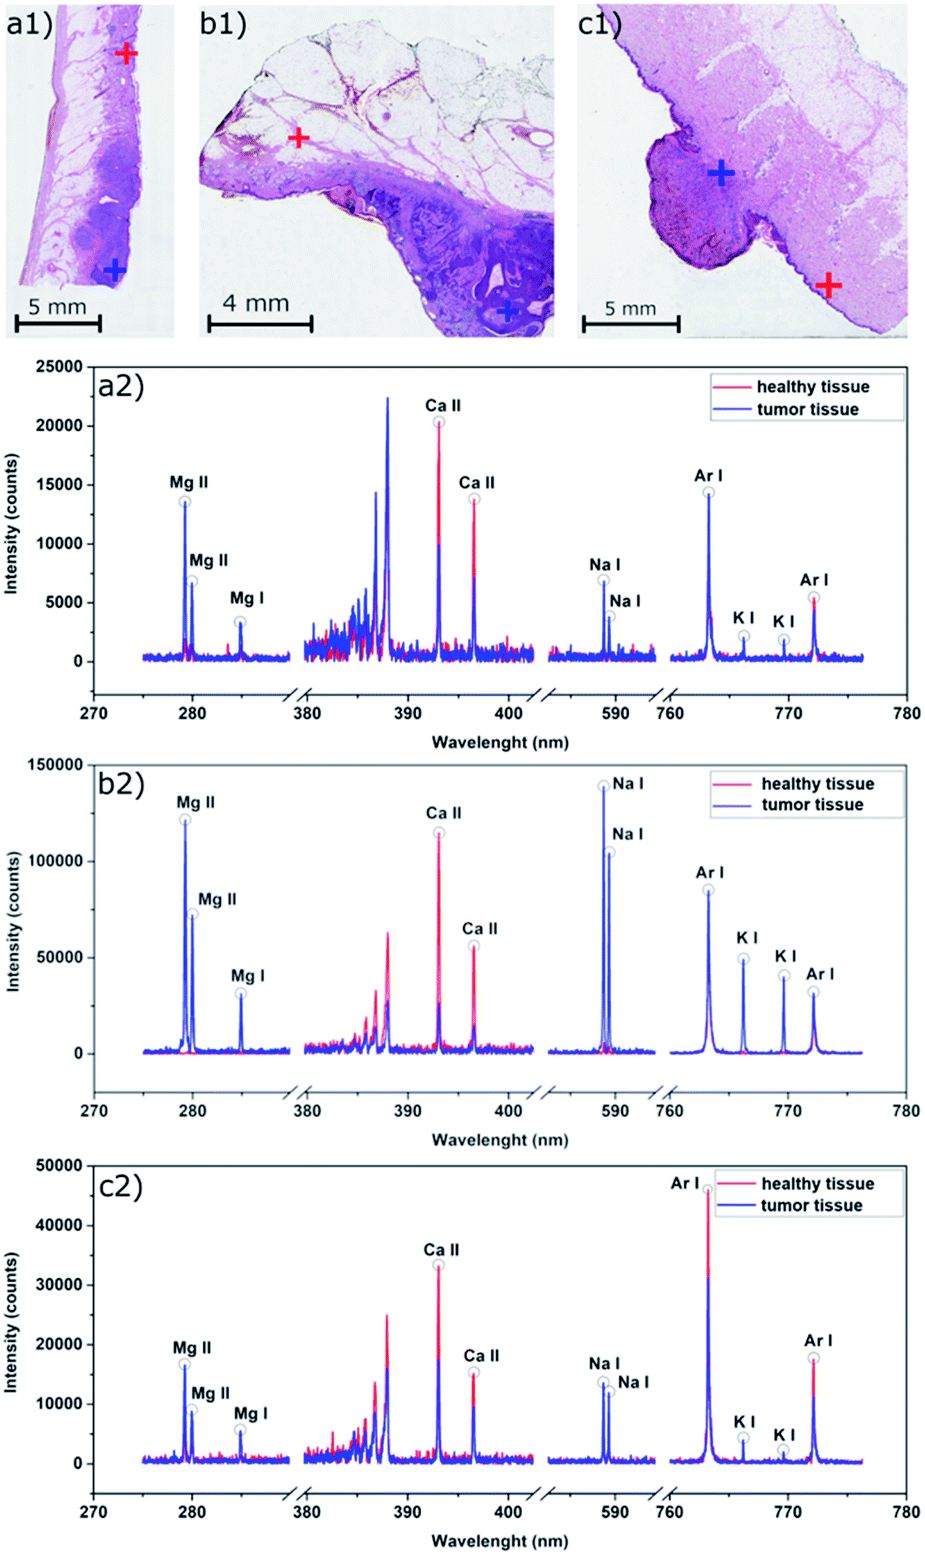 | ||
| Fig. 3 The typical spectra of (a) MM – malignant melanoma, (b) BCC – basal-cell carcinoma, and (c) HM – haemangioma samples taken from the marked spots in the histological H&E images covering the spectral range 275–775 nm. The spectral lines for elements of interest and Ar are highlighted. | ||
LIBS analysis was focused on four main biotic elements (Mg, Ca, Na, and K) which were detected using individual spectral windows of the utilized Czerny–Turner spectrometer. Each window provides a narrow spectral range.
The samples with malignant melanoma and basal cell carcinoma showed a gradient increase in the tumorous mass for Mg, K, and Na compared to the surrounding tissue which showed only a weak signal (Fig. 4). Interestingly, Ca showed the strongest signal in the adjacent tissue surrounding the mass, but not in the tumor itself. Moreover, there is an evident rise of the Ca signal in the surrounding of the tumors showing a potential calcification of the dermis. All the elements show distinct contours of the dermis within the sample beyond the tumor mass.
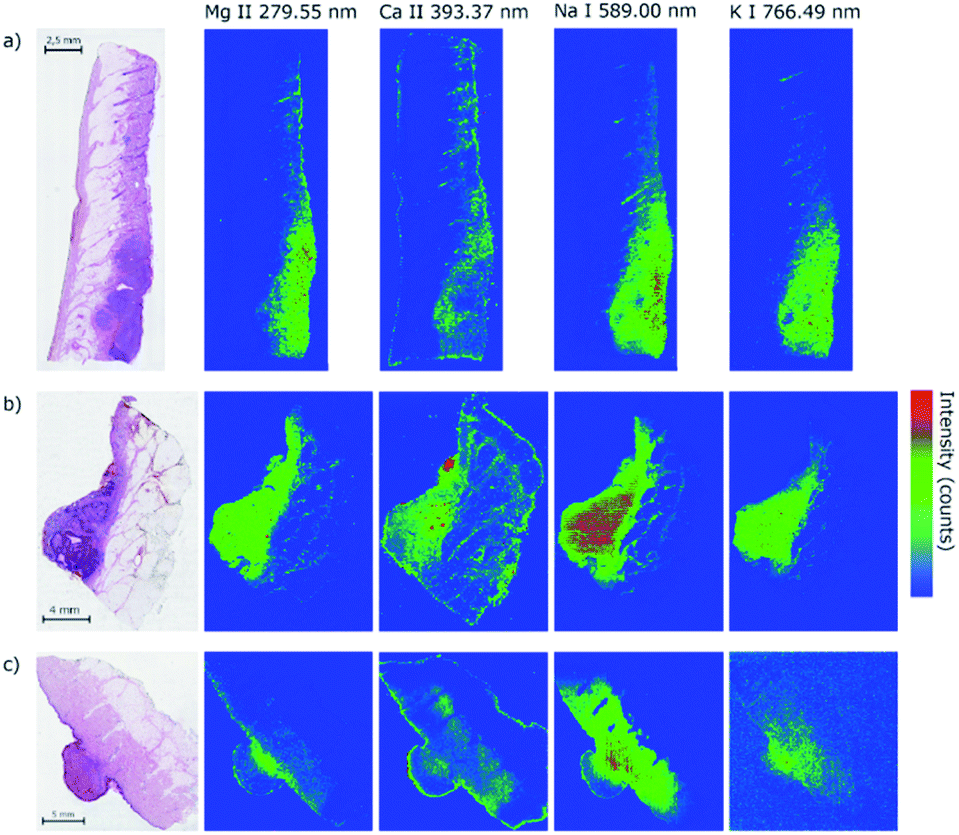 | ||
| Fig. 4 Histological H&E images complemented with LIBS elemental images of Mg, Ca, Na, and K for selected tumor samples: (a) of MM – malignant melanoma, (b) BCC – basal-cell carcinoma, and (c) HM – haemangioma. | ||
The findings of the Ca distribution for MM, BCC, HM samples seem to be similar to the former results24 where the malignant skin tumors (melanoma, squamous cell carcinoma, and Merkel cell carcinoma) were also analyzed in human samples. However, the results are in contrast to other evidenced findings21,26 where the increase of Ca in malignant melanoma in animal models was observed. In the case of hemangioma, we also observed the distribution of Ca out of the tumor. In contrast to our malignant tumors, Na, K, and Mg were present in the surrounding tissue, but not in the hemangioma. All the elements show significant changes in the distribution in the tumor mass, which requires a further investigation in terms of multivariate analysis and clustering. The abundance of monitored elements seems to be in a direct correlation with the tumor progression and the relative change of their intensity could serve as an indicator of tumor margins.
Considering also squamous cell carcinoma (Fig. 1), an opposite trend with respect to Ca intensity was seen. The Ca signal increased in the carcinoma area and was visibly higher than in the surrounding healthy tissue up to 1.5 mm deep in the sample. There was no visible change in the intensities after that, suggesting that the carcinoma size was reaching less than 1.7 mm deep from the surface.
Malignant skin tumors are commonly highly cellular, metabolically, and mitotically active lesions. The tissue contains lots of cells leading naturally to a higher number of biogenic elements in an affected area of a skin biopsy, which we declared for Na, K, and Mg. On the other hand, we cannot clarify the distribution of Ca out of the tumor in both malignant tumors and the hemangioma. To the best of our knowledge only three papers dealt with the same issue with similar results24 and with the opposite observation.21,26 The differences in the distribution of Na, Mg, and K between malignancy and benign proliferation of hemangioma might be a promising finding for future studies and clinical use to determine skin lesions' biological behavior.
3.4 Clustering
Another concern of the correct pathological examination is in robust and accurate estimation of the tumor margins. This issue is tackled using various techniques implemented in digital histopathology, including deep neural networks and other algorithms.37 Similar to the efforts in machine learning, the multivariate algorithms are of paramount interest to the processing of LIBS hyperspectral data on the WSI scale.LIBS data obtained for all three samples were individually submitted to the simple structure of a self-organizing map. The trained map was then clustered with a k-means algorithm in order to distinguish individual matrices present in each sample (Fig. 5). Considering narrow spectral ranges of measured data, the nodes of SOM were sensitive to the intensity and the shape of a single (or two) spectral line. We believe that this simple property enabled the correct and robust separation of the clusters. This is in contrast with the standard multivariate setting, where the presence of various lines is a key factor in node separation. It is noteworthy that at this point, only an unsupervised algorithm was used due to the small sample set.
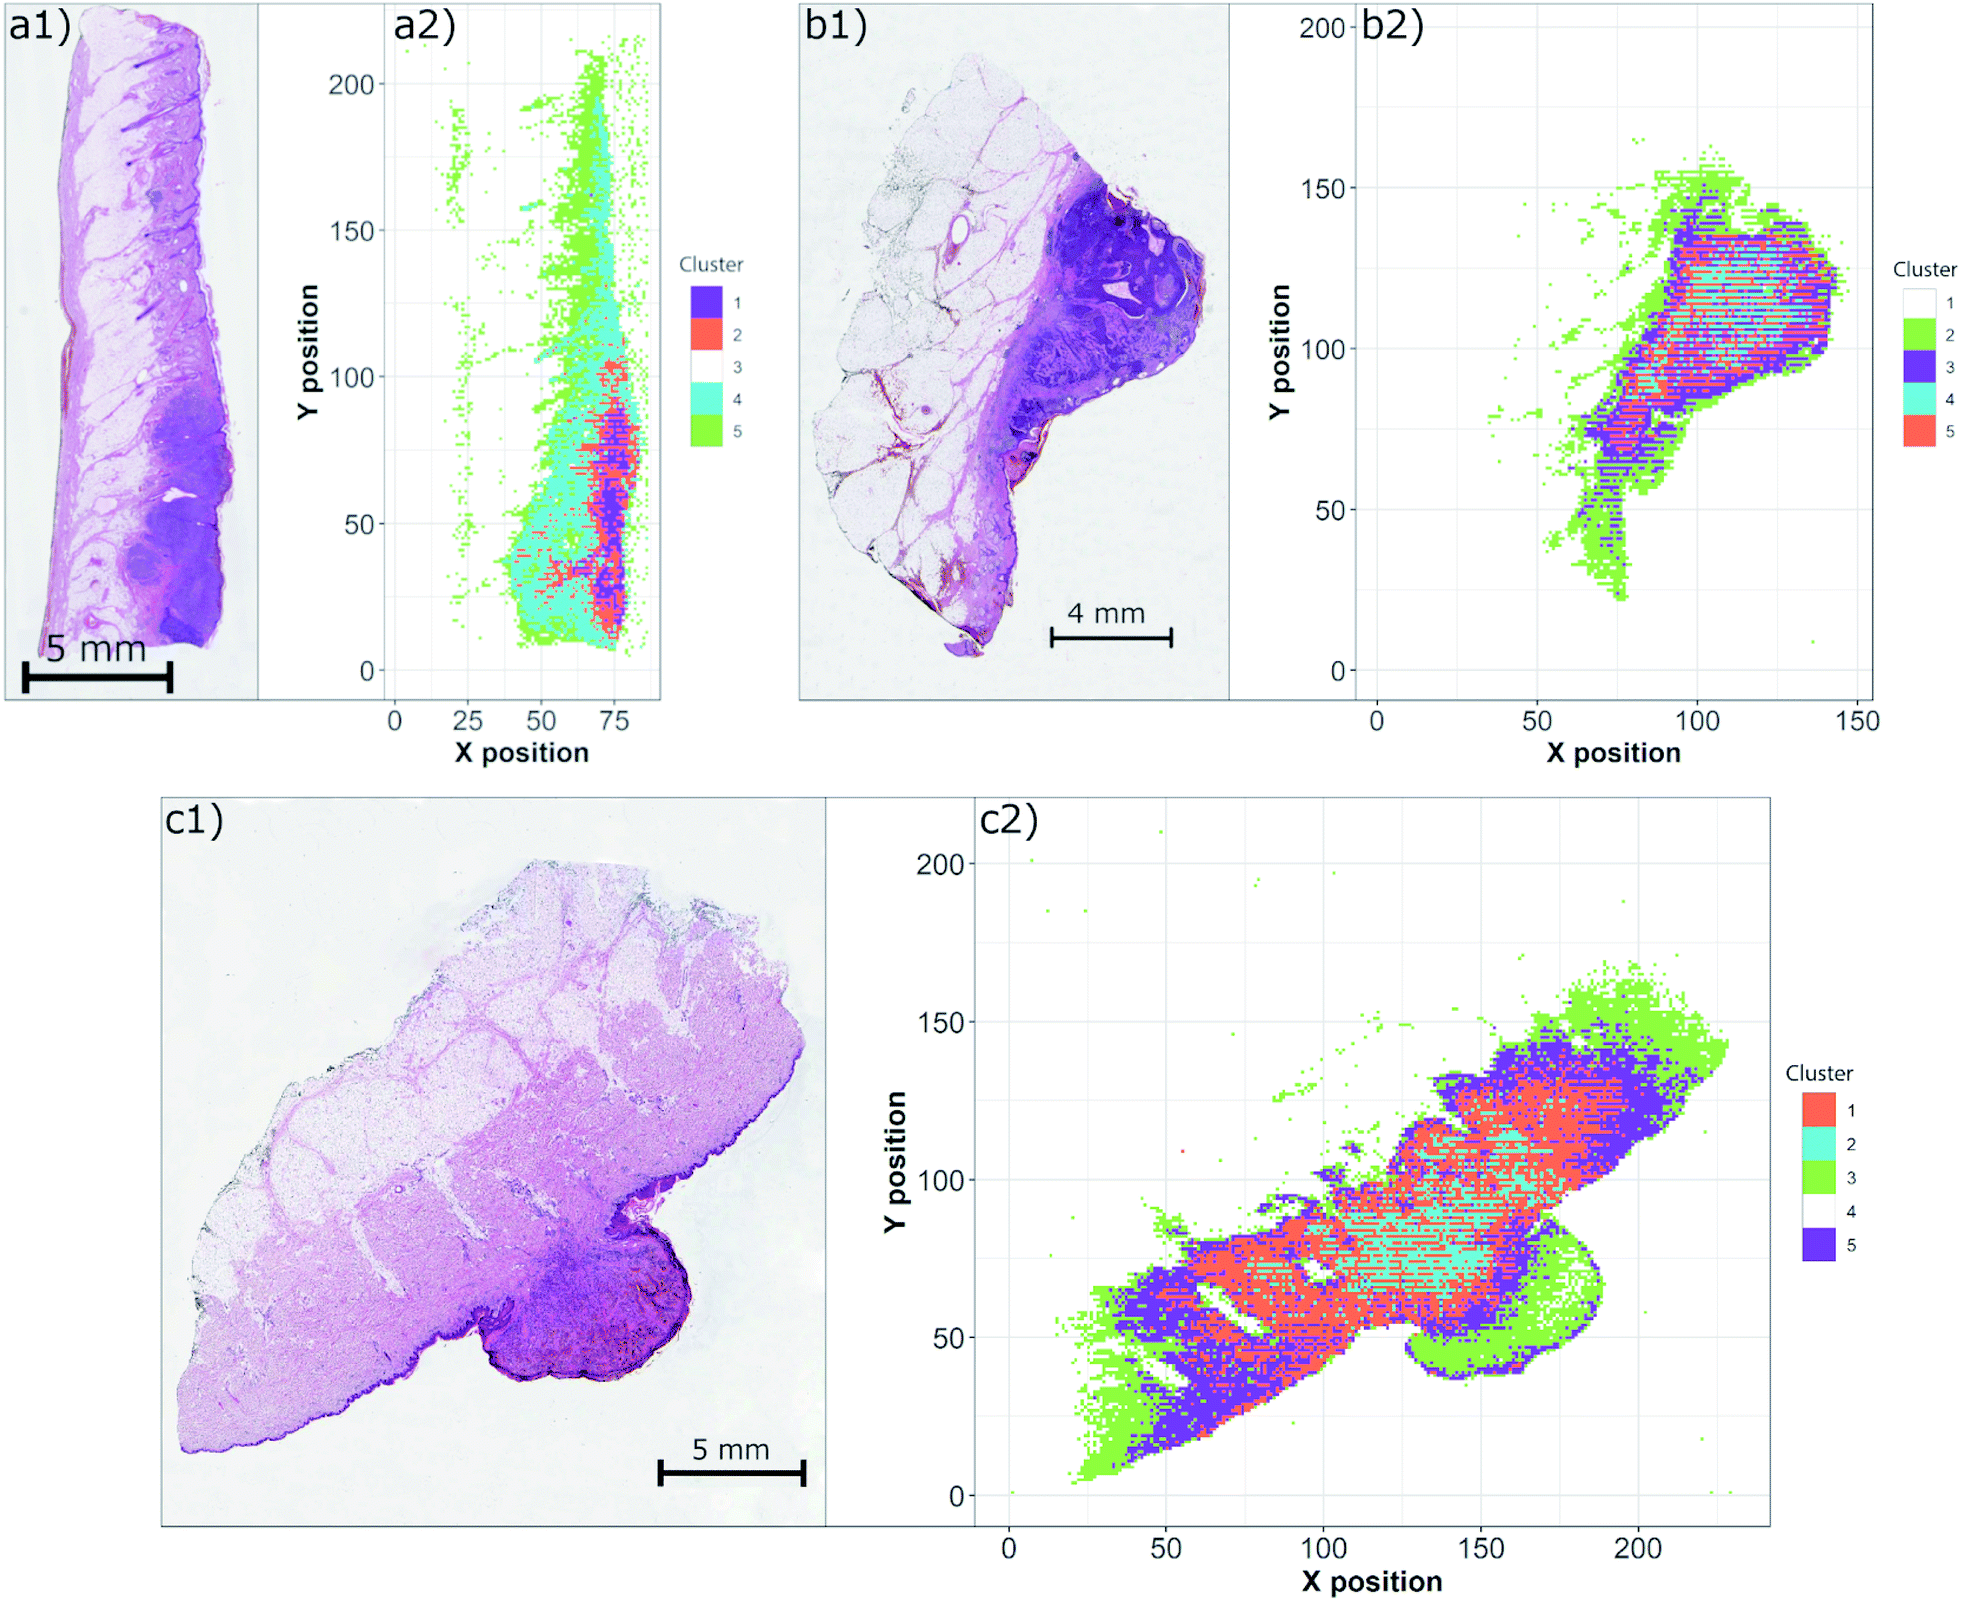 | ||
| Fig. 5 Histological H&E image and respective SOM clustering of characteristic LIBS spectra in the Na range for the selected samples: (a) MM – malignant melanoma, (b) BCC – basal-cell carcinoma, and (c) HM – haemangioma. | ||
The obtained results show a significant discrimination of each sample into individual clusters with respect to the matrices. In all cases, the paraffin medium fixing the sample was clearly separated as well as with the hypodermis. The region of the tumor is then decomposed to further clusters and the estimation of the tumor margin remains a challenge. However, the optimization of the SOM network and the number of clusters is beyond the scope of this manuscript and will be a subject of further work.
4. Conclusion
We confirmed the complementarity of LIBS with the classical histopathological routine. Advantageously, the excised tumor fixed in the paraffin block can be analyzed without any sectioning and positioning on a glass slide. This approach also enables a depth resolved analysis which results in a 3D image for understanding the tumor spread behavior and determining its in-depth boundary. Analysis of paraffin blocks proved a higher signal-to-noise ratio for all major biotic elements (Mg, Ca, Na, and K). Our results for the selected malignant skin tumors show significant differences in their mutual elemental composition which were in contrast to the benign tumors. This is a promising result suggesting that the pathological examination may be sustained also by elemental imaging. However, the spatial distribution of biotic elements varies in existing, sparse literature sources which indicates a necessity for further investigations.We showed a straightforward implementation of machine learning and self-organizing maps with k-means clustering for advanced processing of spectroscopy data. In this way, the contribution from all detected elements is considered and the differences between individual matrices within the tissue are highlighted through the cluster membership. An extensive optimization of the machine learning algorithms was beyond the scope of this work and the training of the model and number of clusters is the scope of ongoing work. Such studies must be carried out on a broader sample and data set, and in cooperation with pathologists. However, promising results indicate the potential of the implementation of SOM in the estimation of tumor margins.
Conflicts of interest
There are no conflicts to declare.Acknowledgements
The authors gratefully acknowledge the financial support by the Czech Grant Agency within the project GACR Junior (no. 20-19526Y) and by the Ministry of Education, Youth and Sports (MEYS) of the Czech Republic under the project CEITEC 2020 (no. LQ1601) and the CzechNanoLab Research Infrastructure supported by MEYS CR (no. LM2018110). JK acknowledges the support of the Brno University of Technology through grant no. FSI-S-20-6353. KK acknowledges the financial support by the grant from Charles University Grant Agency (GAUK) within the project Implementation of laser spectroscopy in skin tumor analysis (No. 1193819). The project was approved by the Ethics Committee of the University Hospital Hradec Kralove on May 3, 2018 under reference number 201805 S08P.References
- S. Keeney, H. McKenna, P. Fleming and S. McIlfatrick, Attitudes, knowledge and behaviours with regard to skin cancer: a literature review, Eur. J. Oncol. Nurs., 2009, 13, 29–35, DOI:10.1016/j.ejon.2008.11.004.
- M. C. F. Simões, J. J. S. Sousa and A. A. C. C. Pais, Skin cancer and new treatment perspectives: a review, Cancer Lett, 2015, 357, 8–42, DOI:10.1016/j.canlet.2014.11.001.
- K. G. Paulson, M. C. Lahman, A. G. Chapuis and I. Brownell, Immunotherapy for skin cancer, Int. Immunol., 2019, 31, 465–475, DOI:10.1093/intimm/dxz012.
- A. Mohammadpour, M. Derakhshan, H. Darabi, P. Hedayat and M. Momeni, Melanoma: where we are and where we go, J. Cell. Physiol., 2019, 234, 3307–3320, DOI:10.1002/jcp.27286.
- R. McRae, P. Bagchi, S. Sumalekshmy and C. J. Fahrni, In Situ Imaging of Metals in Cells and Tissues, Chem. Rev., 2009, 109, 4780–4827, DOI:10.1021/cr900223a.
- J. S. Becker, M. Zoriy, A. Matusch, B. Wu, D. Salber, C. Palm and J. S. Becker, Bioimaging of metals by laser ablation inductively coupled plasma mass spectrometry (LA-ICP-MS), Mass Spectrom. Rev., 2010, 29, 156–175, DOI:10.1002/mas.20239.
- J. Sabine Becker, Imaging of metals in biological tissue by laser ablation inductively coupled plasma mass spectrometry (LA-ICP-MS): state of the art and future developments, J. Mass Spectrom., 2013, 48, 255–268, DOI:10.1002/jms.3168.
- B. Wu and J. S. Becker, Imaging techniques for elements and element species in plant science, Metallomics, 2012, 4, 403, 10.1039/c2mt00002d.
- J. S. Becker, M. Zoriy, B. Wu, A. Matusch and J. S. Becker, Imaging of essential and toxic elements in biological tissues by LA-ICP-MS, J. Anal. At. Spectrom., 2008, 23, 1275, 10.1039/b805228j.
- J. S. Becker, A. Matusch and B. Wu, Bioimaging mass spectrometry of trace elements – recent advance and applications of LA-ICP-MS: a review, Anal. Chim. Acta, 2014, 835, 1–18, DOI:10.1016/j.aca.2014.04.048.
- I. Konz, B. Fernández, M. L. Fernández, R. Pereiro and A. Sanz-Medel, Laser ablation ICP-MS for quantitative biomedical applications, Anal. Bioanal. Chem., 2012, 403, 2113–2125, DOI:10.1007/s00216-012-6023-6.
- R. González de Vega, M. L. Fernández-Sánchez, J. Pisonero, N. Eiró, F. J. Vizoso and A. Sanz-Medel, Quantitative bioimaging of Ca, Fe, Cu and Zn in breast cancer tissues by LA-ICP-MS, J. Anal. At. Spectrom., 2017, 32, 671–677, 10.1039/C6JA00390G.
- A. Limbeck, L. Brunnbauer, H. Lohninger, P. Pořízka, P. Modlitbová, J. Kaiser, P. Janovszky, A. Kéri and G. Galbács, Methodology and applications of elemental mapping by laser induced breakdown spectroscopy, Anal. Chim. Acta, 2021, 1147, 72–98, DOI:10.1016/j.aca.2020.12.054.
- V. Motto-Ros, S. Moncayo, C. Fabre and B. Busser, LIBS imaging applications, in Laser-Induced Breakdown Spectroscopy, Elsevier, 2020, pp. 329–346 Search PubMed.
- J. Kaiser, K. Novotný, M. Z. Martin, A. Hrdlička, R. Malina, M. Hartl, V. Adam and R. Kizek, Trace elemental analysis by laser-induced breakdown spectroscopy—biological applications, Surf. Sci. Rep., 2012, 67, 233–243, DOI:10.1016/j.surfrep.2012.09.001.
- P. Modlitbová, P. Pořízka and J. Kaiser, Laser-induced breakdown spectroscopy as a promising tool in the elemental bioimaging of plant tissues, TrAC Trends Anal. Chem., 2020, 122, 115729, DOI:10.1016/j.trac.2019.115729.
- L. Jolivet, M. Leprince, S. Moncayo, L. Sorbier, C.-P. Lienemann and V. Motto-Ros, Review of the recent advances and applications of LIBS-based imaging, Spectrochim. Acta, Part B, 2019, 151, 41–53, DOI:10.1016/j.sab.2018.11.008.
- B. Busser, S. Moncayo, J.-L. Coll, L. Sancey and V. Motto-Ros, Elemental imaging using laser-induced breakdown spectroscopy: a new and promising approach for biological and medical applications, Coord. Chem. Rev., 2018, 358, 70–79, DOI:10.1016/j.ccr.2017.12.006.
- P. Modlitbová, P. Pořízka and J. Kaiser, Laser-induced breakdown spectroscopy as a promising tool in the elemental bioimaging of plant tissues, TrAC Trends Anal. Chem., 2020, 122, 115729, DOI:10.1016/j.trac.2019.115729.
- R. Gaudiuso, N. Melikechi, Z. A. Abdel-Salam, M. A. Harith, V. Palleschi, V. Motto-Ros and B. Busser, Laser-induced breakdown spectroscopy for human and animal health: a review, Spectrochim. Acta, Part B, 2019, 152, 123–148 CrossRef CAS.
- J. H. Han, Y. Moon, J. J. Lee, S. Choi, Y.-C. Kim and S. Jeong, Differentiation of cutaneous melanoma from surrounding skin using laser-induced breakdown spectroscopy, Biomed. Opt. Express, 2016, 7, 57, DOI:10.1364/BOE.7.000057.
- M. Bonta, J. J. Gonzalez, C. D. Quarles, R. E. Russo, B. Hegedus and A. Limbeck, Elemental mapping of biological samples by the combined use of LIBS and LA-ICP-MS, J. Anal. At. Spectrom., 2016, 31, 252–258, 10.1039/C5JA00287G.
- M. Bonta, S. Török, B. Döme and A. Limbeck, Tandem LA-LIBS coupled to ICP-MS for comprehensive analysis of tumor samples, Spectrosc., 2017, 42–46 CAS.
- S. Moncayo, F. Trichard, B. Busser, M. Sabatier-Vincent, F. Pelascini, N. Pinel, I. Templier, J. Charles, L. Sancey and V. Motto-Ros, Multi-elemental imaging of paraffin-embedded human samples by laser-induced breakdown spectroscopy, Spectrochim. Acta, Part B, 2017, 133, 40–44, DOI:10.1016/j.sab.2017.04.013.
- B. Busser, S. Moncayo, F. Trichard, V. Bonneterre, N. Pinel, F. Pelascini, P. Dugourd, J. L. Coll, M. D'Incan and J. Charles, et al., Characterization of foreign materials in paraffin-embedded pathological specimens using in situ multi-elemental imaging with laser spectroscopy, Mod. Pathol., 2018, 31, 378–384, DOI:10.1038/modpathol.2017.152.
- Y. Moon, J. H. Han, J. Choi, S. Shin, Y.-C. Kim and S. Jeong, Mapping of cutaneous melanoma by femtosecond laser-induced breakdown spectroscopy, J. Biomed. Opt., 2018, 24, 1, DOI:10.1117/1.JBO.24.3.031011.
- S. Moncayo, L. Duponchel, N. Mousavipak, G. Panczer, F. Trichard, B. Bousquet, F. Pelascini and V. Motto-Ros, Exploration of megapixel hyperspectral LIBS images using principal component analysis, J. Anal. At. Spectrom., 2018, 33, 210–220, 10.1039/C7JA00398F.
- S. Pagnotta, E. Grifoni, S. Legnaioli, M. Lezzerini, G. Lorenzetti and V. Palleschi, Comparison of brass alloys composition by laser-induced breakdown spectroscopy and self-organizing maps, Spectrochim. Acta, Part B, 2015, 103–104, 70–75, DOI:10.1016/j.sab.2014.11.008.
- J. Klus, P. Pořízka, D. Prochazka, P. Mikysek, J. Novotný, K. Novotný, M. Slobodník and J. Kaiser, Application of self-organizing maps to the study of U-Zr-Ti-Nb distribution in sandstone-hosted uranium ores, Spectrochim. Acta, Part B, 2017, 131, 66–73, DOI:10.1016/j.sab.2017.03.008.
- S. C. Jantzi, V. Motto-Ros, F. Trichard, Y. Markushin, N. Melikechi and A. De Giacomo, Sample treatment and preparation for laser-induced breakdown spectroscopy, Spectrochim. Acta, Part B, 2016, 115, 52–63, DOI:10.1016/j.sab.2015.11.002.
- M. Bonta, S. Török, B. Hegedus, B. Döme and A. Limbeck, A comparison of sample preparation strategies for biological tissues and subsequent trace element analysis using LA-ICP-MS, Anal. Bioanal. Chem., 2017, 409, 1805–1814, DOI:10.1007/s00216-016-0124-6.
- S. Kunjachan, A. Detappe, R. Kumar, T. Ireland, L. Cameron, D. E. Biancur, V. Motto-Ros, L. Sancey, S. Sridhar and G. M. Makrigiorgos, et al., Nanoparticle Mediated Tumor Vascular Disruption: A Novel Strategy in Radiation Therapy, Nano Lett., 2015, 15, 7488–7496, DOI:10.1021/acs.nanolett.5b03073.
- A. Detappe, S. Kunjachan, L. Sancey, V. Motto-Ros, D. Biancur, P. Drane, R. Guieze, G. M. Makrigiorgos, O. Tillement and R. Langer, et al., Advanced multimodal nanoparticles delay tumor progression with clinical radiation therapy, J. Control. Release, 2016, 238, 103–113, DOI:10.1016/j.jconrel.2016.07.021.
- H. Wei, Z. Zhao, Q. Lin and Y. Duan, Study on the Molecular Mechanisms Against Human Breast Cancer from Insight of Elemental Distribution in Tissue Based on Laser-Induced Breakdown Spectroscopy (LIBS), Biol. Trace Elem. Res., 2021, 199(5), 1686–1692, DOI:10.1007/s12011-020-02292-8.
- A. Šindelářová, P. Pořízka, P. Modlitbová, L. Vrlíková, K. Kiss, M. Kaška, D. Prochazka, J. Vrábel, M. Buchtová and J. Kaiser, Methodology for the Implementation of Internal Standard to Laser-Induced Breakdown Spectroscopy Analysis of Soft Tissues, Sensors, 2021, 21, 900, DOI:10.3390/s21030900.
- Y. Gimenez, B. Busser, F. Trichard, A. Kulesza, J. M. Laurent, V. Zaun, F. Lux, J. M. Benoit, G. Panczer and P. Dugourd, et al., 3D Imaging of Nanoparticle Distribution in Biological Tissue by Laser-Induced Breakdown Spectroscopy, Sci. Rep., 2016, 6, 1–9, DOI:10.1038/srep29936.
- G. Litjens, T. Kooi, B. E. Bejnordi, A. A. A. Setio, F. Ciompi, M. Ghafoorian, J. A. W. M. van der Laak, B. van Ginneken and C. I. Sánchez, A survey on deep learning in medical image analysis, Med. Image Anal., 2017, 42, 60–88, DOI:10.1016/j.media.2017.07.005.
| This journal is © The Royal Society of Chemistry 2021 |