 Open Access Article
Crosstalk effects of the surface layers of metallic samples on laser-induced breakdown spectroscopy measurements
Christoph
Meinhardt
 ,
Reinhard
Noll
 * and
Cord
Fricke-Begemann

Fraunhofer Institute for Laser Technology, Steinbachst. 15, 52074 Aachen, Germany. E-mail: christoph.meinhardt@ilt.fraunhofer.de
First published on 25th February 2021
Abstract
Material ablation driven by focused laser pulses is an important aspect of laser-induced breakdown spectroscopy (LIBS). It has frequently been used to ablate non-representative layers from the surface or to generate analytic depth profiles of samples. In this paper we discuss the crosstalk effects of the locally ablated surface on the LIBS measurement of the underlying bulk material. As a measuring object, a model artefact is chosen consisting of an iron-free brass bulk sample on which a steel plate with a thickness of 500 μm was brought in close contact. This steel sheet acts as a surrogate for a non-representative surface layer. It is shown by LIBS measurements and cross polish methods that an indirect interaction between the expanding plasma originating from the substrate and the surface layer at the crater walls as well as a recasting of the ablated material from the steel plate have a notable influence on LIBS measurements of the underlying bulk sample. By a two-step ablation sequence crosstalk effects can be reduced to levels equivalent to those persisting for the model artefact without the steel sheet.
1. Introduction
Material ablation driven by focused laser pulses is an important aspect of laser-induced breakdown spectroscopy (LIBS). It has frequently been used to ablate non-representative layers from the surface or to generate analytic depth profiles of samples.1–10 Even though crosstalk effects between the plasma and its local environment were reported more than 10 years ago,11 to the authors' knowledge, no work regarded the impact of these crosstalk effects quantitatively. In the following the focus is layed on metallic samples, whose bulk composition shall be measured.The quantitative analysis of metals with LIBS is a promising application field in the metal producing and processing industry to monitor production processes and to identify metal grades in a batch-bound production. Since LIBS is a near-surface probing method, non-representative surface layers disturb the analytical information from the underlying bulk material strived for. Especially for inline measurements – the predestinated application field for LIBS – non-representative surface layers have to be removed first to get access to the bulk material. Such surface layers are formed due to oxidation processes of the metal with the surrounding atmosphere, during processing of billets – as e.g. in a rolling mill, by segregation effects but as well due to heating cycles in furnaces or extended storage times in stockyards. Thicknesses of such scale layers range up to several hundreds of micrometers. Their local removal by mechanical means, like grinding, is laborious and would cause extended stopping times of the measuring object in a production line. It is obvious that a potential solution is the local ablation of the surface layer by the laser beam itself. To this end, a LIBS method and setup were developed and studied to analyse scaled steel blooms.12,13
Naturally forming surface layers of metal workpieces – like the above stated scale layers – cannot be well defined in their chemical composition, geometric structure and thickness. They depend on the whole process history of a processed metal piece, which would hinder a systematic study. Hence in this work we took alternatively a model artefact as a surrogate consisting of a metallic bulk sample of known composition and a thin steel sheet, which has been put in close contact to the bulk substrate forming a defined surface layer with a different composition. By this approach of a composite artefact the surface layer can be removed easily by taking away the steel sheet, thus allowing to study cross talk effects systematically. As a bulk sample a brass alloy was chosen to simplify the identification of displaced matrix parts in the studied cross-section polishes of craters (significant differences in elemental composition, different colors of cross-sections for optical microscopy).
2. Experimental
The experimental setup and the data acquisition procedure are described elsewhere.12 They are briefly summarized here, together with some minor changes. The ablation step and LIBS measurements are performed with the same Nd:YAG laser source, which can be operated in different pulse modes. For the ablation step, the cleaning mode (CM, 60 Hz) is used consisting of a burst of pulses with mean interpulse separations (Δt) of ≈10 μs and pulse widths of a few hundred nanoseconds. Each burst consists of 10 pulses with an energy of about 66 mJ each. For the LIBS measurement the double pulse only mode (DPO, 100 Hz) is deployed with Δt = 2 μs and a peak radiant flux of 7–10 MW. In the DPO each flashlamp ignition emits a double pulse with an energy of 2 × 200 mJ, and pulse widths are about 30 ns. In this work, the laser beam is focused on the sample by a plano-convex lens with a focal length of f = 286 mm. The beam waist is located inside the sample at Δs ≈ +5 mm (positive sign follows the notations stated in Anal. Bioanal. Chem., 2006, 385, 214–218).During the ablation phase, the laser spot is moved in concentric circles at a nearly constant track speed of about 5 mm s−1 around a central pivot point, which is the later LIBS measurement position. For a repetition rate of 60 Hz for the CM mode this corresponds to a distance of neighbouring focal spots of 80 μm. For a focal spot diameter of 300 μm this results in a high degree of overlap for consecutive irradiated spots. The geometry of the ablated cavity is the result of the pattern of laser spot displacements during the ablation phase. The pattern is defined by a time series of varying radii R of these circles, and details will be explained later. During the LIBS measurement in DPO, the laser beam is not displaced (R = 0). The plasma is observed using a fibre coupled echelle spectrometer (ESA 4000, LLA Instruments14). Each readout represents the emission of 15 plasma events which are accumulated on the detector of the spectrometer. Line ratios of atomic emission lines of elements i, r are denoted in the following by ![[Q with combining tilde]](https://www.rsc.org/images/entities/i_char_0051_0303.gif) i = Ĩi/Ĩr, where Ĩi,r is the accumulated background-corrected element signal of the 15 plasma events for the elements i, r, respectively. The background to be subtracted from the measured (denoted by the superscript m) element signal
i = Ĩi/Ĩr, where Ĩi,r is the accumulated background-corrected element signal of the 15 plasma events for the elements i, r, respectively. The background to be subtracted from the measured (denoted by the superscript m) element signal  is calculated by pixel groups on each side of the spectral line i or r. If there is no significant contribution by the spectral line i, all pixels scatter around similar values, so the background correction may lead to negative intensities for Ĩi and thus for
 ![[Q with combining tilde]](https://www.rsc.org/images/entities/i_char_0051_0303.gif) i (see Fig. 7, right).
i (see Fig. 7, right).
3. Samples
Most samples of this work consist of plane, stainless steel sheets (steel grade 1.4301), which were fixed on a plane metallic substrate. The thin steel sheet (ST, thickness 0.5–1 mm) is chosen to simulate the presence of a non-representative surface layer. In most cases, the steel sheet was glued to the substrate. For some experiments both parts were clamped mechanically. As a substrate material, a plane iron-free brass alloy (BR) has been used. Without any attachments to its surface, this BR material is denoted as the zero sample – in terms of a vanishing iron content – in the following. A plane brass scrap piece with an iron content of 0.42 m.-% was used as a further reference material.4. Results and discussion
4.1 Reasons for crosstalk effects
Surface layers can influence the result of the LIBS measurement of the substrate basically in the following three ways:(i) Direct interaction between the laser beam and surface layer,
(ii) Indirect interaction between the expanding plasma originating from the substrate and the surface layer at the crater walls,
(iii) Recasting layers being present after the ablation step, contaminating the substrate (bulk) material underneath the surface layer.
Reason (i) has to be avoided by a proper guiding of the ablation phase. If the aperture of the crater in the surface layer exceeds sufficiently the diameter of the laser spot, a direct interaction between the laser beam and surface layer is reduced to a large extent or even avoided completely. In that case, the LIBS result can be influenced by the effects (ii) and/or (iii).
These two cases need to be regarded separately. To measure the indirect interaction – case (ii) – a 0.5 mm thick ST was attached at a fixed position in front of the measuring lance (see ref. 12) before placing the BR. After the ablation phase (Rmax = 0.75 mm), the BR was shifted laterally to avoid any contamination of the bulk material by recast effects (i.e. case (iii)), see Fig. 1(a). After shifting the BR, the DPO measurement phase was performed inside the previously ablated cavity through the ST on an unaffected part of the BR. The steps, shifting the BR and performing a LIBS measurement, were repeated several times. Fig. 2(a) shows the crater of the DPO measurement inside of the perforated ST. There is no geometric overlap between the DPO crater in the BR and the crater aperture in the ST. Therefore we can expect that there was no direct interaction between the laser beam during the DPO phase and the ST.
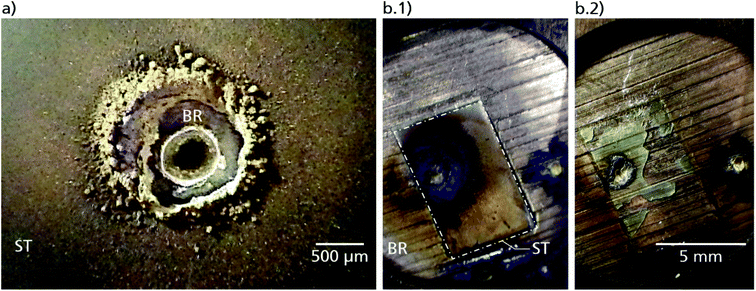 | ||
| Fig. 2 (a) Crater caused by the DPO measurement inside of a previously pierced steel sheet (ST, see Fig. 1(a)). The brass block (BR), i.e. the substrate, was shifted prior to the measurement to place an unaffected area underneath the generated hole in the ST. (b.1) ST mounted on the BR. The contour of the ST is marked by a dash-dotted line; (b.2) as (b.1) after removal of the ST. The thickness of the ST is 0.5 mm. | ||
In another experiment, the influence of the recast effects, case (iii), was quantified by the following procedure. First, the steel sheet ST was glued on the BR and the cleaning step was executed as usual in the CM mode, see Fig. 1(b.1) and 2(b.1) There is a gap of a few micrometers between the ST and BR which was filled with glue (glue was used in order to allow for cross polishing). However, in the cross-section polish images, see Fig. 5, this gap appears to be covered with the recast material. Therefore, we neglect a possible influence from the organic glue material on the LIBS measurements.
Before performing the actual measurement in the DPO mode, the pierced ST was removed, see Fig. 1(b.2) and 2(b.2). In Fig. 2(b.2) the metallic shining crater (middle, left) is surrounded by residues of the glue forming a kind of flow pattern. Then the DPO measurement was performed. In the real application case, the CM cleaning step and the DPO measurement are performed subsequently without any manipulation of the sample. Therefore, this operational procedure is called in the following the standard sequence.
Fig. 3 shows exemplarily excerpts of two accumulated spectra, each comprising 15 consecutive plasma events in the wavelength interval of 281.8–294.3 nm, taken at the beginning and at the end of the measurement phase of a standard sequence, respectively. The measurement phase began directly after the steel sheet was pierced by the laser in the CM. The spectrum which had been read out first (solid line) contains notably more spectral lines than the last one (dashed line) which basically contains one copper line only in the shown range. Especially the iron line Fe 293.69 nm vanishes, while the copper line Cu 282.44 nm remains.
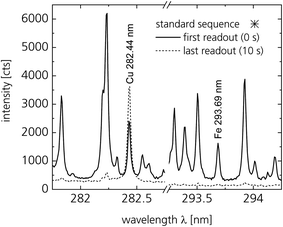 | ||
Fig. 3 Accumulated spectra of 15 plasma events in the wavelength interval of 281.8–294.3 nm measured in the standard sequence (the star-shaped data point is used here to indicate the relation to the data points shown in Fig. 4, right, for the standard sequence). Marked lines are used to determine the line ratio ![[Q with combining tilde]](https://www.rsc.org/images/entities/i_char_0051_0303.gif) Fe. The spectra were measured in the DPO mode after a preceding CM ablation phase. Fe. The spectra were measured in the DPO mode after a preceding CM ablation phase. | ||
All spectra like those shown in Fig. 3 are evaluated as a function of the measuring time from 0 to 10 s for each experiment as shown in Fig. 1(a) and (b) and the standard sequence. Fig. 4 shows the temporal evolution of the iron signal ![[Q with combining tilde]](https://www.rsc.org/images/entities/i_char_0051_0303.gif) Fe defined as the ratio of the intensity of the iron line at 293.69 nm to the intensity of the copper line at 282.44 nm (see Fig. 3). The ratio
Fe defined as the ratio of the intensity of the iron line at 293.69 nm to the intensity of the copper line at 282.44 nm (see Fig. 3). The ratio ![[Q with combining tilde]](https://www.rsc.org/images/entities/i_char_0051_0303.gif) Fe decreases during the LIBS measurements. After the first measurement on a fresh BR spot (shift 1), the BR was moved to a new position and the LIBS measurement was repeated (shift 2, shift 3). For the latter a similar trend for
Fe decreases during the LIBS measurements. After the first measurement on a fresh BR spot (shift 1), the BR was moved to a new position and the LIBS measurement was repeated (shift 2, shift 3). For the latter a similar trend for ![[Q with combining tilde]](https://www.rsc.org/images/entities/i_char_0051_0303.gif) Fe is observed, but the values are slightly reduced, compared to the first measurement, see Fig. 4, left.
Fe is observed, but the values are slightly reduced, compared to the first measurement, see Fig. 4, left.
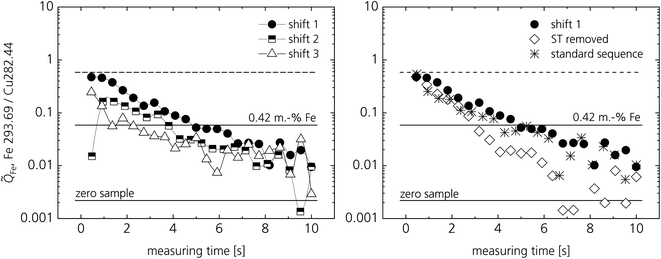 | ||
Fig. 4 (Left) Line ratio ![[Q with combining tilde]](https://www.rsc.org/images/entities/i_char_0051_0303.gif) Fe for three subsequent DPO measurements on the BR (zero sample) through a previously pierced steel sheet. Prior to each measurement the BR was shifted, to ensure that the beam is focused on an iron-free brass surface. (Right) DPO measurements after different pre-treatments. Circular data points: measurements after one shift (shift 1), same data as in the left chart. Diamonds: steel sheet pierced in the CM and entirely removed prior to the DPO measurement (see Fig. 1 and 2(b.2)). Stars: standard sequence with CM ablation and subsequent DPO measurement without further changes (ST and BR stay fixed to each other). Horizontal lines: see text. Fe for three subsequent DPO measurements on the BR (zero sample) through a previously pierced steel sheet. Prior to each measurement the BR was shifted, to ensure that the beam is focused on an iron-free brass surface. (Right) DPO measurements after different pre-treatments. Circular data points: measurements after one shift (shift 1), same data as in the left chart. Diamonds: steel sheet pierced in the CM and entirely removed prior to the DPO measurement (see Fig. 1 and 2(b.2)). Stars: standard sequence with CM ablation and subsequent DPO measurement without further changes (ST and BR stay fixed to each other). Horizontal lines: see text. | ||
The solid horizontal lines shown in Fig. 4 refer to the average signals of ![[Q with combining tilde]](https://www.rsc.org/images/entities/i_char_0051_0303.gif) Fe for homogeneous samples, i.e. for bulk samples without a different surface layer. In particular we used a zero sample with virtually no iron content (BR) and a brass sample with 0.42 m.-% Fe. The dashed line represents the intensity ratio of the latter sample multiplied by 10.
Fe for homogeneous samples, i.e. for bulk samples without a different surface layer. In particular we used a zero sample with virtually no iron content (BR) and a brass sample with 0.42 m.-% Fe. The dashed line represents the intensity ratio of the latter sample multiplied by 10.
If the pierced steel sheet is removed (see Fig. 2(b.2)) – see diamond symbols in Fig. 4, right – the initial signal is similar as if a pure substrate was measured through a pierced sheet (solid circles). However, the signal drops faster during the 10 seconds of the measurement.
Even though recast effects and indirect interaction are expected to occur simultaneously in the standard sequence, its ![[Q with combining tilde]](https://www.rsc.org/images/entities/i_char_0051_0303.gif) Fe appears to be quite close or even slightly lower than if the indirect interaction is measured separately, see circular symbols. This could be explained by the different shapes of the sample surface at the beginning of the DPO phase. After a standard sequence a crater has formed in the BR which might keep the plasma away from the steel sheet. If the BR is shifted to a new position, the BR surface is flat, so the plasma can expand more freely towards the crater walls without being pointed to the outside like from a muzzle.
Fe appears to be quite close or even slightly lower than if the indirect interaction is measured separately, see circular symbols. This could be explained by the different shapes of the sample surface at the beginning of the DPO phase. After a standard sequence a crater has formed in the BR which might keep the plasma away from the steel sheet. If the BR is shifted to a new position, the BR surface is flat, so the plasma can expand more freely towards the crater walls without being pointed to the outside like from a muzzle.
4.2 Recast layers in the pictures of cross-section polishes
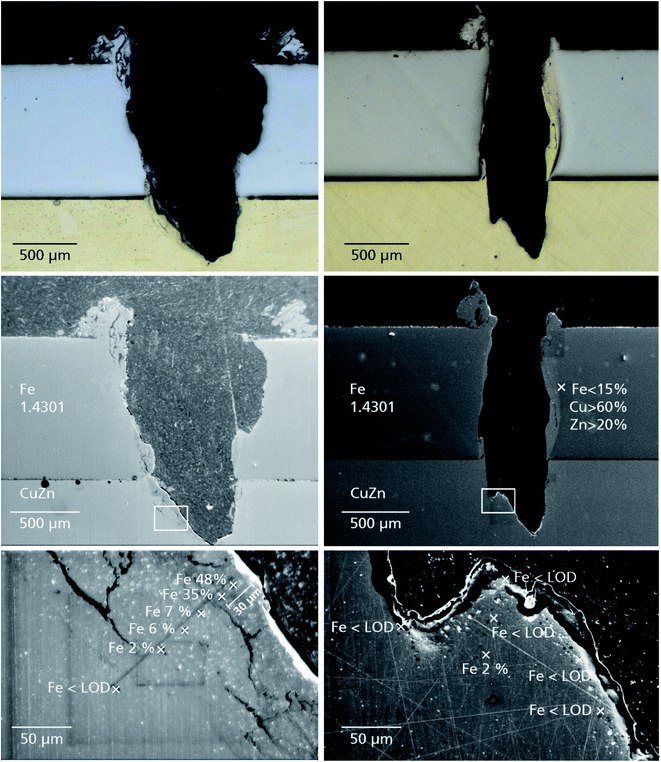
The formation of layers by recasting effects is a well-known issue for many laser ablation techniques.15Fig. 5 shows the pictures of the cross-section polishes of two craters. The wide one, left column, was ablated with a lateral displacement of the laser spot by 0.54 mm, and the narrow one in the right column was ablated without any displacement of the laser beam. Both craters have been ablated using the CM. The samples consist of a brass substrate on which a 1 mm steel sheet has been put.The samples are investigated both by optical microscopy and by scanning electron microscopy–energy-dispersive X-ray spectroscopy (SEM–EDX). At the bottom of the wide crater, there is a notable layer of recast steel. This layer is visible in the microscopy image (top, left) and its composition has been verified by SEM–EDX, see Fig. 5, middle and bottom, left. At the narrow crater, which was ablated without a displacement of the beam (R = 0), there is no recast layer at the crater bottom in the brass substrate, neither in the optical image (top, right) nor in the SEM images and SEM–EDX measurements (middle and bottom, right). Instead, the cavity through the steel sheet is covered by a recast brass layer.
The previous experiments have shown that recast layers may play an important role in LIBS measurements and there is an indirect interaction between the laser beam and the material of the crater walls via the generated material cloud and the expanding plasma. To minimize the error caused by these effects, an improved ablation scheme is proposed, see Fig. 6. It should be noted, that a crater ablated without displacement is too narrow for an actual LIBS measurement. If a plasma is ignited inside this cavity a strong influence by the geometric confinement is expected.
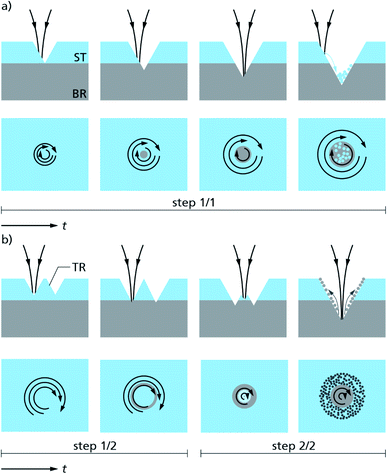 | ||
| Fig. 6 Sketches of the cross-section and top view of the measuring object (see Fig. 1) for different ablation schemes: (a) one-step ablation and (b) two-step ablation. TR trench. Circular arrows indicate schematically the scan trajectories of the laser beam in the top views. Material of the ST is shown in light blue, and the material of the BR in grey. | ||
Fig. 6(a) shows schematically an ablation sequence (cross section and top view), where the laser spot follows a time series of concentric circles with varying radii, as described in Section 1. This sequence – called one step ablation (the whole target area is ablated with increasing and then decreasing R values between the limits R = 0 and Rmax) – was used for the crater shown in the left column of Fig. 5. It leads to the observed carryover phenomenon of the surface material to the central crater bottom (see Fig. 6(a), rightmost).
Fig. 6(b) illustrates the novel approach, called two-step ablation. To avoid contamination of the uncovered bulk material by the recast material from the surface, the ablation is divided into two steps. First (two left columns of Fig. 6(b), step 1/2) a circular trench (TR) is ablated around the later, central measurement position. The bulk material is hardly reached by this step, so it cannot be covered by recast layers. In the second step (see the last two columns in Fig. 6(b), step 2/2), the displacement of the laser beam is reduced and the material inside the trench is ablated. Once the surface is pierced, mainly the bulk material is ablated which covers the walls of the cavity, see Fig. 6(b), rightmost.
The displacement radii R during the CM ablation phase are shown in Fig. 7, left, with a maximal displacement of Rmax = 0.54 mm for both described sequences: one-step (open circles) and two-step (filled circles) ablation. For the one-step approach the position of the beam focus follows a sequence of circular scan trajectories with stepwise increasing radii up to Rmax, then these radii decrease again, go back to R = 0.05 mm, then restart increasing up to Rmax, are then becoming smaller ending at R = 0.27 mm, and finally the scan stops at an ablation time of 20 s, see Fig. 7, left. For the two-step approach the scan radii stay between 0.37 and 0.54 mm for the first ten seconds of the ablation phase and are then reduced to the range between 0.05 mm and 0.37 mm for another 10 s, see filled data points in Fig. 7, left. Fig. 7, right, shows the influence of the chosen ablation schemes, i.e. one-step and two-step, on the line ratio ![[Q with combining tilde]](https://www.rsc.org/images/entities/i_char_0051_0303.gif) Fe determined with the LIBS measurements as a function of the measuring time. The structure of the sample is identical for both curves (thickness of the steel sheet (ST) 0.5 mm, iron-free brass block (BR) as the substrate) and the measurement phases are performed in the same way too. The only difference is the ablation scheme during the preceding CM phase, whereas the ablation time is kept constant at ≈20 s.
Fe determined with the LIBS measurements as a function of the measuring time. The structure of the sample is identical for both curves (thickness of the steel sheet (ST) 0.5 mm, iron-free brass block (BR) as the substrate) and the measurement phases are performed in the same way too. The only difference is the ablation scheme during the preceding CM phase, whereas the ablation time is kept constant at ≈20 s.
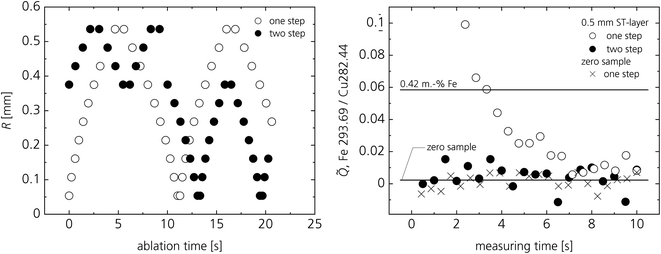 | ||
Fig. 7 Radial displacement R (left) of the laser beam as a function of time during the ablation phase and the resulting line ratio ![[Q with combining tilde]](https://www.rsc.org/images/entities/i_char_0051_0303.gif) Fe values during the measurement phase (right). Open symbols denote the one step ablation scheme, filled symbols denote the two-step scheme, see Fig. 6. For each data point shown in the right diagram an ablation sequence of 20 s was preceding as shown on the left. Fe values during the measurement phase (right). Open symbols denote the one step ablation scheme, filled symbols denote the two-step scheme, see Fig. 6. For each data point shown in the right diagram an ablation sequence of 20 s was preceding as shown on the left. | ||
If the same layer is ablated in the two-step way (filled circles), the ![[Q with combining tilde]](https://www.rsc.org/images/entities/i_char_0051_0303.gif) Fe-signals for iron do not differ significantly from those measured for the zero sample, i.e. the substrate BR. If the one-step ablation scheme is used, there is a significant iron signal detected, especially during the first 6 s of the measuring phase. This result clearly shows the effectiveness of the two-step ablation approach as illustrated in Fig. 6(b).
Fe-signals for iron do not differ significantly from those measured for the zero sample, i.e. the substrate BR. If the one-step ablation scheme is used, there is a significant iron signal detected, especially during the first 6 s of the measuring phase. This result clearly shows the effectiveness of the two-step ablation approach as illustrated in Fig. 6(b).
5. Conclusion
If a laser plasma is generated in a cavity of a non-homogeneous sample – in this paper simulated by a model object consisting of an iron-free brass bulk sample and a steel sheet with a thickness of 500 μm brought in close contact to this substrate – crosstalk effects arise when the expanding plasma interacts with the material outside the irradiated spot. For the analysis of the bulk material covered with a surface layer of deviating composition, laser ablation is applied to reduce the influence of the surface material on the analytical result. However, during the ablation step, a recast layer is generated which influences the subsequent LIBS measurements as well. Both effects can be reduced by an optimized ablation strategy, where in a first step a circular trench is ablated whose depth has about the thickness of the surface layer. In the second step the measurement is executed in the center of this trench. In the studied model object the interference of the surface layer on the LIBS measurement was minimized to levels equivalent to those persisting for the model artefact without the steel sheet, i.e. the homogeneous bulk sample without the surface layer.Conflicts of interest
There are no conflicts to declare.Acknowledgements
The equipment of this work was provided by the Fraunhofer Institute for Laser Technology. Parts of the results shown here have been published as parts of a doctoral thesis.16References
- J. Vadillo, C. Garcia, S. Palanco and J. Laserna, Nanometric range depth-resolved analysis of coated-steels using laser-induced breakdown spectrometry with a 308 nm collimated beam, J. Anal. At. Spectrom., 1998, 13, 793–797 RSC.
- L. St-Onge and M. Sabsabi, Towards quantitative depth-profile analysis using laser-induced plasma spectroscopy: investigation of galvannealed coatings on steel, Spectrochim. Acta, Part B, 2000, 55, 299–308 CrossRef.
- V. Margetic, M. Boshov, A. Stockhaus, K. Niemax and R. Hergenröder, Depth profiling of multi-layer samples using femtosecond laser ablation, J. Anal. At. Spectrom., 2001, 16, 616–621 RSC.
- V. Sturm, J. Vrenegor, R. Noll and M. Hemmerlin, Bulk analysis of steel samples with surface scale layers by enhanced laser ablation and LIBS analysis of C, P, S, Al, Cr, Cu, Mn and Mo, J. Anal. At. Spectrom., 2004, 19, 451–456 RSC.
- H. Balzer, M. Hoehne, V. Sturm and R. Noll, Online coating thickness measurement and depth profiling of zinc coated sheet steel by laser-induced breakdown spectroscopy, Spectrochim. Acta, Part B, 2005, 60, 1172–1178 CrossRef.
- P. Maravelaki-Kalaitzaki, D. Anglos, V. Kilikoglou and V. Zafiropulos, Compositional characterization of encrustation on marble with laser-induced breakdown spectroscopy, Spectrochim. Acta, Part B, 2001, 56, 887–903 CrossRef.
- K. Novotný, T. Vaculovic, M. Galiová, V. Otruba, V. Kanický, J. Kaiser, M. Liska, O. Samek, R. Malina and K. Páleníková, The use of zinc and iron emission lines in the depth profile analysis of zinc-coated steel, Appl. Surf. Sci., 2007, 253, 3834–3842 CrossRef.
- L. Cabalín, A. González, V. Lazic and J. Laserna, Deep ablation and depth profiling by laser-induced breakdown spectroscopy (LIBS) employing multi-pulse laser excitation: application to galvanized steel, Appl. Spectrosc., 2011, 65, 797–805 CrossRef PubMed.
- M. Mateo, V. Piñon and G. Nicolas, Vessel protective coating characterization by laser-induced plasma spectroscopy for quality control purposes, Surf. Coat. Technol., 2012, 211, 89–92 CrossRef CAS.
- E. Kaszewska, M. Sylwestrzak, J. Marczak, W. Skrzeczanowski, M. Iwanicka, E. Szimit-Naud, D. Anglos and P. Targowski, Depth-resolved multilayer pigment identification in paintings: combined use of laser-induced breakdown spectroscopy (LIBS) and optical coherence tomography (OCT), Appl. Spectrosc., 2013, 67, 960–972 CrossRef CAS PubMed.
- M. Corsi, G. Cristoforetti, M. Hidalgo, D. Iriarte, S. Legnaioli, V. Palleschi, A. Salvetti and E. Tognoni, Effect of laser-induced crater depth in laser-induced breakdown spectroscopy emission features, Appl. Spectrosc., 2005, 59, 853–860 CrossRef CAS PubMed.
- C. Meinhardt, V. Sturm, R. Fleige, C. Fricke-Begemann and R. Noll, Laser-induced breakdown spectroscopy of scaled steel samples taken from continuous casting blooms, Spectrochim. Acta, Part B, 2016, 123, 171–178 CrossRef CAS.
- V. Sturm, C. Meinhardt, R. Fleige, C. Fricke-Begemann and J. Eisbach, Fast identification of steel bloom composition at a rolling mill by laser-induced breakdown spectroscopy, Spectrochim. Acta, Part B, 2017, 136, 66–72 CrossRef CAS.
- LLA Instruments GmbH, 12489 Berlin, url: http://www.lla.de/.
- M. Jackson and W. O'Neill, Laser micro-drilling of tool steel using Nd:YAG lasers, J. Mater. Process. Technol., 2003, 142, 517–525 CrossRef CAS.
- C. Meinhardt, Elementspezifische Analyse primärverzunderter Stranggussstähle mit Laser-Emissionsspektroskopie; Element-Specific Analysis of Scaled Continuous Casted Steel by Laser-induced Breakdown Spectroscopy, Norderstedt: Books on Demand, 2017, ISBN 978-3-7448-6865-5 Search PubMed.
| This journal is © The Royal Society of Chemistry 2021 |


