 Open Access Article
Determination of picogram amounts of uranium in micrometre-sized particles by isotope dilution mass spectrometry†
C.
Venchiarutti
 *a,
G.
Stadelmann
b,
R.
Middendorp
a,
Z.
Macsik
 b and
A.
Venzin
b
aEuropean Commission, Joint Research Centre, Directorate for Nuclear Safety and Security, Geel, Belgium. E-mail: Celia.Venchiarutti@ec.europa.eu
bOffice of Safeguards Analytical Services, Department of Safeguards, International Atomic Energy Agency, PO Box 100, 1400 Vienna, Austria
First published on 3rd March 2021
Abstract
In order to improve the analytical methods used in the field of particle analysis in nuclear safeguards, monodispersed micrometre-sized particles with certified uranium isotopic composition and uranium amount per particle are highly useful. In this study, picogram amounts of uranium in particle form were quantified in a candidate particle reference material for certification. The uranium amount per particle was determined using optical microscopy combined with Isotope Dilution Thermal Ionisation Mass Spectrometry (ID-TIMS). The uranium amount was verified using Isotope Dilution Multi Collection-Inductively Coupled Plasma Mass Spectrometry (ID-MC-ICPMS). The uranium amount per particle agreed well between the two techniques within the associated uncertainties. Both techniques are suitable for quantification of picogram amounts of uranium in particulate reference materials. The uranium particle material in this study was later used in a proficiency test (NUSIMEP-9) and eventually certified for the uranium isotopic composition of particles and the uranium amount per particle.
1. Introduction
The International Atomic Energy Agency (IAEA) applies a range of safeguard methods to independently verify states' declared nuclear material inventories and associated activities in order to assure the peaceful use of its nuclear material holdings. Sample collection and independent analysis and evaluation are important parts of the IAEA verification approach. In general terms, nuclear material samples are taken to verify declared nuclear material inventories, and swipe samples are taken to verify the absence of undeclared nuclear material and/or activities.A swipe sample, also referred in nuclear safeguards as an environmental sample, consists of a piece of cotton cloth (normally several swipes constitute a single sample), and is used by inspectors to collect dust-sized particles on surfaces within nuclear facilities. In bulk-handling facilities in the front end of the nuclear fuel cycle (uranium conversion, enrichment and fuel fabrication plants), uranium particles make up a portion of the sample load on single cotton swipe. The typical amount content of natural uranium on a swipe is 2–3 ng, and particles of interest range from 0.1 to 10 micrometres in diameter and contain femtogram to picogram levels of uranium. The isotopic composition of uranium particles on a swipe sample often reflects the full isotopic range of uranium that a facility has processed, and is thus a powerful method for detecting undeclared material.
Environmental samples are routinely analysed by the IAEA and its Network of Analytical Laboratories (NWAL). Together with the IAEA, the NWAL include several expert laboratories in the field of uranium particle analysis. During the last decade, highly sensitive analytical methods using state-of-the art instruments, such as Large Geometry-Secondary Ion Mass Spectrometry (LG-SIMS), Thermal Ionisation Mass Spectrometry (TIMS) and Multi Collector Inductively Coupled Plasma Mass Spectrometry (MC-ICPMS) have been developed and improved the analysis of micrometre-sized uranium particles from environmental samples. Certified reference materials (CRM) are used by particle analysis labs to validate instrument methods and to quality control the results. The same CRM are also used for proficiency testing to evaluate laboratory performance.
CRM consisting of micrometre-sized uranium particles would be well suited to the above-mentioned uses, however such CRM are not readily available. An ideal uranium particle CRM would also include the uranium amount per particle as part of the certificate, which would allow for yield (efficiency) calculations from an LG-SIMS instrument and for other mass spectrometric techniques, such as Fission-Track TIMS and Laser-Ablation ICPMS.1–3
To meet this need, a collaborative project was initiated to produce, characterise and certify a reference material consisting of monodispersed, spherical micrometre-sized uranium oxide particles. The project involved the European Commission's Joint Research Centre Geel, Unit G.2 (JRC-Geel G.2, Belgium), the IAEA Office of Safeguards Analytical Service (IAEA SGAS, Seibersdorf, Austria) and the Forschungszentrum Jülich Institute for Nuclear Waste Management and Reactor Safety (FZJ/IEK-6, Jülich, Germany).4
The project was executed in three main steps as shown in Table 1. In the first step, the initial efforts focused on the production of suitable reference particles, referred to as IRMM-023P. These particles, which were loaded onto glass-like carbon planchets, consisted of monodispersed uranium particles produced using a CRM uranyl nitrate solution (IRMM-023).5 These reference particles were used in the second step for a feasibility study on the quantification of uranium amount per particle by Isotope Dilution Thermal Ionisation Mass Spectrometry (ID-TIMS). In the third step, a batch of monodispersed uranium particles was loaded onto glass-like carbon planchets from a certified uranium solution. This batch4 was analysed first with ID-TIMS and then verified with ID-MC-ICPMS in order to eventually certify the uranium amount per particle in compliance with ISO 17034 and ISO Guide 35.6,7 The analyses were performed independently between the two laboratories, namely the JRC-Geel G.2 and the IAEA SGAS, and no results were communicated between the laboratories. The general context of this work and the two approaches used to determine the uranium amount per particle are presented in this paper.
| Steps | Materials | Work performed | Institutes | Techniques | Use |
|---|---|---|---|---|---|
| 1 | IRMM-023 solution | • Production of U particle | FZJ | VOAG | Feasibility study |
| 2 | IRMM-023P | • Determination of U isotopic ratios in solution | JRC-Geel G.2 | TIMS/MTE | |
| • Morphological analysis of uranium particles | FESEM | ||||
| • Particles transfers by micro-manipulations | Optical microscope | ||||
| • Determination of U amount content per particle | ID-TIMS | ||||
| 3 | IRMM-2329 solution | • Production of U particles | FZJ | VOAG | Certification and verification measurements |
| • Determination of U isotopic ratios in solution | JRC-Geel G.2 | TIMS/MTE | |||
| IAEA SGAS | TIMS/MTE, MC-ICPMS | ||||
| IRMM-2329P | • Determination of U isotopic ratios in particle | IAEA SGAS | MC-ICPMS | ||
| • Morphological analysis of uranium particles | JRC-Geel G.2 | FESEM | |||
| • Particles transfers by micro-manipulations | Optical microscope | ||||
| • Determination of U amount content per particle | JRC-Geel G.2 | ID-TIMS | |||
| IAEA SGAS | ID-MC-ICPMS |
2. Experimental
2.1. Production of uranium particles
The production of uranium micro-particles was performed using a spray-pyrolysis method, i.e. the generation of a uranium-containing aerosol using a vibrating orifice aerosol generator (VOAG).8 This setup produces a uranium-containing aerosol consisting of droplets of equal size and volume. With a homogeneous uranium concentration, the amount of uranium per aerosol droplet can also be considered constant. Through a drying process and thermal decomposition (500 °C) of the droplets, spherical particles were obtained which were homogeneous with respect to their size, volume and uranium content.4,9The feed solutions for the VOAG were prepared from mixtures of certified uranium solutions. The solutions were diluted with ultra-pure water (18.2 MΩ cm) and ethanol to a suitable uranium concentration to produce the desired U amount content in particles.4,8 The water to ethanol volume ratio was approximately 1. The feed solution was then fed into the VOAG to generate droplets. The aerosol was subsequently heated to 500 °C, at which temperature the mixture of water and ethanol evaporated. The result was a formation of solid triuranium octoxide micro-particles (U3O8).4,9
Once cooled, the uranium particles were extracted and deposited onto quartz disks, which were then transferred into an ethanol-filled bottle and subsequently ultra-sonicated in order to detach the particles from the quartz disks and wash them into the ethanol.9 Finally, aliquots of the suspension solution were distributed by pipette over 25 mm diameter glass-like carbon planchets (glassy carbon discs 25.2 mm diameter × 3 mm thick), which were gently heated to dryness to homogenize the deposit onto the substrate of the planchets. Before packing, the planchets were shortly heated to a high temperature for the complete evaporation of all volatile residues.
As long as no cross-contamination occurred during production, the uranium isotopic composition of the particles should be equivalent to the uranium isotopic composition of the feed solution. The transfer of the collected particles into a suspension prior to redistribution onto the planchets enhances the homogeneity of the uranium amount content of the particles produced over an extended period of time (2 days for 110 units), allowing a set of samples to be considered as homogeneous with respect to the uranium amount per particle, although verification remains critical for certification.
The determination of uranium amount per particle was based on two batches of uranium particles (Table 1). One test batch was produced using the low-enriched uranium (LEU) solution IRMM-023, which is certified for the uranium amount ratios;5 this batch is referred to as IRMM-023P. This test batch was used in a feasibility study to assess the suitability of the production process, prior to the production of the second batch of particles, which was to be selected as candidate uranium reference particles for certification.4 The second batch, referred to as IRMM-2329P, was produced using a feed solution prepared from a certified mixture of IRMM-023 with IRMM-029 base solutions.4,5 This batch was used to determine the uranium isotopic ratios of the particles as described in the certification report4 and the uranium amount per particle via ID-TIMS and ID-MC-ICPMS, this study.
2.2. SEM investigations of the produced uranium particles
The size, rough equivalent circular diameter (ECD) and morphology of the particles (i.e. sphericity) were assessed by field emission scanning electron microscopy (FESEM) using energy-dispersive spectrometry (EDS) and back-scattered electrons (BSE) detectors. Energy dispersive X-ray (EDX) analysis of the particles confirmed that uranium was the major constituent of these particles (Fig. 1).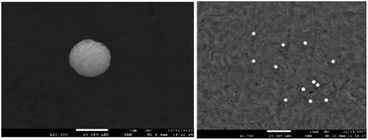 | ||
| Fig. 1 SEM images of the produced uranium reference particles analysed in this study (courtesy of JRC-Geel F.6 unit). | ||
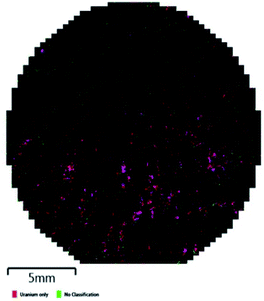
The planchets each consisted of ca. 15![[thin space (1/6-em)]](https://www.rsc.org/images/entities/char_2009.gif) 000 monodispersed uranium particles of micrometre-sized diameter (Fig. 2). Most particles are relatively dense (mainly deprived of inner voids) and spherical9 and have a diameter of ca. 1.4 μm, although less than 4% of the particles had 2× the mass of uranium.4 A few non-uranium particles, mostly constituted of silicon were detected on the planchets. These silicon particles are likely debris or residues from the quartz disks, which were initially used to collect the uranium particles and from which silicon might have been leached. These scarce impurities should, however, not interfere with the uranium measurements.
000 monodispersed uranium particles of micrometre-sized diameter (Fig. 2). Most particles are relatively dense (mainly deprived of inner voids) and spherical9 and have a diameter of ca. 1.4 μm, although less than 4% of the particles had 2× the mass of uranium.4 A few non-uranium particles, mostly constituted of silicon were detected on the planchets. These silicon particles are likely debris or residues from the quartz disks, which were initially used to collect the uranium particles and from which silicon might have been leached. These scarce impurities should, however, not interfere with the uranium measurements.
2.3. Verification of isotopic composition of the produced uranium particles
During the production step and in the absence of any external source of contamination, no changes of the uranium isotope amount ratios from the solutions to the particles were expected.The first batch of particles used for the feasibility study was prepared from the LEU solution, IRMM-023, which is certified for the uranium isotopic composition.5 The particles were analysed by LG-SIMS and the isotopic analysis confirmed the uranium isotopic composition of individual particles was unaltered from the feed solution. The uranium isotope amount ratios from IRMM-023 were then used for determination of the uranium amount per particle.
For the second batch of reference particles IRMM-2329P, the isotopic composition of the IRMM-2329 feed solution was first measured for the uranium isotopic composition by TIMS using the standardised modified total evaporation (TIMS/MTE) method,10 and subsequently verified in a second lab by TIMS/MTE and MC-ICPMS.4
Once the uranium isotopic composition of the feed solution was characterised and confirmed, the production of the monodispersed micro-particles was undertaken. After production, six units of the reference particles IRMM-2329P were analysed for the uranium isotopic composition of the particles. Uranium particles were leached from the surface of three planchets and dissolved with nitric acid, and directly measured by MC-ICP-MS.4 These process-control measurements confirmed that the monodispersed micro-particles had the same uranium isotope amount ratios as the feed solution, moreover confirming the absence of contamination during the production of the uranium particles.4 The confirmed (and certified) uranium isotope ratios n(235U)/n(238U), n(234U)/n(238U) and n(236U)/n(238U) of the particle material IRMM-2329P were then used for the determination of the uranium amount per particle presented in this study (Table 2).
| Isotope amount ratio | IRMM-2329P [mol mol−1] |
|---|---|
| n(234U)/n(238U) | 0.00034083 (19) |
| n(235U)/n(238U) | 0.033902 (12) |
| n(236U)/n(238U) | 0.00003021 (12) |
2.4. Determination of the U amount per particle by ID-TIMS
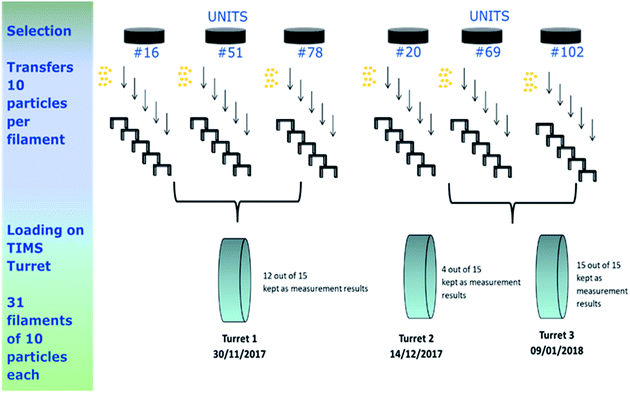
Determination of the uranium amount per particle was performed by ID-TIMS, using a method adapted from the methodology previously implemented at JRC-Geel G.2 by Kraiem et al. 2012.11 The analytical method consisted of (1) transferring a controlled number of particles of interest using optical microscopy onto a TIMS filament and (2) adding a known amount of uranium spike to perform the ID-TIMS measurements. The different steps of this method are described in Fig. 3 (for the analysis of the IRMM-2329P particles reference material) and in the following sections.The microscope (DM4000M, Leica Microsystems) used for the particle transfer was an incident light optical microscope equipped with a motorised focus and a motorised stage manufactured by Märzhäuser (Wetzlar, Germany). A specific holder was designed in-house to allow transfer from one planchet to two filaments. Transfers of the particles from the planchets to the carburised single rhenium filaments were carried out using two TransferMan® NK 2 micro-manipulators from Eppendorf (Hamburg, Germany), located on each side of the microscope, and equipped with Femtotips microinjection capillaries (Eppendorf).
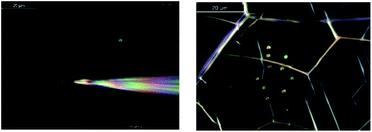
The particles were deposited in the centre of the rhenium filament, where spike and acid solutions were also loaded in order to maximise the homogeneous mixing of spike and particles. After preparing each batch of filaments, some filaments were again randomly inspected using the optical microscope to check if the ten uranium particles were still in place. These observations confirmed that the particles adhered well to the filaments (without any additional “glue”) and that only ten uranium particles were present on the filaments (Fig. 4).
For the batch of IRMM-023P particles used for the feasibility study, one planchet was randomly selected among the produced planchets and eight filaments were prepared by selecting ten particles out of the planchet and loading them onto each single carburised rhenium filament prior to TIMS analysis.11,12
For the IRMM-2329P reference particles, six planchets of uranium reference particles were selected out of the 110 produced planchets using a random stratified sampling scheme.4 For each selected unit, five filaments were prepared, each loaded with ten particles (Fig. 3).
In order to perform isotope dilution mass spectrometry (IDMS),13 6.5 pg of 233U (IRMM-058) was added in the form of 3 μL spike onto each filament. The addition of spike could not be performed gravimetrically, therefore the pipette was calibrated in accordance to ISO 8655 6:2002 and the density of the spike in 1 mol L−1 HNO3 (determined as 1.033 g mL−1) was corrected in accordance with Sakurai and Tachimori (1996).14 Then, 2 μL 3 mol L−1 HNO3 (Suprapur®) was added in order to fully dissolve the particles and to obtain a homogeneous mixture between the sample and the spike.
A procedural blank, consisting of the 3 μL 233U spike IRMM-058 and 2 μL 3 mol L−1 HNO3, was prepared for each set of measurements (i.e. with each TIMS turret). Some standards and mixtures made of certified uranium solutions (IRMM-186 and IRMM-187) were also prepared with uranium isotopic compositions and/or uranium contents close to those of the particle samples to be measured, so as to tune and calibrate the instrument, to apply the necessary corrections (e.g. for mass bias/fractionation) and for quality control purposes.
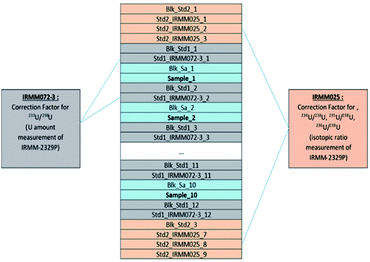
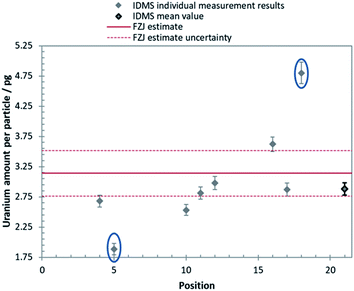
The filaments were heated on an evaporation rack using a current of 0.4 A, in order to evaporate the solvent and ensure a proper mixing between the sample (dissolved particles) and spike. The sample, procedural blank and standard filaments were then mounted in front of pre-baked “modified” side filaments, in an alternate sequence onto a pre-cleaned TIMS turret consisting of 21 positions.4,11
During the measurement sequence, the evaporation filament was first heated by increasing manually the current to approximately 700 mA, at which current, potassium starts to evaporate from the filament, leading to a measurable 39K signal. This signal was used for initial source lens focusing, after which the current was increased to 3500 mA. Once at 3500 mA, the current was slowly increased until the filament reached a temperature of 1700 °C, at which the 238U intensity typically increased for a short time to about 200 kcps. After performing the source lens focusing and peak centring on the 238U signal, the measurement was started from the method application (Table 3) during which the 238U, 235U and 233U were measured in peak-jumping mode for a block of seven consecutive cycles. After each block, the current was increased to heat again the filament and obtain a signal intensity similar to the one at the start of the first block till total consumption of the sample.
| Mass set | Integration time [s] | Number of integration | Idle times [s] | Peak center cup | Focus cup |
|---|---|---|---|---|---|
| Main | 4 | 1 | 2 | 238U SEM | 238U |
| 235 | 4 | 1 | 2 | 235U SEM | None |
| 233 | 4 | 1 | 2 | 233U SEM | None |
The measurements of the filaments (from respective units/planchets) were performed in a randomised manner to detect possible trends in the analytical and unit production sequences. Note that the ion source of the instrument had been previously cleaned to reduce the uranium background.
For the feasibility study using IRMM-023P particles, some filaments were also loaded with specific dilutions of the uranium standards, IRMM-186 and IRMM-187 and some with a mixture of the IRMM-186 and IRMM-058, which were measured on the turret together with the IRMM-023P samples. The IRMM-187 200 ng was used to have sufficient 238U signal in the centre cup/RPQ-SEM® to tune the instrument for mass calibration and ion source, the IRMM-187 11.1 pg (with similar range of U amount as expected in the loaded particles) to determine the K-factors and correct for mass fractionation and the IRMM-186 11.1 pg was used as a quality control sample.
For the IRMM-2329P measurements, with each turret of samples, one procedural blank was measured for blank/background correction. Moreover, with each turret, four quality control samples prepared from IRMM-023P micro-particles (with 3 μL of 233U spike and 2 μL of 3 mol L−1 HNO3) and a filament consisting of 1 μL 200 ng μL−1 IRMM-187 standard (as previously described) were analysed.4
These standards and mixtures were measured (1) to assess any potential drift of the signal (beyond normal counting statistics), (2) to calculate the mass fractionation, (3) to detect improper mixing of spike and sample and (4) to estimate the background corrections.
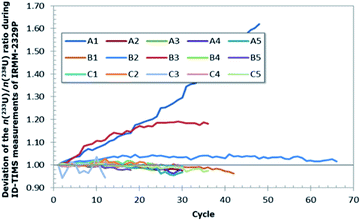
During the course of the measurement, the level of homogeneity between the uranium from the spike and from the dissolved particles was assessed by the observation of the n(233U)/n(238U) ratio (Fig. 5). Samples for which spike and sample were not in equilibrium, typically showed a drift exceeding 10% of the initial value (Fig. 5) and were rejected since they indicated incomplete homogenisation and an incorrect isotope dilution.
2.5. Determination of the U amount per particle by MC-ICPMS
The IAEA-SGAS routinely analyses environmental samples containing sub-ng amounts of uranium using MC-ICPMS in bulk analysis.15 However, the determination of amounts of uranium in particles of less than 10 pg, such as in IRMM-2329P reference particles required the development of a specific method to use ID-MC-ICPMS at such a low uranium level.For the verification purpose, ten samples (Fig. 6) were prepared by micro-manipulations at JRC-Geel G.2 and then shipped to the IAEA-SGAS. The samples were screened by the IAEA for any potential contamination and to determine the amount of 233U spike to be used. The screening consumed two samples. The rest of the samples were measured by isotope dilution (using the 233U tracers SRM995 and CRM-111A) using a MC-ICP-MS instrument (Thermo Scientific, Bremen, Germany). The combined standard uncertainty, i.e. the different uncertainty contributions to the measured uranium amount per particle, was quantified in accordance with the ‘Guide to the Expression of Uncertainty in Measurement’.16
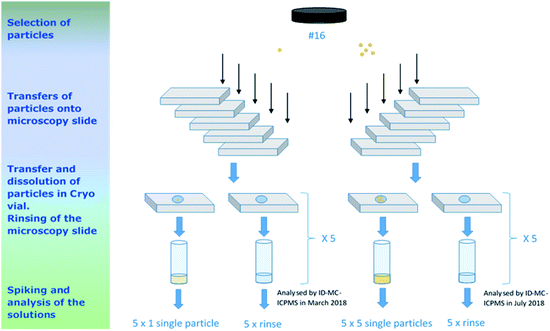 | ||
| Fig. 6 Flowchart of the sample preparation for the verification measurements of the IRMM-2329P at IAEA-SGAS. The particle transfers were performed by JRC-Geel G.2. | ||
The particles were collected by micro-manipulation under an optical microscope (as described in Section 2.4.1) and were deposited onto microscopy slides which were pre-cleaned with ethanol. The collected particles were then transferred from the microscopy slides and dissolved in 100 μL 3 mol L−1 HNO3 into pre-cleaned Cryo vials. The weight of the samples (100 μL nitric acid) was recorded (using a Mettler Toledo XP56 balance).
After transferring the particles to Cryo vials, an additional volume of 100 μL 3 mol L−1 HNO3 was added onto the slides then collected to check if there was any residual uranium from the particles remaining on the slides. This rinsing nitric acid was also transferred into Cryo vials and were referred as “rinse blanks” noted IRMM-2329P-R1-x and IRMM-2329P-R5-x (x = a…e), respectively.
Five process blanks were also prepared following the same procedure as used for the sample, i.e. adding only 100 μL 3 mol L−1 HNO3 onto a pre-cleaned microscopy slide and transferring it to a pre-cleaned Cryo vial.
Samples used for screening were diluted to 1 mL with 2% HNO3. Impurities and uranium were measured with a quadruple ICPMS (iCapQ, Thermo Scientific, Germany) equipped with a high efficiency sample introduction system Apex HF (Elemental Scientific Inc., NE, USA). The absence of any trans-uranium elements or organic interferences was checked and the intensity of 69 elements (from Li to U) was measured in the samples and compared to instrumental blanks and to solutions of IRMM-072/1, IRMM-072/3 and IRMM-072/5 certified reference materials diluted to around 2 pg g−1. The U content was estimated using IRMM-072/5 as external standard with known U concentration (at the level of 2 pg U per g).
Since the level of impurities in each sample was sufficiently low, no chemical sample purification was deemed necessary.
The IRMM-025 and IRMM-072/3 standards were selected as bracketing standards at ca. 13 and 35 pg g−1 and ca. 9 and 24 pg g−1, for the “1- and 5-particles” sample measurements, respectively.
Fresh dilutions of the selected 233U tracers were prepared from the mother solutions (around 0.5 mg g−1), using the CRM 111-A tracer for the 1-particle samples and the SRM 995 tracer for the analysis of the 5-particle samples. The selected 233U tracer concentrations were adjusted in 2% HNO3 to 3.0059(37) pg g−1 (for the CRM 111-A for the 1-particle samples) and 9.867(28) pg g−1 (for the SRM 995 for the 5-particle samples). The use of two different standards ensured that independent results were obtained, while the preparation of fresh 233U tracer solutions was crucial/critical at such low U concentration.
Finally, all solutions to be analysed by ID-MC-ICPMS (samples, process- and rinse-blanks) were spiked gravimetrically with 0.9 mL of the respective tracer solutions. Spiking and weighing were performed in clean laboratory conditions using an analytical balance (Mettler Toledo XP504).
A routine optimisation of the MC-ICPMS and Aridus II instruments was performed to achieve a stable signal sensitivity for 238U+ at 1.54 V in 1 ng mL−1 solution of IRMM-025. A Faraday cup/amplifier and ion counter baseline, followed by a Faraday cup/amplifier gain calibration were performed automatically at the start of the measurement sequence.
All isotopic ratios in the samples, standards and instrumental blanks were measured in a static mode at a mass resolution (R10%) of ca. 300 (‘low mass resolution’) with the detector arrangement described in Table 4. The secondary electron multipliers (SEM), IC3 and IC1B equipped with energy filters (RPQ) were used for the measurement of 234U and 236U. The compact discrete dynode multiplier (CDD), IC4, was used for 233U measurements. The IC2 was used for 235U measurements.
| IC4 | RPQ/IC3 | IC2/L5 | RPQ/IC1B | L4 | IC5 | Integration time [s] | Idle time [s] | Cycle/block | No. of blocks | |
|---|---|---|---|---|---|---|---|---|---|---|
| Mass set | 233U | 234U | 235U | 236U | 238U | 238U1H | 4.2 | 3 | 40 | 1 |
The Faraday cup L4 was connected to a 1012 ohm amplifier to measure 238U.
For the isotope dilution measurement, the only two isotopes of interest were 233U and 238U. However, due to the high purity of the 233U spikes, an attempt was made to simultaneously determine/verify the IRMM-2329P uranium isotopic ratios while determining the uranium amount per particles. Therefore the signals of 234U, 235U and 236U were acquired at the same time as the 233U and 238U (see Tables 2 and 4).
Two different uranium isotopic standards were measured with each set of samples according to the sequence shown in Table 5. The n(233U)/n(238U) isotope ratio measured in the samples was calibrated applying the standard bracketing method, i.e. against the isotope ratio in IRMM-072/3 reference material, which was measured before and after each sample. The isotope ratios n(234U)/n(238U), n(235U)/n(238U) and n(236U)/n(238U) measured in the samples were calibrated against the isotope ratios in the IRMM-025 reference material, which was measured three times: at the beginning, the middle and the end of the sequence (and noted as Std2_IRMM025_x in Table 5).
Peak alignment and peak centring were performed manually on m/z = 238 amu on the Faraday cup L4 before starting a sequence. An automatic peak centring was performed on Faraday cup L4 before every measurement of the IRMM-025 standard. The sample changer SC-2 DX was rinsed in a dual-well, using a solution of 5% nitric acid and 0.1% hydrofluoric acid, for a total of 5 minutes (1 min in well-1 and 4 min in well-2 with a constant flush) after every standard and for 10 minutes after every sample measurement. Additionally, specific blanks of 2% HNO3 were measured before each standard and sample and are noted as Blk_Std1_x, Blk_Std2_x and Blk_Sa_x in Table 5, respectively.
The samples were analysed in two campaigns (Fig. 6). First, in March 2018, the four 1-particle samples and the corresponding rinse blanks were measured in one day. Then, a second campaign in July 2018, when the four 5-particle samples, the corresponding rinse blanks and the process blanks were measured in two sequences. In the first sequence, the process blanks and the 5-particle samples were measured whereas in the second sequence, the “rinse blanks” and again the 5-particle samples were measured. Note that the process blank results were used in the evaluation of the first campaign's data as well.
3. Results and discussion
3.1 TIMS results
The amount of uranium present on each measured filament (i.e. from the 10 dissolved particles), nx, was calculated using the IDMS equation13 based on the 233U/238U ratio (eqn (1)): | (1) |
In which Ry, Rx and Rb are the n(233U)/n(238U) isotope amount ratios of the spike, sample and blend respectively. The isotope amount ratio of the spike (IRMM-058) was taken from the certificate while the isotope amount ratio n(233U)/n(238U) of the sample was taken as zero, since it was confirmed that there was no 233U in the particle samples IRMM-023P and IRMM-2329P (see Table 2). The isotope amount ratio of the blend was measured by TIMS. ∑Rx and ∑Ry are the sums of the certified isotope amount ratios n(234U)/n(238U), n(235U)/n(238U) and n(236U)/n(238U) in the sample and spike certificates respectively. The ny is the amount of uranium added to the blend, which was calculated based on the certified isotope amount content of the spike (IRMM-058), the transferred volume of the spike and the density of the spike.4
The conversion from the determined uranium amount (in mol) to uranium mass (in gram) was done using the calculated molar mass for the uranium per particle, which was determined as 237.950848(34) g mol−1 (k = 2) for the IRMM-2329P reference particles.4 The total uranium mass for ten particles on each filament was calculated by subtracting the amount of uranium measured in each procedural blank analysed with each TIMS turret. For the analysis of the IRMM-2329P reference particles, the process blanks varied from 0.075 pg (±3%, relative expanded uncertainty, k = 2) to 0.21 pg (±14%, relative expanded uncertainty, k = 2), i.e. in a similar range of uranium masses as observed by Kraiem et al., 2012.11
Finally, the averaged uranium amount on each filament was divided by the number of transferred particles, which was fixed to ten for all prepared filaments, to determine the uranium mass per particle.
However, during the measurements of the second turret, due to an improper mixing of the spike with the sample on individual filaments, indicated by significant changes in the n(233U)/n(238U) ratios by more than 10% (Fig. 5), a new series of aliquots had to be prepared for three units with five new filaments per unit, so 15 extra filaments.
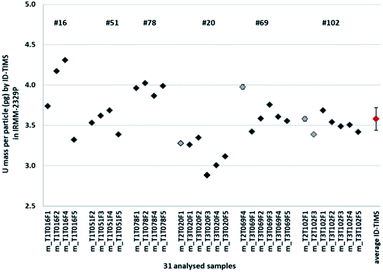
Finally, after rejecting a few aliquots due to improper homogenisation between sample and spike, a total of 31 measurement results were kept for the assessment of the mean mass of uranium derived from ten dissolved uranium particles (Fig. 3 and 8).
Based on the 31 ID-TIMS measurement results carried out at JRC-Geel G.2 and using the GUM Workbench® software developed by Metrodata,18 the uranium mass per particle in IRMM-2329P was calculated from the mean uranium mass content of ten dissolved particles as 3.58 pg of U per reference particle (Fig. 8).
The combined standard uncertainty was quantified using GUM Workbench® in accordance with the ‘Guide to the Expression of Uncertainty in Measurement’.16 The combined standard uncertainty on the uranium mass per particle included the relative standard uncertainty on the ID-TIMS measurements of the 31 filaments (0.053%) and the relative standard uncertainty on the spike concentration IRMM-058 (4.0%), which dominant uncertainty component comes from the uncertainties of the transferred volume and the density of the spike.
In addition, as part of the certification of the IRMM-2329P reference particles, a relative standard uncertainty for the homogeneity of the uranium mass in IRMM-2329P reference particles of 7.8% was taken into account, i.e. the combined between-planchets/units variation and the intra-planchet variation or inhomogeneity. All these uncertainties were finally added in quadrature.4
Finally, the reference value for the uranium mass per particle in IRMM-2329P was defined as 3.58(63) pg (expanded uncertainty, k = 2).
Since the IRMM-2329P was candidate for certification in compliance with ISO 17034 and ISO Guide 35,6,7 results obtained by ID-TIMS at JRC-Geel G.2 were verified independently at the IAEA-SGAS using ID-MC-ICPMS (Table 1) and results are given in the following section.
3.2 ID-MC-ICPMS results
The isotope ratios n(233U)/n(238U), n(234U)/n(238U), n(235U)/n(238U), n(236U)/n(238U), n(238U1H)/n(238U), n(238U)/n(233U) were measured. An outlier rejection was applied on raw intensity ratios based on three times the standard deviation within the 40 measured lines. Then instrumental blank correction (2% HNO3) was performed for samples and standards.Correction factors for mass bias and yield were determined simultaneously for each isotope ratio from the average results of the standards measured before and after the given sample. All the ratios were corrected as explained in Table 5, using a respective correction factor as given in eqn (2) and (3). Peak tailing and hydride correction were considered negligible, therefore the isotopic ratio results were not corrected for them.
 | (2) |
| RSample,corr = RSample,meas × CF | (3) |
In the samples, the number of 238U atoms was calculated using the isotope dilution equation (eqn (1)) and the measured n(238U)/n(233U) assuming there was no 233U originating from the sample; whereas the number of 234U, 235U and 236U atoms were calculated based on the isotopic ratio measured and presented in Table 2.
Finally, the number of atoms of uranium isotopes was converted to mass (pg) and summed to obtain the total uranium per sample solution. This mass was corrected from the process blank and divided by the number of particle transferred onto the microscopy slide to finally obtain the mass of uranium per particle.
Process blanks. Uranium with a natural isotopic composition was detected in the four process blanks. The average of the four process blanks (1.05(22) pg with 21% relative standard deviation, k = 1) was used for the blank subtraction from all sample and rinse results.
The presence of natural uranium in the process blanks hindered the intended determination of the uranium isotopic ratios of the particles in the samples (this study) since the exact amount of natural uranium mixed in the samples was unknown.
Rinse blanks. In only two rinse blanks (i.e. IRMM-2329P-R5-b and IRMM-2329P-R5-d), uranium amounts of 1.7 pg ± 14% (k = 2) and 0.6 pg ± 40% (k = 2) were detected after subtraction of the respective process blanks. However, the uranium amount detected in these rinse blanks was not added to the final results since this uranium is likely of natural origin (natural contamination) and not from the uranium particles of interest, because the measured n(235U)/n(238U) isotope ratio did not deviate from the natural ratio to indicate it originated from the particles. It was then assumed that all the particles were completely transferred to the Cryo vials.
| Total U per sample [pg] | Total U per particle [pg] | Expanded uncertainty (k = 1) [pg] | Rel. exp. unc. [%] | |
|---|---|---|---|---|
| IRMM-2329P-1-b | 3.19 | 3.188 | 0.225 | 7.1 |
| IRMM-2329P-1-c | 4.42 | 4.419 | 0.225 | 5.1 |
| IRMM-2329P-1-d | 3.13 | 3.127 | 0.225 | 7.2 |
| IRMM-2329P-1-e | 3.86 | 3.858 | 0.225 | 5.8 |
| IRMM-2329P-5-b | 18.58 | 3.715 | 0.047 | 1.3 |
| IRMM-2329P-5-c | 18.61 | 3.721 | 0.047 | 1.2 |
| IRMM-2329P-5-d* | 2.87* | 2.865* | 0.225* | 7.9* |
| IRMM-2329P-5-e | 16.13 | 3.225 | 0.046 | 1.4 |
| IRMM-2329P-5-b 2nd run | 18.67 | 3.734 | 0.047 | 1.2 |
| IRMM-2329P-5-c 2nd run | 18.65 | 3.730 | 0.047 | 1.2 |
| IRMM-2329P-5-d 2nd run* | 2.84* | 2.843* | 0.221* | 7.8* |
| IRMM-2329P-5-e 2nd run | 16.21 | 3.242 | 0.046 | 1.4 |
| Average IAEA ID-MC-ICPMS | — | 3.561 | 0.082 | 2.3 |
The uncertainties of the ID-MC-ICPMS results were calculated according to GUM principles.16 The calculated uncertainties take into account the uncertainties originated from the MC-ICPMS measurements and the measured U content in the process blanks. Although they may have affected the results, it was not possible to estimate uncertainties related to the sample preparation (i.e. due to micro-manipulation, cleanliness of the microscopy slides and possible incomplete transfer to Cryo vials). They were therefore not taken into account in the uncertainty budget for the MC-ICPMS results.
The result for the samples containing five particles is the average of both replicate measurement.
The n(236U)/n(235U) amount ratio measured in the samples agreed with the one of IRMM 2329P and therefore confirmed the hypothesis that the samples were contaminated with natural uranium only.
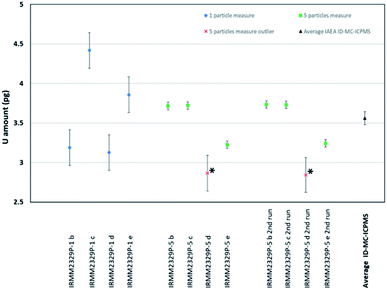
In sample IRMM-2329P-R5-d, a low amount of total U of about 3 pg (with a large uncertainty) was measured in the solution, while in the other samples containing five particles more than 15 pg of uranium in solution were found (Table 6). Since the corresponding rinse blank only contains 0.6 pg ± 40% (k = 2) of uranium with a natural uranium isotopic composition, it is suspected that only one particle, instead of five, was transferred and dissolved in the Cryo vial. This hypothesis is supported by the observation that the result of the sample IRMM-2329P-R5-d is comparable to the results obtained for the samples containing only one particle. Therefore, this result was considered as an outlier among the samples containing five particles and excluded from the calculation of the average mass of uranium per particle (Fig. 9).
Consequently, the mean mass of uranium per particle was estimated using the four results originating from single particle measurements and the six results originating from measurements of five particles. These measurements are assumed to be mutually independent estimates of the U mass. Given that each measurement result has an associated uncertainty, a weighted mean and its standard error were calculated from the data.
 | (4) |
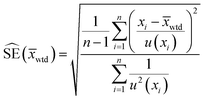 | (5) |
The notation u(xi) indicates the uncertainty of measurement result xi and u2(xi) is shorthand for [u(xi)]2. The standard error estimate,  , is derived under what is sometimes called the reduced chi-square model. This model adjusts the standard error (uncertainty) estimate depending on whether the individual measurement uncertainty estimates are too small or too large to explain the dispersion of the data itself. Additional mathematical details can be found in the textbook by Kutner et al.19 on linear statistical models.
3.3. Comparison of the TIMS and MC-ICPMS results
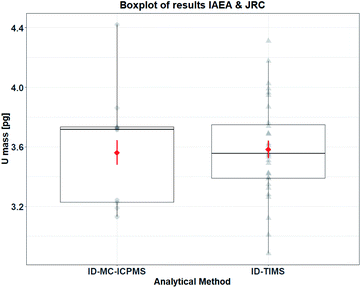
After the finalisation of the measurements by ID-MC-ICPMS at the IAEA-SGAS laboratory, the two results for the mass of uranium per particle determined by both approaches were compared. The comparison of these results is given in Table 7 and represented in a boxplot in Fig. 10.| U mass per IRMM-2329P particle | Mass [pg] | Combined uncertainty (k = 1) [pg] | Relative combined uncertainty |
|---|---|---|---|
| ID-TIMS reference value (JRC-Geel G.2) | 3.58 | 0.31 | 8.7% |
| ID-MC-ICPMS verification value (IAEA-SGAS) | 3.56 | 0.08 | 2.3% |
In order to compare both results for the uranium mass per particle a Welch's two-sample t-test was used. This is a statistical procedure that can be used to compare two mean estimates generated from normal distributions with unequal variances. The test was used in an approximate way for this study because the IAEA's estimate is a weighted mean and not the sample mean. Mathematical details about the calculation of this statistic and associated information can be found in Annex G of the GUM.16
Application of the procedure at the 5% significance level indicates that the two mean estimates are not significantly different (t = −0.2, 95% CI on the mean difference (−0.23 [pg], 0.19 [pg]), p = 0.84, νeff ≈ 19). A visual representation of the distribution of both measurement results and means is shown using a boxplot in Fig. 10. The IAEA dataset (ID-MC-ICPMS) is small in statistical terms being composed of only 10 measurements. Small random samples drawn from a normal distribution may appear very non-normal, due to sampling variation. Consequently, because of the small size of the IAEA dataset, there is insufficient statistical power to reject the possibility that the data are Gaussian distributed. Moreover, there is insufficient evidence to reject the assumption that both the single particle and 5-particle measurements yield the same U mass value on the average. To resolve this problem one should collect more measurements using methods from the statistical theory of experimental design.
Therefore, the agreement of both ID-TIMS and ID-MC-ICPMS results for the uranium mass per particle and their associated uncertainties demonstrated that the uranium particles reference material (IRMM-2329P) has been successfully certified for the uranium mass per particle in compliance with ISO 17034 and ISO Guide 35.6,7
Consequently, the value determined by ID-TIMS and verified by ID-MC-ICPMS was used for the certification of the uranium mass per particle in IRMM-2329P. For the final uncertainty on the uranium mass, the uncertainty contribution from the homogeneity study, as presented in Section 3.1.2, was added (Table 7).
4. Conclusions
The method of Kraiem et al. (2012) with SEM and ID-TIMS applied for particle analysis was improved and applied in this study for the certification of the IRMM-2329P particle reference material. Using micro-manipulation under an optical microscope to transfer particles from the graphite planchet is a more rapid process, and may easily be set up, compared to micro-manipulation combined with SEM. Moreover, compared to other methods (such as complete leaching of the particles from the planchets), the transfer under optical microscope combined with TIMS analysis reduces the possibility of contamination of the samples by natural uranium. Particles are picked-up directly from their original substrate (planchet) and transferred to pre-cleaned filaments or microscopy slides, before being dissolved with micro-volumes of acid solutions; thereby reducing the uranium background and possible sources of contamination from the substrate, from foreign particles and reagents. This improved method by ID-TIMS is therefore suitable for the determination of trace amount of uranium in particulate material. However, this analytical method using optical microscopy is only valid for a well-characterised and unique type/population of particles, as it is the case in this study. In the presence of mixed particles materials (e.g. mixed U and Pu particles), this method would have to be adapted accordingly, using the SEM technique to discriminate between the different types of particles.Moreover, this study provided sound evidence that the mass of uranium per particle derived from the ID-TIMS analyses is correct, since the analyses of the uranium particles using ID-MC-ICPMS at IAEA generated an independent estimate of the uranium mass per particle that was statistically indistinguishable with 95% confidence from the results determined using the ID-TIMS method.
Therefore, it confirmed that the use of ID-TIMS is suitable for the certification of the uranium amount per particle in reference materials for nuclear safeguards purposes, which can be then used for the determination of the useful yield during uranium isotopic measurements by LG-SIMS and other mass spectrometry techniques in particle analysis for safeguards purposes.
A new method for the determination of uranium amount in single and known number of particles using ID-MC-ICPMS was developed at IAEA-SGAS and successfully applied in the verification process of the uranium amount in pg quantities in the IRMM-2329P particle material. This study demonstrated that the ID-MC-ICPMS method, as described in this study, can therefore be used by laboratories in nuclear safeguards for the analysis of single uranium particles.
In the future, the measurement uncertainties of this method could be improved by using a 1013 ohm amplifier to measure the signal of 238U. Such amplifier would improve the signal to noise ratio by a factor three compared to a 1012 ohm amplifier (as used in this study) and would help to determine more accurately blank contribution. Since this study, measurements using a 1013 ohm amplifier have already been carried out at IAEA-SGAS and the results confirmed that the blank are determined more accurately at similar level of uranium amount.
When measuring uranium by ID-MC-ICPMS at levels lower than 10 ppt in clean laboratory environment, a thorough cleaning of the labware and of the high efficiency introduction system, as well as the purity of the reagents (Suprapur®) are essential. Moreover, it is crucial to screen all acid solutions and the freshly prepared spike solutions for impurities before adding them to the samples to be measured. However, with all precautions taken in this study, the natural uranium background observed was still of 1 pg. Hence reducing this contribution from natural uranium is also a key factor towards the successful application and improvement of this method at such low picogram amounts of uranium.
The uranium amount per particle and its associated uncertainty as quantified in this study in the particles reference material IRMM-2329P, was further confirmed during the Proficiency Test NUSIMEP-9 (Nuclear Signatures Inter-laboratory Measurement Evaluation Programme) organised by the JRC-Geel G.2 unit.20 One NUSIMEP-9 participating laboratory, expert in the field of particle analysis, using LG-SIMS and calibrating against a specific batch of microspheres CRM U020-A according to Ranebo et al.,21 determined the uranium amount per particle with a relative difference to the reference/certified value of only −0.6%.
The IRMM-2329P particle reference material, discussed in this paper, and certified for the uranium isotope amount ratios in particles and the uranium amount/mass per particle is now commercially available via the JRC-Geel's online CRM catalogue.22
Conflicts of interest
There are no conflicts to declare.Acknowledgements
The authors would like to acknowledge and thank Stephan Richter, Jan Truyens and Yetunde Aregbe at JRC-Geel G.2 for their contribution in the certification of the IRMM-2329P. Stephan Richter is also thanked for providing the TIMS method for particle analysis used in this study and for his support with performing the measurements. The authors are grateful to the JRC-Geel Reference Material Production Laboratory of the F.6 unit for giving us access to the FESEM facility, and in particular Giovani Kerckhove, for his help in the SEM analysis of the uranium particles. The authors are thankful to the team at Forschungszentrum Jülich Institute for Nuclear Waste Management and Reactor Safety, in particular Martin Dürr, for producing the different reference particles used in this paper. Stephan Vogt, Andreas Koepf, Sergei Bulyha, Lorenz Pelzmann, Urska Repinc, Beata Varga, Gary Eppich and Stephanie Konegger-Kappel at IAEA-SGAS are acknowledged for their technical advices during the setup of the project and method development of the MC-ICPMS; and Andreas Koepf, Manabu Hagiya and Monika Sturm at IAEA-SGAS for performing MTE/TIMS measurement. Finally, the authors are grateful to Steve Balsley at IAEA-SGAS for his helpful comments and review of the earlier version of this article.References
- L. Sangely, J. Poths, H. Siegmund, T. Tanpraphan, O. Bildstein, M. Aleshin and A. Schwanhäusser, ESARDA 37th Annual Meeting Proceedings, 2015, vol. 66, pp. 873–883 Search PubMed.
- F. Esaka, D. Suzuki and M. Magara, Anal. Chem., 2015, 87(5), 3107–3113 CrossRef CAS PubMed.
- N. S. Lloyd, R. R. Parish, M. S. A. Horstwood and S. R. N. Chenery, J. Anal. At. Spectrom., 2009, 24, 752–758 RSC.
- J. Truyens, M. Dürr, Z. Macsik, R. Middendorp, S. Neumeier, S. Richter, G. Stadelmann, C. Venchiarutti and Y. Aregbe, Certification report, EUR29840, 2020, DOI:10.2760/584367.
- S. Richter, C. Venchiarutti, C. Hennessy, U. Jacobsson, R. Bujak, J. Truyens and Y. Aregbe, J. Radioanal. Nucl. Chem., 2018, 318, 1359–1368 CrossRef CAS.
- ISO 17034:2016 General requirements for the competence of reference material producers, International Organization for Standardization, Geneva, Switzerland, 2016 Search PubMed.
- ISO Guide 35:2017 Reference materials – General and statistical principles for certification, International Organization for Standardization, Geneva, Switzerland, 2017 Search PubMed.
- R. Middendorp, M. Dürr, A. Knott, F. Pointurier, D. Ferreira Sanchez, V. Samson and D. Grolimund, Anal. Chem., 2017, 89(8), 4721–4728, DOI:10.1021/acs.analchem.7b00631.
- R. Middendorp, M. Klinkenberg and M. Dürr, J. Radioanal. Nucl. Chem., 2018, 318, 907–914 CrossRef CAS.
- ASTM Standard Document C1832, available through the ASTM website: https://www.astm.org/Standards/C1832.htm, last accessed on 09/10/2020.
- M. Kraiem, S. Richter, N. Erdmann, H. Kühn, M. Hedberg and Y. Aregbe, Anal. Chim. Acta, 2012, 748, 37–44 CrossRef CAS PubMed.
- R. Jakopic, S. Richter, H. Kühn, L. Benedik, B. Pihlar and Y. Aregbe, Int. J. Mass Spectrom., 2009, 279, 87–92 CrossRef CAS.
- P. De Bievre and H. S. Peiser, Fresenius' J. Anal. Chem., 1997, 359, 523–525 CrossRef CAS.
- S. Sakurai and S. Tachimori, J. Nucl. Sci. Technol., 1996, 33(2), 187–189, DOI:10.1080/18811248.1996.9731883.
- S. F. Boulyga, A. Koepf, S. Konegger-Kappel, Z. Macsik and G. Stadelmann, J. Anal. At. Spectrom., 2016, 31(11), 2272–2284, 10.1039/c6ja00238b.
- ISO/IEC Guide 98-3, Guide to the Expression of Uncertainty in Measurement (GUM, 1995), International Organization for Standardization, Geneva, Switzerland, 2008 Search PubMed.
- R. Middendorp, Synthesis and Stability Assessment of Uranium Micro Particles: Providing Reference Materials for Nuclear Safeguards, PhD thesis, Forschungszentrum Jülich GmbH, 2018.
- GUM Workbench Pro. Version: 2.4.1.458, Metrodata GmbH, Germany, 1996–2016, http://www.metrodata.be Search PubMed.
- M. H. Kutner, C. J. Nachtsheim, J. Neter and W. Li, Applied Linear Statistical Models, Mcgraw-Hill Irwin, 2005 Search PubMed.
- C. Venchiarutti, S. Richter, R. Middendorp and Y. Aregbe, JRC Scientific Report, EUR 29822 EN, 2019, DOI:10.2760/533028.
- Y. Ranebo, P. M. L. Hedberg, M. J. Whitehouse, K. Ingeneri and S. Littmann, J. Anal. At. Spectrom., 2009, 24(3), 277–287 RSC.
- JRC-Geel online CRM catalogue, https://crm.jrc.ec.europa.eu/e/4/How-to-order Search PubMed.
Footnote |
| † Electronic supplementary information (ESI) available. See DOI: 10.1039/d0ja00440e |
| This journal is © The Royal Society of Chemistry 2021 |

