
 Open Access Article
 This Open Access Article is licensed under a Creative Commons Attribution-Non Commercial 3.0 Unported Licence
‘Lignin and extractives first’ conversion of lignocellulosic residual streams using UV light from LEDs†
Jonna
Hynynen
*a,
Alexander
Riddell
a,
Abdenour
Achour
a,
Zoltan
Takacs
b,
Mats
Wallin
c,
Jim
Parkås
c and
Diana
Bernin
 *a
*a
aChemistry and Chemical Engineering, Chalmers University of Technology, Kemigården 4, 41296 Gothenburg, Sweden. E-mail: diana.bernin@chalmers.se
bSwedish NMR Centre, Gothenburg University, Medicinaregatan 5C, 41390 Gothenburg, Sweden
cSödra Skogsägarna ekonomisk förening, Innovation and New Business, 43286 Väröbacka, Sweden
First published on 17th September 2021
Abstract
Lignocellulosic biomass, especially lignin and extractives, has the potential to substitute fossil precursors in the chemical industry. The conversion of lignin has been intensively researched, but challenges remain as high temperatures and increased pressure are commonly used, which is not energy efficient. Lignin and wood extractives bear chromophoric groups that can absorb light in the ultraviolet (UV) region, which enables photochemical reactions. Ultraviolet light emitting diodes (UV-LEDs) are an emerging technology; they are cheap, versatile, and energy-efficient compared to existing mercury lamps. UV-LEDs were used in this study as a proof of concept for the valorisation of a lignocellulosic residual stream from the pulp and paper industry, sawdust. In a process at ambient temperature and pressure and without the use of a catalyst, we have shown that lignin and extractives can be valorised using light from UV-LEDs. Simplified lignin model compounds were used to pinpoint chemical reactions during irradiation, and to ease the analysis of the sawdust samples. The rate of conversion upon irradiation of the model compounds was found to be 0.7–2.3 g L−1 h−1, depending on the concentration of the starting compounds.
Introduction
In the transition from a fossil-based to a bio-based economy, biomass will play an important role in the production of platform chemicals, biomaterials and biofuels. Traditionally, the major value chain for the forest industry is pulp and paper and other paper-based products. Therefore, pulping methods such as alkaline cooking (kraft and soda) and sulphite cooking have been developed for more than 150 years to isolate the cellulose fibres. The process liquor in the kraft process—black liquor—contains the remaining wood components which are commonly burned to generate heat and energy for mills. Nevertheless, the recent focus on circularity and sustainability has advanced the recovery of lignin1 and wood extractives. A biorefinery can also increase its revenue if the valorisation of lignin—the largest renewable source of aromatics—is integrated as well.One solution could be to decouple lignin and wood extractives first, without impacting the quality of the cellulose fibres negatively: a ‘lignin and extractives first’ approach. This decoupling would enable further use of cellulose/hemicellulose in the paper and pulp process and simultaneously create an additional product stream containing lignin and extractives. It is of advantage to process and irradiate lignin (and extractives) in a one-step process to avoid an additional separation step.
The amount and type of lignin vary for gymnosperm and angiosperm trees and the chemical composition of an individual tree can be influenced by factors such as tree parts: bark, stem, or branch, the type of stemwood: sapwood or heartwood, the growth conditions, and the age of the tree. Lignin accounts for 15–30%2 of the dry weight, while the total amount of wood extractives is around 1–5%.3 Although this number might seem low compared to the cellulose content, Sweden alone produced 3.9 million tons of pulp and 10.1 million tons of paper in 2016.4
Despite the abundance of lignin and its potential importance in a bio-based economy, the only large-scale commercialisation of lignin as a monomeric precursor is in the production of vanillin from softwood lignosulfonate.5,6 Several technical barriers currently restrict further lignin utilisation. The recalcitrance of technical lignin obtained from pulping processes, such as the kraft process, increases the difficulty in the valorisation of lignin. Additionally, current lignin conversion processes often rely on high temperatures and high pressures, leading to high energy consumption and low selectivity, and requiring catalysts. The different fractionation processes and catalytic strategies are nicely summarised in a review by Sun et al.7 Photocatalytic valorisation and oxidative transformations of lignin and lignin model compounds have been extensively studied and can be found in the review articles by Xiang et al.,8 Li et al.,9 and Nwosu et al.10 to mention a few. Mechanistic insight into catalytic valorisation and oxidative transformations of lignin and model compounds can be found in the work by Zakzeski et al.2 and Lanzalunga and Bietti.11 However, studies regarding a ‘lignin first’, catalyst free approach using UV-LEDs have not been published to our knowledge.
UV light-induced degradation of lignin was reported in 2003 by Ksibi et al.12 They used titanium dioxide (TiO2) as a catalyst and UV light with λ ∼ 290 nm to degrade lignin from black liquor. Platform chemicals including vanillic acid, syringaldehyde and palmitic acid were present in the degradation products, suggesting the potential industrial usefulness of a light-driven depolymerisation process.
Although the use of UV light combined with catalysts such as TiO2 has shown success in depolymerising lignin, there are some drawbacks. For example, the catalyst may become deactivated by impurities such as minerals and organic acids in natural biomass and lignin also tends to form stable suspensions with the catalyst which makes the separation process difficult.
If a process could preserve the structure of native lignin, be performed under near ambient conditions, and avoid the use of catalysts, it could enable a more widespread lignin utilisation. Therefore, we here focus on a ‘catalyst-free lignin and extractives first’ approach driven by UV light from energy-efficient light emitting diodes (LEDs).
The generation of UV light by LEDs is a new and emerging technology13 and has several advantages compared to conventional mercury lamps. UV-LEDs dissipate less energy as heat, and are monochromatic, smaller in size, mechanically more robust, and commercially available in a range of different wavelengths. In terms of reactor design, LEDs would be easier to scale and can be easily oriented in any geometry for batch or continuous operation. Their high switching rates could potentially be useful in a scenario where it is necessary to adjust the regime of photon frequencies during the irradiation period. For these reasons, UV-LEDs could be relevant to the study of lignocellulosic biomass utilisation.
Here we present a ‘catalyst-free lignin and extractives first’ approach for the valorisation of lignin and production of biobased chemical precursors using energy-efficient UV-LEDs. The process uses a residual stream from the forest industry—sawdust—as the starting material and is performed at ambient pressure and temperature, reflecting ideal conditions for an energy-saving, circular process.
Results and discussion
In this study, we observed the conversion of softwood lignin and extractives initiated through UV light from LEDs. A schematic drawing of the process and possible extracted molecules—lignin, stilbenes, and fatty and resin acids—are shown in Fig. 1. | ||
| Fig. 1 Schematic drawing of softwood, here spruce. The different chemical units found in both soft- and hardwood and a schematic drawing of the photoreactor used herein. Common extractives and their chemical structures found upon solvent extraction of softwood include fatty acids (here linoleic acid), terpenoid resin acids (here dehydroabietic acid) and stilbenes (here pinosylvin). Structural units found in the lignin guaiacyl (G) unit (green), syringyl (S) unit (blue) and p-hydroxyphenyl propane (H) unit (red). Note: Softwood lignin consists almost exclusively of G units. | ||
Solvents used for extraction and irradiation experiments were selected after screening a variety of green solvents (ESI Fig. S1†). Solvents screened were chosen based on high UV transmission above 210 nm to enable the use of UV-vis spectroscopy as a tool to follow the reaction in solution and to reduce photon absorption by the solvent itself.
Acetonitrile and methanol—MeCN and MeOH—were chosen for their extraction efficiency and lower boiling point compared to water, ∼82 °C and ∼65 °C, respectively. The difference in relative polarity to water for MeCN and MeOH is 0.46 and 0.76, respectively.14 MeOH is a well-characterised solvent for the extraction of wood and can be used to solubilise lower molecular weight lignin with an number average molecular weight (Mn) of ∼1590–5200 g mol−1.15,16 MeCN has been less studied regarding the extraction of lignin but is of interest for its lower polarity which may aid in the extraction of some less polar extractives from softwood compared to MeOH.
However, upon irradiation at λ ∼ 265 nm, we noticed that MeOH was less stable towards irradiation than MeCN; formic acid (ESI Fig. S2†) and peroxides were found. We therefore used inductively coupled plasma (ICP) analysis to probe if photoactive metal ions such as Fe—that could initiate the Fenton-UV reactions—could be the reason for the formation of peroxides. ICP analysis did show a higher concentration of Mn ions in MeOH compared to MeCN (ESI Fig. S3†), which could be part of the reason for the peroxide formation. Another possible explanation could be that ketone impurities—acting as photosensitisers—initiated the peroxide formation. The complexity and manifold of reactions upon UV irradiation of MeOH and peroxides are nicely depicted in the work by Gonzalez et al.17 and as MeOH readily reacts with hydroxyl radicals resulting in a rather complex reaction path, we chose to work with MeCN. No peroxides were observed when irradiating solely MeCN or MeCN with the addition of water.
UV-vis spectroscopy is a simple but powerful tool to monitor the reaction of lignin and extractives due to the variety of chromophoric groups present. Different electronic transitions result in several absorption maxima and shoulders; a shoulder at ∼310 nm can be attributed to π → π* transitions in lignin units with Cα![[double bond, length as m-dash]](https://www.rsc.org/images/entities/char_e001.gif) Cβ linkages, which are conjugated with the aromatic ring, and n → π* transitions in lignin units containing CαO groups that are conjugated with the aromatic ring. The shoulder at ∼240 nm and the maximum at ∼280 nm originate from non-conjugated free and etherified hydroxyl groups, and a sharp peak at 200–210 nm corresponds to the π → π* transition in the aromatic rings (Fig. 2a).18 Extractives that contain similar chromophoric groups to lignin will also contribute to the absorption in the mentioned regions. The peak at 200 nm should be characterised with care as many acids (carbonyl group) also absorb light in this region.
Cβ linkages, which are conjugated with the aromatic ring, and n → π* transitions in lignin units containing CαO groups that are conjugated with the aromatic ring. The shoulder at ∼240 nm and the maximum at ∼280 nm originate from non-conjugated free and etherified hydroxyl groups, and a sharp peak at 200–210 nm corresponds to the π → π* transition in the aromatic rings (Fig. 2a).18 Extractives that contain similar chromophoric groups to lignin will also contribute to the absorption in the mentioned regions. The peak at 200 nm should be characterised with care as many acids (carbonyl group) also absorb light in this region.
 | ||
| Fig. 2 (a) General UV-vis absorption spectrum of softwood lignin indicating the different electronic transitions that can be found in the absorption spectra of lignin. (b) 1H NMR spectra for 2BP (blue) and 4BP (red). Their chemical structures are shown in the insets. | ||
Despite the simplicity of UV-vis spectroscopy it cannot be used for structural determination on the molecular scale, therefore nuclear magnetic resonance (NMR) spectroscopy was used. NMR observes the 1H spin and reports on its neighbouring spins, which is used for structure determination in small molecules as well as in larger proteins. Deuterated solvents are commonly used for NMR measurements; they dilute the 1H spins from the solvent and enable the observation of molecules present at low concentrations. Using (multiple-)solvent suppression19 permits the use of non-deuterated solvents, which makes it possible to monitor reactions at a larger scale. The NMR spectra and the assigned peaks for two simple and commercially available biphenols—aromatic rings connected through an ether bond similar to what is found in lignin—namely 2-benzyloxyphenol (2BP) and 4-benzyloxyphenol (4BP) are shown in Fig. 2b. The solvent signal, MeCN, which has been suppressed in our work arises at 2 ppm and the water signal appears at 2.2 ppm.
Simplified biphenolic lignin model substances
To study the effect of irradiation using our photoreactor set-up, we irradiated 2BP and 4BP with light from four LEDs (λ 265 (±7) nm). Assuming that λ ∼ 265 nm for the average photons entering the reaction volume, and using the intensity estimate from ferrioxalate actinometry (7.6 × 10⁻⁶ mol photons L−1s−1), the solution was irradiated with an optical power of approximately 70 mW. Samples were taken at different time intervals during irradiation to follow the reaction in time, using UV-vis spectroscopy and NMR. The representative UV-vis absorption spectra of 4BP and the colour change upon irradiation are shown in Fig. 3a (for the absorption spectra of 2BP, see ESI Fig. S4†). | ||
| Fig. 3 (a) Representative UV-vis spectra of 4BP 1 g L−1 in MeCN irradiated at λ ∼ 265 nm from 0 to 24 h. The inset in (a) presents the observed colour change with time for 0, 1, 4 and 24 h. (b) HSQC of 2BP (blue) and 4BP (red), left indicates the aromatic region and right indicates the region for aliphatic and/or oxidised structures. | ||
Using NMR, we noticed that the irradiation of 2BP resulted in aromatic and aliphatic oxidised products, whilst the irradiation of 4BP did not form a significant number of aliphatic products. The increase in aliphatic oxidised products was distinguished by an increased number of peaks in the region between 2 and 4 ppm for 1H NMR and 30 and 60 ppm for 13C NMR (Fig. 3b). The reason for this difference between 2BP and 4BP was that the para-substituted hydroxyl group in 4BP resulted in stable para-quinones, whilst the ortho-substituted quinones seem to be more prone to ring opening reactions; GC-MS chromatograms for 2BP and 4BP, and the formed aromatic products can be found in ESI Fig. S5.† Quinones are chromophoric structures which tend to be highly coloured and are found naturally in wood. Quinone concentration has been found to increase upon UV irradiation of wood.20
To investigate the rate of conversion of the starting compounds—2BP and 4BP—we performed two separate time studies with varying concentration of each compound, 1 g L−1 and 10 g L−1. NMR was used to estimate the rate of conversion. The aliphatic protons next to the ether bond have a distinct chemical shift not present or obstructed by other peaks in the spectra as the reaction prolongs. The peak appears at 5.17 ppm for 2BP and at 5.03 ppm for 4BP (Fig. 2b). For the lower concentration samples (1 g L−1), 50% conversion was reached within the first 30 min. On increasing the concentration to 10 g L−1, 50% conversion was reached in approximately 3 h. This results in a rate of conversion of 0.7–0.8 and 1.8–2.3 g L−1 h−1 for 2BP and 4BP at a concentration of 1 g L−1 or 10 g L−1, respectively (ESI Fig. S6†). We also noticed that by lowering the concentration of the model compound—using 1 g L−1 instead of 10 g L−1—we could decrease the formation of condensed products upon irradiation according to GC-MS (ESI Fig. S5c†).
Irradiation of 1-(4-hydroxy-3-methoxyphenyl)-2-(2-methoxyphenoxy)-1,3-propanediol (guaiacylglycerol-β-guaiacyl ether)—a more complex model compound—was also performed. Irradiation resulted in the cleavage of the ether bond between the two phenolic units. NMR spectra and the products formed upon irradiation of guaiacylglycerol-β-guaiacyl ether are found in ESI Fig. S7.† The use of simplified lignin model compounds will not be representative for the sawdust samples. However, these results prove that the ether bond is susceptible towards UV light λ ∼ 265 nm. The use of model compounds eased the analysis of the nature of the formed products for the sawdust samples, described later in the text.
Lignin and extractives in sawdust
To study the effect of UV light on the sawdust samples, we first had to extract the sawdust in MeCN. The time of extraction after dispersive-mixing had a minor effect on the concentration of UV absorbing solutes, such as lignin, which suggests that most of the accessible compounds were extracted during the solvent-sawdust-mixing step (ESI Fig. S8†). A portion of the mixture was filtered, dried, and weighed resulting in a solid fraction of approximately 1 g L−1 of lignin and extractives.Solvent extraction of native lignin has been studied since the mid 1900s21–24 and could be made more efficient by addition of organic acids, or using solvent combinations of water with dioxane, alcohols or acetone. The lignin extraction efficiency varies depending on the method used and can range from 15 to 70% when optimised.25 The optimisation of the extraction process has not been the focus of this study.
Upon irradiation we observed a change of the colour of the reaction solution. The solution started to turn slightly yellow after one hour of irradiation and thereafter became transparent again after 24 h (Fig. 4a, inset), unlike the model compounds that stayed coloured throughout the reaction. These colour changes are ascribed to changes in the chromophoric structures of lignin and have been extensively studied since the 19th century, relating to the photo-yellowing of paper. A review of the topic can be found in the work by Paulsson and Parkås.26
 | ||
| Fig. 4 (a) Representative UV absorption spectra of softwood extracted with MeCN and irradiated at λ ∼ 265 nm from 0 to 72 h (light grey). (b) Changes in the peak maximum—the maximum peak absorbance is normalised to 1—as a function of time. Peak maxima 200 (square), 233 (circle) and 279 nm (triangle); the dashed line is added to guide the eye. The inset in (a) presents the observed colour change with time. | ||
The absorption spectra showed a sharp decrease in the absorption maximum for all peak maxima in the first five hours of irradiation and thereafter the rate was levelled off (Fig. 4b). The decay of absorbance is indicative of the loss of chromophoric groups such as phenolic units in lignin. The peak at 233 nm has a different time dependence compared to the peaks at 200 and 279 nm. This is due to a shift in the peak position as the shoulder at 233 nm shifts to a lower wavelength after one hour of the reaction. The peak shape and positions are sensitive to pH and ionisation,27,28 and are also affected by changes in conjugation that can arise upon molecular rearrangements. These are affected by solute–solvent interactions—so called solvatochronism—and are a result of hydrogen bonding or dielectric effects that may change as the reaction proceeds. Since our reaction mixture contains a variety of different compounds, it is hard to draw any detailed conclusions solely from the absorption spectra.
After 72 h of irradiation, the absorption spectrum is almost completely featureless (Fig. 4a, light grey). Some absorption with maxima below 200 nm is still present, most likely resulting from different acids such as acetic acid29 and formic acid;30 the formation of formic acid was further confirmed by NMR spectroscopy. Peroxides also absorb light at ∼200 nm;31 a detectable amount, <1 mg L−1, was detected after four hours of irradiation. A recent study by Miglbauer et al.32 has shown that lignin itself can produce hydrogen peroxide (H2O2) upon UV irradiation, which could indicate that lignin moieties in our system are initiating the peroxide formation upon UV irradiation.
The nature of the extracted molecules was analysed by NMR spectroscopy. Peaks at their corresponding NMR chemical shifts reported in the literature are commonly assigned in deuterated dimethyl sulfoxide (DMSO-d6), a typical organic NMR solvent which has not been used for this study. Therefore, we cannot directly compare our chemical shifts with common databases which hampers the specific assignment of individual molecules. However, products such as aldehydes and acids found for the irradiated model compounds—2BP and 4BP—using GC-MS and NMR were used to interpret the NMR spectra for the sawdust samples (Fig. 5a).
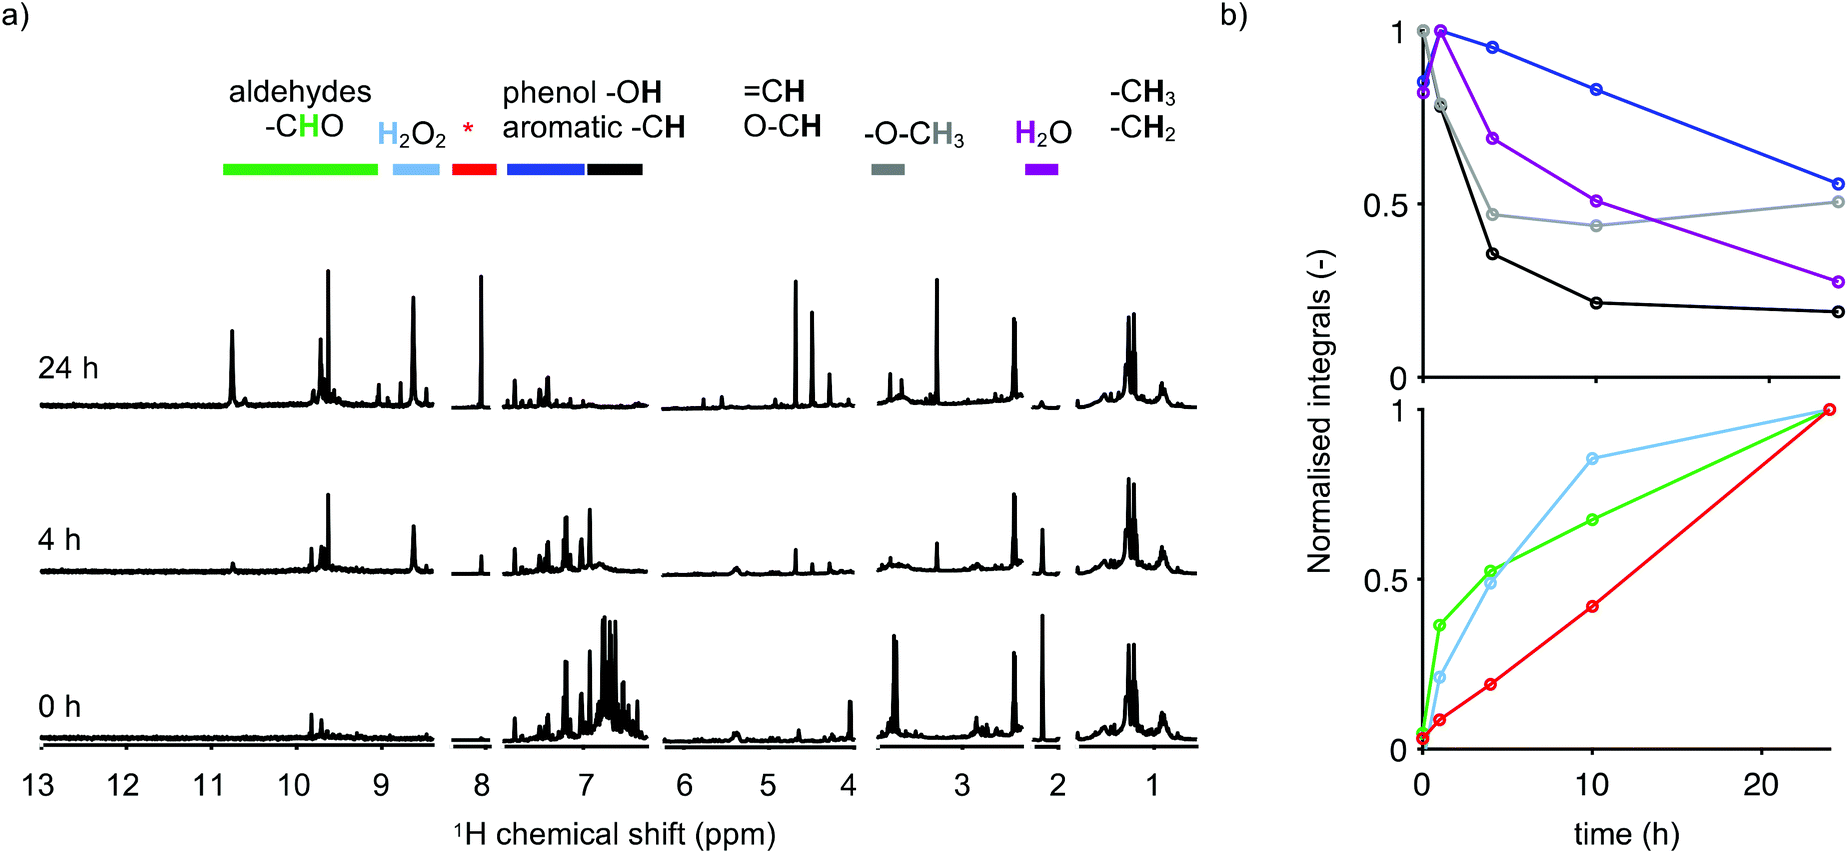 | ||
| Fig. 5 1H NMR spectra (a) for 0, 4 and 24 h in MeCN. The intensity of the regions is scaled differently. Changes in the peak integral—the maximum peak integral is normalised to 1—colour-coded by the regions highlighted in (a) and as a function of time (b). The peaks close to 8 ppm, highlighted in red and with an asterisk, arise from formic acid and from aromatic protons adjacent to a carboxylic acid group like in benzoic acid. | ||
To obtain the trends in the formed products as a function of time, we chose to divide the NMR spectra into spectral regions characteristic of specific chemical functional groups. For the control sample (Fig. 5a, 0 h), peaks found between 0 and 2 ppm are assigned to the aliphatic region, which represents signals from fatty and resin acids. The peaks around 3.8 ppm, highlighted in grey, are assigned to aromatic methoxy substituents. In the region between 5 and 6 ppm, signals from molecules with double bonds such as fatty acids or di-/monoterpenoids33 become visible. Peaks found between 6 and 8 ppm are characteristic of aromatic molecules, indicating the presence of lignin and most likely also some terpenoids such as dehydroabietic acid, which has three chemical shifts above 7 ppm.34 Aldehydes are present in the region between 9 and 11 ppm, highlighted in green. The spectra lack features of celluloses and hemicelluloses which are usually found between 2.5 and 5.5 ppm (ref. 35 and 36), indicating that neither cellulose nor hemicellulose was extracted using MeCN at room temperature (Fig. 5a). Exchangeable protons found in amines, acids, phenols, or alcohols have chemical shifts that vary strongly with the proton exchange rate, which in turn is dependent on the solvent, pH and water content and they are therefore difficult to assign.37 From the simplified model substances, we observed that the phenolic hydroxyl groups appear between 6 and 7 ppm (Fig. 2b).
Another established NMR tool to characterise lignin and wood extractives is 31P NMR spectroscopy, which relies on the reaction of a phosphor containing reagent—TMDP—with the hydroxyl groups that are present in phenols, alcohols, and acids.38–40 We performed 31P NMR spectroscopy on the extracted molecules in MeCN and found typical 31P chemical shifts of the hydroxyl groups of guaiacyl units, which are predominant in softwood. Except for formic acid and other organic acids, the phosphitylated carboxylic hydroxyl groups are positioned between 134.3 and 134.9 ppm, whilst the aromatic carboxylic acid peaks are found at 135.0–136.0 ppm,41 indicating that we have both aromatic and aliphatic carboxylic acids before irradiation. The ratio of the integral regions of the aliphatic-, guaiacyl-, and acidic hydroxyl groups is 0.38, 0.31, and 0.31. Cellulose and hemicellulose peaks in the aliphatic hydroxyl region 145–149 ppm (ref. 41) were absent in the 31P NMR spectra, confirming our findings (ESI Fig. S9†).
To monitor the changes in chemical functional groups upon irradiation, the NMR spectra were integrated. The maximum peak integrals for the different regions of the spectrum were normalised to 1, and the normalised peak integral was plotted against the time of irradiation, presented in Fig. 5b. The aromatic region has been divided into two regions to ease the interpretation based on the NMR assignments of the simplified model substances. The region between 7 and 8 ppm, which corresponds to aromatic protons found on aromatic rings with low substitution, is highlighted in blue and the region between 6 and 7 ppm, corresponding to aromatic protons with higher substitution as well as phenolic hydroxyl groups, is highlighted in black. The peaks close to 8 ppm, highlighted in red, arise from formic acid and from aromatic protons adjacent to a carboxylic acid group like in benzoic acid. H2O2 gives rise to a peak at 8.6 ppm, and it is highlighted in light blue.
Peaks in the aromatic region between 6 and 7 ppm, which includes peaks from the guaiacyl units, vanish first, while the peaks in the region attributed to aromatic rings having a lower substitution decrease slower. The decay of the peaks highlighted in black coincided with the decay of the methoxy peaks (grey). This could be an indication that we have ring opening reactions and/or demethoxylation, resulting in the formation of methanol, the peak close to 3.3 ppm. This would leave a catechol structure behind that could be further oxidised into an ortho-quinone, similar to what was found for the model compounds. However, the detection of quinones is not straightforward as the concentration tends to be low and because the absorption usually overlaps with those of other chromophores present in wood extractives. No pronounced absorption maxima above 350 nm were found, where the absorption of quinones is usually detected.42,43
Simultaneously, peaks in the aldehyde (green) and acid (red) regions increase, which again indicates that the phenolic units are converted into aromatic acids and aldehydes.
We performed 31P NMR spectroscopy on the 24 h irradiated sample (ESI Fig. S9†). The phenolic hydroxyl peaks vanish upon irradiation, which further confirms that the phenolic rings in lignin are involved in the reaction. The aliphatic carboxylic acid region—134–135 ppm—has new peaks, whilst the peaks in the aromatic carboxylic acid region—135–136 ppm—decreased. The ratio of the integrated regions of the aliphatic-, guaiacyl-, and acidic hydroxyl groups changed to 0.42, 0.04, and 0.54, a significant decrease in phenolic hydroxyl groups and an increase in aliphatic carboxylic acids.
Formic acid is commonly found as a dominant product when lignin is oxidised by H2O2 in an acidic environment.44 Using NMR spectroscopy we observed a steady formation of H2O2 (Fig. 5a, light blue) up to 24 h of irradiation. Formic acid itself has shown potential to depolymerise oxidised lignin in the work by Rahimi et al. According to the authors this process was found to be redox neutral with no net consumption of formic acid.45
When H2O2 is present in formic acid solutions, peroxy-formic acid is formed. Peroxyacids are strong oxidants. Other strong oxidants such as reactive oxygen species (singlet oxygen) are most likely also found upon irradiation since the reaction is performed under ambient conditions. The reaction of strong oxidants with lignin units can lead to ring opening reactions, resulting in different aliphatic acids.46,47 The formation of quinones and ring opening reactions were further confirmed using the model substances 2BP and 4BP, described earlier in the text.
Conclusions
We presented here a ‘catalyst-free value-added first’ approach to convert sawdust extractives into oxidised small molecules based on UV light. Our focus has been to develop a chemical conversion process that is implementable in pulp and paper mills without the need for catalysts, high temperatures and/or increased pressure. UV-LEDs are energy-saving and monochromatic and enable a flexible design in comparison to mercury lamps.Cellulose and hemicellulose were not extracted using MeCN, which enables further processing of these, and indicates a ‘lignin and extractives first’ method.
Irradiation of the simplified lignin model compounds indicated that the ether bond between two aromatic units—also present in lignin—is sensitive towards irradiation at λ ∼ 265 nm. Moreover, the placement of the hydroxyl substituent—i.e. ortho or para—dictates the formed products. For the ortho-substituted 2BP, ring opening reactions resulting in aliphatic acids occurred instantly, while the para-substituted 4BP formed stable para-quinones and did not produce a substantial number of aliphatic products. Condensation reactions found when irradiating the model compounds could be decreased using a lower concentration of the starting compound.
Our results suggest that UV-LEDs could be used to develop an energy-efficient ‘lignin- and extractives-first’ process. However, strategies that hinder full oxidation, like using pulsed light or a continuous flow process, should be prioritised to enable the separation of monomeric aromatic molecules. The challenge ahead is to control and steer the reaction to enable a controlled production of both aromatic and aliphatic biobased chemicals.
Experimental
Materials
Softwood sawdust containing pine (Pinus sylvestris) and spruce (Picea abies) was received from Södra Cell Värö, Varberg, Sweden. Methanol (MeOH) (Merck; purity >99.8%); acetonitrile (MeCN) (Fisher Chemical; purity >99.99%); deuterated MeCN (CD3CN) and MeOH (CD3OH) were purchased from Sigma Aldrich (purity >99.0%). Model compounds 2-benzyloxyphenol (2BP, purity >96%) and 4-benzyloxyphenol (4BP, purity >98%) were purchased from Sigma Aldrich. All chemicals were used without further purification.Sample preparation
Sawdust (particulate size mm to cm range) was dried at 70 °C for ∼12 h and thereafter milled using a grinder (OBH Nordica 2393). Sieved particles (<500 μm) were dispersed using an Inter Med Disp 25 mixer in a solvent (∼50 g L−1 in MeCN or MeOH). A solution without sawdust (20 mL sawdust–solvent mixture was filtered using a 50 μm polypropylene filter) was used for irradiation studies. During irradiation the reaction mixture was stirred continuously using a magnetic stirrer/stir plate and irradiated using a homebuilt photoreactor (Fig. 1 and description below) with UV light λ ∼ 265 nm at room temperature (∼19 °C). An aliquot of the reaction mixture was stirred without irradiation (control sample). Reaction mixtures were pipetted and filtered using a 0.2 μm polytetrafluoroethylene filter into a clean vial for further analysis.Peroxides formed upon irradiation were semi-quantitatively determined using Quantofix® peroxide test sticks.
Model compounds 2- and 4-benzyloxyphenol (2BP and 4BP) were dissolved in 20 mL of MeCN at concentrations of 1 and 10 g L−1 and irradiated using the same procedure as for the sawdust samples.
Samples for 31P nuclear magnetic resonance (NMR) spectroscopy were prepared according to ref. 40 using 2-chloro-4,4,5,5-tetramethyl-1,3,2-dioxaphospholane (TMDP) as the reagent, and no internal standard was used. Samples were dried using a flow of nitrogen gas before derivatisation.
Photoreactor
The photoreactor setup, depicted in Fig. 1, was built using four 60 mW (at 0.5 A) UV-LEDs (KL265-50U-SM-WDM1, Crystal IS, US) powered in parallel at 7.6 V-DC having an intensity of 265 (±7) nm. The LED power was kept constant in all experiments and all photoreactions were performed under ambient conditions in a standard fume hood. The LEDs are mounted on a heatsink and cooled with an air flow and the reaction was performed in a quartz beaker (25 mL) with continuous stirring using a magnetic stirrer. The quartz beaker was covered with aluminium foil during the reaction. Upon irradiation the temperature of the reaction mixture was increased from 19 to 22 °C in 24 h.Characterisation
To quantify the reactor light intensity, potassium ferrioxalate actinometry was performed following the procedure of Murov et al.48 An average intensity of 7.6 × 10⁻⁶ mol of photons L−1 s−1 (±12.3%) was calculated from the absorbance differences at 510 nm between the irradiated samples and the non-irradiated “blanks”. Measurements were taken at irradiation times of 30 s, 45 s, and 60 s to confirm a linear relationship between the absorbance of the actinometer solutions and irradiation time. A total of five measurements were taken to obtain a mean and standard deviation for our reactor setup.Inductively coupled plasma (ICP) analysis was performed on sawdust extracted in MeOH and MeCN. The mixture was filtered using a 0.2 μm PTFE filter, and the solvent fraction was sent for ICP analysis to ALS Scandinavia, Luleå. ICP-SFMS was performed according to SS EN ISO 17294-2:2016 and EPA-method 200.8:1994. ICP-AES was performed according to SS EN ISO 11885:2009 and EPA-method 200.7:1994.
Ultraviolet–visible (UV-vis) light absorption spectroscopy was performed using a GBC 900 spectrophotometer. Solution absorption spectra were recorded using quartz cuvettes (path length 10 mm) and spectra were recorded between 450 and 190 nm at a speed of 300 nm min−1 with a slit width of 2 nm.
1H NMR spectra were recorded on a Bruker Avance III HD (700 MHz 1H) equipped with a QCI cryoprobe. The temperature was set to 25 °C. 1D spectra were recorded with a repetition delay of 3 s and the signal was accumulated 64 times.
Single solvent suppression was achieved using the watergate49 method. For double solvent suppression the excitation sculpting principle was utilised according to Parella et al.50 The shaped pulses in both methods were of sinc type and were generated by WAVEMAKER.51
31P NMR spectra were obtained on a Bruker Avance III HD (600 MHz 1H) equipped with a BBI probe. A single pulse experiment with a repetition delay of 15 s was performed at 25 °C. The signal was accumulated 320 times. An exponential line broadening of 10 Hz was applied and a baseline correction prior to integration was carried out.
All samples for nuclear magnetic resonance (NMR) spectroscopy were prepared in non-deuterated solvents (900 μL of sample) with the addition of a deuterated solvent (100 μL) to each sample.
Gas chromatography-mass spectrometry (GC-MS) was performed using an Agilent 7890A and Agilent 5975C; the column used was a HP-5MS, Agilent Technologies. Helium was used as the carrier gas with the flow rate of 1 mL min−1, an injection volume of 1 μL, a split ratio of 19![[thin space (1/6-em)]](https://www.rsc.org/images/entities/char_2009.gif) :1, and an injection temperature of 300 °C. The starting temperature of the oven was 70 °C, maintained for 2 min and then ramped to 275 °C at 20 °C min−1, and the final temperature was kept for 10 min. The MS system was operated at 230 °C and the quadrupole temperature was set at 150 °C. Identification was made using the NIST MS Search Program (Version 2.2) and the library NIST/EPA/NIH Mass Spectral Library (NIST 11).
:1, and an injection temperature of 300 °C. The starting temperature of the oven was 70 °C, maintained for 2 min and then ramped to 275 °C at 20 °C min−1, and the final temperature was kept for 10 min. The MS system was operated at 230 °C and the quadrupole temperature was set at 150 °C. Identification was made using the NIST MS Search Program (Version 2.2) and the library NIST/EPA/NIH Mass Spectral Library (NIST 11).
Author contributions
J. H. and D. B. conceptualised the idea. J. H., A. R., Z. T. A. A. and D. B. performed and analysed the experiments. All were involved in the discussions. J. H. wrote the draft and A. R., J. P., A. A. and D. B. reviewed and edited the draft.Conflicts of interest
There are no conflicts to declare.Acknowledgements
We thank Erik Alksnis for the assistance with the photoreactors, Jesper Nilsson for the initial measurements, Anders Ahlbom for help with the GC-MS measurements, Shiming Li for the synthesis of guaiacylglycerol-β-guaiacyl ether, Bengt Andersson for valuable discussions and input and the Swedish NMR Centre for spectrometer time. We acknowledge the funding from Södra's forskningsstiftelse (2019-102, 2020-168), the Swedish Research Council (2019-04066) and Åforsk (19-597).References
- W. Schutyser, T. Renders, S. Van den Bosch, S.-F. Koelewijn, G. T. Beckham and B. F. Sels, Chem. Soc. Rev., 2018, 47, 852–908 RSC.
- J. Zakzeski, P. C. A. Bruijnincx, A. L. Jongerius and B. M. Weckhuysen, Chem. Rev., 2010, 110, 3552–3599 CrossRef CAS PubMed.
- J. Routa, P. Anttila and A. Asikainen, Wood extractives of Finnish pine, spruce and birch – availability and optimal sources of compounds: A literature review, 2017 Search PubMed.
- R. Almqvist and J. Molinder, Extractives in the Scandinavian pulp and paper industry. Processum part of RI.SE, 2018 Search PubMed.
- B. Kaur and D. Chakraborty, Appl. Biochem. Biotechnol., 2013, 169, 1353–1372 CrossRef CAS PubMed.
- M. Fache, B. Boutevin and S. Caillol, ACS Sustainable Chem. Eng., 2016, 4, 35–46 CrossRef CAS.
- Z. Sun, B. Fridrich, A. De Santi, S. Elangovan and K. Barta, Chem. Rev., 2018, 118, 614–678 CrossRef CAS PubMed.
- Z. Xiang, W. Han, J. Deng, W. Zhu, Y. Zhang and H. Wang, ChemSusChem, 2020, 13, 4199–4213 CrossRef CAS PubMed.
- S.-H. Li, S. Liu, J. C. Colmenares and Y.-J. Xu, Green Chem., 2016, 18, 594–607 RSC.
- U. Nwosu, A. Wang, B. Palma, H. Zhao, M. A. Khan, M. Kibria and J. Hu, Renewable Sustainable Energy Rev., 2021, 148, 111266 CrossRef CAS.
- O. Lanzalunga and M. Bietti, J. Photochem. Photobiol., B, 2000, 56, 85–108 CrossRef CAS.
- M. Ksibi, S. Ben Amor, S. Cherif, E. Elaloui, A. Houas and M. Elaloui, J. Photochem. Photobiol., A, 2003, 154, 211–218 CrossRef CAS.
- Y. Muramoto, M. Kimura and S. Nouda, Semicond. Sci. Technol., 2014, 29, 084004 CrossRef CAS.
- C. Reichardt and T. Welton, Solvents and Solvent Effects in Organic Chemistry, 4th edn, 2010 Search PubMed.
- T. Saito, J. H. Perkins, F. Vautard, H. M. Meyer, J. M. Messman, B. Tolnai and A. K. Naskar, ChemSusChem, 2014, 7, 221–228 CrossRef CAS PubMed.
- E. Hiltunen, L. Alvila and T. T. Pakkanen, Wood Sci. Technol., 2006, 40, 575–584 CrossRef CAS.
- M. C. Gonzalez, G. C. Le Roux, J. A. Rosso and A. M. Braun, Chemosphere, 2007, 69, 1238–1244 CrossRef CAS PubMed.
- Y. Lu, Y. C. Lu, H. Q. Hu, F. J. Xie, X. Y. Wei and X. Fan, J. Spectrosc., 2017, 2017, 8951658 Search PubMed.
- T. L. Hwang and A. J. Shaka, J. Magn. Reson., Ser. A, 1995, 112, 275–279 CrossRef CAS.
- U. Müller, M. Rätzsch, M. Schwanninger, M. Steiner and H. Zöbl, J. Photochem. Photobiol., B, 2003, 69, 97–105 CrossRef.
- J. M. Pepper, P. E. T. Baylis and E. Adler, Can. J. Chem., 1959, 37, 1241–1248 CrossRef CAS.
- F. E. Brauns, J. Am. Chem. Soc., 1939, 61, 2120–2127 CrossRef CAS.
- A. Björkman, Nature, 1954, 1057–1058 CrossRef.
- A. Björkman, Sven. Papperstidn., 1956, 59, 477–485 Search PubMed.
- D. Huang, R. Li, P. Xu, T. Li, R. Deng, S. Chen and Q. Zhang, Chem. Eng. J., 2020, 402, 126237 CrossRef CAS.
- M. Paulsson and J. Parkås, BioResources, 2012, 7, 5995–6040 CrossRef.
- O. Goldschmid, J. Am. Chem. Soc., 1953, 75, 3780–3783 CrossRef CAS.
- G. Aulin-Erdtman, R. Sandén, J. Krogh-Moe, U. Schwieter and J. Paasivirta, Acta Chem. Scand., 1968, 22, 1187–1209 CrossRef CAS.
- S. Beisl, M. Binder, K. Varmuza, A. Miltner and A. Friedl, ChemEngineering, 2018, 2, 45 CrossRef CAS.
- H. C. Ramsperger and C. W. Porter, J. Am. Chem. Soc., 1926, 48, 1267–1273 CrossRef.
- I. M. Piskarev, High Energy Chem., 2018, 52, 212–216 CrossRef CAS.
- E. Miglbauer, M. Gryszel and E. D. Głowacki, Green Chem., 2020, 22, 673–677 RSC.
- K. Ioannidis, E. Melliou and P. Magiatis, Molecules, 2019, 24, 1–7 CrossRef PubMed.
- M. Nesterova, P. F. Cobra and J. L. Markley, BMRB entry bmse001287.
- M. Gunnarsson, M. Hasani and D. Bernin, Cellulose, 2019, 26, 9413 CrossRef CAS.
- L. Härdelin, D. Bernin, M. Börjesson, A. Ström and A. Larsson, Biomacromolecules, 2020, 5, 1832–1840 CrossRef PubMed.
- P. Charisiadis, V. G. Kontogianni, C. G. Tsiafoulis, A. G. Tzakos, M. Siskos and I. P. Gerothanassis, Molecules, 2014, 19, 13643–13682 CrossRef PubMed.
- M. Balakshin and E. Capanema, J. Wood Chem. Technol., 2015, 35, 220–237 CrossRef CAS.
- S. Constant, H. L. J. Wienk, A. E. Frissen, P. de Peinder, R. Boelens, D. S. van Es, R. J. H. Grisel, B. M. Weckhuysen, W. J. J. Huijgen, R. J. A. Gosselink and P. C. A. Bruijnincx, Green Chem., 2016, 18, 2651–2665 RSC.
- X. Meng, C. Crestini, H. Ben, N. Hao, Y. Pu, A. J. Ragauskas and D. S. Argyropoulos, Nat. Protoc., 2019, 14, 2627–2647 CrossRef CAS PubMed.
- M. Li, C. G. Yoo, Y. Pu and A. J. Ragauskas, ACS Sustainable Chem. Eng., 2018, 6, 1265–1270 CrossRef CAS.
- T. Pääkkönen, T. Liitiä, T. Tamminen and A.-S. Jääskeläinen, 11th Eur. Work. Lignocellul. Pulp (EWLP). Hamburg, Ger. 16–19 Aug. 2010.
- N. El-Najjar, H. Gali-Muhtasib, R. A. Ketola, P. Vuorela, A. Urtti and H. Vuorela, Phytochem. Rev., 2011, 10, 353 CrossRef CAS.
- Q. Xiang and Y. Y. Lee, Appl. Biochem. Biotechnol., Part A, 2000, 84–86, 153–162 CrossRef CAS.
- A. Rahimi, A. Ulbrich, J. J. Coon and S. S. Stahl, Nature, 2014, 515, 249–252 CrossRef CAS PubMed.
- I. Hasegawa, Y. Inoue, Y. Muranaka, T. Yasukawa and K. Mae, Energy Fuels, 2011, 25, 791–796 CrossRef CAS.
- Y.-P. Sun, K. L. Nguyen and A. F. A. Wallis, Holzforschung, 1998, 52, 61–66 CrossRef CAS.
- S. L. Murov, I. Carmichael and G. L. Hug, Handbook of Photochemistry, CRC Press, 2nd edn, 1993, pp. 298–305 Search PubMed.
- M. Piotto, V. Saudek and V. Sklenář, J. Biomol. NMR, 1992, 2, 661–665 CrossRef CAS PubMed.
- T. Parella, P. Adell, F. Sánchez-Ferrando and A. Virgili, Magn. Reson. Chem., 1998, 36, 245–249 CrossRef CAS.
- Ē. Kupče and R. Freeman, J. Magn. Reson., Ser. A, 1993, 105, 234–238 CrossRef.
Footnote |
| † Electronic supplementary information (ESI) available. See DOI: 10.1039/d1gc02543k |
| This journal is © The Royal Society of Chemistry 2021 |