
 Open Access Article
 This Open Access Article is licensed under a
 Creative Commons Attribution 3.0 Unported Licence
Hydroxyl-group-modified polymeric carbon nitride with the highly selective hydrogenation of nitrobenzene to N-phenylhydroxylamine under visible light†
Linjuan
Pei‡
 ab,
Hao
Tan‡
ab,
Meixian
Liu
ab,
Ruiyi
Wang
a,
Xianmo
Gu
*a,
Xuebin
Ke
*c,
Jianfeng
Jia
*d and
Zhanfeng
Zheng
*ab
ab,
Hao
Tan‡
ab,
Meixian
Liu
ab,
Ruiyi
Wang
a,
Xianmo
Gu
*a,
Xuebin
Ke
*c,
Jianfeng
Jia
*d and
Zhanfeng
Zheng
*ab
aState Key Laboratory of Coal Conversion, Institute of Coal Chemistry, Chinese Academy of Sciences, Taiyuan 030001, China. E-mail: zfzheng@sxicc.ac.cn; guxm@sxicc.ac.cn
bCenter of Materials Science and Optoelectronics Engineering, University of Chinese Academy of Sciences, Beijing 100049, China
cDepartment of Chemical Engineering, University of Hull, HU6 7RX, UK. E-mail: x.ke@hull.ac.uk
dThe School of Chemical and Material Science, Shanxi Normal University, Linfen, Shanxi 041004, PR China. E-mail: jiajf@dns.sxnu.edu.cn
First published on 12th April 2021
Abstract
Regulating the surface properties of catalysts to control the selectivity of a reaction is a fascinating approach. Bulk polymeric carbon nitride exhibits a poor N-phenylhydroxylamine yield in nitrobenzene reduction reaction mainly due to the uncontrollable condensation side reactions. Thus, adjusting the structure of the catalyst was key to solving the above issue. Herein, –OH groups-modified polymeric carbon nitride was prepared via a simple hydrothermal treatment. With the introduced –OH groups replacing the terminal amino groups (–NH2) at the surface of the polymeric carbon nitride, a 3-fold increase in reaction rate was achieved, along with a high selectivity toward N-phenylhydroxylamine (ca. 80%). The introduced –OH group was found to be beneficial to the adsorption of the nitrobenzene, based on the density functional theory (DFT) calculation. It could also lower the recombination rate of photoinduced electron–hole pairs, which would accelerate the photocatalytic oxidation of isopropanol and supply more protons to participate in the hydrogen-transfer process. Moreover, the elevated conduction band position after –OH modification would provide high energetic photogenerated electrons to promote the reduction of nitrobenzene. These are all important to guarantee the highly selective production of N-phenylhydroxylamine. This paper not only provides a simple and green approach for the modification of polymeric carbon nitride toward an efficient photocatalyst, but also sheds light on the further study of the selective hydrogenation.
1. Introduction
N-Phenylhydroxylamine (PHA) is an important intermediate to prepare pharmaceuticals, such as acetaminophen and pyraclostrobin.1 It is well known that the reduction of nitrobenzene (NB) goes via complex reduction processes.2,3 The side reactions, such as the generation of coupling products and the overreduction to aniline (ANL), make it difficult to realize the high selectivity toward PHA (Scheme 1).4–7 PHA is usually acquired via the chemical reduction of NB by stoichiometric zinc powder, which results in the discharging of metal wastes and environmental disruption.8,9 In recent years, reports on the heterogeneous catalytic selective synthesis of PHA have been explored and mostly focused on the electronic effects of the modifier, such as amine-modified Pt nanowires,5 Au nanoparticles stabilized by phosphine-decorated polymer immobilized ionic liquids,10 and perfluoroalkyl-modified cellulose-supported ultrasmall Pd nanoparticles,11 which cause a significant difference in the adsorption strength of electron-deficient NB and electron-rich PHA. From the perspective of kinetics, PHA is an intermediate during the continuous hydrogenation from NB to ANL, in which the reduction from PHA to ANL is rate-limiting during the whole process.12 In this case, it would be likely to realize the accumulation of PHA via collaborative means, i.e., by increasing the production rate of PHA and curbing its further conversion simultaneously. According to the literature, the high production rate of hydrogen species is a key factor for the rapid conversion of NB.13 Alkaline conditions are always necessary to abstract hydrogen fluently from proton donors, such as isopropanol (IPA). However, the alkaline condition results in the inevitable condensation side reaction and a poor yield of PHA.14 Furthermore, PHA is prone to convert to ANL under acidic conditions.15,16 Then, designing a specific catalyst that can abstract hydrogen from the hydrogen donor efficiently and drive the reaction under a neutral environment is essential. As a metal-free, environmentally friendly visible light absorbable photocatalyst, polymeric carbon nitride (PCN) has raised wide interest in the photodegradation of pollutants,17–19 reduction of CO2,20,21 H2 production,22–24 and, in particular, in organic photosynthesis.25–33 Many works have reported that the surface-modification methods can regulate the catalytic performance of the polymeric carbon nitride, and even control the selectivity of the reaction. For instance, our group previously reported that cyano-modified PCN can selectively control the conversion of benzylamine to imine.34 The cyano-carboxylic bifunctionally-modified PCN could significantly enhance the activity of methanol reforming for hydrogen production.35 Thus, it was feasible to control the selectivity or improve the conversion rate in the reaction by adjusting the surface group of polymeric carbon nitride.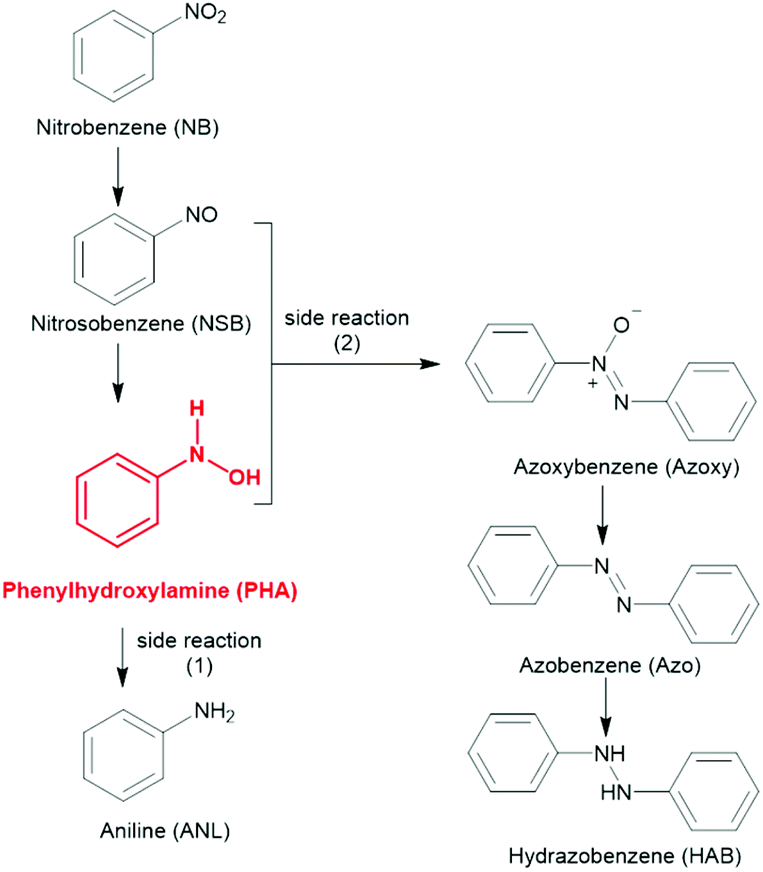 | ||
| Scheme 1 Proposed reaction pathways of the consecutive hydrogenation of nitrobenzene. | ||
Herein, we designed a surface –OH groups-modified polymeric carbon nitride by a simple and green hydrothermal treatment method that avoided the use of excessive acid or alkali, which makes the process more environmentally friendly and made washing and collecting the catalyst easier.36,37 In addition, mesoporous channels were formed during the introduction of –OH groups, which was a benefit for the exposure of the hydroxyl groups. As shown in Fig. 1a, the Lewis basic sites in PCN (CNH2) can be easily attacked by a proton of H2O under high temperature.38 Accordingly, the carbon atom adjacent to the terminal –NH2 group would be attacked by an OH− of water to generate a C–OH group, accompanied by the release of NH3 and the increase in the pH of the solution. FT-IR, XPS, and NMR analyses categorically confirmed the successful functionalization of carbon nitride. The introduced –OH groups were proved to be effective for lowering the recombination rate of photoinduced electron–hole pairs, which ensured the abstraction of hydrogen fluently from IPA. The sufficient hydrogen species, as well as the enhanced interaction with NB after the modification of the surface –OH groups promoted the direct hydrogenation of NB to PHA, which could inhibit the generation of coupling products due to the low concentration of NSB in the reaction system.13,39 The hydrogenation of PHA to ANL was still difficult after the modification of surface –OH groups, which helped realize the accumulation of PHA. As far as we know, there are no successful cases of using polymeric carbon nitride as a catalyst to control the synthesis of PHA under visible light irradiation, until now.
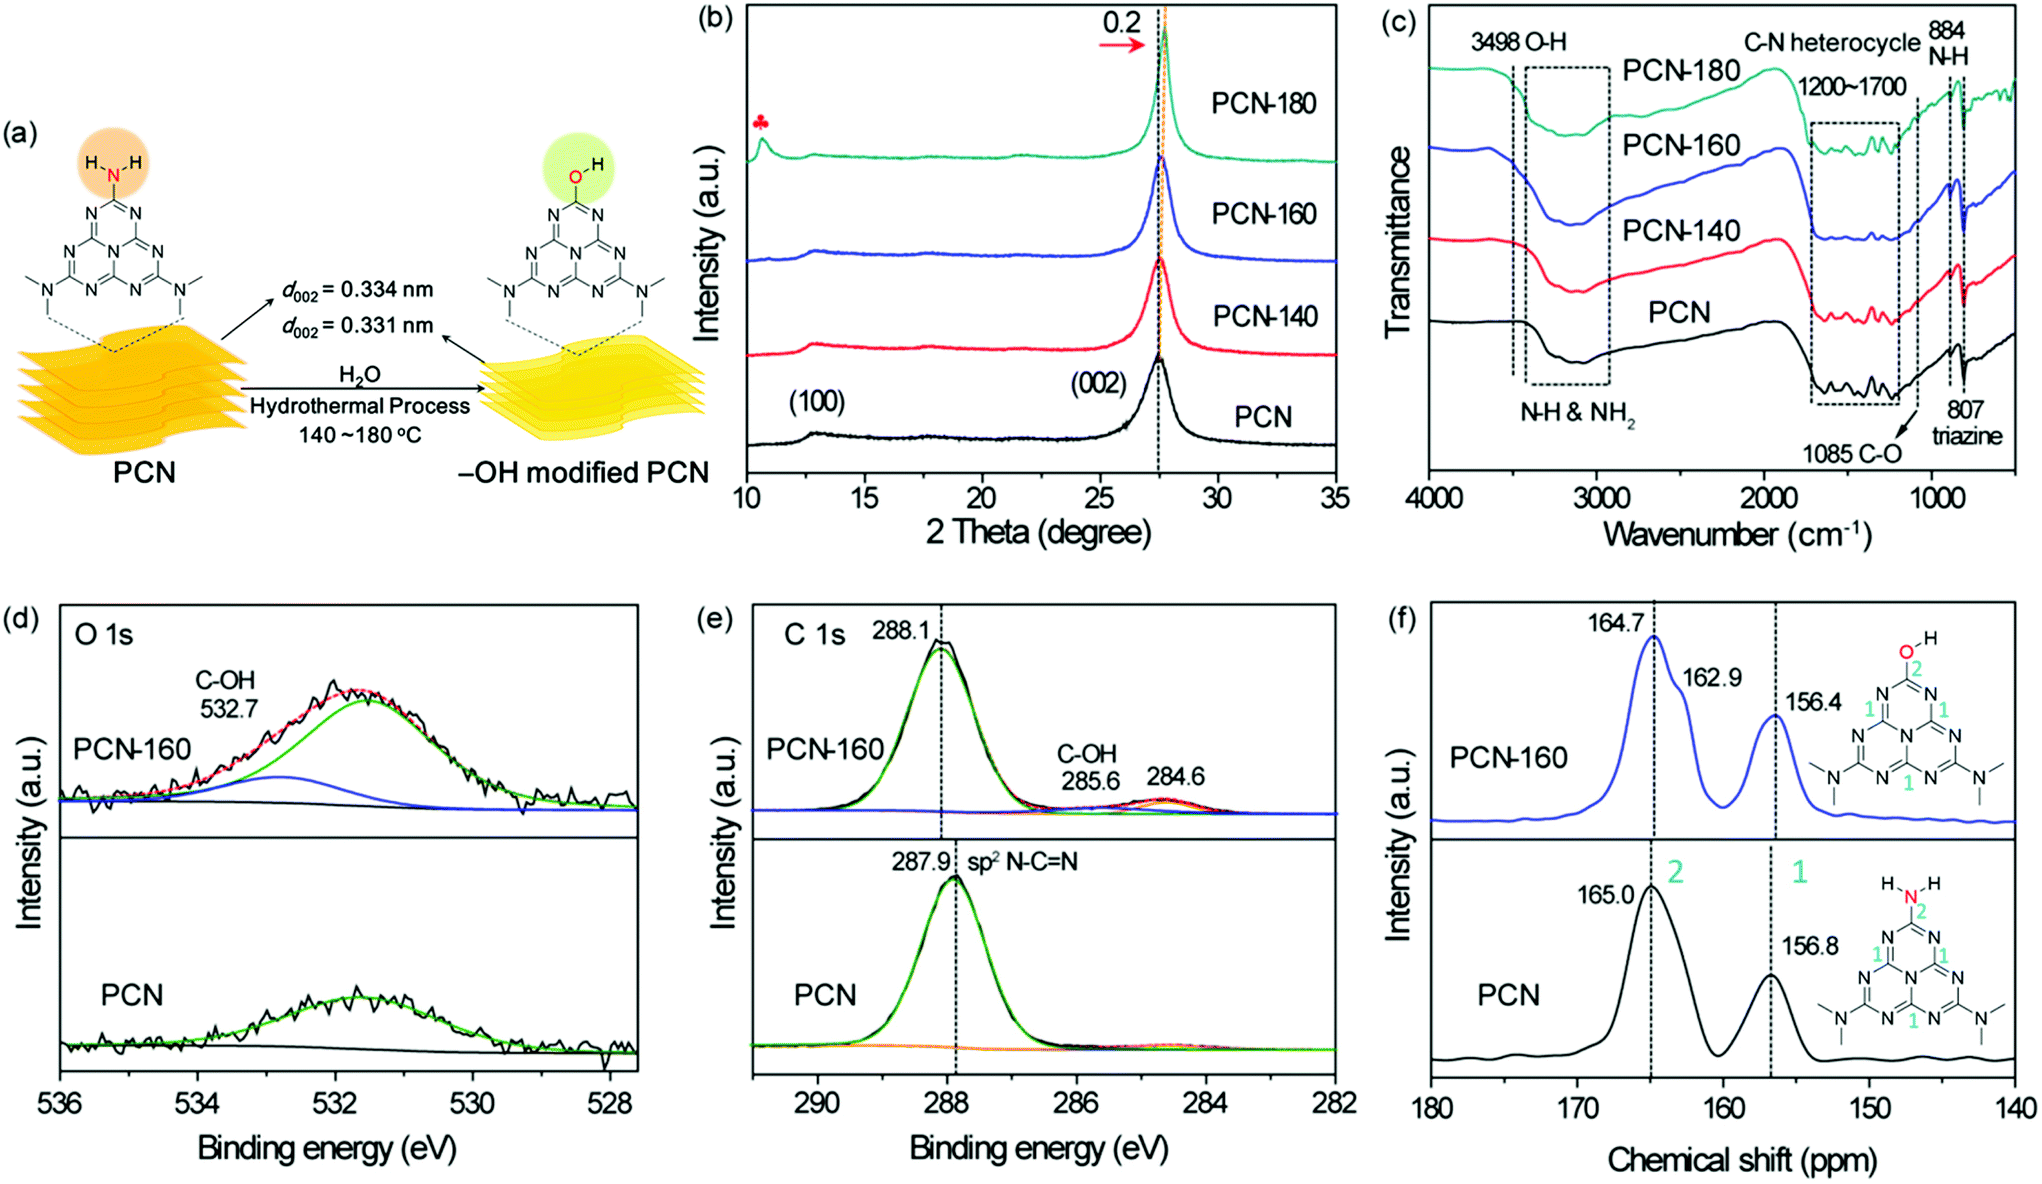 | ||
| Fig. 1 Crystallinity, microstructure and surficial functional groups of PCN. (a) Schematic representation for the formation of –OH-modified PCN under hydrothermal conditions, (b) XRD patterns, (c) FT-IR spectra of PCN, PCN-140, PCN-160 and PCN-180 samples. (d and e) O 1s, C 1s XPS spectra and (f) 13C MAS solid-state NMR spectra of PCN and PCN-160 samples. The red plum in (b) represents the characteristic peak of melamine–cyanuric acid aggregates. | ||
2. Experimental
2.1 Chemicals and reagents
Melamine (Adamas), nitrosobenzene (Energy Chemical), N-phenylhydroxylamine (Sigma-Aldrich), nitrobenzene (Sinopharm Chemical Reagent Co. Ltd), isopropanol (Sinopharm Chemical Reagent Co. Ltd), and deionized water (Resistivity >18.2 MΩ cm) were all purchased and used without further purification.2.2 Synthetic procedures
2.3 Characterization
Scanning electron microscopy (SEM) was carried out on a JOEL JSM-7001 F microscope. Powder X-ray diffraction (XRD) patterns were acquired on a Bruker D8 Advanced diffractometer (Cu Ka1 radiation, λ = 1.5406 Å) with a step size of 0.02. Transmission electron microscopy (TEM) images were acquired by a JEM-2100F microscope with the accelerating voltage of 200 kV. Fourier transform infrared (FT-IR) spectra were obtained on a Bruker TENSOR II system using KBr pellets. The mass ratio between KBr and the sample was 50![[thin space (1/6-em)]](https://www.rsc.org/images/entities/char_2009.gif) :1. The UV-Vis diffuse reflectance (UV-Vis-DR) spectra of the samples were measured using Al2O3 as the reference (U-3900 spectrometer, Hitachi). Photoluminescence (PL) spectra were measured on a Hitachi F-7000 spectrometer at room temperature with the excitation wavelength of 355 nm. The time-resolved PL decay curves (TRPL) were tested on a Fluorolog-3 system (Horiba Scientific, nanosecond light-emitting diode, 370 nm, pulse duration <1.5 ns) to calculate the PL lifetime. N2 absorption–desorption isotherms were measured by Tristar II 3020 analyser (Micromeritics) at liquid nitrogen temperature (77 K). The specific surface area was calculated by the Brunauer–Emmett–Teller (BET) method from the N2 absorption–desorption isotherms in the P/P0 range from 0.05 to 0.2. The pore-size distribution of each sample was calculated by the Barrett–Joyner–Halenda (BJH) method from the adsorption branch in a P/P0 range of 0.01–0.995. Electron paramagnetic resonance (EPR) measurements were obtained using a Bruker EMXPLUS10/12 spectrometer. X-ray photoelectron spectroscopy (XPS) data were measured by a Thermo ESCALAB250Xi with a monochromatized Al Ka line source (120 W). The binding energy was accurately calibrated to the C 1s peak (284.6 eV) contributed from the surface-contaminated hydrocarbons. The carbon-to-nitrogen (C/N) ratio of all the samples was confirmed by elemental analysis (EA, Vario EL CUBE). Solid-state NMR studies were carried out on a 600 MHz Bruker AVANCE IIITM nuclear magnetic resonance spectrometer (14.1 T) equipped with a 4 mm MAS probe. The solid-state magic angle spinning rates of 1H and 13C MAS NMR were set to 12 kHz and 10 kHz, respectively. The chemical shifts were referenced to TMS (tetramethylsilicane) at 0 ppm.
:1. The UV-Vis diffuse reflectance (UV-Vis-DR) spectra of the samples were measured using Al2O3 as the reference (U-3900 spectrometer, Hitachi). Photoluminescence (PL) spectra were measured on a Hitachi F-7000 spectrometer at room temperature with the excitation wavelength of 355 nm. The time-resolved PL decay curves (TRPL) were tested on a Fluorolog-3 system (Horiba Scientific, nanosecond light-emitting diode, 370 nm, pulse duration <1.5 ns) to calculate the PL lifetime. N2 absorption–desorption isotherms were measured by Tristar II 3020 analyser (Micromeritics) at liquid nitrogen temperature (77 K). The specific surface area was calculated by the Brunauer–Emmett–Teller (BET) method from the N2 absorption–desorption isotherms in the P/P0 range from 0.05 to 0.2. The pore-size distribution of each sample was calculated by the Barrett–Joyner–Halenda (BJH) method from the adsorption branch in a P/P0 range of 0.01–0.995. Electron paramagnetic resonance (EPR) measurements were obtained using a Bruker EMXPLUS10/12 spectrometer. X-ray photoelectron spectroscopy (XPS) data were measured by a Thermo ESCALAB250Xi with a monochromatized Al Ka line source (120 W). The binding energy was accurately calibrated to the C 1s peak (284.6 eV) contributed from the surface-contaminated hydrocarbons. The carbon-to-nitrogen (C/N) ratio of all the samples was confirmed by elemental analysis (EA, Vario EL CUBE). Solid-state NMR studies were carried out on a 600 MHz Bruker AVANCE IIITM nuclear magnetic resonance spectrometer (14.1 T) equipped with a 4 mm MAS probe. The solid-state magic angle spinning rates of 1H and 13C MAS NMR were set to 12 kHz and 10 kHz, respectively. The chemical shifts were referenced to TMS (tetramethylsilicane) at 0 ppm.
2.4 Electrochemical analysis
Electrochemical measurements were conducted on a work station (CHI 760E, CH Instruments, Ins., Shanghai, China) in a three-electrode model. Platinum wire electrode was used as the counter electrode and a Ag/AgCl electrode (3.5 M KCl) was used as the reference electrode. The working electrode was prepared as follows: 10.0 mg of the catalyst was dispersed ultrasonically for 30 min in a mixture of water (0.5 mL), ethanol (0.5 mL) and Nafion (5 wt%, 50 μL). Then, 60 μL of the slurry was spread out to 1 cm2 onto a fluorine-doped tin oxide (FTO) glass electrode. The electrode was dried under infrared light and the edge part was sealed with epoxy glue before measurement to ensure that the FTO does not come into contact with the electrolyte solution. Mott–Schottky plots were obtained with the working electrodes immersed in 0.1 M Na2SO4 aqueous solution. The photocurrent was obtained in 0.1 M Na2SO4 aqueous solution illuminated with a 100 W white LED lamp (0.6 W cm−2) under a bias voltage of 0.25 V.2.5 Photoactivity measurements
Typically, 30 μmol of NB was dissolved in IPA (1.5 mL) and 50 mg of the photocatalyst was added. Then the reaction mixture was sealed inside a 1 atm argon atmosphere, kept at 60 ± 2 °C, and illuminated with a 100 W white LED lamp (0.6 W cm−2). The light intensity was tested by a Newport power meter (843-R). After the reaction, the liquid products were analysed by HPLC (Agilent 1260) equipped with ZORBAX SB-C18 column (4.6 × 150 mm). The catalyst was recovered for the cycling tests after it washed by IPA and dried at 80 °C for 10 h. Blue (425–510 nm, peak at 459 nm), green (475–600 nm, peak at 525 nm), and red (585–655 nm, peak at 626 nm) coloured LED lights were used to measure the apparent quantum efficiency (AQE). The light intensity of each single coloured LED was 0.15 W cm−2.2.6 Computational methods
The interaction energies (Ei) of NB (PhNO2) and PHA (PhNOH2) over PCN and –OH-modified PCN were calculated with the density functional theory (DFT) method implemented in GAUSSIAN 09.40 The PCN was simulated by a C6H6N10 molecule, and the –OH-modified PCN was mimicked by a C6H5N9O molecule. Both the C6H6N10 and the C6H5N9O were hydrogenated with two hydrogen atoms. All the geometry optimizations (without any symmetry constraint) and the energy calculations were performed at the level of hybrid DFT with Becke's three-parameter exchange functional41 and Lee–Yang–Parr's correlation functional42 (B3LYP). The standard split valence basis set 6-311++G(d,p) was employed to describe the orbitals of all the atoms involved. The interaction energy was calculated with the following equation:| PCN + PhNO2→PCN-PhNO2 |
| Ei = E(PCN-PhNO2) − E(PCN) − E(PhNO2) |
3. Results and discussion
3.1 Identification of the surface hydroxyl groups
XRD patterns were collected to evaluate the change of the crystallinity of PCN after treatment with deionized water (Fig. 1b). The intensity of the (002) peak became stronger as the temperature of the treatment process rose from 140 °C to 160 °C. Moreover, the shift of the (002) peak position from 27.5° to 27.7° reflected a narrower interlayer distance (from 0.334 to 0.331 nm), resulting from a stronger van der Waals attraction between the neighbouring heptazine-based carbon nitride layers.43 While the in-plane peak (100) at 12.7° attributed to the intralayer packing units became weaker gradually, indicating the decreased sizes of the intralayer framework due to the attack against the tertiary amine N–(C)3 by a proton of H2O during post-treatment.44 However, when the treated temperature was over 180 °C, less than 20 wt% was retained in the yellow sediment due to the structural failure, which resulted in the formation of melamine–cyanuric acid aggregates, and showing a new peak at 10.6°, see Fig. 1b.45 Therefore, 160 °C was selected as the optimal treatment temperature. Under this temperature the main heptazine structure of PCN was not destroyed, along with the formation of condensed PCN. This condensed interlayer distance was more conducive to the transport of carriers between adjacent heptazine layers.34The Brunauer–Emmett–Teller (BET) surface areas of all the samples were calculated by the N2 absorption–desorption isotherms to evaluate the change after treatment with deionized water (Fig. S1†) and the results are summarized in Table S1.† The surface area of PCN-140 was 14.3 m2 g−1, which was almost unchanged compared with that of PCN (12.2 m2 g−1). However, when the treatment temperature reached 160 °C, the specific surface area increased to 42.6 m2 g−1, accompanied by a change in the morphology (SEM and TEM images shown in Fig. S2†), which could probably be attributed to the decreased polymerization degree of the intralayer packing units and the formation of mesoporous channels (the inset in Fig. S1†). When the PCN sample was treated at 180 °C, the mesoporous channels collapsed and the specific surface area decreased sharply to 32.8 m2 g−1.
Fourier transform infrared (FT-IR) spectra of all the samples were obtained to investigate the change of the terminal groups. As shown in Fig. 1c, the broad band at 2900–3420 cm−1 could be assigned to the stretching vibrations of the amino groups and the band at 1200–1700 cm−1 belonged to the vibrations of the C–N heterocycles rings.46 The absorption band at 884 cm−1 was due to the N–H deformation mode,47 and the sharp band at 807 cm−1 was a typical characteristic of a heptazine ring. Some obvious changes could be observed in the FT-IR spectra after PCN was treated with deionized water. A shoulder peak at 3498 cm−1 (–OH stretching vibrations) obviously appeared and showed the same trend as for the intensity of the C–OH stretching mode around 1085 cm−1, which implied the introduction of an –OH group.48,49
X-ray photoelectron spectroscopy (XPS) was used to obtain more information about the surface structure of the samples. There was only little oxygen species on the surface of the PCN sample before treatment with deionized water. However, the concentration of surface oxygen species of PCN gradually increased from 0.86 to 8.80 at% with the elevation of the treatment temperature (Table S2†). This trend was consistent with the results of the elemental analysis (from 0.19 to 4.08 mol%, Table S3†) and the TEM-EDS results (Table S4†). The surface atomic ratio of C/N (Table S2†) increased from 0.697 to 0.735 after PCN was treated under 160 °C, which was ascribed to the replacement of N atoms by O atoms. The O 1s peak at 532.7 eV implied the generation of a C–OH bond (Fig. 1d) after treatment with deionized water at 160 °C.50,51 Accordingly, a new peak at 285.6 eV ascribed to C–OH in the high-resolution C 1s spectra of PCN-160 appeared (Fig. 1e).36 Moreover, replacing the terminal amino groups (–NH2) by –OH groups resulted in a shift of N–C![[double bond, length as m-dash]](https://www.rsc.org/images/entities/char_e001.gif) N towards a higher binding energy. The contributions from 400.9, 398.3 and 399.8 eV in the high-resolution N 1s XPS spectrum of PCN (Fig. S3†) corresponded to amino groups (N1), C–NC (N2) and N–(C)3 (N3). The percentage of the N1 peak area (Table S5†) declined in PCN-160 along with the shift of N2 and N3, which was due to the replacement of C–NH2 by C–OH.49
N towards a higher binding energy. The contributions from 400.9, 398.3 and 399.8 eV in the high-resolution N 1s XPS spectrum of PCN (Fig. S3†) corresponded to amino groups (N1), C–NC (N2) and N–(C)3 (N3). The percentage of the N1 peak area (Table S5†) declined in PCN-160 along with the shift of N2 and N3, which was due to the replacement of C–NH2 by C–OH.49
Solid-state 13C MAS NMR spectroscopy was further used to confirm the structural changes of the samples. The 13C NMR signal (Fig. 1f) of PCN exhibited two strong peaks at 156.8 and 165.0 ppm, which were assigned to the characteristic chemical shifts of C3N (1) and C2N–NHx (2) in the heptazine units.46 The broad peak at 165.0 ppm was due to a mix of C2N–NH2 and C2N–NH. The attack against the tertiary amine N–(C)3 (Fig. S4,† N atom in red) by a proton of H2O during the hydrothermal treatment resulted in the generation of C2N–NH (Fig. S4,† N atom in blue), which caused a more obvious C2N–NH signal at 162.9 ppm compared with PCN. In addition, compared with PCN, the signal of 1 and 2 in PCN-160 showed a shift towards the upfield, which could be attributed to the introduction of –OH.52
3.2 Physical properties (optical property and band structure)
The UV–vis absorption spectra are shown in Fig. 2a. The band gap energies (Eg) for PCN, PCN-140, PCN-160 and PCN-180 were 2.61, 2.63, 2.65 and 2.67 eV, respectively, which were calculated using the formula Eg = 1240/λ.53 The notable increase in Eg and the gradually increased PL emission peak (Fig. 2b) were in agreement with the decrease in the polymerization degree due to the etching of water molecules.54 The electrochemical Mott–Schottky curves (Fig. S5†) indicated an n-type semiconductor structure for all the samples, and provided the position of flat band potentials at −1.02, −1.18, −1.21 and −1.05 V vs. Ag/AgCl, which corresponded to −0.82, −0.98, −1.0 and −0.85 V vs. NHE for PCN, PCN-140, PCN-160 and PCN-180, respectively (the formula to convert the potential is shown as Table S1†), which were more negative than the reversible potential of PhNO2/[PhNO2]˙− (−0.8 V vs. NHE).55 The band structure is shown in Fig. 2c. Among all the samples, PCN-160 showed the highest conduction band position, which was conducive to providing highly energetic photogenerated electrons to promote the hydrogenation of NB.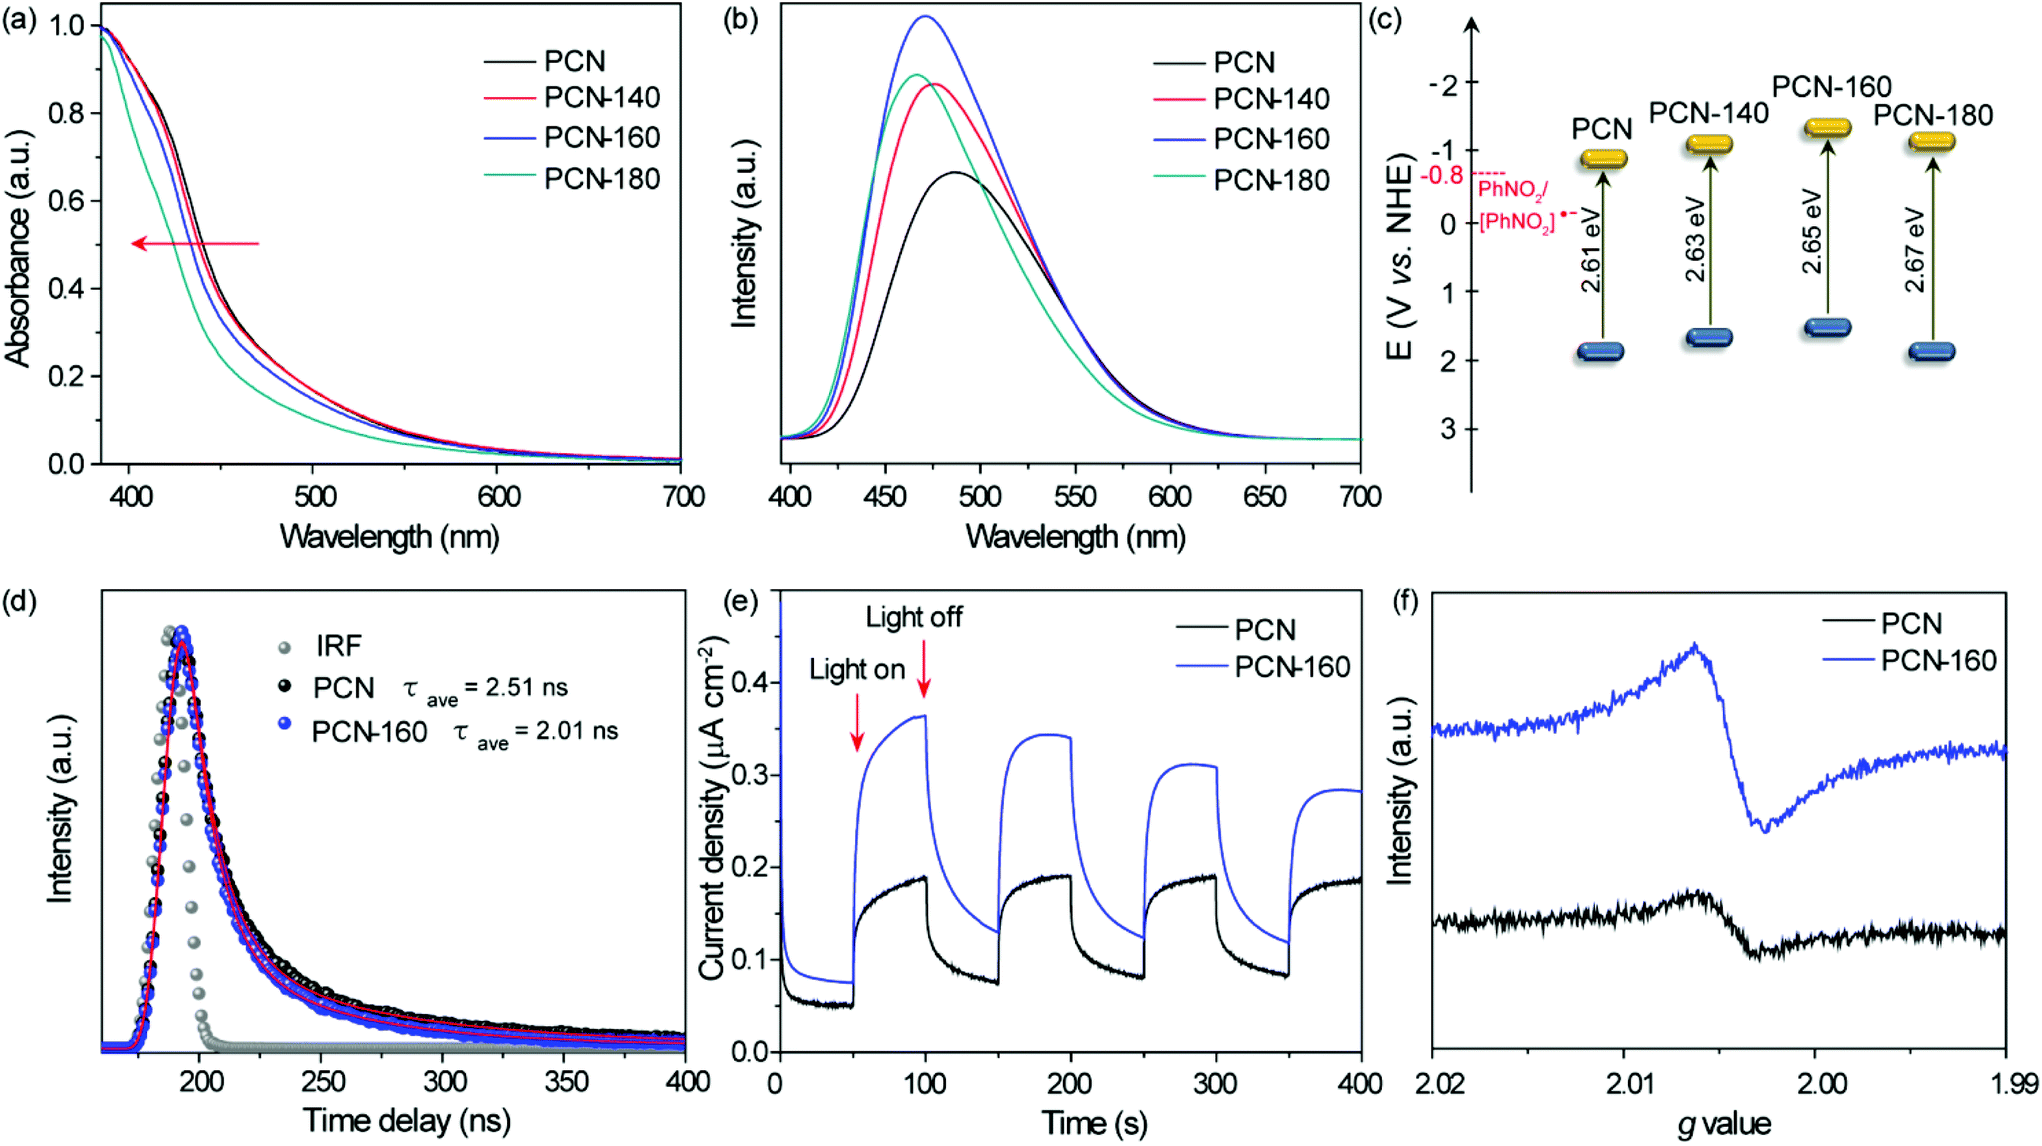 | ||
| Fig. 2 Optical and electronic properties. (a) UV-Vis diffuse reflectance spectra, (b) photoluminescence (PL) spectra with the excitation wavelength of 355 nm, (c) comparison of the band structures vs. NHE of PCN, PCN-140, PCN-160 and PCN-180. (d) Time-resolved PL decay curves and (e) photocurrent of PCN and PCN-160 under cycling illumination. (f) Solid-state electron paramagnetic resonance spectra at room temperature. | ||
The photocurrent curve and photoluminescence (PL) lifetime were tested to compare the separation efficiency of the charge carriers in PCN-160. Time-resolved PL decay curves (TRPL) were recorded, fitted by a tri-exponential function to obtain the average PL lifetime.56 As shown in Fig. 2d, the average PL lifetime decreased from 2.51 to 2.01 ns after PCN was treated under 160 °C (the fitting parameter is shown in Table S6†), indicating an enhanced separation efficiency of photoinduced electron–hole pairs, which could be due to the trapping of holes by –OH groups.57,58 The higher photocurrent intensity (Fig. 2e) also confirmed the enhanced separation efficiency of photogenerated carriers. The ESR signal (Fig. 2f) at g = 2.0045 was attributed to the unpaired electrons in the sp2-hybrid carbon in the localized π-conjugated structure. The signal strength of PCN-160 was significantly higher than that of PCN, indicating an enhanced delocalization of the π-conjugated structure, which would be beneficial for the electron mobility between adjacent heptazine layers.43,59
3.3 Structure–reactivity relationship
The photocatalytic performance of the series of PCN samples under visible light was compared and the results are shown in Fig. 3a. The reaction did not proceed in the absence of light and NB itself could barely be reduced without the catalyst (Table S7†). As shown in Fig. 3b and c, the conversion of NB over PCN-160 was directly related to the light intensity, and the apparent quantum efficiency (AQE) showed strong correlation towards the irradiation wavelength. These results indicated that the NB reduction reaction was driven by light. There were nitrosobenzene (NSB), ANL and a large number of coupling products (azoxybenzene and azobenzene) obtained by using the initial bulk PCN and the activity was as low as 28.3% at 18 h. The conversion of NB over PCN-140 was 58.4% and the selectivity towards PHA increased from 66% to 77% compared with that of PCN. Considering the similar specific surface area of PCN and PCN-140, an outstanding increased production towards PHA was proposed for the introduction of surface –OH groups over PCN. It was noted that PCN-160 exhibited a 98% conversion of NB at 18 h, which was the highest among all the samples. Compared with that of PCN-140, the high conversion rate over the PCN-160 catalyst may have resulted from the abundant pore structure, which was beneficial for the exposure of –OH catalytic active centres. According to previous reports, when PCN was used in the hydrogenation reaction process, an additional alkali source was always required to realize the efficient hydrogenation.14 Herein, the –OH-modified PCN could abstract hydrogens effectively from IPA without the help of alkali conditions being needed.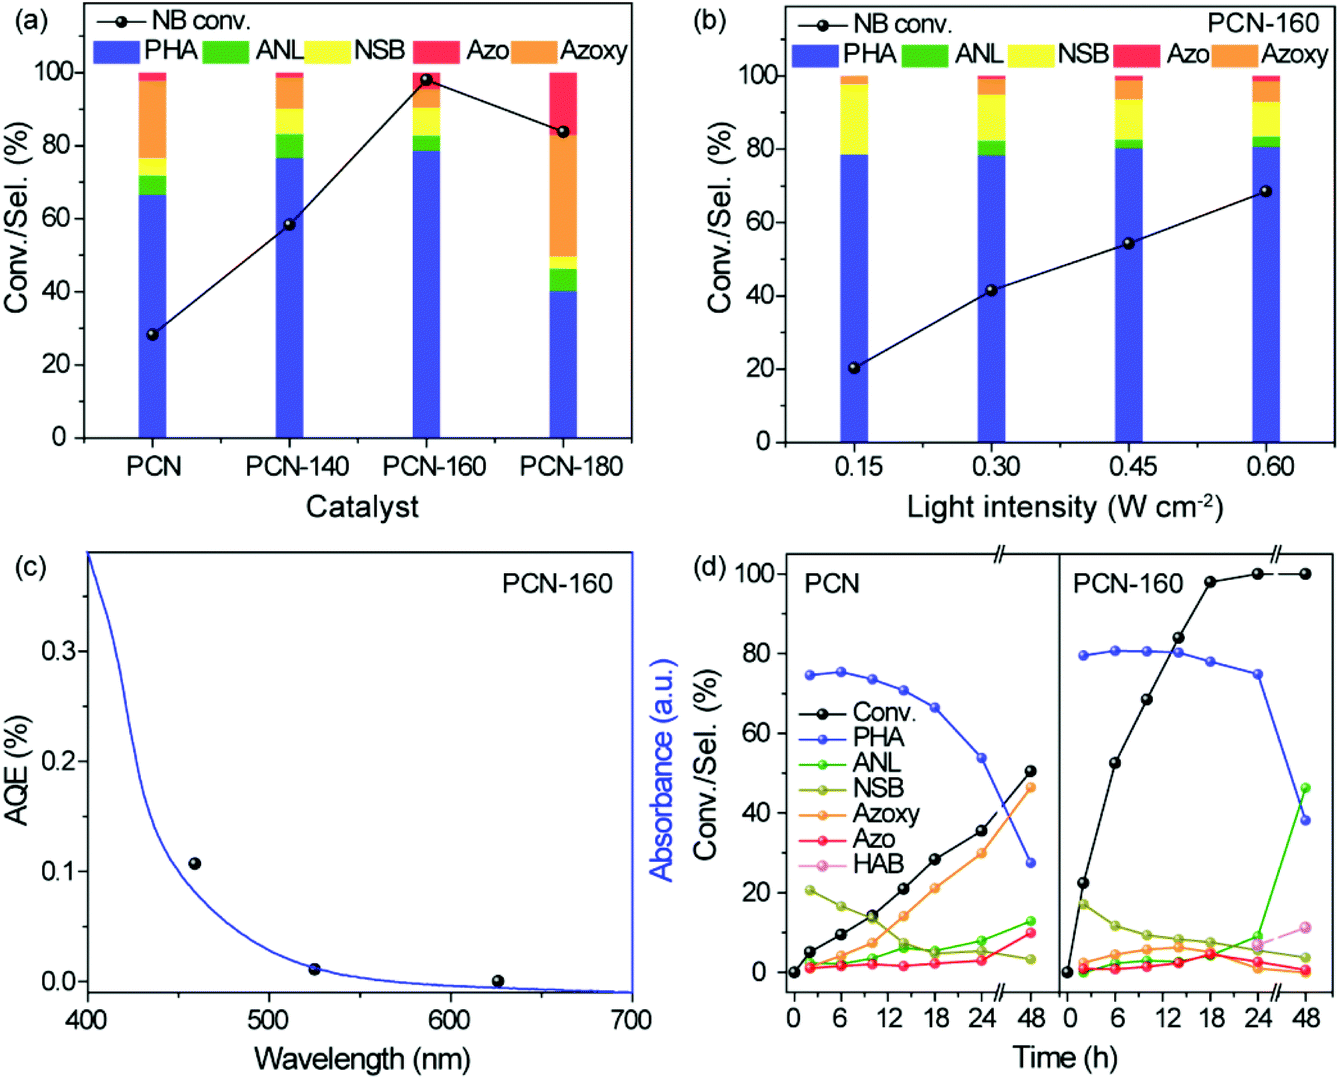 | ||
| Fig. 3 Photocatalytic activity for the selective reduction of nitrobenzene. (a) Comparison of the conversion of nitrobenzene and product selectivity by using PCN, PCN-140, PCN-160 and PCN-180 at 60 °C for 18 h; (b) influence of the light intensity on the photocatalytic activity for the selective reduction of nitrobenzene by using PCN-160 as the photocatalyst at 60 °C for 10 h; (c) wavelength dependence of the apparent quantum efficiency (AQE) for the yield of PHA over PCN-160 at 60 °C for 10 h. (d) Time-dependent profiles showing the conversion of nitrobenzene and the product selectivity at 60 °C. Reaction conditions: nitrobenzene (30 μmol), IPA (1.5 mL), photocatalyst (50 mg), Ar (1 atm), 100 W white LED lamp (0.6 W cm−2). Conv. = conversion, Sel. = selectivity, PHA = N-phenylhydroxylamine, NSB = nitrosobenzene, ANL = aniline, Azoxy = azoxybenzene, Azo = azobenzene, HAB = hydrazobenzene. | ||
The time-dependent profiles over PCN and PCN-160 at 60 °C are shown in Fig. 3d. NB over 98% could be converted at 18 h and the selectivity towards PHA basically kept at about 80% during the conversion of NB over PCN-160. IPA was oxidized to acetone and the hydrogen (red colour in Fig. S7a†) was transferred to NB. Two molecules of IPA were required for the generation of a PHA molecule. The sum of the theoretical acetone output calculated from all the products was close to its actual production (Fig. S7b†). As for PCN, the selectivity towards PHA decreased to 27.6% until 50% of NB was converted and the coupling products (azoxybenzene and azobenzene) were more likely to be acquired. The efficient conversion of NB and the high yield of PHA could only be obtained over PCN-160, which proved the important role of the –OH group modification. Scale-up experiments were carried out and the time-conversion plot is shown in Fig. S8.† Even without an optimized design, the selectivity of PHA could be maintained at nearly 70% after 90% of NB was converted. It was quite difficult to obtain PHA with high selectivity during the photocatalytic process, during which the reported products mainly focused on ANL, azoxybenzene and azobenzene rather than PHA (Table S8†).
The effect of the solvent on the product selectivity was investigated by varying the volume fraction of water in an IPA/water mixed solvent (Fig. S9†). The addition of a small amount of water (5 vol%) to the reaction system was slightly beneficial to the conversion of NB, but had almost no effect on the selectivity towards PHA. However, excess water was detrimental to the conversion of NB. In this reaction system, IPA acted as the hydrogen donor reagent. Too much water would affect the dehydrogenation process of IPA and thus exhibited a decreased conversion rate of NB.60
In order to clarify the function of the –OH group in the reaction, the catalytic performances of PCN and PCN-160 towards NSB and PHA were studied in detail. As shown in Table 1, it was incredible that the conversion rate of PHA over PCN (27.5%) was about three times that of PCN-160 (8.8%) under the same reaction condition (Table 1, entries 1 and 2). That is, the PCN-160 sample exhibited a lower PHA conversion ability than the PCN sample, which was the prerequisite to ensure the high selectivity of PHA. Moreover, ANL was the only product for PCN-160, while the products for PCN were more complex, with almost equal contents of ANL, azoxybenzene and azobenzene. The generation of coupling products from PHA over PCN implied that the disproportionation of PHA occurred.39 Another interesting finding was that the production of PHA on the surface of PCN did not follow the Harber path.61 When NSB acted as the substrate, it was more inclined to translate into the coupling products rather than PHA, no matter over PCN or PCN-160 (Table 1, entries 3–9).
| Entry | Reactant | Catalyst | Conv. (%) | Sel. (%) | ||||
|---|---|---|---|---|---|---|---|---|
| PHA | ANL | Azoxy | Azo | HAB | ||||
| a Reaction conditions are identical with those in Fig. 3a. b 2 h. c 6 h. | ||||||||
| 1 | PHA | PCN-160 | 8.8 | — | 100 | — | — | — |
| 2 | PHA | PCN | 27.5 | — | 30.2 | 26.8 | 39.9 | 3.1 |
| 3 | NSB | — | 9.8 | — | — | 92.7 | 7.3 | — |
| 4b | NSB | PCN-160 | 98.1 | 5.7 | 0.2 | 92.6 | 1.5 | — |
| 5c | NSB | PCN-160 | 100 | 3.6 | 4.2 | 54.3 | 36.5 | 1.4 |
| 6 | NSB | PCN-160 | 100 | 2.5 | 8.7 | — | 33.1 | 55.7 |
| 7b | NSB | PCN | 14.9 | — | — | 100 | — | — |
| 8c | NSB | PCN | 48.2 | — | — | 98.1 | 1.9 | — |
| 9 | NSB | PCN | 100 | — | 0.8 | 91.4 | 7.8 | — |
This result indicated that the production of PHA over the surface of PCN-160 was mainly completed by the direct hydrogenation of NB. Once NSB was generated, it was difficult to be hydrogenated to PHA. In brief, the quite different selectivity towards PHA over PCN and PCN-160 was possibly due to the replacement of the surface C–NH2 by C–OH, which ensured there was sufficient hydrogen species, which thus promoted the direct hydrogenation of NB to PHA.
Computational methods were also used to investigate the interaction between the substrates and the catalysts. According to the DFT calculations, the interaction energies (Ei) of NB and PHA over PCN were 0.40 and 0.57 eV, respectively. The Ei over PCN-160 were strengthened by 0.12 and 0.42 eV via the hydrogen bonds interaction. The optimized adsorption status is shown in Fig. 4. The obvious change in Ei and the obviously reduced length of hydrogen bond between NB and the active centre (from 2.110 to 1.893 Å) were directly beneficial for the hydrogenation of NB. Combined with the above analysis, the introduced –OH group could elevate the conduction band position of PCN, which would provide highly energetic photogenerated electrons to promote the reduction of NB. These results together proved that the introduction of –OH groups could be favourable for the hydrogenation of NB. Given that the reduction potential of PHA/ANL (−1.6 V vs. NHE)55 was higher than the conduction band position of PCN-160 (−1.0 V vs. NHE), the generation of ANL over PCN and PCN-160 could be ascribed to the strong interaction between PHA and the catalyst, which lowered its reduction potential. Although it was easier for PHA to be hydrogenated to ANL over PCN-160 than PCN because of the enhanced hydrogen bond interaction (the length of hydrogen bond decreased from 1.963 to 1.728 Å) with the active centre (Table 1, entry 1), PHA could still maintain 80% selectivity over PCN-160. After the NB molecules were all converted at 18 h over PCN-160, the hydrogenation rate of PHA speeded up and the selectivity of PHA began to decrease (Fig. 3d). However, the transformation from PHA to ANL was still very slow after the NB reduction was completed, which was due to the significant difference in the N atom, whereby it was electron-deficient in NB and electron-rich in PHA.5 Based on the above analysis, PCN-160 was advanced for its rapid abstraction of hydrogen from IPA and the strong interaction with NB, which ensured the quick hydrogenation of NB and the production of PHA. The significantly different hydrogenation rate of NB and PHA resulted in the accumulation of PHA in the reaction system. The sufficient hydrogen species promoted the direct hydrogenation of NB to PHA over PCN-160, resulting in a low concentration of NSB in the solution, which was main reason to inhibit the generation of the coupling product. It was pleasing that the introduction of the –OH group was beneficial for the accumulation of PHA.
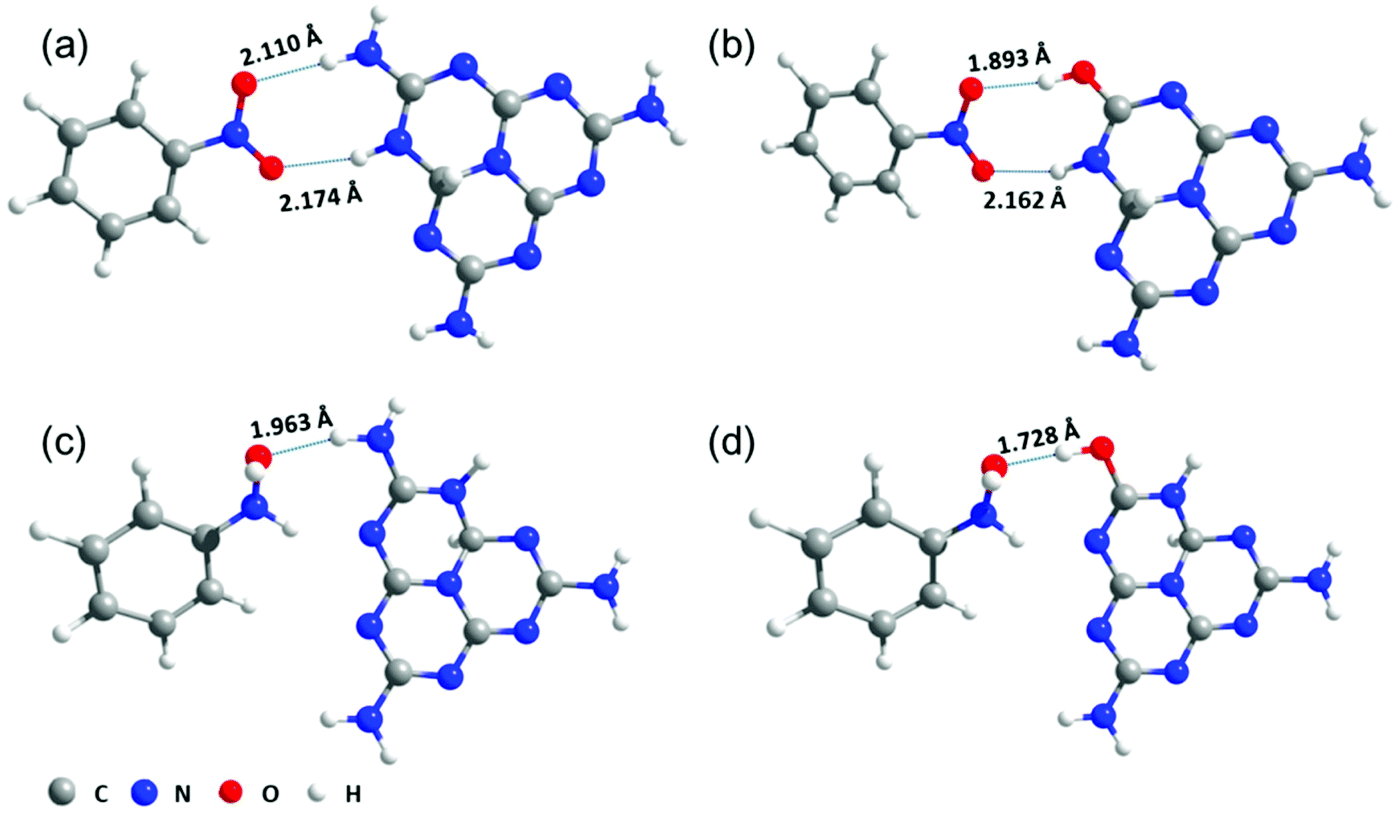 | ||
| Fig. 4 Analysis of the reaction mechanism. The optimized adsorption status of NB and PHA over PCN (a and c) and –OH-modified PCN (b and d). The numbers in the figure represent the lengths of the hydrogen bonds. | ||
In situ diffuse reflectance infrared Fourier transform spectroscopy (in situ DRIFTS) was performed to gain an insight into the mechanism for the hydrogenation of NB over hydroxyl group-modified PCN during the photocatalytic reaction. The adsorption of NB over PCN-160 is shown in Fig. S11a.† In addition to the characteristic peaks of nitro groups at 1349 and 1524 cm−1, the band at 3280–3550 cm−1 was caused by the hydrogen bonding interaction62 between the nitro group and the hydroxyl group on the surface of PCN-160, which was consistent with the result of the theoretical calculation (Fig. 4b). The in situ photocatalytic hydrogenation of NB over PCN-160 was also monitored and is shown in Fig. S11b.† IPA was introduced in the in situ reaction cell to act as the hydrogen donor after the adsorption of NB over PCN-160 was stable. It could be observed that the intensity of the characteristic peaks of nitro groups decreased and the N–O stretching vibration (1462 cm−1) and O–H deformation vibration (1409 cm−1) of PHA increased under the visible light illumination.
The –OH content on the series of PCN surface was quantitative analysed by Boehm titration63 to confirm the important role of the –OH groups in the selective generation of PHA. We found that the yield of PHA and the –OH content showed an approximately linear relationship (Fig. S12†). This result further confirmed that the –OH group was the true active site. Surprisingly, although the content of the oxygen element increased gradually with the increase in hydrothermal temperature, most of them did not exist in the form of hydroxyl groups in PCN-180, which might be the result of the enol–keto tautomerism when PCN was mostly depolymerized to fragments with a low molecular weight at 180 °C.64–66 Cycling experiments under identical conditions were conducted (Fig. S13†). The PHA selectivity over the PCN-160 sample after three cycle runs kept 80% of that at the first run, which was much higher than that of PCN.
Combined with the above analysis, the selective NB hydrogenation mechanism over the PCN surface with –OH groups was proposed (Scheme 2). The electron transition from the valence band to the conduction band of PCN took place in the presence of visible light irradiation.67 With the assistance of surface –OH groups, the photogenerated electrons and holes were separated effectively. The hydrogen species were produced through the photoinduced holes oxidation of IPA and were then adsorbed on the adjacent C–N sites (i and iv).14,58 NB molecules were adsorbed at the surface –OH centre via hydrogen bond interaction (ii) and underwent a two-step continuous hydrogenation reaction with hydrogen species (iii and v). The rapid and effective separation of photogenerated carriers could provide sufficient hydrogen species on the surface. The abundant hydrogen species and enhanced interaction between NB and the PCN surface after the modification of –OH groups could ensure the rapid hydrogenation of NB to PHA, which resulted in the low concentration of NSB in the solution and thus inhibited the generation of coupling products simultaneously. Although the presence of –OH groups strengthened the interaction between PHA and the PCN surface, it was still difficult for the conversion of PHA to ANL in this condition. In this case, PHA desorption from the catalyst (vi) and a high selectivity were thus realized.
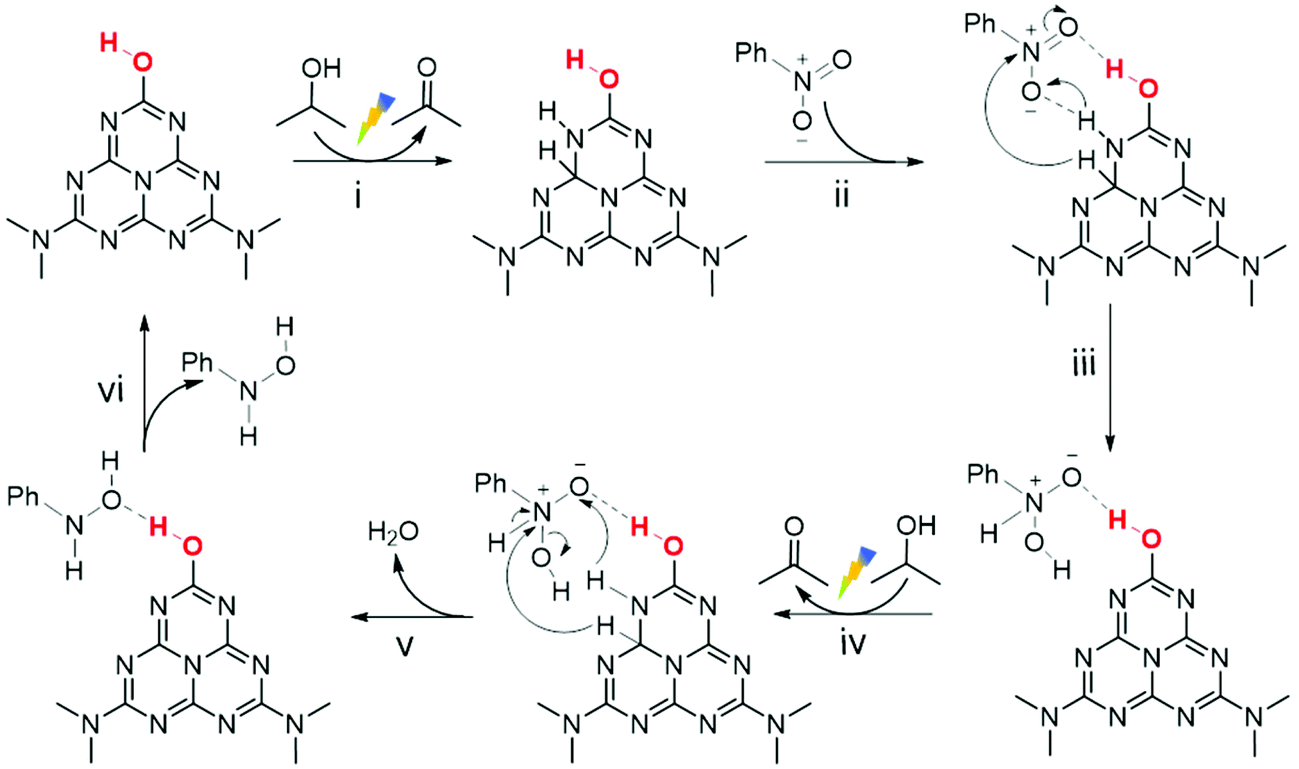 | ||
| Scheme 2 Proposed mechanism for the hydrogenation of nitrobenzene over the PCN-160 surface. | ||
The photocatalytic hydrogenation of typical nitroarenes over PCN-160 was also conducted. Good conversions and high selectivity towards the corresponding N-arylhydroxylamines were all realized, and the results are listed in Table S9.† When an electron-withdrawing group, such as –Cl, was attached to the ring, the hydrogenation process became easier than NB. On the contrary, when an electron-donating group, such as –CH3, was included as a substituent in the ring, hydrogenation became lower than NB. The hydrogenation rate of 4-nitroacetophenone was close to that of NB. The selectivities towards N-arylhydroxylamines were 61.2%, 85.8% and 63.4% for –Cl-, –COCH3- and –CH3-substituted nitroaromatics, respectively.
4. Conclusions
In summary, we obtained PCN with –OH groups on the surface through simple hydrothermal treatment. The sample acquired at 160 °C exhibited an efficient photocatalytic hydrogenation activity towards NB without the help of a basic solution needed, thus realizing the highly selective production of PHA. The key roles of surface –OH modification in this hydrogenation process lay in the following two aspects: (1) the enhanced adsorption capacity towards NB, as well as the enhanced separation efficiency of photoinduced electron–hole pairs together realized the direct hydrogenation of NB to PHA, which resulted in the low concentration of NSB in the solution and thus inhibited the generation of coupling products; (2) the presence of –OH groups made the further hydrogenation of PHA to ANL difficult, which resulted in the accumulation of PHA. The above two points together realized the accumulation of PHA and ensured its high selectivity. Our work provides a new strategy for the green synthesis of functionalized PCN materials and a new insight for the control of selective hydrogenation processes.Conflicts of interest
There are no conflicts to declare.Acknowledgements
This work was supported by the National Natural Science Foundation of China (No. 21773284, 22072176). We also thank the support of the State Key Laboratory of Materials-Oriented Chemical Engineering (KL17-04) and THYME project (Research England).Notes and references
- W. Uhl and A. Kyriatsoulis, Namen- und Schlagwortreaktionen in der Organischen Chemie, Vieweg+Teubner Verlag, Wiesbaden, 1984 Search PubMed.
- H. Tan, X. Liu, J. Su, Y. Wang, X. Gu, D. Yang, E. R. Waclawik, H. Zhu and Z. Zheng, Sci. Rep., 2019, 9, 1280 CrossRef PubMed.
- J. Wang, Z. Ge, L. Pei, P. Kong, R. Wang, P. Zhu, M. Liu, X. Gu and Z. Zheng, Catal. Sci. Technol., 2019, 9, 6681–6690 RSC.
- H.-U. Blaser, Science, 2006, 313, 312–313 CrossRef CAS PubMed.
- G. Chen, C. Xu, X. Huang, J. Ye, L. Gu, G. Li, Z. Tang, B. Wu, H. Yang, Z. Zhao, Z. Zhou, G. Fu and N. Zheng, Nat. Mater., 2016, 15, 564–569 CrossRef CAS PubMed.
- Y. Z. Shi, H. Wang, Z. W. Wang, T. K. Wu, Y. J. Song, B. B. Guo and L. Wu, J. Mater. Chem. A, 2020, 8, 18755–18766 RSC.
- L. Q. Zhang, X. He, X. W. Xu, C. Liu, Y. L. Duan, L. Q. Hou, Q. D. Zhou, C. Ma, X. P. Yang, R. Liu, F. Yang, L. S. Cui, C. M. Xu and Y. F. Li, Appl. Catal., B, 2017, 203, 1–8 CrossRef CAS.
- L. Li, T. V. Marolla, L. J. Nadeau and J. C. Spain, Ind. Eng. Chem. Res., 2007, 46, 6840–6846 CrossRef CAS.
- S. Ung, A. Falguieres, A. Guy and C. Ferroud, Tetrahedron Lett., 2005, 46, 5913–5917 CrossRef CAS.
- S. Doherty, J. G. Knight, T. Backhouse, R. J. Summers, E. Abood, W. Simpson, W. Paget, R. A. Bourne, T. W. Chamberlain, R. Stones, K. R. J. Lovelock, J. M. Seymour, M. A. Isaacs, C. Hardacre, H. Daly and N. H. Rees, ACS Catal., 2019, 9, 4777–4791 CrossRef CAS.
- D.-D. Li, G.-P. Lu and C. Cai, Catal. Commun., 2020, 137, 105949 CrossRef.
- C. C. Torres, V. A. Jimenez, C. H. Campos, J. B. Alderete, R. Dinamarca, T. M. Bustamente and B. Pawelec, Mol. Catal., 2018, 447, 21–27 CrossRef CAS.
- E. A. Gelder, S. D. Jackson and C. M. Lok, Chem. Commun., 2005, 41, 522–524 RSC.
- Y. Dai, C. Li, Y. Shen, T. Lim, J. Xu, Y. Li, H. Niemantsverdriet, F. Besenbacher, N. Lock and R. Su, Nat. Commun., 2018, 9, 60 CrossRef PubMed.
- H. M. Hao and X. J. Lang, ChemCatChem, 2019, 11, 1378–1393 CrossRef CAS.
- S. C. Jensen, S. B. Homan and E. A. Weiss, J. Am. Chem. Soc., 2016, 138, 1591–1600 CrossRef CAS PubMed.
- H. Wang, X. Yuan, Y. Wu, G. Zeng, X. Chen, L. Leng and H. Li, Appl. Catal., B, 2015, 174–175, 445–454 CrossRef CAS.
- W. Jiang, W. Luo, R. Zong, W. Yao, Z. Li and Y. Zhu, Small, 2016, 12, 4370–4378 CrossRef CAS PubMed.
- M. Zhang, W. Luo, Z. Wei, W. Jiang, D. Liu and Y. Zhu, Appl. Catal., B, 2016, 194, 105–110 CrossRef CAS.
- W. Yu, D. Xu and T. Peng, J. Mater. Chem. A, 2015, 3, 19936–19947 RSC.
- C. M. Li, Y. Xu, W. G. Tu, G. Chen and R. Xu, Green Chem., 2017, 19, 882–899 RSC.
- H. Yu, R. Shi, Y. Zhao, T. Bian, Y. Zhao, C. Zhou, G. I. N. Waterhouse, L.-Z. Wu, C.-H. Tung and T. Zhang, Adv. Mater., 2017, 29, 1605148 CrossRef PubMed.
- Z. Jin, Q. Zhang, J. Chen, S. Huang, L. Hu, Y.-J. Zeng, H. Zhang, S. Ruan and T. Ohno, Appl. Catal., B, 2018, 234, 198–205 CrossRef CAS.
- G. C. Wang, T. Zhang, W. W. Yu, R. Si, Y. F. Liu and Z. K. Zhao, ACS Catal., 2020, 10, 5715–5722 CrossRef CAS.
- F. Su, S. C. Mathew, G. Lipner, X. Fu, M. Antonietti, S. Blechert and X. Wang, J. Am. Chem. Soc., 2010, 132, 16299–16301 CrossRef CAS PubMed.
- G. Ding, W. Wang, T. Jiang, B. Han, H. Fan and G. Yang, ChemCatChem, 2013, 5, 192–200 CrossRef CAS.
- K. X. Wang, M. Tong, Y. N. Yang, B. Y. Zhang, H. L. Liu, H. X. Li and F. Zhang, Green Chem., 2020, 22, 7417–7423 RSC.
- Y. T. Gong, M. M. Li, H. R. Li and Y. Wang, Green Chem., 2015, 17, 715–736 RSC.
- Z. Y. Zhou, Y. N. Xie, W. Z. Zhu, H. Y. Zhao, N. J. Yang and G. H. Zhao, Appl. Catal., B, 2021, 286, 119868 CrossRef CAS.
- T. Wei, B. L. Niu and G. H. Zhao, ACS Appl. Mater. Interfaces, 2020, 12, 39273–39281 CrossRef CAS PubMed.
- Y. Wang, X. C. Wang and M. Antonietti, Angew. Chem., Int. Ed., 2012, 51, 68–89 CrossRef CAS PubMed.
- Y. Markushyna, C. A. Smith and A. Savateev, Eur. J. Org. Chem., 2020, 1294–1309 CrossRef CAS.
- A. Savateev, I. Ghosh, B. Konig and M. Antonietti, Angew. Chem., Int. Ed., 2018, 57, 15936–15947 CrossRef CAS PubMed.
- H. Tan, X. Gu, P. Kong, Z. Lian, B. Li and Z. Zheng, Appl. Catal., B, 2019, 242, 67–75 CrossRef CAS.
- H. Tan, P. Kong, M. X. Liu, X. M. Gu and Z. F. Zheng, Chem. Commun., 2019, 55, 12503–12506 RSC.
- J. Wang, W. Cui, R. Chen, Y. He, C. Yuan, J. Sheng, J. Li, Y. Zhang, F. Dong and Y. Sun, Catal. Sci. Technol., 2020, 10, 529–535 RSC.
- J. A. Singh, S. H. Overbury, N. J. Dudney, M. Li and G. M. Veith, ACS Catal., 2012, 2, 1138–1146 CrossRef CAS.
- B. Zhu, P. Xia, W. Ho and J. Yu, Appl. Surf. Sci., 2015, 344, 188–195 CrossRef CAS.
- A. Corma, P. Concepcion and P. Serna, Angew. Chem., Int. Ed., 2007, 46, 7266–7269 CrossRef CAS PubMed.
- M. J. Frisch, G. W. Trucks, H. B. Schlegel, G. E. Scuseria, M. A. Robb, J. R. Cheeseman, G. Scalmani, V. Barone, B. Mennucci, G. A. Petersson, H. Nakatsuji, M. Caricato, X. Li, H. P. Hratchian, A. F. Izmaylov, J. Bloino, G. Zheng, J. L. Sonnenberg, M. Hada, M. Ehara, K. Toyota, R. Fukuda, J. Hasegawa, M. Ishida, T. Nakajima, Y. Honda, O. Kitao, H. Nakai, T. Vreven, J. A. Montgomery, Jr., J. E. Peralta, F. Ogliaro, M. Bearpark, J. J. Heyd, E. Brothers, K. N. Kudin, V. N. Staroverov, T. Keith, R. Kobayashi, J. Normand, K. Raghavachari, A. Rendell, J. C. Burant, S. S. Iyengar, J. Tomasi, M. Cossi, N. Rega, J. M. Millam, M. Klene, J. E. Knox, J. B. Cross, V. Bakken, C. Adamo, J. Jaramillo, R. Gomperts, R. E. Stratmann, O. Yazyev, A. J. Austin, R. Cammi, C. Pomelli, J. W. Ochterski, R. L. Martin, K. Morokuma, V. G. Zakrzewski, G. A. Voth, P. Salvador, J. J. Dannenberg, S. Dapprich, A. D. Daniels, O. Farkas, J. B. Foresman, J. V. Ortiz, J. Cioslowski and D. J. Fox, Gaussian, Inc., Wallingford CT, 2013.
- A. D. Becke, J. Chem. Phys., 1993, 98, 5648–5652 CrossRef CAS.
- C. T. Lee, W. T. Yang and R. G. Parr, Phys. Rev. B: Condens. Matter Mater. Phys., 1988, 37, 785–789 CrossRef CAS PubMed.
- J. Cheng, Z. Hu, K. Lv, X. Wu, Q. Li, Y. Li, X. Li and J. Sun, Appl. Catal., B, 2018, 232, 330–339 CrossRef CAS.
- Y. Kang, Y. Yang, L. C. Yin, X. Kang, L. Wang, G. Liu and H. M. Cheng, Adv. Mater., 2016, 28, 6471–6477 CrossRef CAS PubMed.
- Y.-S. Jun, E. Z. Lee, X. Wang, W. H. Hong, G. D. Stucky and A. Thomas, Adv. Funct. Mater., 2013, 23, 3661–3667 CrossRef CAS.
- B. V. Lotsch, M. Doblinger, J. Sehnert, L. Seyfarth, J. Senker, O. Oeckler and W. Schnick, Chem. – Eur. J., 2007, 13, 4969–4980 CrossRef CAS PubMed.
- F. Dong, Z. Wang, Y. Sun, W.-K. Ho and H. Zhang, J. Colloid Interface Sci., 2013, 401, 70–79 CrossRef CAS PubMed.
- P.-G. Ren, D.-X. Yan, X. Ji, T. Chen and Z.-M. Li, Nanotechnology, 2011, 22, 055705 CrossRef PubMed.
- Y. Li, H. Xu, S. Ouyang, D. Lu, X. Wang, D. Wang and J. Ye, J. Mater. Chem. A, 2016, 4, 2943–2950 RSC.
- D. Yang, A. Velamakanni, G. Bozoklu, S. Park, M. Stoller, R. D. Piner, S. Stankovich, I. Jung, D. A. Field, C. A. Ventrice and R. S. Ruoff, Carbon, 2009, 47, 145–152 CrossRef CAS.
- D.-W. Wang and D. Su, Energy Environ. Sci., 2014, 7, 576–591 RSC.
- Y. O. Wang, M. K. Bayazit, S. J. A. Moniz, Q. S. Ruan, C. C. Lau, N. Martsinovich and J. W. Tang, Energy Environ. Sci., 2017, 10, 1643–1651 RSC.
- X. Gao, X. X. Liu, Z. M. Zhu, X. J. Wang and Z. Xie, Sci. Rep., 2016, 6, 30543 CrossRef CAS PubMed.
- J. Wu, X. Ji, X. Yuan, Z. Zhao, Y. Li, B. Wen, H. Zhang, D. Yu, Y. Zhao and Y. Tian, Chem. Mater., 2019, 31, 9188–9199 CrossRef CAS.
- Y. Q. Huang and J. Lessard, Electroanalysis, 2016, 28, 2716–2727 CrossRef CAS.
- Y.-J. Yuan, Z. Shen, S. Wu, Y. Su, L. Pei, Z. Ji, M. Ding, W. Bai, Y. Chen, Z.-T. Yu and Z. Zou, Appl. Catal., B, 2019, 246, 120–128 CrossRef CAS.
- K. M. Alam, P. Kumar, P. Kar, U. K. Thakur, S. Zeng, K. Cui and K. Shankar, Nanoscale Adv., 2019, 1, 1460–1471 RSC.
- W. S. Hou, Y. X. Li, S. X. Ouyang, H. Y. Chen, J. H. Ye, X. P. Han and Y. D. Deng, Chem. Commun., 2019, 55, 13279–13282 RSC.
- P. Xia, B. Cheng, J. Jiang and H. Tang, Appl. Surf. Sci., 2019, 487, 335–342 CrossRef CAS.
- Y. Shiraishi, M. Katayama, M. Hashimoto and T. Hirai, Chem. Commun., 2018, 54, 452–455 RSC.
- H. U. Blaser, Science, 2006, 313, 312–313 CrossRef CAS PubMed.
- M. X. Liu, M. T. Gao, L. J. Pei, Y. L. Ji, X. M. Gu, H. Wang, H. Tan, J. Zhao, J. F. Jia and Z. F. Zheng, Appl. Catal., B, 2021, 284, 119710 CrossRef CAS.
- Y. Xiong, X. X. Cui, M. M. Zhang, Y. J. Wang, Z. N. Lou and W. J. Shan, Appl. Surf. Sci., 2020, 510, 145414 CrossRef CAS.
- M. Shalom, S. Inal, C. Fettkenhauer, D. Neher and M. Antonietti, J. Am. Chem. Soc., 2013, 135, 7118–7121 CrossRef CAS PubMed.
- S. E. Guo, Z. P. Deng, M. X. Li, B. J. Jiang, C. G. Tian, Q. J. Pan and H. G. Fu, Angew. Chem., Int. Ed., 2016, 55, 1830–1834 CrossRef CAS PubMed.
- A. Schwarzer, T. Saplinova and E. Kroke, Coord. Chem. Rev., 2013, 257, 2032–2062 CrossRef CAS.
- P. F. Xia, B. Cheng, J. Z. Jiang and H. Tang, Appl. Surf. Sci., 2019, 487, 335–342 CrossRef CAS.
Footnotes |
| † Electronic supplementary information (ESI) available: N2 absorption-desorption isotherms, SEM and TEM images, TEM-EDS, XPS, M–S plot, quantitative analysis of –OH, elemental analysis results, the influence of catalyst dosage, the fitting parameters of the TRPL decay curves, in situ DRIFTS, the effect of solvent on selectivity, time dependent profiles of the scale-up experiment, summary of the photocatalytic conversion of nitrobenzene over various catalysts, reusability of PCN-160, AQE calculation. See DOI: 10.1039/d1gc00325a |
| ‡ These authors contributed equally. |
| This journal is © The Royal Society of Chemistry 2021 |