 Open Access Article
Creative Commons Attribution 3.0 Unported Licence
Experimental and theoretical studies on the formation of pure β-phase polymorphs during fabrication of polyvinylidene fluoride membranes by cyclic carbonate solvents†
Norafiqah
Ismail
a,
Mohamed
Essalhi
 a,
Mahmoud
Rahmati
b,
Zhaoliang
Cui
c,
Mohamed
Khayet
 de and
Naser
Tavajohi
 *a
*a
aDepartment of Chemistry, Umeå University, 90187 Umeå, Sweden. E-mail: naser.tavajohi@umu.se; Tel: +46 90 786 6061
bDepartment of Chemical Engineering, Graduate University of Advanced Technology, Kerman, Iran
cState Key Laboratory of Materials-Oriented Chemical Engineering, College of Chemical Engineering, Nanjing Tech University, Nanjing 211816, PR China
dDepartment of Structure of Matter, Thermal Physics and Electronics, Faculty of Physics, University Complutense of Madrid, Avda. Complutense s/n, 28040, Madrid, Spain
eMadrid Institute for Advanced Studies of Water (IMDEA Water Institute), Calle Punto Net No. 4, 28805, Alcalá de Henares, Madrid, Spain
First published on 25th February 2021
Abstract
The use of highly toxic solvents presents significant risks to both the environment and human health. Therefore, the adoption of green solvents will be crucial for achieving sustainable membrane production. This work reports the use of inexpensive environmentally friendly biobased and biodegradable cyclic carbonate solvents, namely ethylene carbonate (EC), propylene carbonate (PC), and butylene carbonate (BC), to fabricate polyvinylidene fluoride (PVDF) membranes. The solvent dependence of the phase inversion mechanisms, morphology, crystalline structures, and polymorphism of the prepared PVDF membranes were investigated. Polymorph analysis revealed that membrane fabrication in EC or PC yielded exclusively the β-phase product, whereas PVDF membrane fabrication in BC yielded a mixture of α and β phase material. The mechanism of β-phase formation was investigated using molecular dynamics simulation and shown to depend on the extent of hydrogen bonding at the polymer–solvent interface. The PVDF membrane formed in EC exhibited the highest porosity and pure water permeability, and was therefore tested in direct contact membrane distillation (DCMD), exhibiting promising results in terms of permeate flux and salt rejection. These results suggest that large-scale production of piezoelectric PVDF membranes using green solvents should be practically feasible.
1. Introduction
The performance of the low-energy intensive separation units such as membrane separation technologies depends strongly on the properties of the separatory material interacting with the chemical constituents of an industrial stream. One group of interesting materials considered for membrane preparation is fluoropolymers among which poly(vinylidene fluoride) (PVDF) is the most popular due to its attractive properties and good processability.Homopolymeric PVDF contains 59.4 wt% fluorine and 3 wt% hydrogen.1 The crystalline phase of PVDF has three different molecular conformations (TGTG′, TTT, and TTTGTTTG′) and five crystal polymorphs: phase I (β-phase), phase II (α-phase), phase III (γ-phase), δ, and ε. Phases I, II, and III (see Fig. 1) are the most frequent crystalline polymorphs of PVDF. The α-phase is kinetically favoured, but the β-phase is the most thermodynamically stable. Detailed information on each crystalline polymorph is presented in Table 1.
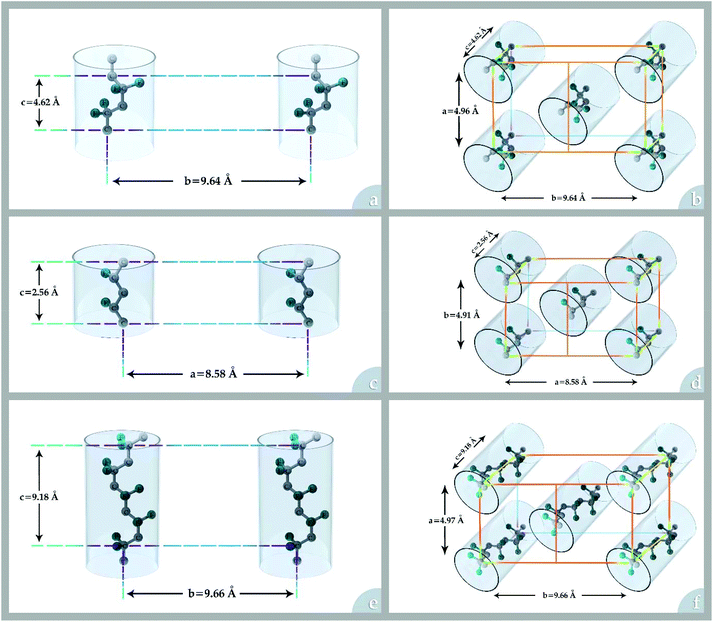 | ||
| Fig. 1 The conformations and crystal cells for most frequent crystalline polymorphs of PVDF: (a) and (b) α-phase (c) and (d) β-phase and (e) and (f) γ-phase. | ||
β-Phase PVDF has useful piezo-, pyro-, and ferroelectric properties. Piezoelectric PVDF membranes vibrate when an AC current is passed through them. This property has recently attracted much interests because it could potentially be exploited to control membrane fouling. For example, Darestani et al.2 showed that fouling of piezoelectric PVDF membranes can be controlled by a synergistic combination of piezoelectric vibration and high crossflow velocity. Similar results were reported by Zhang et al.,3 whose studies on PVDF/acetyl tributyl citrate/ionic liquid systems revealed that applying an AC current to PVDF membranes increased the water permeate flux by around 90.6% for a CaCO3 aqueous solution and 53.8% for a Bovine Serum Albumin (BSA) aqueous solution. These results indicate that vibration reduces the fouling potential of piezoelectric PVDF membranes during filtration, regardless of the nature of the fouling materials, but it is most efficient for systems with larger particle sizes (e.g. CaCO3). In another work using the same polymeric system, Cao et al.4 observed that applying a mild AC voltage to β-phase PVDF membranes reduced contaminants deposition on the membrane surface and concluded that this was due to current-induced in situ vibrations that increased water permeate flux and reduced the tendency for membrane fouling. Chen et al.5 suggested that the vibrations of piezoelectric PVDF membranes might also generate waves in the surrounding medium (e.g. water or air), and developed self-cleaning membranes based on this concept. Particularly when the velocity of vibration is high, such vibrations generate lift forces due to shearing, along with an inertial force acting on the membrane surface and pores. These forces drive the membrane's main cleaning mechanism.
As for other polymeric membranes, the phase inversion method is the most common technique employed for PVDF membrane preparation in both industry and academia. In this method, the desired amount of polymer is dissolved in an appropriate solvent, after which phase separation is induced by an external factor. Commonly used phase inversion methods include nonsolvent induced phase separation (NIPs), temperature induced phase separation (TIPs), vapor induced phase separation (VIPs) and evaporation induced phase separation (EIPs).
The choice of solvent used for the dissolution of PVDF has become a critical issue in recent years. An ideal solvent should have good compatibility with the polymer, a high boiling point, a low molecular weight (to facilitate extraction of residual solvent from membrane structure), while also being inexpensive and overall environmentally friendly. The later property is critical for sustainable membrane production because the most popular solvents for fabricating PVDF membranes are toxic and harmful to the environment. Xie et al.9 evaluated the sustainability of membrane technology and analyzed the parameters that negatively affected it. The three solvents most commonly used in industrial membrane production at present are N-methyl-2-pyrrolidone (NMP), N,N-dimethylformamide (DMF), and N,N-dimethylacetamide (DMAC). According to the International Agency for Research on Cancer (IARC),10 all three are potential teratogenic compounds that may cause congenital fetal malformation.11 Other commonly used solvents include diphenyl ketone (DPK), which tends to form carcinogenic compounds under UV radiation,12 and phthalate-based solvents, most of which accumulate in biological tissues.13,14 The need to move away from these harmful solvents is amplified by the large volume of wastewaters generated during industrial membrane fabrication, which exceeds 50 billion liters annually.15
During the past decade, several green solvents have been proposed for PVDF membrane fabrication, including glycerol triacetate (triacetin),16,17 maleic acid dibutyl ester,18 triethylene glycol diacetate,19 acetyl tributyl citrate,11 tributyl citrate,20 methyl-5-(dimethylamino)-2-methyl-5-oxopentanoate (Polarclean®),21,22 Cyrene®,23 dimethyl isosorbide,24 and ionic liquids (ILs).25 Wu et al.26 adopted the strategy of mixing the toxic solvent with a green solvent to decrease the negative environmental impact of the preparing ultrafiltration membranes. However, two factors must be considered when evaluating these reports and the suitability of green solvents for PVDF membrane fabrication. First, many of these studies considered only membrane fabrication without addressing the overall solvent life cycle. Second, many of these solvents are only available in limited quantities and are costlier than toxic solvents.27 Therefore, they are often only suitable for smaller industrial applications involving high value products. For example, ILs offer tunable properties based on the wide range of cations and anions from which they can be prepared. Although all ILs have negligible vapor pressure and are non-flammable, their toxicity is poorly characterized, which is a significant problem for their potential use as green solvents.28 Furthermore, their biodegradability depends strongly on the properties of their constituent cations and anions.29 Another barrier to large-scale industrial uses of ILs is the difficulty and cost of their synthesis.
Organic carbonates, which have been known since the 1950s, are an interesting alternative to the above mentioned solvents. They are available in large quantities at low prices (the total worldwide production of organic carbonates in 2007 was around 1 megaton). They are the esters of carbonic acid that exhibit low (eco)toxicity and complete biodegradability.30,31 Unfortunately, their uses in membrane preparation are underexplored. To date, studies regarding organic carbonates are limited to propylene carbonate (PC). For instance, Su et al.32 and Yang et al.33 studied the PVDF membrane formation by using several solvents, including PC. Cui et al.34 studied the effect of diluents mixture (PC/dioctyl terephtalate) on PVDF hollow fiber membrane characteristics. Fang et al.35 used a mixture of PC and diphenyl carbonate for polymer dope solution preparation and PC solution as an extruding solvent for the outer layer to prepare dual-layer PVDF hollow fiber membrane. Recently, Rasool et al.36 studied the potential of organic carbonates for membrane preparation via NIPs method using various polymers (not including PVDF) with organic carbonates and mixtures of organic carbonates with the toxic solvent NMP. However, PVDF was not used in their study although it is one of the popular polymers industrially employed for the fabrication of membranes. Meanwhile, the study by Yadav et al.27 has confirmed that membrane fabricated with ethylene carbonates exhibits the lowest environmental impact and cost as compared with PVDF with toxic solvents (NMP, DMAC and DMF). Moreover, in PVDF membrane literature, there is still a lack of information about the formation of PVDF membranes, particularly β-phase PVDF, in solvents such as cyclic organic carbonates, and the effect of the solvent's chemical structure on PVDF polymorphism.
In this study, we propose the preparation of PVDF membranes using three green, cheap, and biodegradable cyclic carbonate solvents: ethylene carbonate (EC), PC, and butylene carbonate (BC) by a combined NIPs and TIPs method. The chemical structures and properties of these solvents are presented in Table 2. Particular emphasis is placed on identifying a scalable approach for producing pure β-phase PVDF membranes. The mechanism of β-phase formation in carbonate solvents is investigated experimentally and confirmed by molecular dynamics simulation. The physicochemical properties of the as-prepared membranes are studied and the most promising membrane application for distilled water production by direct contact membrane distillation (DCMD) is investigated and compared with previous publications.
| a Data collected from Hansen Solubility Parameters: A User's Handbook.37 b Data collected from Chernyak.38 | |||
|---|---|---|---|
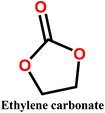
|
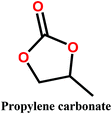
|
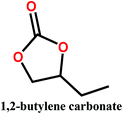
|
|
| Density at 25 °C (g cm−3) | 1.3312 | 1.1981 | 1.14 |
| Melting point, °C | 36.3 | −55.0 | −45.0 |
| Boiling point, °C | 248.2 | 241.7 | 238.7 |
| Solubility in water at 25 °C | Soluble | Soluble | Low solubility |
| Dispersion Force (δD, MPa0.5) | 19.4a | 20a | 16.9b |
| Polar Force (δP, MPa0.5) | 21.7a | 18.0a | 18.9b |
| Hydrogen bond force (δH, MPa0.5) | 5.1a | 4.1a | 9.1b |
| R a | 11.40 | 9.94 | 6.52 |
2. Materials and methods
2.1. Materials
Polyvinylidene fluoride (PVDF) polymer (Solef 1015, MW = 534![[thin space (1/6-em)]](https://www.rsc.org/images/entities/char_2009.gif) 000 g mol−1) was kindly supplied by Solvay Specialty Polymers. The cyclic organic carbonate solvents EC, PC, and BC were purchased from Tokyo Chemical Industry Co. Ltd and used without purification. Kerosene was purchased from Sigma Aldrich Inc. and used as a wetting agent for porosity measurement.
000 g mol−1) was kindly supplied by Solvay Specialty Polymers. The cyclic organic carbonate solvents EC, PC, and BC were purchased from Tokyo Chemical Industry Co. Ltd and used without purification. Kerosene was purchased from Sigma Aldrich Inc. and used as a wetting agent for porosity measurement.
2.2. Membrane preparation
Polymer solutions were prepared by dissolving the appropriate amount of PVDF polymer (15, 17.5 and 20 wt%) in a cyclic organic carbonate solvent (EC, PC, or BC). The solution was then stirred at 130 °C until it became clear and homogeneous, after which it was cast on a glass plate kept at 50 °C using an automatic film applicator (200 μm thickness) and immersed in a coagulation bath held at 20 °C. After coagulation, the produced membranes were rinsed with distilled water and dried for 24 h.2.3. Membrane characterization
A Field Emission Scanning Electron Microscope (FE-SEM) from Carl Zeiss was used to obtain membrane surface and cross-section images. The membrane samples were freeze-cracked in liquid nitrogen and mounted on conductive carbon tape. To reduce sample charging under the electron beam, samples were coated with a 5 nm thick palladium layer using a Quorum Q150T-ES Sputter Coater. The SEM images were analyzed by using ImageJ software in order to determine the diameter of the spherulites. At least three SEM images for each membrane were analyzed, and the diameters of a total number of 100 spherulites were measured. Statistical analysis was applied in order to determine the spherulites diameter by Normal (Gaussian) Distribution (i.e. the histogram of the spherulites diameter).Pure water permeability (PWP) tests were conducted at room temperature using a dead-end Amicon stirred cell. The water fluxes through the membranes were measured at a trans-membrane pressure of 1 bar. The effective diameter of the filtration area was 40 mm. Due to the strong hydrophobicity of PVDF, the investigated membranes were first immersed in an ethanol solution and then washed with water prior to the PWP experiment. Initially, the membrane was pre-compacted at a pressure above 1 bar for 10 min to establish a stable permeate flux before testing. The average water permeate flux was obtained using three membrane samples prepared under the same conditions, and each membrane was tested at least three times. The PWP (L m−2 h−1 bar−1), was determined using the following equation:
 | (1) |
After measuring the dry weight of the membranes, they were wetted by immersion in kerosene for 24 h, after which their wet weight was determined using the following equation:
 | (2) |
Here, mw and md are the weights of the wet and dry membranes, respectively. ρk and ρp are the density of kerosene (0.81 g cm−3) and polymer (1.78 g cm−3), respectively. For each membrane, the porosity was determined from the average of five measurements.
X-Ray Diffraction (XRD) was performed using a PANalytical X'Pert PRO X-ray diffractometer with Cu-Kα radiation (wavelength: 0.154 nm) operated at 40 kV and 40 mA. The samples were scanned in the 2θ range of 10° to 40° at a rate of 0.5° min−1 using a silicon-based specimen holder. The 1/2° divergence slit size was fixed for all measurements.
Fourier transform infrared spectroscopy of the membranes was carried out using a Bruker (Vertex 80) spectrometer in the range of 600–1600 cm−1 with a resolution of 2 cm−1, using the ATR (attenuated total reflection) transmission mode.
A differential scanning calorimeter (DSC, Q-20, USA) was used to measure the crystallization temperature (TC) of the PVDF/solution samples. To this end, PVDF polymer was first dissolved in the appropriate cyclic carbonate solvent (EC, PC, or BC) at the desired concentration (15, 17.5, or 20 wt%) at 150 °C until a homogenous solution formed. The sample was placed in an enclosed specific experimental pan and heated to 180 °C for 10.0 min, then cooled to 20 °C at 10 °C min−1. The Tc value was then determined by software analysis.
The Liquid Entry Pressure (LEP) is the minimum pressure that must be applied over a liquid before it penetrates into non-wetted (dry) membrane pores. LEP measurements for distilled water and 30 g L−1 NaCl aqueous solution were performed using a dead-end filtration module. The applied pressure was gradually increased by 5 kPa every 4 min using nitrogen gas (N2). Mean values and standard deviations were obtained by testing three different samples taken from different parts of the same membrane.
The “bubble-point” test was used to determine the maximum pore size of a porous membrane using the standard test method described elsewhere.39 The gas pressure needed for a liquid to penetrate a pore is inversely proportional to the pore size. Thus, for a porous membrane, liquid penetration occurs first through the largest pores. As the gas pressure rises, water is gradually pushed into the largest pore of the membrane. Once the gas pressure becomes high enough to overcome the capillary force of the liquid inside the pores, the liquid appears on the other side of the membrane. In this case, the Young–Laplace equation is used to calculate the maximum pore diameter dp, max (μm):
dp, max = 4γcos![[thin space (1/6-em)]](https://www.rsc.org/images/entities/char_2009.gif) θ/P θ/P | (3) |
 | (4) |
2.4 Molecular dynamics simulation
Molecular dynamics (MD) simulations were performed to investigate the polymorphism of PVDF polymers in cyclic carbonate solvents (EC, PC, and BC). In the first step, the solubility parameter and density of the pure solvents were estimated. The formation of β-phase and α-phase PVDF in the three solvents was then investigated, and the simulations’ results were analyzed by considering the Radial Distribution Function (RDF), the relative concentration, and hydrogen bonding.The simulations were performed with Materials Studio package (BIOVIA Accelrys, version 4.3) using the COMPASS force field (Condensed phase Optimized Molecular Potentials for Atomistic Simulation Studies).40 Previous studies have shown that this force field gives acceptable results for polymers and their solvents.41–44
For each solvent, a simulation box containing 100 solvent molecules with an initial density of 0.4 g cm−3 was constructed and equilibrated for 1 ns to estimate the density and solubility parameters of the pure solvents in the NPT ensemble (i.e. with a constant number of molecules, temperature, and pressure) at 1 bar (Berendsen barostat45) and 300 K (Nose thermostat46). Periodic boundary conditions, the Verlet algorithm,47 and a time step of 1 fs were used in all MD simulations.
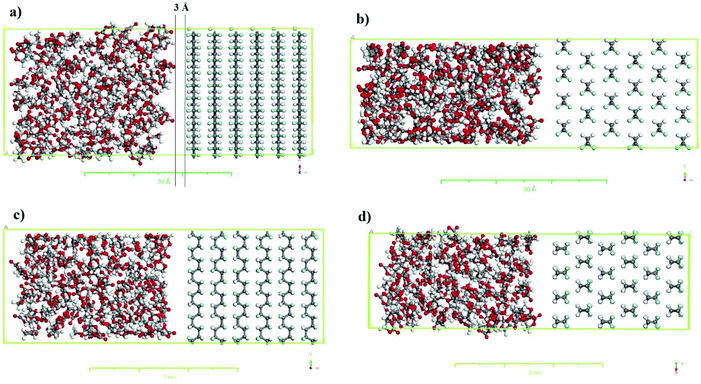
The simulation boxes containing PVDF surfaces in contact with the solvent were constructed using the equilibrium density of the solvent to investigate the interactions between the solvent and the PVDF surface. For this purpose, supercells for different crystalline polymorphs (i.e., α-PVDF and β-PVDF) were created using the appropriate crystalline coordinates (see Table 1), repeating periodically along the x, y and z-axes. The corresponding crystal sizes are listed in Table S.1,† and details of the simulation box setup are presented in Table S.2.† As an example, the simulation boxes for the α and β PVDF phases in contact with the EC are shown in Fig. 2.
The simulation boxes were equilibrated using the NVT ensemble (i.e. a constant number of molecules, volume, and pressure) for 300 ps, after which the MD simulation was run for 10 ns using the NPT ensemble at 300 K and 1 bar to obtain the final equilibrium PVDF surface and solvent molecule distribution. Structures were sampled at 10 ps intervals along the MD trajectory. Finally, all possible hydrogen bonds between the solvent molecules and the PVDF surface were calculated.48
The interactions of EC, PC, and BC with the PVDF surface were evaluated by computing the RDF at 300 K. The RDF represents the probability density of finding atoms j at a distance r from atom i, averaged over the equilibrium density, and can be expressed as follows:
 | (5) |
2.5. Direct contact membrane distillation (DCMD)
The membrane with the highest porosity and pure water permeability was used for desalination by DCMD using a lab-scale set-up (Fig. S.1†). The membrane was placed between two chambers of a stainless steel flat sheet module (model CPR920, Convergence Industry B.V; Netherlands). DCMD was initially performed using distilled water with an electrical conductivity below 4.5 μS cm−1 to detect potential leakage in the set-up. The permeate flux (Jw) was obtained from eqn (6) by monitoring the mass of permeate over time using a precision balance (PCE Iberica S.L. Instruments, model PCE-BSH 10000) connected to a computer: | (6) |
The feed and permeate temperatures were controlled by an electromantle thermostat (model EMX5000/SCE, Electrothermal; UK) and a recirculation chiller (model CFT-75, VESLAB instruments. Int.; USA), respectively. The feed and distillate were circulated co-currently through their respective channels using Magnetic Coupling Water Pumps (Xylem Flojet, HPR6/8, Totton Pumps Ltd, UK). TMU thermometers (Papouch store s.r.o.; Czech Republic) with USB interfaces were installed at both the inlets and outlets of the membrane module and were connected to a computer, in which a software automatically recorded the inlet and outlet temperatures every 30 s. The permeate inlet temperature (Tp,in) was maintained at 20 °C, while the feed inlet temperature (Tf,in) was varied from 40 to 80 °C. Distilled water and an aqueous solution of 30 g L−1 NaCl were used as feed. Both the feed and permeate flow rates were kept constant at ∼0.51 L min−1. The electrical conductivity of both the feed and permeate solutions was measured with a conductivity meter (edge, model HI2003, Hanna instruments Inc., USA) and used to determine the corresponding salt concentrations and salt separation factor (β) based on following equation:
 | (7) |
3. Results and discussion
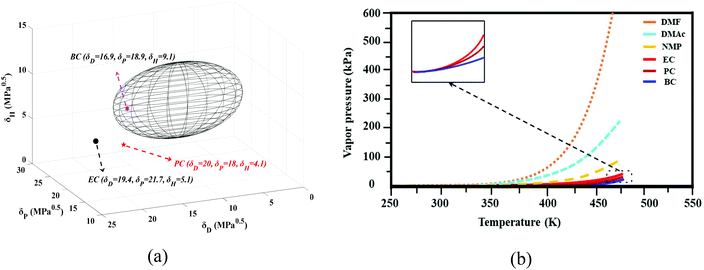
The group contribution method was used to determine the solubility parameters of the cyclic organic carbonates (EC, PC, and BC) for PVDF. Based on these parameters, it is expected that PVDF, which has a solubility parameter of δ = 23.2 MPa0.5 (δD = 17.1 MPa0.5, δP = 12.6 MPa0.5, δH = 10.6 MPa0.5, R0 = 5)49–52 should be soluble in BC but not in PC and EC (see Fig. 3a). However, it is worth considering the impact of the temperature on solvation and the accuracy of the Hansen solubility parameter. As noted by other researchers, calculated solubility parameters represent only rough approximations of a system's actual behavior.36 In this study, increasing the temperature enhanced the solvation power of the studied cyclic carbonates. The three solvents (EC, PC, and BC) dissolved PVDF at elevated temperatures (130 °C), allowing membrane formation to be achieved by the TIPs method. These solvents are water-soluble, allowing phase inversion to be induced by solvent/nonsolvent exchange (NIPs). Consequently, both the TIPs and NIPs mechanisms contributed to the studied membrane formation process.A key advantage of cyclic carbonates in membrane preparation is their low vapor pressure. Fig. 3b compares the vapor pressure of some polar aprotic solvents that are widely used in membrane preparation to that of cyclic carbonates (the thermodynamic correlations used to estimate the vapor pressure are presented in the ESI together with Table S.3†). The vapor pressures of EC, PC, and BC are much lower than those of the polar aprotic solvents, indicating that cyclic carbonates are preferable from both safety and sustainability perspectives.
3.1 Membrane characteristics
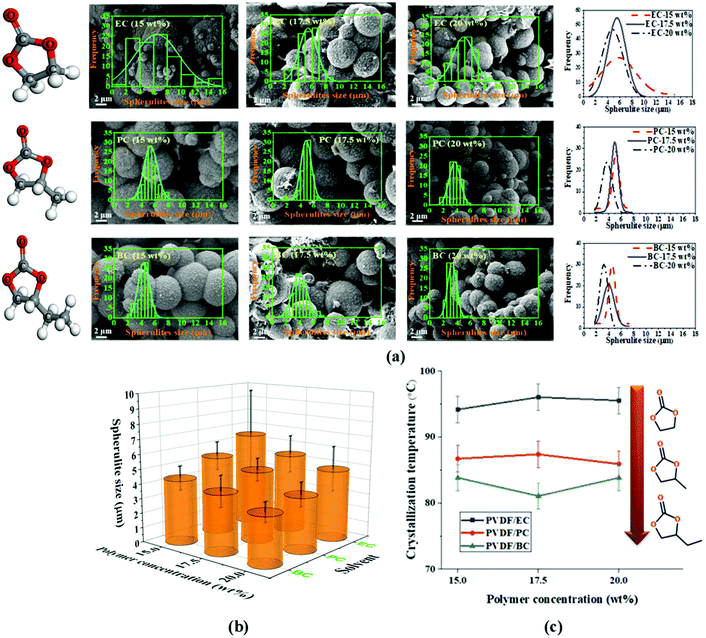
The TIPs process is a non-equilibrium process, so its analysis requires consideration of temperature effects. In particular, the cooling conditions are a key kinetic parameter that determines the spherulitic structure of the formed PVDF membrane. In this study, we kept the polymer solution and quenching bath temperature constant, at room temperature 20 ± 2 °C, for two reasons. First, other research studies have already investigated the effects of varying these parameters,11,19,53,54 and second the change of the quenching bath temperature affects energy consumption and environmental impact of membrane fabrication, both of which are important for sustainable membrane fabrication.All prepared membranes in this study exhibit a spherulitic structure. Fig. 4a and b shows the morphology, spherulitic size, and spherulitic distribution of the PVDF membranes prepared with cyclic carbonate solvents. This can be attributed to the phase inversion mechanism (i.e., solid–liquid phase inversion) of semi-crystalline PVDF in cyclic carbonate solvents. Due to the favorable interaction between PVDF and the solvents (EC, PC, and BC), PVDF crystallization occurs before liquid–liquid phase separation, resulting in a spherulitic structure. Fig. 4c shows the crystallization temperature of PVDF in EC, PC, and BC at different concentrations (15, 17.5, and 20 wt%). A decrease of the crystallization temperature can be seen with the increase of the alkyl chain length of the cyclic organic carbonate solvents but it maintains almost the same with the increase of the PVDF concentration.
The nucleation density is an important parameter in solid–liquid phase inversion because spherulites form by growing from a nucleus into lamellae that in turn gives rise to a sheaf-like structure known as axialites, which finally develop into spherulites.55 For the same solvent, the nucleation density is directly proportional to the polymer content of the solution. The effect of the polymer concentration (15, 17.5, and 20 wt%) on the morphological structure of the PVDF membrane is presented in Fig. 4a and b. As can be seen, the nucleation density clearly increases with the increase of the polymer concentration, and the final spherulite size decreases with the increase of the nucleation density. The reduction in spherulite size and the volume of the inter-spherulite spaces is confirmed by a concomitant decrease in the overall membrane porosity, as shown in Fig. 5a. Similar trends were observed in other studies for PVDF membranes prepared with toxic solvents.56 Additionally, spherulites formed at higher polymer concentrations exhibited more uniform structures. The polymer's crystallization depends on the magnitude of the crystallization driving force (i.e. the difference in the polymer's chemical potential in the crystalline and solution phases). At low polymer concentrations, the driving force is not strong enough to induce the growth of all formed nuclei, resulting in the formation of some fully developed sphereulitic with some smaller spherulitic structures (Fig. 4a and b).
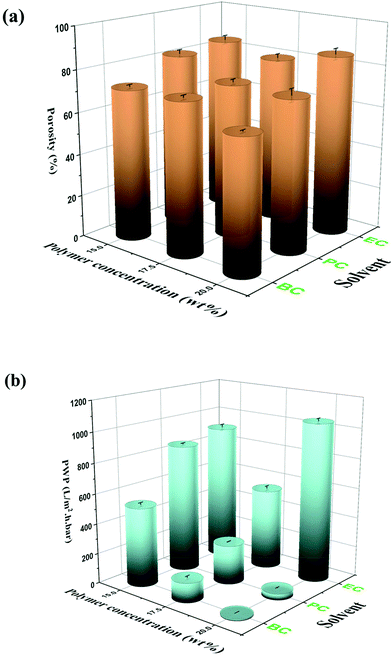 | ||
| Fig. 5 (a) Porosity and (b) PWP of the PVDF/EC, PVDF/PC and PVDF/BC membranes prepared with different polymer concentrations. | ||
Changing the solvent's chemical structure affected the final morphological structure of the membrane as shown in Fig. 4a. Specifically, increasing the solvent's alkyl chain length increased the solvent's compatibility with PVDF (Fig. 4a). This in turn decreased the crystallization temperature (Fig. 4c) and strengthened the thermodynamic driving force of nucleation, leading to an increased nucleation density (Fig. 4a). This phenomenon results in a decrease of both the spherulitic size and the inter-spherulitic space. As stated before, these changes in membrane morphology affect the overall porosity. Lengthening the alkyl side chain of the solvent structure reduced the volume of the inter-spherulitic spaces and a decrease of the overall porosity (see Fig. 5a).
The PWP of the prepared PVDF membranes with different solvents and different polymer concentrations is shown in Fig. 5b. As reported previously, longer alkyl side chain of the solvent molecule reduced the spherulitic size, the inter-spherulitic space, and the overall porosity. This results in a decline of the PWP. A similar trend was observed upon increasing the polymer concentration. Higher polymer concentrations tended to increase the nucleation density, reducing the volume of the inter-spherulitic spaces, overall porosity, and PWP. However, this trend was not followed in the case of EC prepared with 20 wt% PVDF. In this case, the PWP was actually greater than that of the membrane prepared with 17.5 wt% PVDF. This unexpected result can be attributed to a significant reduction of the thickness of the membrane's skin layer at the higher polymer concentration (i.e. 20 wt%), which is readily apparent in the SEM images presented in Fig. S.2a.†
3.2 Polymorphism experimental observation
The XRD and FTIR spectra of the PVDF membranes prepared with different solvents and polymer concentrations are presented in Fig. 6. The β-phase predominates in the membranes prepared with EC and PC solvents because the only visible peak for these membranes is that at 20.26°. The FTIR spectra of these two membranes prepared with EC and PC supported the finding that the β-phase predominated in these cases because their transmittance peaks were registered at 840 cm−1 and 1275 cm−1,57,58 indicating β-phase formation. Meanwhile, no peaks were detected at 488, 532, 615, 766, 795, 854, 976, 1383, and 1423 cm−1,59,60 indicating the absence of the α-phase. Similar results were obtained for the membranes prepared with different polymer concentrations, indicating that the polymer concentration did significantly affect the polymorph distribution.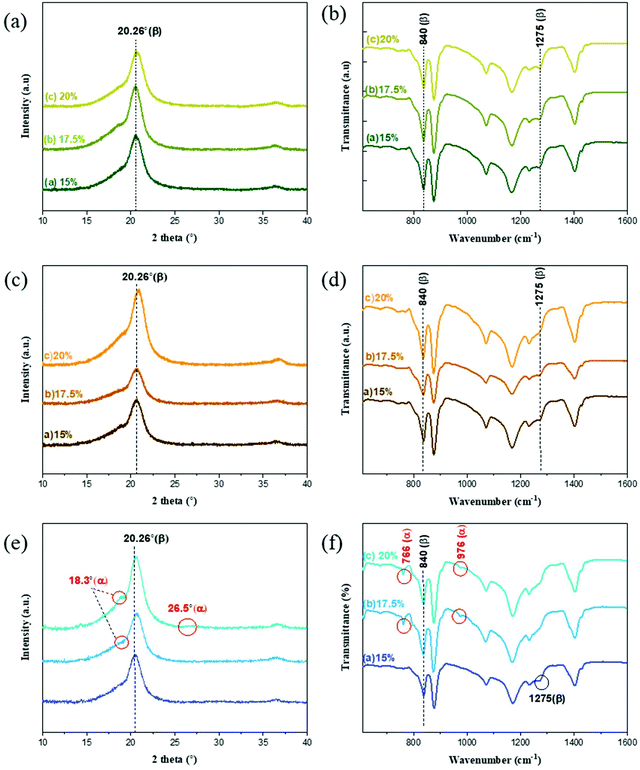 | ||
| Fig. 6 XRD (left) and FTIR (right) data of the PVDF membranes prepared with different polymer concentrations with (a and b) EC, (c and d) PC and (e and f) BC solvents. | ||
The membranes prepared with BC exhibited different trends. The XRD spectra indicated the decrease of the β-phase formation as the polymer concentration was increased from 15 to 20 wt%. There were no clear α peaks in the FTIR spectra of the membrane formed with 15 wt% polymer concentration, but the FTIR data clearly indicated the coexistence of the α and β-phases for the membranes prepared with higher polymer concentrations 17.5 and 20 wt%. Additionally, the relative abundance of the α-phase increased with the polymer concentration. It may be explained by the relatively long alkyl side chain of BC that weakens the forces favoring oriented dipole packing, preventing adoption of the TTT conformation and leading to a preference for the thermodynamically more stable α-phase (TGTG) conformation.
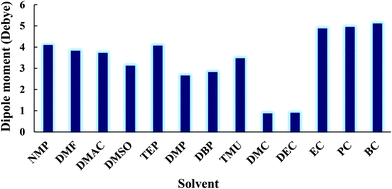
The formation of the β-phase can be attributed to the strong electrostatic interaction of the PVDF chain with EC and PC solvents. The polarity of the solvent, the dipole–dipole interactions, and the hydrogen bonding at the interface between PVDF nuclei and the solvent molecules will all favor the conformation that optimizes the packing of the CH2–CF2 dipoles (i.e. the TTT conformation).61 The role of the solvent polarity in β-phase formation was highlighted by Gregorio et al.62 and Hassankiadeh et al.21 As shown in Fig. 7, cyclic carbonates have greater dipole moments than other solvents commonly used in membrane fabrication. This favors the formation of the all-trans (TTT) conformation and subsequently β-phase predomination. Large solvent dipoles will be stabilized by the net dipole of β-PVDF more strongly than by the non-polar α-phase. In the β-phase, PVDF has a permanent dipole moment of 2.1 Debye per monomer unit, whereas the dipole moment per monomer unit of the α-phase is only 1.3 Debye.63 When a solvent with a high dipole moment interacts with PVDF, strong electrostatic interactions will favor the formation of locally extended chain coils. Therefore, the all-trans conformation (i.e. the β-phase) is readily formed in solvents with high dipole moments. Conversely, when PVDF is dissolved in solvents with a lower dipole moment, the solvent interacts less strongly with PVDF and results in the formation of unexpanded or shrunken globules favoring therefore the twisted α-phase conformation.64
It must be mentioned that hydrogen bonding at the interface of PVDF and solvent is another key factor governing β-phase formation. Interfacial hydrogen bonds are formed between hydrogen or fluorine atoms in PVDF and the solvent. To clarify the contribution of such interfacial hydrogen bonding in the formation of β-phase PVDF in carbonate solvents, MD simulations were performed as stated previously.
3.3 Polymorphism simulation observation
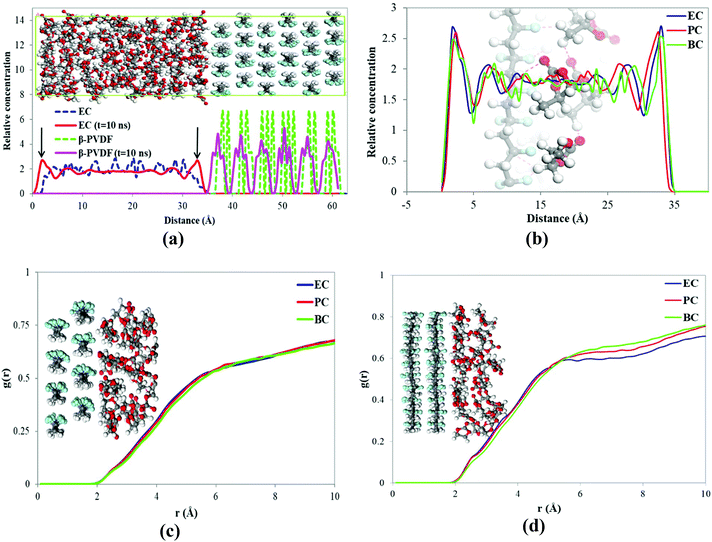
The density and the solubility parameter of the pure cyclic organic carbonate solvents were calculated from the results of MD simulations with the COMPASS force field and are shown in Table 3. The simulations’ results of the solubility parameter were underestimated by 11.3 to 16.9%; however the density simulations’ results agree well with the experimental indicating that MD described the solvents’ behaviors reasonably well. The interactions between the solvents (EC, PC, and BC) and PVDF surfaces (α and β-phase) were then investigated by MD. The relative concentrations of EC and β-PVDF in contact with each other in the simulation box before and after the simulation are shown in Fig. 8a. Before the simulation, the relative concentration of EC in the simulation box indicates that the solvent molecules were evenly dispersed; their minimum distance from the PVDF surface is 3 Å (see Fig. 2) and there is no sharp peak in their relative concentration diagram (Fig. 8a). However, at the end of simulation, two peaks of 1.79 and 32.99 Å (because of the periodic boundary conditions used in the MD simulation) appeared in the relative concentration of EC (red line), confirming that the solvent molecules oriented themselves close to the β surface. Additionally, there are regular sharp peaks in the relative concentration of solvent molecules in contact with PVDF before the simulation and at its end, confirming that the crystal structure of β-phase PVDF is stable during the MD simulation. A snapshot of the simulation box at the end of simulation (see Fig. 8a) also indicated that the crystal structure of β-PVDF was stable.| Solvent | Density (g cm−3) | Solubility parameter ((J cm−3)0.5) | ||
|---|---|---|---|---|
| Simulation | Exp. | Simulation | Exp. | |
| EC | 1.27 ± 0.02 | 1.33 | 26.22 ± 0.80 | 29.55 |
| PC | 1.17 ± 0.02 | 1.19 | 23.63 ± 0.60 | 27.21 |
| BC | 1.11 ± 0.02 | 1.14 | 22.38 ± 0.40 | 26.93 |
Fig. 8b shows the relative concentrations of three different solvents (EC, PC and BC) in contact with the β-phase PVDF surface in the simulation box at the end of the simulation. There are two sharp peaks at 1.79 and 32.99 Å, indicating that solvent molecules accumulated near the β-PVDF surface. This can be attributed to an attraction between the solvent molecules and the β-PVDF surface that is similar in magnitude for all three solvents. The degree of solvent accumulation at the surface decreased in the order EC > PC > BC. This indicates that EC exhibited a greater number of interactions with the β-phase than PC and BC at shorter distances.
The RDFs of solvent molecules with PVDF surfaces are shown in Fig. 8c and d. There is no sharp peak in the RDF of solvent molecules with the PVDF surface because not surface. However, the PVDF the to access have all solvent molecules could result confirm that a number of solvent molecules are located 1.9 Å away from the PVDF surface, which can be explained by interfacial hydrogen bonding. The tendency of solvent molecules to be found at the PVDF–solvent interface again decreases in the order EC > PC > BC.
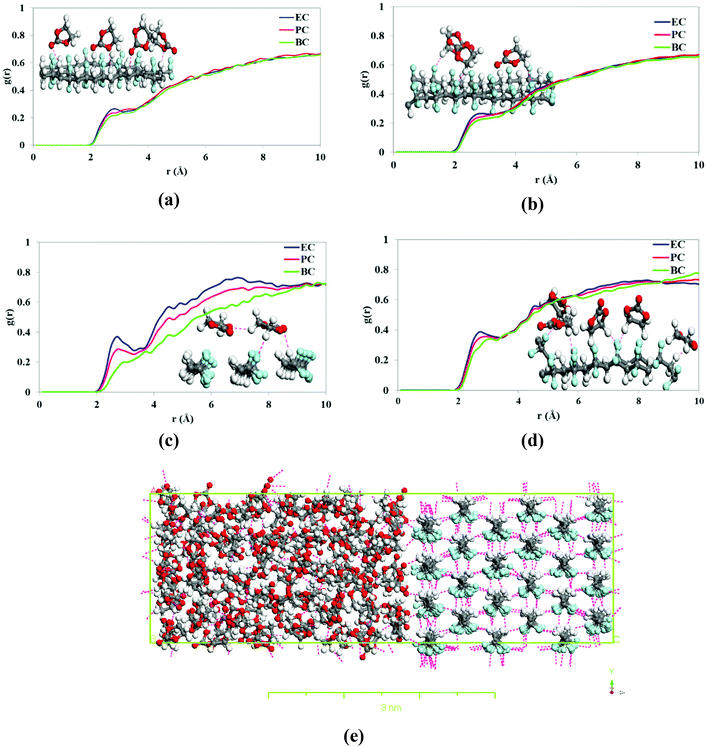
The RDFs of solvent atoms with H and F atoms of PVDF chains are shown in Fig. 9. The RDF plot for O atoms in solvent molecules and H atoms of β-PVDF at the interface (Fig. 9a) shows a relatively small peak at 2.7 Å. The largest and smallest peaks at this point were observed for EC and BC, respectively. Similarly, the results plotted in Fig. 9b indicate a relatively small peak at 2.7 Å in the RDFs for solvent H atoms and β-PVDF F atoms and this was larger for EC compared to PC and BC peaks. The RDFs of solvent O and H atoms with the H and F atoms of the α-PVDF surface displayed in Fig. 9c and d also show a relatively short peak at 2.7 Å being the longest and shortest peaks at this distance for EC and BC, respectively. These results confirm that the number of hydrogen bonds between the solvent and the α-PVDF surface is maximized in EC and minimized in BC. In other words, as the solvent's carbon chain length increases, the accessibility of the surface to the solvent molecules (and thus the number of interfacial hydrogen bonds) decreases. This was also observed for the β-PVDF surface. Therefore, the results in Fig. 9 confirm that the number of hydrogen bonds between the solvent and the PVDF surface is maximized in EC and minimized in BC, for both α- and β-PVDF. This is consistent with our experimental results and expectations; BC has a longer alkyl side chain that disrupts interfacial interactions and therefore cannot interact strongly with the PVDF chain and promotes the β-phase orientation.
The simulation box observed for EC in contact with the β-PVDF surface at the end of the simulation shown in Fig. 9e clearly demonstrates extensive hydrogen bonding between solvent molecules and also between solvent molecules at the surface and the polymer chain (pink lines). Previous studies65 have shown that C–O and C–F moieties are hydrogen bond acceptors that form C–H⋯F–C and C–O⋯H–C interactions. The hydrogen bonds between the solvent molecules and the polymer surface are thus formed between O and H atoms of solvent and H and F atoms of β-PVDF.
To evaluate the stability of the PVDF structures in contact with various solvents, the RDFs of the H and F atoms of PVDF chains were calculated and the results are shown in Fig. 10. The RDFs of the β-phase surface in contact with various solvents (see Fig. 10a) were identical, indicating that β-PVDF has a stable structure in all three solvents. Five peaks are observed at the same distances (r) for the three solvents, confirming the presence of the β-phase polymorph. However, the intensity of the peaks indicates that the relative abundance of the β-phase content decreases in the order EC > PC > BC. In other words, increasing the solvent's alkyl side chain lengths reduces the intensity of the RDF peak, indicating a reduced relative abundance of β-PVDF.
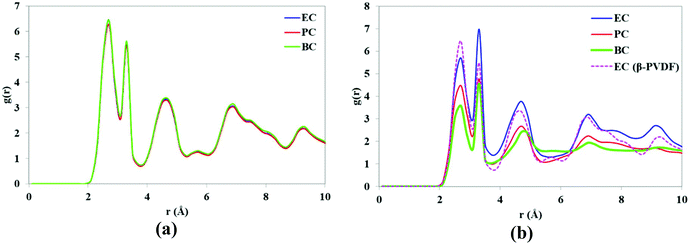 | ||
| Fig. 10 RDFs of H and F atoms of (a) β-PVDF and (b) α-PVDF (the RDF of β-PVDF in EC is included for comparative purposes). | ||
At the end of the simulation, the RDFs for EC with the two phases (α and β) of the PVDF surface were very similar, indicating that over the course of the simulation, the α-phase was partially transformed to the β-phase when in contact with EC. One would therefore expect PVDF polymer to adopt β-phase crystal conformations in the presence of EC, and that the relative abundance of β-PVDF structure would depend on the solvent's alkyl side chain length.
The number of hydrogen bonds at the surface–solvent interface was estimated based on the number of contacts within 3 Å for each solvent and PVDF polymorph. There was little variation in the numbers of hydrogen bonds formed with EC for the two surfaces due to their similar contact surfaces (Table 4). However, it was clear that the number of hydrogen bonds decreased as the length of the solvent alkyl side chain increased. This can be attributed to the fact that longer alkyl side chains interrupt the interactions of solvent O atoms with PVDF H atoms. Therefore, EC interacts strongly with PVDF chains and promotes their orientation in the β-phase while BC is less effective in this role.
| Solvent | Number of interfacial hydrogen bonds | |
|---|---|---|
| α-PVDF | β-PVDF | |
| EC | 75 | 76 |
| PC | 72 | 74 |
| BC | 71 | 69 |
The simulation boxes for the three solvents in contact with the α-PVDF surface are shown in Fig. S.3.† It is clear that the α-phase of PVDF is converted into the β-phase and it is stable in that state in the solvent EC, whereas there are depressions and changes in the structure of the α-phase PVDF surface in PC and BC. In addition, the results presented in Fig. S.3† also confirm that the PVDF polymer chain in contact with EC always adopts the β-phase structure, and that the polymer's β-phase ratio decreases as the solvent alkyl side chain length increases.
3.4 DCMD experiments
Among all prepared PVDF membranes with different cyclic carbonate solvents, the one prepared with EC and a polymer concentration of 20 wt% (PVDF/EC-20) exhibited the highest porosity and PWP. Its DCMD performance was therefore investigated. Table 5 shows the measured LEP values of this PVDF/EC-20 membrane for distilled water and 35 g L−1 NaCl aqueous solution. These data are comparable to those of commercial membranes commonly used in membrane distillation confirming the suitability of the membrane PVDF/EC-20 in this technology. For instance, TF1000 (Gelman) and FALP (Millipore) have LEP values of 48 and 48.3 kPa, respectively.66| δ (μm) | LEPH2O (kPa) | LEP35 g L−1 (NaCl) (kPa) | d p, max (μm) |
|---|---|---|---|
| 165.0 ± 7.1 | 52.5 ± 3.5 | 70.0 ± 7.1 | 1.932 ± 0.26 |
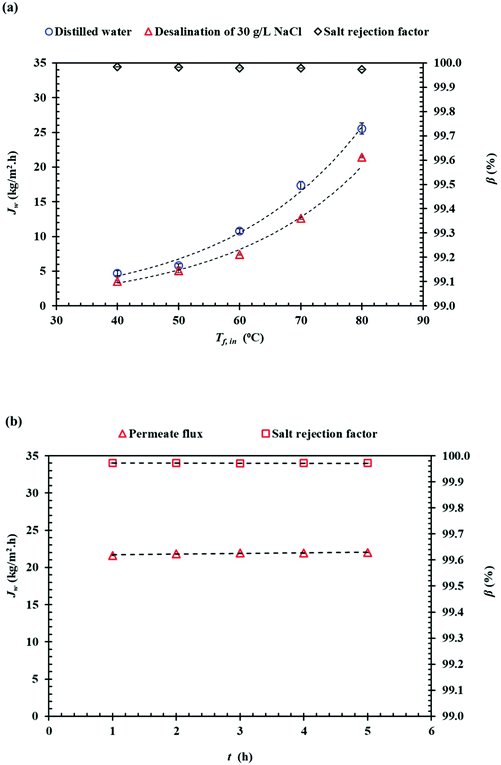
Fig. 11(a) shows the effects of the inlet feed temperature on the DCMD permeate flux (Jw) and the salt rejection factor (β) when using as feed distilled water and NaCl (35 g L−1) aqueous solutions. Exponential (Arrhenius-type) relationships between the DCMD permeate flux and the feed temperature were observed. As a result, the permeate flux increased by 81.56% for distilled water and 83.34% for 30 g L−1 (NaCl) aqueous solution when the feed temperature increased from 50 to 80 °C while maintaining the permeate temperature at 20 °C. It is well known that in membrane distillation process, the operating feed temperature is the predominant parameter affecting the permeate flux due to the exponential increase of the vapor pressure with temperature. This trend has been observed in various studies.67–76 In addition, for the saline solution, the permeate flux was decreased by 25.5% and 16.3% at 40 °C and 80 °C, respectively, compared to the corresponding permeate flux obtained for distilled water. This reduction of the permeate flux upon the adding of NaCl to the aqueous feed solution is attributed to the reduced water vapor pressure of the feed solution and to the concentration polarization effect.68 As can be seen in Fig. 11(b) both the permeate flux and the salt rejection factor were maintained stable with time. In general, the salt rejection factors were above 99.97% and the electrical conductivity (Ωp,f) of the permeate was below 23.8 μS cm−1. Compared to other PVDF membranes prepared with other solvents for membrane distillation summarized in Table 6, the PVDF/EC-20 membrane prepared with the green cyclic carbonate solvent EC exhibit a competitive DCMD desalination performance.
| Polymer | Solvent/non-solvent & additivea | Membrane distillation configurationa | J w (kg m−2 h−1); αb (%) | Operating conditionsa | Ref. |
|---|---|---|---|---|---|
| a PVDF, polyvinylidene fluoride; EC, ethylene csrbonate; DCMD, direct contact membrane distillation; H3PO4, phosphoric acid; SiO2, superhydrophobic nanoparticles silicon dioxide; Tf, feed temperature; Tp, permeate temperature; Tc, coolant inlet temperature; Pv, apply vacuum pressure; TEP, triethyl phosphate; LiCl, lithium chloride; NaCl, sodium chloride; RO, reverse osmosis; rGO, reduced graphene oxide; NMP, N-methyl-2-pyrrolidone; SiO2, hydrophilic nanoparticles; f-SiO2, octadecyltrimethoxysilane (OTMS)-modified silica nanoparticles; CuO, hydrophilic spherical nanoparticules; Dp, degree of polymerization; PG, 1,2-propylene glycol; H-SiO2, hydroxyl-rich silica nanoparticle; GO-ODA, octadecylamine functionalized graphene oxide; GO-APTS, 3-(aminopropyl) triethoxysilane functionalized graphene oxide; MWCNTs; multi-walled carbon nanotubes; CHCl3, chloroform. b Permeate flow data reported from literature with unit conversion if necessary. α, rejection factor. | |||||
| PVDF (Kynar 761) | DMF/Ethanol & GO-ODA | AGMD | 16.7; (α = 98.3%) | 35 g L−1 NaCl as a feed; Tf = 80 °C; Tc = 15 °C | 77 |
| PVDF (534 kDa) | DMF/H2O & GO-APTS | AGMD | 6.2; (α > 99.9%) | 35 g L−1 NaCl as a feed; Tf = 80 °C; Tc = 20 °C | 78 |
| PVDF (Kynar 761) | DMF/H2O &c(Graphene + LiCl) | AGMD | 20.5; (α = 99.9%) | RO brine as a feed; Tf = 60 °C; Tc = 20 °C | 79 |
| PVDF (534 kDa) | DMF/H2O & rGO | AGMD | 7.0; (α > 99.99%) | 35 g L−1 NaCl as a feed; Tf = 80 °C; Tc = 20 °C | 80 |
| PVDF (Kynar 740) | NMP/(isopropanol + H2O) & SiO2 | VMD | 10.0; (α > 99.99%) | 35 g L−1 NaCl as a feed; Tf = 27 °C; Pv = 94.8 kPa | 81 |
| PVDF (Kynar 740) | DMAc/H2O & SiO2 | VMD | 3.0; (α > 99.9%) | 35 g L−1 NaCl as a feed; Tf = 35 °C; Pv = 1.5 kPa | 82 |
| PVDF (Kynar 740) | DMAc/H2O | VMD | 16.06; (α = 7.89) | 10 g L−1 of CHCl3 in H2O Tf = 25 °C; Pv = 1.666 kPa | 83 |
| PVDF (Kynar 740) | DMAc/H2O & CuO | VMD | 1.25 (α > 99.9%) | 35 g L−1 NaCl as a feed; Tf = 27.5 °C; Pv = 1.2 kPa | 84 |
| PVDF (Kynar 740) | DMAc/MWCNTs | VMD | 5.64; (α > 99.98%) | 35 g L−1 NaCl as a feed; Tf = 50 °C; Pv = 2.306 kPa | 85 |
| PVDF (275 kDa) | NMP/graphene & H2O | DCMD | 59.5; (α > 99.8%) | ∼30 g L−1 NaCl as a feed; Tf = 72.5 °C; Tp = 22.5 °C | 86 |
| PVDF (HSV900) | DMAc/H2O | DCMD | 11.0; (α = 99.99%) | 35 g L−1 NaCl as a feed; Tf = 70 °C; Tp = 25 °C | 87 |
| PVDF (FR-904) | DMF/(acetone & H3PO4) | DCMD | 12.5; (α > 99%) | 35 g L−1 NaCl as a feed; Tf = 50 °C; Tp = 20 °C | 53 |
| PVDF (275 kDa) | TEP/(2-propanol & H2O) | DCMD | 40.0; (salt passage ∼0 mmol m−2 h−2) | 58 g L−1 NaCl as a feed; Tf = 60 °C; Tp = 20 °C | 88 |
| PVDF (Kynar 760) | DMAc/n-propanol & H2O | DCMD | 9.3; (α = 99.98%) | 58 g L−1 NaCl as a feed; Tf = 50 °C; Tp = 20 °C | 89 |
| PVDF (FR-904) | DMAc/acetone & H3PO4 | DCMD | 47.6; (α > 99.9%) | 35 g L−1 NaCl as a feed; Tf = 53 °C; Tp = 20 °C | 90 |
| PVDF (Dp, 1000) | DMAc/H2O & LiCl | DCMD | 9.71; (α > 98%) | 10–20 g L−1 NaCl as a feed; Tf = 80 °C; Tp = 20 °C | 91 |
| PVDF (Solef® 6010) | DMAc/PG & H-SiO2 | DCMD | 27.4; (α > 99.98%) | 35 g L−1 NaCl as a feed; Tf = 70 °C; Tp = 15 °C | 92 |
| PVDF (400 kDa) | DMAc/H2O & LiCl | VMD | 22.4; (α = 99.9%) | 35 g L−1 NaCl as a feed; Tf = 73 °C; Pv = 31 kPa | 93 |
| PVDF (Solef® 1015) | EC/H2O | DCMD | 25.6 | Distilled water as feed; Tf = 80 °C; Tp = 20 °C | This work |
| 21.9; (α > 99.9%) | 35 g L−1 NaCl as a feed; Tf = 80 °C; Tp = 20 °C | ||||
4. Conclusions
PVDF membranes with differing morphologies and properties were prepared using inexpensive, green, biodegradable cyclic carbonate solvents (EC, PC, and BC). The effect of the polymer concentration in the dope solution was investigated observing the formation of spherulitic structures. The spherulite size decreased as the polymer concentration and alkyl chain length of the solvent was increased (EC < PC < BC). The porosity and pure water permeability of the prepared membranes decreased as the spherulite size was decreased. When using the solvent EC or PC, PVDF crystals were formed solely in the β phase, independently of the PVDF concentration. However, with the solvent BC, these were formed as mixtures of α and β phase crystals. Molecular dynamics simulation yielded results consistent with the experimental data. The PVDF membrane prepared with the solvent EC and 20 wt% PVDF (PVDF/EC-20) exhibiting the highest pure water permeability and porosity was further tested in DCMD experiments. Stable and competitive DCMD desalination performance (a permeate flux up to 25.6 kg m−2 h−1 with a salt rejection factor below 23.8 μS cm−1) was obtained for this membrane. The achieved results in this study indicate that cyclic organic carbonates are attractive green solvents for PVDF membrane fabrication for different applications (membrane distillation, microfiltration, etc.).Nomenclature
| A | Effective filtration area of membrane (m2) |
| C f,final | Final (NaCl) concentration in the feed solution (g L−1) |
| C f,initial | Initial (NaCl) concentration in the permeate solution (g L−1) |
| C p,final | Final (NaCl) concentration in the permeate solution (g L−1) |
| C p,initial | Initial (NaCl) concentration in the permeate solution (g L−1) |
| d(Nij(r) | Average number of times the j atoms are comprised in a spherical shell of the thickness dr at a distance r from atoms i |
| d p, max | Maximum pore diameter (μm) |
| g ij (r) | Probability density of finding atoms j at a distance r from atom i |
| J w | Water flux (kg m−2 h−1) |
| Q | Volume of water permeated through the membrane (kg) |
| m d | Weights of the dry membranes (g) |
| m w | Weights of the wet membranes (g) |
| P | Liquid entry pressure (kPa) |
| T C | Crystallization temperature (°C) |
| T f, in | Feed inlet temperature (°C) |
| T m 0 | Melting temperature (°C) |
| T p, in | Permeate inlet temperature (°C) |
| t | Time corresponding to a certain volume of collected water (h) |
| β | Salt rejection factor (%) |
| δ | Solubility parameter (MPa0.5) |
| δ D | Dispersion Force (MPa0.5) |
| δ P | Polar Force (MPa0.5) |
| δ H | Hydrogen bond force (MPa0.5) |
| ρ p | Density of polymer (g cm−3) |
| ρ k | Density of kerosene (g cm−3) |
| ΔT | Temperature difference (°C) |
| θ | Water contact angle (°) |
| Ω p,f | Final electrical conductivity (μS cm−1) |
| γ | Coefficient of surface tension of the liquid (N m−1) |
Conflicts of interest
There are no conflicts to declare.Acknowledgements
We appreciate the financial support from the Kempe Foundation and Bio4energy program, the Spanish Ministry of Economy and Competitiveness through its project CTM2015-65348-C2-2-R and the Spanish Ministry of Science, Innovation and Universities through its project RTI2018-096042-B-C22.References
- B. Ameduri, Chem. Rev., 2009, 109, 6632–6686 CrossRef CAS.
- M. T. Darestani, H. G. L. Coster and T. C. Chilcott, J. Membr. Sci., 2013, 435, 226–232 CrossRef CAS.
- J. Zhang, P. Cao, Z. Cui, Q. Wang, F. Fan, M. Qiu, X. Wang, Z. Wang and Y. Wang, AIP Adv., 2019, 9, 115219 CrossRef.
- P. Cao, J. Shi, J. Zhang, X. Wang, J. T. Jung, Z. Wang, Z. Cui and Y. M. Lee, J. Membr. Sci., 2020, 603, 118037 CrossRef CAS.
- D. Chen and C. Pomalaza-Ráez, Sep. Purif. Technol., 2019, 215, 612–618 CrossRef CAS.
- M. Li, H. J. Wondergem, M.-J. Spijkman, K. Asadi, I. Katsouras, P. W. M. Blom and D. M. de Leeuw, Nat. Mater., 2013, 12, 433–438 CrossRef CAS.
- Z. Cui, N. T. Hassankiadeh, Y. Zhuang, E. Drioli and Y. M. Lee, Prog. Polym. Sci., 2015, 51, 94–126 CrossRef CAS.
- S. Barrau, A. Ferri, A. Da Costa, J. Defebvin, S. Leroy, R. Desfeux and J.-M. Lefebvre, ACS Appl. Mater. Interfaces, 2018, 10, 13092–13099 CrossRef CAS.
- W. Xie, T. Li, A. Tiraferri, E. Drioli, A. Figoli, J. C. Crittenden and B. Liu, ACS Sustainable Chem. Eng., 2021, 9, 50–75 CrossRef CAS.
- W. H. Organization, IARC Monographs on the Evaluation of Carcinogenic Risks to Humans, Lyon, France, 2012 Search PubMed.
- Z. Cui, N. T. Hassankiadeh, S. Y. Lee, J. M. Lee, K. T. Woo, A. Sanguineti, V. Arcella, Y. M. Lee and E. Drioli, J. Membr. Sci., 2013, 444, 223–236 CrossRef CAS.
- M. C. Rhodes, J. R. Bucher, J. C. Peckham, G. E. Kissling, M. R. Hejtmancik and R. S. Chhabra, Food Chem. Toxicol., 2007, 45, 843–851 CrossRef CAS.
- U. Heudorf, V. Mersch-Sundermann and J. Angerer, Int. J. Hyg. Environ. Health, 2007, 210, 623–634 CrossRef CAS.
- M. Becker, S. Edwards and R. I. Massey, Environ. Sci. Technol., 2010, 44, 7986–7991 CrossRef CAS.
- M. Razali, J. F. Kim, M. Attfield, P. M. Budd, E. Drioli, Y. M. Lee and G. Szekely, Green Chem., 2015, 17, 5196–5205 RSC.
- S. Rajabzadeh, M. Teramoto, M. H. Al-Marzouqi, E. Kamio, Y. Ohmukai, T. Maruyama and H. Matsuyama, J. Membr. Sci., 2010, 346, 86–97 CrossRef CAS.
- N. Ghasem, M. Al-Marzouqi and N. Abdul Rahim, Sep. Purif. Technol., 2012, 99, 91–103 CrossRef CAS.
- Z. Cui, Y. Cheng, K. Xu, J. Yue, Y. Zhou, X. Li, Q. Wang, S.-P. Sun, Y. Wang, X. Wang and Z. Wang, Polymer, 2018, 141, 46–53 CrossRef CAS.
- Z. Cui, N. T. Hassankiadeh, S. Y. Lee, K. T. Woo, J. M. Lee, A. Sanguineti, V. Arcella, Y. M. Lee and E. Drioli, J. Membr. Sci., 2015, 473, 128–136 CrossRef CAS.
- M. Liu, Z.-l. Xu, D.-g. Chen and Y.-m. Wei, Desalin. Water Treat., 2010, 17, 183–192 CrossRef CAS.
- N. T. Hassankiadeh, Z. Cui, J. H. Kim, D. W. Shin, S. Y. Lee, A. Sanguineti, V. Arcella, Y. M. Lee and E. Drioli, J. Membr. Sci., 2015, 479, 204–212 CrossRef CAS.
- W. Xie, A. Tiraferri, B. Liu, P. Tang, F. Wang, S. Chen, A. Figoli and L.-Y. Chu, ACS Sustainable Chem. Eng., 2020, 8, 91–101 CrossRef CAS.
- T. Marino, F. Galiano, A. Molino and A. Figoli, J. Membr. Sci., 2019, 580, 224–234 CrossRef CAS.
- F. Russo, F. Galiano, F. Pedace, F. Aricò and A. Figoli, ACS Sustainable Chem. Eng., 2020, 8, 659–668 CrossRef CAS.
- D. Y. Xing, W. Y. Dong and T.-S. Chung, Ind. Eng. Chem. Res., 2016, 55, 7505–7513 CrossRef CAS.
- Q. Wu, A. Tiraferri, H. Wu, W. Xie and B. Liu, ACS Omega, 2019, 4, 19799–19807 CrossRef CAS.
- P. Yadav, N. Ismail, M. Essalhi, M. Tysklind, D. Athanassiadis and N. Tavajohi, J. Membr. Sci., 2021, 622, 118987 CrossRef CAS.
- J. Ranke, S. Stolte, R. Störmann, J. Arning and B. Jastorff, Chem. Rev., 2007, 107, 2183–2206 CrossRef CAS.
- J. R. Harjani, J. Farrell, M. T. Garcia, R. D. Singer and P. J. Scammells, Green Chem., 2009, 11, 821–829 RSC.
- T. Sakakura and K. Kohno, Chem. Commun., 2009, 1312–1330, 10.1039/B819997C.
- B. Schäffner, F. Schäffner, S. P. Verevkin and A. Börner, Chem. Rev., 2010, 110, 4554–4581 CrossRef.
- Y. Su, C. Chen, Y. Li and J. Li, J. Macromol. Sci., Part A: Pure Appl.Chem., 2007, 44, 99–104 CrossRef CAS.
- H.-C. Yang, Q.-Y. Wu, H.-Q. Liang, L.-S. Wan and Z.-K. Xu, J. Polym. Sci., Part B: Polym. Phys., 2013, 51, 1438–1447 CrossRef CAS.
- Z. Cui, S. Xu, J. Ding, J. Zhang, B. He, H. Wang and J. Li, Polymers, 2018, 10, 719 CrossRef.
- C. Fang, S. Rajabzadeh, W. Liu, H.-C. Wu, N. Kato, Y. Sun, S. Jeon and H. Matsuyama, J. Membr. Sci., 2020, 596, 117715 CrossRef CAS.
- M. A. Rasool, P. P. Pescarmona and I. F. J. Vankelecom, ACS Sustainable Chem. Eng., 2019, 7, 13774–13785 CrossRef CAS.
- C. M. Hansen, Hansen Solubility Parameters: A User's Handbook, Second Edition, CRC Press, 2007 Search PubMed.
- Y. Chernyak, J. Chem. Eng. Data, 2006, 51, 416–418 CrossRef CAS.
- ASTM F316-03, Standard Test Methods for Pore Size Characteristics of Membrane Filters by Bubble Point and Mean Flow Pore Test, ASTM International, West Conshohocken, PA, 2003, DOI:10.1520/F0316-03.
- H. Sun, J. Phys. Chem. B, 1998, 102, 7338–7364 CrossRef CAS.
- E. Tocci, C. Rizzuto, F. Macedonio and E. Drioli, Ind. Eng. Chem. Res., 2020, 59, 5267–5275 CrossRef CAS.
- M. Rahmati, M. Jangali and H. Rezaei, J. Mol. Liq., 2019, 296, 111781 CrossRef CAS.
- N. Ghahramani and M. Rahmati, Int. J. Heat Mass Transfer, 2020, 154, 119487 CrossRef CAS.
- H. Iesavand, M. Rahmati, D. Afzali and S. Modiri, Mater. Sci. Eng., C, 2019, 105, 110010 CrossRef CAS.
- H. J. C. Berendsen, J. P. M. Postma, W. F. v. Gunsteren, A. DiNola and J. R. Haak, J. Chem. Phys., 1984, 81, 3684–3690 CrossRef CAS.
- S. Nosé, J. Chem. Phys., 1984, 81, 511–519 CrossRef.
- L. Verlet, Phys. Rev., 1967, 159, 98–103 CrossRef CAS.
- T. Marino, N. Russo, E. Tocci and M. Toscano, Theor. Chem. Acc., 2001, 107, 8–14 Search PubMed.
- P. Sukitpaneenit and T.-S. Chung, J. Membr. Sci., 2009, 340, 192–205 CrossRef CAS.
- J. T. Jung, J. F. Kim, H. H. Wang, E. Di Nicolo, E. Drioli and Y. M. Lee, J. Membr. Sci., 2016, 514, 250–263 CrossRef CAS.
- A. Bottino, G. Capannelli, S. Munari and A. Turturro, J. Polym. Sci., Part B: Polym. Phys., 1988, 26, 785–794 CrossRef CAS.
- Y. K. Ong, N. Widjojo and T.-S. Chung, J. Membr. Sci., 2011, 378, 149–162 CrossRef CAS.
- D. Hou, H. Fan, Q. Jiang, J. Wang and X. Zhang, Sep. Purif. Technol., 2014, 135, 211–222 CrossRef CAS.
- F. Shi, J. Ma, P. Wang and Y. Ma, J. Taiwan Inst. Chem. Eng., 2012, 43, 980–988 CrossRef CAS.
- L. Li, C.-M. Chan, K. L. Yeung, J.-X. Li, K.-M. Ng and Y. Lei, Macromolecules, 2001, 34, 316–325 CrossRef CAS.
- G.-L. Ji, C.-H. Du, B.-K. Zhu and Y.-Y. Xu, J. Appl. Polym. Sci., 2007, 105, 1496–1502 CrossRef CAS.
- A. Salimi and A. A. Yousefi, Polym. Test., 2003, 22, 699–704 CrossRef CAS.
- X. Cai, T. Lei, D. Sun and L. Lin, RSC Adv., 2017, 7, 15382–15389 RSC.
- V. V. Kochervinskii, Russ. Chem. Rev., 1996, 65, 865–913 CrossRef.
- D. Yang, S. Tornga, B. Orler and C. Welch, J. Membr. Sci., 2012, 409–410, 302–317 CrossRef CAS.
- X. He and K. Yao, Appl. Phys. Lett., 2006, 89, 112909 CrossRef.
- J. R. Gregorio and M. Cestari, J. Polym. Sci., Part B: Polym. Phys., 1994, 32, 859–870 CrossRef.
- C.-g. Duan, W. N. Mei, W.-G. Yin, J. Liu, J. R. Hardy, S. Ducharme and P. A. Dowben, Phys. Rev. B: Condens. Matter Mater. Phys., 2004, 69, 235106 CrossRef.
- T. Nishiyama, T. Sumihara, E. Sato and H. Horibe, Polym. J., 2017, 49, 319–325 CrossRef CAS.
- B. K. Saha, A. Saha, D. Sharada and S. A. Rather, Cryst. Growth Des., 2018, 18, 1–6 CrossRef CAS.
- M. Khayet and T. Matsuura, Membrane distillation: principles and applications, Elsevier, 2011 Search PubMed.
- J. Mengual, M. Khayet and M. Godino, Int. J. Heat Mass Transfer, 2004, 47, 865–875 CrossRef CAS.
- M. Khayet, Adv. Colloid Interface Sci., 2011, 164, 56–88 CrossRef CAS.
- F. A. Banat and J. Simandl, Desalination, 1994, 95, 39–52 CrossRef CAS.
- A. Alkhudhiri, N. Darwish and N. Hilal, Desalination, 2012, 287, 2–18 CrossRef CAS.
- M. Essalhi and M. Khayet, J. Membr. Sci., 2013, 433, 180–191 CrossRef CAS.
- M. Khayet, M. P. Godino and J. I. Mengual, Sep. Sci. Technol., 2005, 39, 125–147 CrossRef.
- M. Khayet and J. I. Mengual, Desalination, 2004, 168, 373–381 CrossRef CAS.
- M. Wang, G. Liu, H. Yu, S.-H. Lee, L. Wang, J. Zheng, T. Wang, Y. Yun and J. K. Lee, ACS Appl. Mater. Interfaces, 2018, 10, 13452–13461 CrossRef CAS.
- F. Guo, A. Servi, A. Liu, K. K. Gleason and G. C. Rutledge, ACS Appl. Mater. Interfaces, 2015, 7, 8225–8232 CrossRef CAS.
- X. Li, W. Qing, Y. Wu, S. Shao, L. E. Peng, Y. Yang, P. Wang, F. Liu and C. Y. Tang, ACS Appl. Mater. Interfaces, 2019, 11, 47963–47971 CrossRef CAS.
- J. Zahirifar, J. Karimi-Sabet, S. M. A. Moosavian, A. Hadi and P. Khadiv-Parsi, Desalination, 2018, 428, 227–239 CrossRef CAS.
- S. Leaper, A. Abdel-Karim, B. Faki, J. M. Luque-Alled, M. Alberto, A. Vijayaraghavan, S. M. Holmes, G. Szekely, M. I. Badawy, N. Shokri and P. Gorgojo, J. Membr. Sci., 2018, 554, 309–323 CrossRef CAS.
- Y. C. Woo, Y. Kim, W.-G. Shim, L. D. Tijing, M. Yao, L. D. Nghiem, J.-S. Choi, S.-H. Kim and H. K. Shon, J. Membr. Sci., 2016, 513, 74–84 CrossRef CAS.
- A. Abdel-Karim, J. M. Luque-Alled, S. Leaper, M. Alberto, X. Fan, A. Vijayaraghavan, T. A. Gad-Allah, A. S. El-Kalliny, G. Szekely, S. I. A. Ahmed, S. M. Holmes and P. Gorgojo, Desalination, 2019, 452, 196–207 CrossRef CAS.
- M. H. Emamirad and S. Javadpour, J. Environ. Health Sci. Eng., 2020, 18, 495–504 CrossRef.
- J. E. Efome, M. Baghbanzadeh, D. Rana, T. Matsuura and C. Q. Lan, Desalination, 2015, 373, 47–57 CrossRef CAS.
- M. Khayet and T. Matsuura, Ind. Eng. Chem. Res., 2001, 40, 5710–5718 CrossRef CAS.
- M. Baghbanzadeh, D. Rana, T. Matsuura and C. Q. Lan, Desalination, 2015, 369, 75–84 CrossRef CAS.
- R. Zhou, D. Rana, T. Matsuura and C. Q. Lan, Sep. Purif. Technol., 2019, 217, 154–163 CrossRef CAS.
- C. Athanasekou, A. Sapalidis, I. Katris, E. Savopoulou, K. Beltsios, T. Tsoufis, A. Kaltzoglou, P. Falaras, G. Bounos and M. Antoniou, Polym. Eng. Sci., 2019, 59, E262–E278 CrossRef CAS.
- F. Abdulla AlMarzooqi, M. Roil Bilad and H. Ali Arafat, Appl. Sci., 2017, 7, 181 CrossRef.
- S. Nejati, C. Boo, C. O. Osuji and M. Elimelech, J. Membr. Sci., 2015, 492, 355–363 CrossRef CAS.
- C.-Y. Kuo, H.-N. Lin, H.-A. Tsai, D.-M. Wang and J.-Y. Lai, Desalination, 2008, 233, 40–47 CrossRef CAS.
- D. Hou, G. Dai, J. Wang, H. Fan, Z. Luan and C. Fu, Desalination, 2013, 326, 115–124 CrossRef CAS.
- M. Tomaszewska, Desalination, 1996, 104, 1–11 CrossRef CAS.
- C. Wu, W. Tang, J. Zhang, S. Liu, Z. Wang, X. Wang and X. Lu, J. Membr. Sci., 2017, 543, 288–300 CrossRef CAS.
- H. Fan, Y. Peng, Z. Li, P. Chen, Q. Jiang and S. Wang, J. Polym. Res., 2013, 20, 134 CrossRef.
Footnote |
| † Electronic supplementary information (ESI) available. See DOI: 10.1039/d1gc00122a |
| This journal is © The Royal Society of Chemistry 2021 |


