 Open Access Article
Creative Commons Attribution 3.0 Unported Licence
Curing time: a temporally explicit life cycle CO2 accounting of mineralization, bioenergy, and CCS in the concrete sector†
Samantha Eleanor
Tanzer
 *,
Kornelis
Blok
and
Andrea
Ramírez
Department of Engineering Systems and Services, Delft University of Technology, Jaffalaan 5, 2628 BX Delft, The Netherlands. E-mail: s.e.tanzer@tudelft.nl
First published on 10th February 2021
Abstract
The decarbonization of concrete production requires a multi-pronged approach including the abatement of CO2 emissions from cement production as well as storage of CO2 within concrete itself. This study explores the decarbonization potential of combining bioenergy and carbon capture and storage (CCS) during cement production with the accelerated carbonation of fresh concrete and the natural carbonation of demolished concrete for the life cycle net CO2 of 30 MPa ordinary Portland concrete. As both biomass and concrete reuptake CO2 over time, the timing of CO2 emissions and removals is explicitly accounted for. At current technology levels, the combination of bioenergy and CCS in cement production combined with the carbonation of demolished concrete was seen in our model to allow for net CO2-negative concrete. However, the concrete is CO2-positive until the CO2 of production is reabsorbed by biomass regrowth and the carbonation of demolished concrete at end-of-life. In our model, accelerated carbonation was, by itself, an inefficient CO2 storage mechanism, due to the penalty of energy use and injection losses. However, if it led to a gain in concrete strength, accelerated carbonation could result in lower CO2via reduced resource demand and cement production.
Introduction
Concrete is the most abundant manmade material. Worldwide, 30 billion tonnes are produced annually.1 The production of 4.1 billion tonnes of cement,2 the binding agent in concrete, was itself responsible for 2.4 Gt of carbon dioxide emissions in 2019, representing 26% of all industrial CO2 emissions.3 To abate the worst impacts of the climate crisis, decarbonization of concrete is critical.The cement and concrete industries anticipate that full decarbonization will require a multi-pronged approach, encompassing increases in energy efficiency, the use of wastes and biomass as fuel, and recycling; carbon capture and storage; as well as the decarbonization of transport and electricity.4,5
Cement production is the most carbon-intensive element of the concrete supply chain, requiring 3–4 GJ of thermal energy per tonne of cement, energy which today is provided mostly by fossil fuels.6 Yet, about 60% of CO2 emitted during cement production is from the calcination of limestone (CaCO3) into calcium oxide (CaO). Once in concrete, however, CaO reabsorbs CO2 from the atmosphere, recarbonating into limestone. Estimates suggest that CO2 reuptake by in-stock concrete offsets 20% of CO2 emissions from current annual cement production.7 Over a 50 to 100 year service life, concrete may reabsorb 10–30% of the CO2 released during calcination of its constituent cement.8,9 At the end of its service life, demolition greatly increases the exposed surface area of concrete, providing an opportunity for rapid recarbonization,10 but less than 1% of demolished concrete is estimated to be recycled in an exposed environment.7
Another pathway to concrete carbonation is to inject CO2 into fresh concrete. This “accelerated carbonation” was studied in the 1970s11,12 as a method to increase the early strength and setting speed of concrete. Recently, several accelerated carbonation products have come to market claiming a reduced carbon footprint.13–15 However, variation in product type and concrete recipe makes it difficult to quantify the decarbonization potential of accelerated carbonation by itself.
Furthermore, the concrete life cycle includes the sourcing of sand, aggregate, chemical additives, water and energy; demolition at end-of-life; and transport of bulk materials. All of these must be accounted for when assessing the CO2 footprint of concrete.
This study explores the combination of decarbonization technologies to understand their impact on the lifecycle CO2 balance of ordinary Portland concrete. We focus on accelerated carbonation, bioenergy use in cement kilns, and the capture and storage of CO2 from cement kilns. As both concrete and biomass uptake CO2 over time, we chart the balance of CO2 emissions and removals over time. Additionally, the impact of strength gain from accelerated carbonation, sourcing of accelerated carbonation CO2, carbonation of demolished concrete, biomass rotation period, and the decarbonization of electricity and transport are considered.
Methods
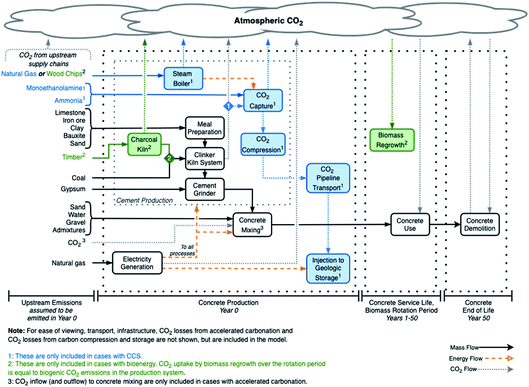
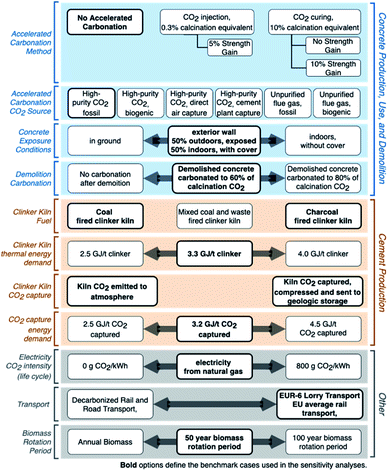
This study is a temporally explicit life cycle CO2 accounting of concrete production, with and without the use of accelerated carbonation, bioenergy, and/or carbon capture and storage, based on the system in Fig. 1. The unit of analysis (functional unit) is the production of one cubic meter of 30 MPa ordinary Portland concrete, formed into an 20 cm-deep exterior wall segment with a 50 year service life. Production and use were assumed to occur in northwest Europe, which is reflected in the choices of technological efficiencies and supply chain data, but the system is otherwise geographically generic.The cases considered in this study are summarized in Fig. 2. For all cases, the net life cycle CO2 was estimated, as was the cumulative balance of CO2 emissions and removals over time. CO2 emissions from concrete production and upstream supply chains of production inputs were assumed to be emitted in “year 0”. Afterwards, CO2 is removed from the atmosphere by the natural carbonation of concrete and by replanted biomass. CO2 emissions and removals associated with demolition occur in the year after the end of the concrete’s service life.
The process modelling and CO2 balances were facilitated by a custom Python3 model. For CO2 emissions in upstream supply chains, life cycle inventory data from ecoinvent 3.6 (ref. 16) were used. Tabular data for the model input parameters are available in the ESI.†
Technology scenarios
Four scenarios of production technology and background systems were considered in this study, whose main parameters are summarized in Table 1:| Parameter | Unit | Current, average | Current, benchmark | Future, conservative | Future, optimistic |
|---|---|---|---|---|---|
| a Assumption. b Assumed to be 50% short-rotation biomass (e.g. agricultural wastes), and 50% long-rotation biomass (e.g. sawdust). c Electricity efficiency beyond current state-of-the-art was neglected due to its negligible impact in scenarios with decarbonized electricity. d Upstream CO2 was approximated by subtracting the direct CO2 intensity of electricity generation18 from the total life cycle CO2 in the ecoinvent 3.6 (ref. 16) process for European average electricity generation. Decarbonization of upstream emissions was assumed to occur at the same rate as for direct CO2 emissions of electricity generation. | |||||
| Clinker kiln, thermal energy demand | MJ per kg clinker | 3.7 (ref. 4) | 3.3 (ref. 19) | 3.0a | 2.8 (ref. 21) |
| Waste fraction of clinker kiln fuel | % kiln fuel (LHV) | 46% (ref. 4) | 0% | 60% (ref. 23) | 90% (ref. 4) |
| Biomass fraction of wasteb | % waste | 16% (ref. 4) | n.a. | 40% (ref. 23) | 50% (ref. 4) |
| Meal grinding electricity demandc | kW h per t meal | 23 (ref. 17) | 12 (ref. 20) | 12 (ref. 20) | 12 (ref. 20) |
| Clinker kiln electricity demandc | kW h per t clinker | 26 (ref. 17) | 23 (ref. 20) | 23 (ref. 20) | 23 (ref. 20) |
| Cement mixing electricity demandc | kW h per t cement | 40 (ref. 17) | 16 (ref. 20) | 16 (ref. 20) | 16 (ref. 20) |
| Total carbonation, after demolition | % of calcination CO2 | n.a. | 60%a | 60%a | 75%a |
| CO2 capture, thermal energy demand | MJ per kg CO2 | 3.2 (ref. 24) | 3.2 (ref. 24) | 3.0a | 2.5a |
| CO2 capture, electricity demandc | MJ per kg CO2 | 38 | 15 | 15 | 15 |
| Direct CO2 intensity of electricity | g CO2 per kW per h | 269 (ref. 18) | 360 | 54a | 0 |
| Upstream CO2 of electricityd | g CO2 per kW per h | 90 (ref. 16) | 48 | 18 | 0 |
| CO2 intensity of road transport (life cycle basis) | g CO2 per t per km | 84 (ref. 16) | 84 | 34 | 0 |
| CO2 intensity of rail transport (life cycle basis) | g CO2 per t per km | 51 (ref. 16) | 51 | 20 | 0 |
Current, average, using cement production efficiencies and kiln fuel composition from the European Cement Association, CEMBUREAU4 and average cement production electricity use,17 and EU-average grid electricity.18 At end-of-life, the concrete was assumed to be demolished and immediately re-used in a subsurface application, without further carbonation. This scenario is designed to represent current production conditions.
Current, benchmark, assuming “state-of-the-art” cement production.19,20 To provide a clearer picture of parameter influence in the sensitivity analysis, simplified energy provision was assumed, with the clinker kiln using only one type of fuel (coal in fossil cases, charcoal in biomass cases), and with electricity provided by a natural gas combined cycle power plant with an efficiency of 56.6%. It is also assumed that at end-of-life, concrete rubble is exposed until 60% of the calcination CO2 has been recarbonated, as this is an immediately implementable decarbonization option.
Future, conservative, with improvements in kiln and CO2 capture efficiencies, increased use of waste, and partial decarbonization of transport and electricity. Additional electricity efficiency improvements, beyond current state-of-the-art were not considered, due to their negligible impact.
Future, optimistic, with a “practical minimum” clinker kiln efficiency,21 increased use of wastes,4 and fully decarbonized electricity and transport sectors, as envisioned to be available no later than 2050 in the EU.22
Concrete production
This study considered the production of ordinary Portland concrete (OPC), with a 28 day compressive strength of 30 MPa. 25–35 MPa concrete represents 60% of the 255 million m3 of ready-mixed concrete produced by members of European Ready Mixed Concrete Organization in 2018.25 This study used the concrete recipe in Table 2, taken from the ecoinvent 3.6 process for 30–32 MPa ready-mix concrete.16 The use of cement replacers, such as fly ash or slag, is outside the scope of this study.| Ingredient | kg per m3 concrete |
|---|---|
| CEM I Portland cement | 344 |
| Sand | 859 |
| Gravel | 960 |
| Water | 207 |
| Admixtures | 1.2 |
In the benchmark case, inputs to concrete production were assumed to be transported 200 km by heavy lorry to the construction site, where concrete mixing occurs with water available on-site. To minimize variation between cases, accelerated carbonation was assumed to happen on the site of concrete production and use.
Accelerated carbonation
Two cases of accelerated carbonation were considered:0.3% calcination CO2 injection into the concrete mixer, based on commercially available technology.26 A small quantity of CO2 is injected, equalling approximately 0.3% of the calcination CO2 emitted during the production of the concrete’s constituent cement. This has been shown to increase the strength of the concrete, allowing for approximately a 5% reduction in cement.26 Therefore, in these cases, each m3 of concrete has 17 kg less cement, with an additional 14 kg of sand to maintain volume.
CO2 curing to 10% of embodied calcination CO2 where the concrete is exposed to a high-CO2 atmosphere in a pressurized environment. The literature of CO2 curing of cement and concrete varies widely in product recipe, curing environment, observed CO2 uptake, and change in concrete properties. In particular, both strength gain and strength loss have been reported. A comparison of several CO2 curing studies is included in the ESI.† In our model we assumed that two hours of CO2 curing in a constant pressure environment of 150 kPa resulted in a CO2 uptake of 10% of calcination CO2, with no change in strength.
In the benchmark cases, the CO2 used for accelerated carbonation was assumed to have been captured from industrial flue gas, purified to 95%, and transported via lorry to the concrete production site. CO2 uptake efficiency was initially assumed to be 60%,27 with unabsorbed CO2 emitted to the atmosphere. As accelerated carbonation was assumed to occur at a construction site, dedicated pipeline transport of the CO2 was assumed to be unrealistic.
The study also considered cases where CO2 curing led to a 10% strength gain, with a corresponding reduction of cement use. In combination, we also explored the impact of four other sources of the CO2 used in accelerated carbonation:
• 95%-purity CO2 from the system’s own cement plant, when outfitted with CCS.
• 95%-purity biogenic CO2 from the production of bioethanol, assumed to only require compression and transport.
• 95%-purity atmospheric CO2 from an on-site direct air capture (DAC) unit.28 This includes an electricity demand of 366 kW h per t CO2 and a thermal energy demand of 5.9 GJ per t CO2, supplied by natural gas. In the DAC CO2 capture process, approximately 95% of CO2 from natural gas use is also captured.28
• raw flue gas (10–20% CO2), both fossil and biogenic, that has only been cleaned of SO2 and NOx.
Natural carbonation
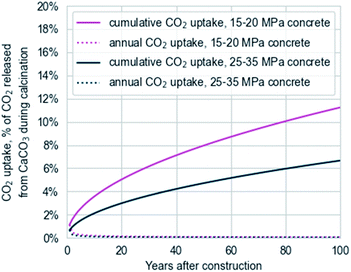
Concrete absorbs CO2 as the CaO in the cement recarbonates, first at the surface then gradually penetrating into the concrete mass with decreasing uptake over time as in Fig. 3. The carbonation rate depends on the composition of the concrete, exposed surface area, and exposure environment. It is typically modelled using Fick’s diffusion law, and calculated with the equation9where CO2 uptake, in kg, is the total CO2 carbonated over period t. ki in mm per year0.5, is the carbonation rate factor, based on the concrete strength and exposure conditions.9 DOCi, in percent, is the maximum degree of carbonation specific to the exposure conditions.9Ai, in m2 is the surface area of the exposed concrete. t, in years, is the length of exposure. Utcc, in kg CO2 per kg cement is the maximum theoretical uptake of CO2, equal to the CO2 released during calcination. For the CEM I Portland cement, the value is 0.49. C, in kg cement per m3 concrete, is the cement content of the concrete.
Concrete use was assumed to be as an exterior wall, with a depth of 20 cm, with an external surface exposed to rain, and a painted interior surface. In cases with accelerated carbonation, natural carbonation was assumed to begin from the level of carbonation already present in the concrete. e.g. If 5% of calcination CO2 was carbonated by accelerated carbonation in 18 MPa concrete exposed to rain, carbonation during concrete service life was assumed to continue as if 20 years of natural carbonation had already occurred (as if starting at the year 20 point in Fig. 3).
End of life
At its end of its 50 year service life, the concrete was assumed to be demolished with a life cycle CO2 footprint of 9 kg per t demolished concrete.16 As concrete rubble has a large surface area, natural carbonation up to 60–80% calcination CO2 can be achieved by leaving rubble exposed to air for several weeks.29While the EU reports a 90% average recovery rate for construction waste,30 the predominant fate of recovered concrete is road underlayers or backfilling,7 where it is not exposed. Therefore, no additional carbonation of demolished concrete was assumed in the “Current, Average” scenario. Deliberate carbonation of demolished concrete was included in the benchmark scenario and both future scenarios.
Cement production
Cement production was modelled for CEM I Portland cement.31–33 Losses from kiln dust or conveyance between processes, were neglected. Production inputs were assumed to travel 200 km by rail to the cement plant. The energy demand for cement production is provided in Table 1.Carbon capture and storage
In cases with carbon capture and storage (CCS), flue gas from the cement kiln was sent to a post-combustion CO2 capture unit using a monoethanolamine (MEA)-based absorption process. Flue gas cleaning using ammonia and limestone to remove SO2 and NOx was assumed,31 as this is current practice. While there are more advanced solvent-based capture systems, and demonstrations of calcium-looping-capture and direct separation technologies for cement production are underway,34,35 MEA-based capture is a mature and commercially available technology, so was chosen for the benchmark scenario, which focuses on currently available technologies.In the benchmark scenario, the CO2 capture process was assumed to require 3.2 GJ per t CO2 of low-temperature steam,24 provided by a dedicated boiler with a 90% efficiency. The boiler was assumed to use natural gas or, in cases with bioenergy use, wood chips. CO2 from the boiler was emitted to the atmosphere. No heat integration with the cement plant was assumed in the benchmark case, as available heat can vary widely and may be in use for other purposes.
After capture, the CO2 was assumed to be compressed to 110 bar, requiring 96 kW h per t CO2,32 transported 200 km by pipeline, and injected into geologic storage, with an injection electricity demand of 8 kW h per t CO2.36 It was assumed that 1% of CO2 was lost during transport and injection.
Bioenergy use and biomass regrowth
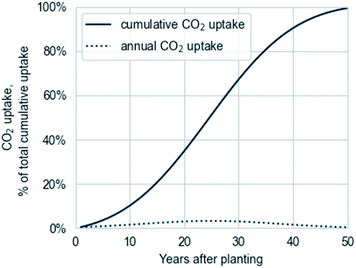
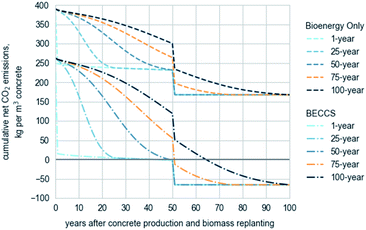
In cases with bioenergy use, charcoal replaces coal in the cement kiln and wood chips replace natural gas in the steam boiler for CO2 capture. Charcoal was selected to ensure that the kiln would be able to reach sufficiently high temperatures, and for usability in existing kilns accustomed to coal-firing. Charcoal was assumed to be produced in industrial Missouri-style kilns, with 69% carbon recovery and ancillary CO2 emissions of 543 kg per t charcoal.37Timber for charcoal production was assumed to have a rotation period of 50 years, as was the long rotation fraction of biogenic wastes. CO2 reuptake by biomass over time was modelled using a Gaussian distribution, as visualized in Fig. 4, following equation38
| CO2 uptake in year τ = (2πσ2)0.5e(τ−μ)2/2σ2 |
Upstream CO2
Upstream CO2 emissions were included for the inflows in Fig. 1, as well as for transport of materials to the cement plant and the concrete production site, transport of CO2 to geologic storage, and infrastructure use for all processes. For this background system, life cycle inventory CO2 data from ecoinvent 3.6 (ref. 16) was used, including the emissions of biogenic, fossil, and direct land use change CO2. Indirect land use change was not considered. The specific ecoinvent processes and CO2 factors are provided in the ESI,† as are energy content and emissions factors of fuels used in this model.39,40Results and discussion
Full tabular results are available in the ESI.† Net CO2 has been rounded to the nearest 10 kg CO2 per t per m3 concrete.Technology scenarios overview
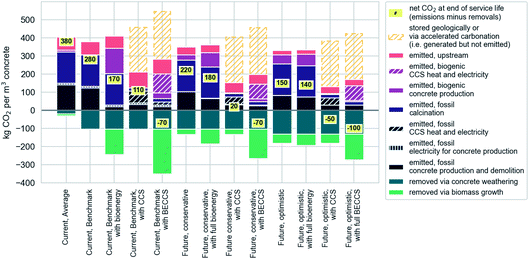
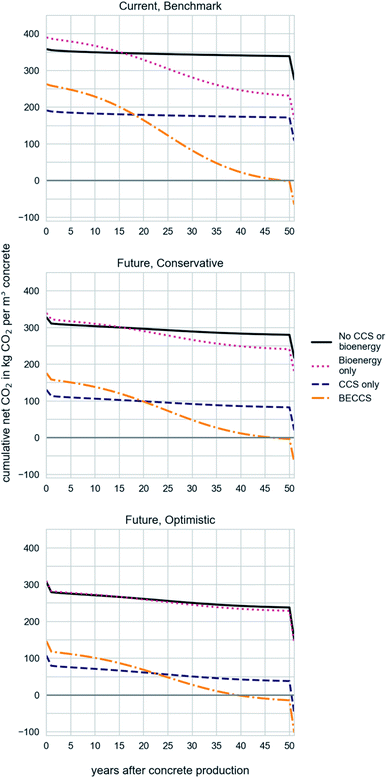
Fig. 5 summarizes the net life cycle CO2 for each concrete type and production scenario, before considering accelerated carbonation. The net CO2 of the “current, average” scenario is 380 kg CO2 per m3 concrete. Excluding end-of-life carbonation, the benchmark scenario, without bioenergy or CCS, has a 15 kg m−3 lower net CO2 due to increased production efficiencies. Carbonation of demolished concrete accounts for a further reduction of 85 kg CO2 per t per m3. For embodied cement production, the net CO2 of the benchmark scenario is 880 kg CO2 per t cement versus 920 kg per t for the “current, average” production scenario. All BECCS cases, as well as the “optimistic” future cases with CCS only (which have a 45% biogenic kiln fuel mix), resulted in CO2-negative concrete, with atmospheric CO2 removals during biomass regrowth and concrete recarbonation exceeding CO2 emitted during the concrete’s life cycle. However, as Fig. 6 illustrates, the net CO2 refers to the CO2 balance at concrete’s end-of-life; 50 years after most CO2 emissions occur. In all cases, the concrete system is CO2-positive for at least 40 years. Additionally, all cases with bioenergy use have higher net CO2 than their fossil counterparts for 15–25 years after concrete production until sufficient atmospheric CO2 is reabsorbed by sustainably replanted biomass. This is seen in Fig. 6 where the lines of the bioenergy cases cross those of their fossil counterparts. The future scenarios’ bioenergy cases have flatter curves, attributable to high proportion of both annual biogenic wastes and fossil-based wastes as fuels for cement production. Finally, significant carbonation of demolished concrete is required to reach CO2 negativity in all but the “future, optimistic” BECCS cases.The benchmark cases are discussed below, followed by an assessment of accelerated carbonation options, then sensitivity analyses on natural carbonation, biomass CO2 uptake, and production efficiencies.
Benchmark cases
The benchmark case was estimated to emit 380 kg CO2 per m3 concrete during production and upstream processes, of which 280 kg are direct emissions from cement production (175 kg from calcination, 105 kg from fuel use). A further 70 kg m−3 were emitted upstream, of which 60% were from transport of bulk materials. In our model, 20 kg CO2 per m3, or 11% of calcination CO2, were removed by natural carbonation over the 50 year service life of the concrete. Finally, carbonation of the demolished concrete removed an additional 85 kg CO2 per m3 from the atmosphere, while the demolition process was responsible for 20 kg m−3 of CO2 emissions.Without accelerated carbonation or CCS, the use of bioenergy in cement production decreased net CO2 by 110 kg m−3 concrete. CO2 emissions of production increased by 30 kg CO2 per m3, but 140 kg m−3 of CO2 were reabsorbed by biomass regrowth. In contrast, the use of CCS in cement production alone reduced both CO2 emitted and net CO2 by 165 kg CO2 per m3, corresponding to 250 kg CO2 sent to geologic storage minus 85 kg CO2 per m3 emitted as a consequence of CCS, of which 65 kg were direct emissions from energy provision for the capture unit.
The combination of bioenergy and CCS in cement production generates 70 kg more CO2 per m3 concrete than CCS alone, stores 15 kg more CO2, and approximately 350 kg of CO2 per m3 are removed by biomass. The net effect is that concrete produced with BECCS cement was modelled to be net CO2-negative, at approximately −70 kg m−3, but only at end-of-life, after CO2 reuptake by biomass and the carbonation of concrete both during service life and after demolition.
Accelerated carbonation
Table 3 summarizes the modelling results for accelerated carbonation, in relation to the benchmark case without bioenergy or CCS use. The injection of 0.3% CO2 during concrete mixing was the only case that resulted in a decrease of net CO2, (of 9 kg CO2 per m3), though less than 1 kg CO2 per m3 concrete was stored in the concrete. The 5% reduction in cement demand due to the increase in concrete strength reduced CO2 emissions by 15 kg CO2 per m3, partially offset by decreased natural carbonation from the lower cement content of the concrete. Additionally, as the CO2 intensity of cement production decreases, so does the apparent decarbonization benefit of reduced cement use. In the BECCS case, the net CO2 of 0.3% CO2 injection is actually 8 kg CO2 per m3 higher than without, as decreased use of CO2-negative cement increases the net CO2 of the concrete. However, the benefits of decreased resource use are pertinent, even if they are outside the scope of this study. If scaled to the 2018 EU production of 250 million m3 ready-mix concrete,25 0.3% CO2 injection would store only 0.1 Mt of CO2, but a 5% reduction cement demand would reduce cement sector emissions by 3.5 Mt CO2 per year.| Parameter | No accelerated carbonation | 0.3% CO2 injection, 5% strength gain | 10% CO2 curing, no strength gain | 10% CO2 curing, 10% strength gain |
|---|---|---|---|---|
| kg CO2 per m3 | kg CO2 per m3, as change from benchmark case | |||
| Net CO2 | 280 | −9 | +42 | +19 |
| CO2 stored in concrete | 0 | +<1 | +17 | +15 |
| CO2 emitted, CO2 acquisition | 0 | +<1 | +11 | +10 |
| CO2 emitted, carbonation losses | 0 | <1 | +11 | +10 |
| CO2 emitted, cement production and upstream | 295 | −15 | 0 | −29 |
| CO2 removed by natural carbonation, service life | 20 | −1 | −10 | −11 |
| CO2 removed by natural carbonation, demolition | 85 | −4 | −6 | −14 |
| Total electricity use (kW h per m3 concrete) | 24 kW h | −1 kW h | +10 kW h | +7 kW h |
As modelled, OPC cured with the equivalent of 10% of calcination CO2, without strength gain, increased net CO2 by approximately 40 kg CO2 per m3 relative to the benchmark case without accelerated carbonation, bioenergy, or CCS. This increase was due to additional emissions from capture, transport, and injection of CO2; CO2 lost during the injection process; and reduced natural carbonation. However, this process also stored 17 kg of fossil CO2 into the concrete. If these avoided emissions are included in the net CO2 of the concrete system, net CO2 only increased by 23 kg CO2 per m3. Even if CO2 injection was assumed to be 100% efficient, with no losses of CO2, the net CO2 would still be higher than without accelerated carbonation.
However, “avoided emissions” reflect a reduction in CO2 emitted from preventing the release of CO2 and are not a physical removal of CO2 from the atmosphere, though both reduce the amount of CO2 that would have been in the atmosphere than if the “avoided” CO2 would have been emitted. Thus, for accelerated carbonation, claiming avoided emissions requires that the CO2 stored in the concrete would have otherwise been emitted, and not sent to geologic storage or otherwise abated. If the CO2 would have been otherwise abated, there are no avoided emissions. Finally, it is important that avoided emissions are not double counted. In other words, they should only be accounted once—either in the system of CO2 generation or in the system of CO2 storage (here, accelerated carbonation), but not both.
Fig. 7 shows the impact of CO2 origin and concrete strength gain for 10% CO2 curing. The 0.3% CO2 injection case is not included, as the CO2 quantity is too small. Assuming there is no gain in concrete strength, only CO2 curing using a raw flue gas from a biogenic source had a net CO2 on par with the benchmark case, if avoided emissions can be counted. A 10% gain in strength was sufficient to offset the emissions associated with accelerated carbonation, and achieve a small net CO2 reduction (5–20 kg m−3) relative to the benchmark case when accelerated carbonation used raw flue gas, pure biogenic CO2, or CO2 from direct air capture (if the CO2 from DAC fuel use is also captured). However, in the cases where raw flue gas is used for curing, a 10% strength gain may be unrealistic, as the lower CO2 concentration in the curing environment is likely to result in lower CO2 uptake.41 Lastly, using CO2 from a CCS-equipped cement plant only increased CO2 emissions, compared to the more efficient option of sending the CO2 to geologic storage, as, in our model, the net impact of increased energy use and decreased natural carbonation from accelerated carbonation exceeds the CO2 emissions of sending the CO2 to geologic storage.
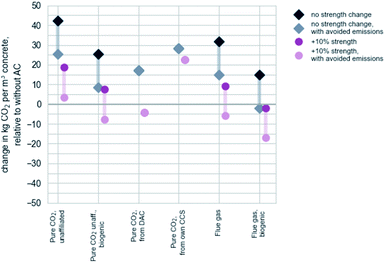 | ||
| Fig. 7 Impact of CO2 source on life cycle net CO2 of concrete subject to CO2 curing to equivalent of 10% of embodied calcination CO2, considered with and without strength gain and avoided emissions. | ||
Natural carbonation
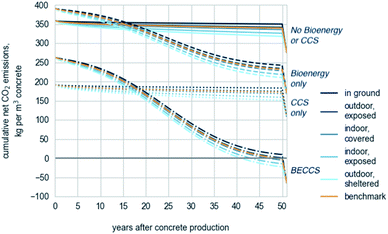
As shown in Fig. 8, in the most favourable conditions for concrete carbonation—outdoors, uncovered, and sheltered from rain—OPC was estimated to absorb 23% of calcination CO2 over 50 years, double that of the benchmark case. Indeed, an equivalent amount of carbonation occurs in 12 years in these conditions as in 50 years in the benchmark case. In contrast, OPC in ground, such as in road sub-layer applications, or otherwise unexposed, was estimated to absorb less than 5% of calcination CO2 over 50 years.
Though end-of-life carbonation is a long-term decarbonization option for new concrete production, 368 Mt of mineral construction and demolition waste, mostly concrete, was generated in the EU in 2018.30 Assuming that, as in our benchmark case, 85 kg CO2 per m3 concrete is absorbed by end-of-life carbonation, current demolition wastes could remove on the order of 30 Mt of CO2 per year from the atmosphere, or over 25% of direct CO2 emissions from EU cement production.6
Biomass use
Fig. 9 shows the impact of biomass rotation period on the net CO2 of concrete over time. In all cases, the net life cycle CO2 of the bioenergy cases does not decrease below that of the corresponding fossil energy case until approximately halfway through the biomass rotation period. Until then, the amount of CO2 in the atmosphere from the production of the concrete is higher than without bioenergy.This model assumed the use of charcoal for clinker kiln fuel in the bioenergy cases to provide a clear picture of the use of long-rotation biomass. However, from a resource perspective, this is overly simplistic. If all 180 Mt per year of EU-28 cement production (2018)6 was charcoal-fired, it would require over 40 Mt per year of timber, nearly a quarter of current annual European forestry production.42,43 If all cement production also installed CCS, a further 20 Mt per year of wood chips would be needed to supply energy for the CO2 capture reboiler. Instead, energy demand for CCS and part of the energy demand for the kiln could be provided by low-grade fuels, such as agricultural residues or dedicated annual energy crops, which would also decrease the average rotation period of the biomass.
Efficiencies of production and background supply chains
Tabular results are available in the ESI.†If CO2 capture is applied to the steam boiler providing heat for the solvent reboiler, a net reduction of 85% of boiler CO2 could be achieved, 40 kg CO2 per m3 concrete in the CCS-only case and 90 kg CO2 per m3 in the BECCS case. However, the BECCS case would still take over half the biomass rotation period to reach carbon neutrality.
The use of waste heat, if available, could instead reduce CO2 emissions by 50 kg or 105 kg CO2 per m3 concrete for the CCS-only and BECCS cases, respectively. However, in the BECCS case, this reduction in CO2 emissions is offset by the reduced removal of atmospheric CO2 by biomass, and therefore the reduced emissions and resource use is not reflected in net CO2.
Considerations beyond the scope of this study
This paper considered concrete produced with ordinary Portland cement, and the decarbonization potential of low-CaO cements were outside the scope of this study. However, as of 2017, the average clinker ratio of European cement was 77%, with the remainder replaced with other cementious materials such as fly ash and granulated blast furnace slag,25 and decreasing the proportion of clinker is one of the major avenues of decarbonation proposed by CEMBUREAU, the European cement industry group.4 The use of ash and slag as clinker replacers lowers CO2 emissions within the system boundaries of concrete production and may increase the rate of natural carbonation.9 However, while fly ash and blast furnace slag can reduce the demand for fresh clinker, they are products of the combustion of fossil fuels and calcination of limestone, and therefore, the fate of the CO2 from their system of origin should be taken into account when assessing their decarbonization potential. Furthermore, the availability of fly ash is expected to decrease as coal is phased out of the power mix.Secondly, this study did not consider other contributors to global warming potential, such as methane and dinitrogen oxide emissions or indirect land use, which could be significant for bioenergy-based systems. We also did not consider other global warming impacts from concrete use, though, like avoided emissions, this is specific to the reference system considered, i.e., whether concrete replaces surfaces with lower albedo, (e.g., asphalt) or replaces surfaces that provide evaporative cooling (e.g., grass).
Finally, this was a study on the marginal production of 1 m3 of concrete, and therefore cannot embody the decarbonization potential of reducing the total production of concrete by improved construction design, increased reuse, or extended concrete service life. In particular, this study assumed a concrete use life of 50 years, based on the expected lifespan of modern reinforced concrete structures. This short lifespan for concrete is a modern phenomenon, resulting from the use of iron-based reinforcing bars (rebar). These allow for the construction of very large and strong structures, but corrode and expand as oxygen invades the concrete, causing irreversible structural damage.45 However, the use life of concrete could be re-extended to multiple hundreds of years if it is unreinforced, or reinforced with non-corroding rebar, such as aluminium bronze.45 This would greatly decrease the future impacts of the concrete industry, as the concrete stock becomes more durable, reducing overall resource use.
Conclusions
This paper explored the production of ordinary Portland concrete considering different combinations of natural and accelerated carbonation, bioenergy use, and carbon capture and storage. The sensitivity analysis explored the impact of strength gain from accelerated carbonation, the origin of CO2 used for carbonation; conditions of concrete use and demolition on natural carbonation; biomass rotation period; and efficiencies of electricity, transport, and cement production.In our model, the aggressive use of BECCS in cement production and the deliberate natural recarbonation of demolished concrete together resulted in net-CO2-negative concrete at current technology levels, when considered on a life cycle basis.
However, net CO2 is the balance of CO2 emissions and removals for the entire concrete life cycle, measured at the end of the concrete’s service life and after all biomass used for bioenergy has been regrown. Depending on the biomass rotation period and the rate of concrete carbonation, CO2-negative concrete may still have a net-positive CO2 balance for the entirety of its service life and only reach CO2 negativity when the demolished concrete is allowed to recarbonate.
Modelled with currently available technology, post-combustion amine-based CCS for cement production reduced life cycle CO2 of concrete by 40%, and was the single most effective decarbonization intervention, but alone is insufficient to result in negative emissions. Combined with the use of fully biogenic fuel in the cement kiln, biogenic fuel or waste heat for CO2 capture, and allowing for carbonation of demolished concrete, BECCS was estimated to result in a life cycle net CO2 of −70 kg CO2 per m3 concrete. However, 280 kg CO2 per m3 were still emitted during production and in upstream supply chains, more than with CCS alone. It is not until almost halfway through the biomass rotation period that the net CO2 of BECCS is lower than in the CCS-only case, assuming that the biomass is indeed sustainably regrown. Using short rotation biomass for cement kiln fuel and encouraging carbonation of current concrete waste can be used to more rapidly decarbonate the concrete sector.
In this study, accelerated carbonation of ordinary Portland concrete did not appear to be an efficient method for CO2 storage on its own. The CO2 penalty from increased energy use and decreased natural carbonation exceeded the CO2 stored, though this was highly sensitive to both concrete strength gain and the origin of the CO2 used for accelerated carbonation. The potential benefit of accelerated carbonation seems to lie not in its ability to directly store CO2 in the concrete, but rather if it can increase concrete strength and reduce the overall use of cement.
The natural carbonation of concrete is a slow process, and though estimates of total carbonation by global concrete stocks are impressive, the annual CO2 uptake of in-use concrete is minor relative to the embodied CO2 of its production. However, increasing carbonation during demolition and recovery by leaving the concrete waste exposed to air for a period of weeks is a promising decarbonization option that could be implemented in the near term.
Decarbonization of concrete production is a complex matter, and CO2 emissions, while important, do not embody the full impacts of the system of concrete production and use. The net CO2 must be taken in the context of the full specific systems for concrete production. Trade-offs between near-term versus long-term decarbonization and between decreased CO2versus increased energy use must be considered. Even if CO2-neutral, or CO2-negative, concrete is achievable, it is very likely to be at the expense of increased resource use. Therefore, the primary decarbonization priority should always be the reduced use of all concretes via all production methods.
Author contributions
S. E. Tanzer: conceptualization, methodology, software, data curation, writing – original draft, writing – review & editing, visualization. K. Blok: writing – review & editing, supervision. A. Ramírez: conceptualization, writing – review & editing, supervision.Conflicts of interest
There are no conflicts to declare.References
- P. J. Monteiro, S. A. Miller and A. Horvath, Towards sustainable concrete, Nat. Mater., 2017, 16(7), 698–699, DOI:10.1038/nmat4930.
- IEA, Cement: Tracking Report – June 2020, 2020, available from: https://www.iea.org/reports/cement Search PubMed.
- IEA, Energy Technology Perspectives 2020, 2020 Search PubMed.
- CEMBUREAU, Cementing the European Green Deal, 2019 Search PubMed.
- MPA UK Concrete, UK Concrete and Cement Industry Roadmap to Beyond Net Zero UK, 2020 Search PubMed.
- World Business Council for Sustainable Development, Getting The Numbers Right Project Emissions Report 2018, 2018, available from: https://gccassociation.org/gnr/ Search PubMed.
- Z. Cao, R. J. Myers, R. C. Lupton, H. Duan, R. Sacchi and N. Zhou, et al., The sponge effect and carbon emission mitigation potentials of the global cement cycle, Nat. Commun., 2020, 11(1), 3777, DOI:10.1038/s41467-020-17583-w.
- H. Stripple, C. Ljungkrantz, T. Gustafsson and R. Andersson, CO2 uptake in cement-containing products: Background and calculation models for IPCC implementation, October 2018 Search PubMed.
- European Committee for Standardization, European Standard EN-16757: Sustainability of construction works - Environmental product declarations - Product Category Rules for concrete and concrete elements, 2017 Search PubMed.
- C. Pade and M. Guimaraes, The CO2 uptake of concrete in a 100 year perspective, Cem. Concr. Res., 2007, 37(9), 1348–1356 Search PubMed.
- W. Klemm and R. Berger, Accelerated Curing of Cementious Systems by Carbon Dioxide: Part I. Portland Cement, Cem. Concr. Res., 1972, 2, 567–576 Search PubMed.
- J. F. Young, R. L. Berger and J. Breese, Accelerated Curing of Compacted Calcium Silicate Mortars on Exposure to CO2, J. Am. Ceram. Soc., 1974, 57(9), 394–397 Search PubMed.
- CarbonCure Technologies Inc, CarbonCure, 2020 [cited 2020 Dec 15], available from: https://www.carboncure.com Search PubMed.
- Blue-Planet Ltd, Blue Planet, 2019 [cited 2020 Dec 15], available from: https://www.blueplanet-ltd.com Search PubMed.
- CO2 Concrete, CO2Concrete, LLC, 2018 [cited 2020 Dec 15], available from: https://www.co2concrete.com Search PubMed.
- G. Wernet, C. Bauer, B. Steubing, J. Reinhard, E. Moreno-Ruiz and B. Weidema, The ecoinvent database version 3 (part I): overview and methodology, Int. J. Life Cycle Assess., 2016, 21(9), 1218–1230, DOI:10.1007/s11367-016-1087-8.
- E. Worrell, L. Price, N. Martin, C. Hendriks and L. O. Meida, Carbon Dioxide Emission from the Global Cement Industry, Annu. Rev. Energy Environ., 2001, 303–329 Search PubMed.
- European Environment Agency, CO2 Intensity of Electricity Generation, 2020, available from: https://www.eea.europa.eu/data-and-maps/data/co2-intensity-of-electricity-generation Search PubMed.
- European Commission, Best Available Techniques (BAT) Reference Document for the Production of Cement, Lime and Magnesium Oxide, 2013, pp. 1–501 Search PubMed.
- E. Worrell, L. Price, M. Neelis, C. Galitsky and Z. Nan, World Best Practice Energy Intensity Values for Selected Industrial Sectors, Lawrence Berkeley National Laboratory, 2007, p. 51 Search PubMed.
- U.S. Department of Energy, Bandwidth Study on Energy Use and Potential Energy Saving Opportunities in U.S. Cement Manufacturing, 2017, September Search PubMed.
- European Commission, A Clean Planet for all - A European long-term strategic vision for a prosperous, modern, competitive and climate neutral economy, 2018, available from: https://eur-lex.europa.eu/legal-content/EN/TXT/?uri=CELEX:52018DC0773 Search PubMed.
- CEMBUREAU, The role of cement in the 2050 low-carbon economy, 2013, vol. 64, available from: https://lowcarboneconomy.cembureau.eu/wp-content/uploads/2018/09/cembureau-full-report.pdf Search PubMed.
- J. Jakobsen, S. Roussanaly and R. Anantharaman, A techno-economic case study of CO2 capture, transport and storage chain from a cement plant in Norway, J. Cleaner Prod., 2017, 144, 523–539, DOI:10.1016/j.jclepro.2016.12.120.
- ERMCO, Ready-mixed concrete industry statistics. Year 2018, August 2019, available from: http://ermco.eu/new/wp-content/uploads/2020/08/ERMCO-Statistics-30.08.2019-R4-1.pdf Search PubMed.
- S. Monkman, M. Macdonald and D. Hooton, Using CO2 to reduce the carbon footprint of concrete, 1st International Conference on Grand Challenges in Construction Materials, 2016, pp. 1–8, available from: http://igcmat.com/papers/Monkman_igcmat_2016.pdf Search PubMed.
- S. Monkman, M. MacDonald, R. D. Hooton and P. Sandberg, Properties and durability of concrete produced using CO2 as an accelerating admixture, Cem. Concr. Compos., 2016, 74, 218–224, DOI:10.1016/j.cemconcomp.2016.10.007.
- D. Keith, G. Holmes, D. S. Angelo and K. Heidel, A Process for Capturing CO2 from the Atmosphere, Joule, 2018, 2, 1573–1594, DOI:10.1016/j.joule.2018.05.006.
- C. J. Engelsen, J. Mehus, C. Pade and D. H. Sæther, Carbon dioxide uptake in demolished and crushed concrete, Nordic Innovation Centre, 2005 Search PubMed.
- European Commission, Eurostat, 2020 [cited 2020 Dec 5], available from: https://ec.europa.eu/eurostat/web/main/home Search PubMed.
- IEAGHG, Carbon Dioxide Capture in the Cement Industry, July 2008, pp. 1–180, available from: http://documents.ieaghg.org/index.php/s/YKm6B7zikUpPgGA?path=%2F2008%2FTechnical%20Reports Search PubMed.
- W. Schakel, C. R. Hung, L.-A. Tokheim, A. H. Strømman, E. Worrell and A. Ramírez, Impact of fuel selection on the environmental performance of post-combustion calcium looping applied to a cement plant, Appl. Energy, 2018, 210, 75–87, DOI:10.1016/j.apenergy.2017.10.123.
- M. Voldsund, S. O. Gardarsdottir, E. De Lena, J. F. Pérez-Calvo, A. Jamali and D. Berstad, et al., Comparison of technologies for CO2 capture from cement production—Part 1: Technical evaluation, Energies, 2019, 12(3), 559, DOI:10.3390/en12030559.
- Project Leilac, Low Emissions Intensity Lime & Cement: A project of the European Union Horizon 2020 Research & Innovation, 2020 [cited 2020 Dec 15], available from: https://www.project-leilac.eu Search PubMed.
- Laboratorio Energia e Ambiente Piacenza. Cleanker – CLEAN clinKER production by calcium looping process, 2020, available from: http://www.cleanker.eu Search PubMed.
- H. H. Khoo and R. B. H. Tan, Life Cycle Investigation of CO2 Recovery and Sequestration, Environ. Sci. Technol., 2006, 40(12), 4016–4024, DOI:10.1021/es051882a.
- D. M. Pennise, K. R. Smith, J. P. Kithinji, M. E. Rezende, T. J. Raad and J. Zhang, et al., Emissions of greenhouse gases and other airborne pollutants from charcoal making in Kenya and Brazil, J. Geophys. Res.: Atmos., 2001, 106(D20), 24143–24155 Search PubMed.
- B. Holtsmark, The outcome is in the assumptions: analyzing the effects on atmospheric CO2 levels of increased use of bioenergy from forest biomass, GCB Bioenergy, 2013, 5(4), 467–473 Search PubMed.
- IPCC, Emission Factor Database, 2019 [cited 2019 Nov 28], available from: https://www.ipcc-nggip.iges.or.jp/EFDB/main.php Search PubMed.
- ECN.TNO, Phyllis2, database for (treated) biomass, algae, feedstocks for biogas production and biochar, available from: https://phyllis.nl/?nr=ECN-M--07-024 Search PubMed.
- S. Monkman and Y. Shao, Integration of carbon sequestration into curing process of precast concrete, Can. J. Civ. Eng., 2010, 37(2), 302–310 Search PubMed.
- Eurostat, Wood products - production and trade, 2019 [cited 2019 Nov 29], available from: https://ec.europa.eu/eurostat/statistics-explained/index.php/Wood_products_-_production_and_trade Search PubMed.
- M. Fonseca and Task Force Members, Forest Product Conversion Factors for the Unece Region, Vol. ECE/TIM/DP, 2010, p. 38, available from: https://unece.org/DAM/timber/publications/DP-49.pdf Search PubMed.
- N. Mac Dowell and M. Fajardy, Inefficient power generation as an optimal route to negative emissions via BECCS?, Environ. Res. Lett., 2017, 12(4), 045004, DOI:10.1088/1748-9326/aa67a5.
- R. Courland, Concrete Planet: The Strange and Fascinating Story of the World’s Most Common Man-Made Material, Prometheus Books, New York, 2011 Search PubMed.
Footnote |
| † Electronic supplementary information (ESI) available: The full modelling parameters and results in tabular format. Additionally, the production of concrete masonry units was also modelled, whose results follow the same trends seen for OPC. However, due to space limitations, that analysis was excluded here. Methods and results specific to CMUs are included in the ESI. See DOI: 10.1039/d0fd00139b |
| This journal is © The Royal Society of Chemistry 2021 |

