 Open Access Article
 This Open Access Article is licensed under a
 Creative Commons Attribution 3.0 Unported Licence
XUV pump–XUV probe transient absorption spectroscopy at FELs
Thomas
Ding
*a,
Marc
Rebholz
a,
Lennart
Aufleger
a,
Maximilian
Hartmann
 a,
Veit
Stooß
a,
Alexander
Magunia
a,
Paul
Birk
a,
Gergana Dimitrova
Borisova
a,
Carina
da Costa Castanheira
a,
Patrick
Rupprecht
a,
Yonghao
Mi
a,
Thomas
Gaumnitz
b,
Zhi-Heng
Loh
c,
Sebastian
Roling
d,
Marco
Butz
e,
Helmut
Zacharias
e,
Stefan
Düsterer
f,
Rolf
Treusch
f,
Christian
Ott
a and
Thomas
Pfeifer
a
a,
Veit
Stooß
a,
Alexander
Magunia
a,
Paul
Birk
a,
Gergana Dimitrova
Borisova
a,
Carina
da Costa Castanheira
a,
Patrick
Rupprecht
a,
Yonghao
Mi
a,
Thomas
Gaumnitz
b,
Zhi-Heng
Loh
c,
Sebastian
Roling
d,
Marco
Butz
e,
Helmut
Zacharias
e,
Stefan
Düsterer
f,
Rolf
Treusch
f,
Christian
Ott
a and
Thomas
Pfeifer
a
aMax-Planck-Institut für Kernphysik, Saupfercheckweg 1, 69117 Heidelberg, Germany. E-mail: christian.ott@mpi-hd.mpg.de; thomas.pfeifer@mpi-hd.mpg.de
bLaboratorium für Physikalische Chemie, ETH Zürich, Vladimir-Prelog-Weg 2, 8093 Zürich, Switzerland
cDivision of Chemistry and Biological Chemistry, Division of Physics and Applied Physics, School of Physical and Mathematical Sciences, Nanyang Technological University, Singapore 637371, Singapore
dPhysikalisches Institut der Westfälischen Wilhelms-Universität Münster, Wilhelm-Klemm-Straße 10, 48149 Münster, Germany
eCenter for Soft Nanoscience, Busso-Peuss-Straße 10, 48149 Münster, Germany
fDeutsches Elektronen-Synchrotron DESY, Notkestraße 85, 22607 Hamburg, Germany
First published on 7th November 2020
Abstract
The emergence of ultra-intense extreme-ultraviolet (XUV) and X-ray free-electron lasers (FELs) has opened the door for the experimental realization of non-linear XUV and X-ray spectroscopy techniques. Here we demonstrate an experimental setup for an all-XUV transient absorption spectroscopy method for gas-phase targets at the FEL. The setup combines a high spectral resolving power of E/ΔE ≈ 1500 with sub-femtosecond interferometric resolution, and covers a broad XUV photon-energy range between approximately 20 and 110 eV. We demonstrate the feasibility of this setup firstly on a neon target. Here, we intensity- and time-resolve key aspects of non-linear XUV-FEL light–matter interactions, namely the non-resonant ionization dynamics and resonant coupling dynamics of bound states, including XUV-induced Stark shifts of energy levels. Secondly, we show that this setup is capable of tracking the XUV-initiated dissociation dynamics of small molecular targets (oxygen and diiodomethane) with site-specific resolution, by measuring the XUV transient absorption spectrum. In general, benefitting from a single-shot detection capability, we show that the setup and method provides single-shot phase-locked XUV pulse pairs. This lays the foundation to perform, in the future, experiments as a function of the XUV interferometric time delay and the relative phase, which enables advanced coherent non-linear spectroscopy schemes in the XUV and X-ray spectral range.
1 Introduction
How does a bound quantum system respond to the interaction with intense extreme-ultraviolet (XUV) and X-ray radiation pulses? This is a fundamental question addressed by time-resolved XUV/X-ray transient absorption spectroscopy, which is particularly relevant because it gives direct access to changes in the electronic structure in real time. When an atomic system interacts with intense XUV or X-ray radiation pulses, it can be efficiently ionized, such that the initial neutral state of the atom is being depleted, and highly ionized charge states can be formed.1,2 Furthermore, in the case of resonant transitions, such intense XUV/X-ray pulses are sufficiently strong to Rabi-cycle between atomic transitions such as the system’s ground state and the bound,3 as well as quasi-bound (autoionizing) inner-shell,4 or two-electron5 excited states. Since the latter are at the root of electron correlation effects, their study is relevant to our understanding of non-equilibrium processes and chemical reactions, which here can be accessed without the further complication of nuclear motion.In molecules, the electrons from an inner atomic shell are spatially localized around this atomic site. Thus, using resonant inner-shell transitions or inner-shell ionization as a probe offers the possibility of extracting spectroscopic information about the evolving spatial structure and geometry during molecular transformations.6–9 The probably most effective scheme to follow such dynamics is based on a first “pump” pulse, which initiates the process, while a second time-delayed pulse is used as a “probe”. In fact, this pump–probe approach has been proven useful in many different time-resolved X-ray spectroscopies.10 With time-resolved pump–probe transient absorption spectroscopy, measuring the spectra of the transmitted light pulses through moderately dense targets, it is possible to directly access quantum-state transitions with high combined temporal and spectral resolution.11–17
With the advent of X-ray free-electron lasers new possibilities for non-linear time-resolved inner-shell spectroscopies18–20 have come within reach with a particular focus on multidimensional spectroscopy,21 which provides additional access to the coupling dynamics of the probed resonances. A pioneering experiment has been performed based on XUV transient-grating spectroscopy.22 However, the entire scope of non-linear XUV/X-ray multidimensional spectroscopy is technically highly demanding and still not yet fully realized. One major challenge is to provide XUV/X-ray multi-pulse sequences with sufficient intensity and sub-XUV-wavelength relative interferometric stability.
In this contribution, we present the experimental setup for implementation of an all-XUV time-resolved transient absorption spectroscopy at the SASE (self-amplified spontaneous emission) free-electron laser in Hamburg, FLASH.23 We employ two time-delayed ultrashort XUV-pump and XUV-probe pulses from the FEL at intensities of the order 1014 W cm−2. Under these conditions we reach the non-linear regime of XUV light–matter interactions. After describing in detail the experimental apparatus, we present an overview of first experimental results, from the observation of time-resolved and pulse-energy-resolved ionization dynamics in neon, to the time-resolved observation of XUV-induced resonance-line shifts of the produced Ne2+ ion. Moreover, we extend our technique to small molecules in order to probe the electronic structure along the XUV-triggered transition from an intact molecule to isolated atoms (for a molecular oxygen target), as well as transient structural dynamics during dissociation (for a diiodomethane target).
Owing to the combined high temporal (sub-fs interferometric) and spectral (∼30 meV) resolution, our technique contains the basic ingredients for the further implementation of a multi-dimensional (multi-pulse) spectroscopy scheme with sufficiently intense FEL pulses in the near future. We finally discuss this prospect by presenting XUV–XUV interferometric transient-absorption data in a two-dimensional time-domain spectrogram which demonstrates experimentally that XUV spectro-temporal interference patterns survive despite using SASE FEL pulses.
2 Methods
2.1 Principle of split-beam XUV-pump XUV-probe transient absorption spectroscopy
The measurement principle is based on transient-absorption spectroscopy (TAS) in the gas phase and is conducted in a Fraunhofer-type transmission geometry. That is, the generated time-dependent dipole response of the gaseous target system interferes with the incoming beam and is thus detected in the far field in a self-heterodyned manner. In Fig. 1 we show a schematic illustration of the experimental geometry: before focusing the FEL beam into a target-gas medium, the beam is geometrically split into two approximately equal (halfmoon-shaped in the transverse beam profile) parts—denoted pump and probe pulses—which are temporally delayed with respect to each other using the split-and-delay unit at FLASH.24 While the pump and probe pulses spatially overlap within the focal interaction volume, they are again separated in the far field behind the focus. This quasi-noncollinear geometry allows one to measure both pump and probe spectra simultaneously using a grating spectrometer with a sufficiently large XUV-sensitive CCD sensor. The pulse spectra are measured for each individual shot of the FEL, which was operated in single-bunch mode at 10 Hz repetition rate. The absorbance (optical density, OD) is evaluated via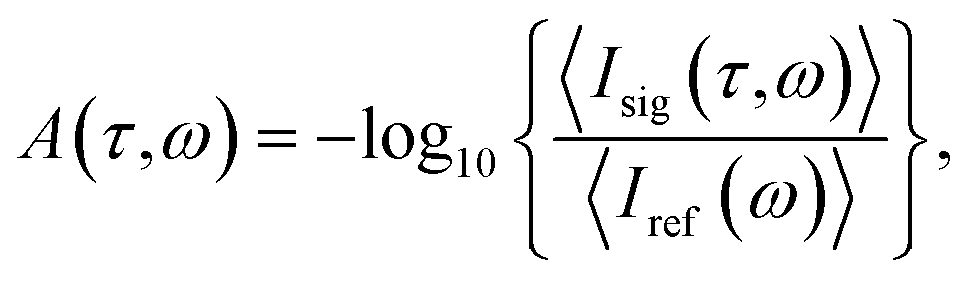 | (1) |
 | ||
| Fig. 1 Measurement principle of split-beam XUV-pump XUV-probe transient-absorption spectroscopy. After focusing the pulses into the absorption gas cell filled with a moderately dense gas medium the transmitted pulses are coupled into a grating spectrometer consisting of a high precision slit, a VLS grating, and an XUV-sensitive camera which simultaneously detects the spatially separated pump and probe pulse spectra on a single-shot basis. | ||
It is important to note that this TAS scheme requires FEL pulses with a sufficiently broad spectral bandwidth in order to cover the spectral region of interest of the sample by the photons of a single FEL pulse. This relatively broad spectral bandwidth, however, puts no limits on the spectroscopic resolution since the latter only depends on the instrumental response of the grating spectrometer, but not on the spectral properties of the light source. This is in contrast to traditional X-ray TAS approaches which are based on scanning the central photon energy of a nearly monochromatic FEL (to achieve sufficient spectral resolution) or synchrotron light source, and measuring the yield of the charged ionic fragments. Relating to the on average 1 eV spectral FEL bandwidth, this puts a lower bound on the coherence time on the order of 2 femtoseconds, according to the Fourier time-bandwidth product. This timescale manifests in the experiment when nearly identical copies of temporal intensity spikes between pump and probe pulses overlap in time and is thus a measure for the average duration of the few-femtosecond SASE structure within individual FEL pulses. This intra-pulse coherence timescale hereby is much faster than the average duration of the FEL pulse envelope, which typically measures on the few 10 to 100 femtosecond timescale.
2.2 Overview of the experimental setup
The experimental apparatus was designed for the operation with XUV/soft X-ray radiation pulses at the SASE FEL in Hamburg, FLASH.23 An overview of the setup is given in Fig. 2. In order to avoid scattering of XUV radiation, the setup is operated under ultra-high vacuum conditions (base pressure below 10−8 mbar). It includes an efficient two-stage differential pumping system between the experimental target vacuum chamber and the vacuum interface with the FEL machine. Differential pressures of almost 5 orders of magnitude are achieved under on-target gas loads of several mbar l s−1, injected into the target chamber through the absorption gas cell which is positioned in the FEL focus. The molecular flow conductance between the pumping sections is limited by tubes of 100 mm length and 5 or 10 mm diameter, matching the beam size of the focused, and thus converging, FEL beam. Each chamber is connected with turbomolecular pumps (nominal pumping speed: 2000 l s−1 at the target chamber, and 300 l s−1 and 80 l s−1, respectively, at the differential pumping chambers). | ||
| Fig. 2 Overview of the experimental vacuum apparatus. The FEL beam (coming from the left) is focused into the first large chamber (target chamber) downstream of a short differential pumping section. The second large chamber (mirror chamber) includes a toroidal mirror for refocusing into the spectrometer, and a two-component plane mirror for beam steering. The spectrometer endstation comprises a two-dimensional (two pairs of blades in the X- and Y-dimensions) motorized entrance slit, a highly-flexible assembly for many different beam attenuators, a variable-line-spacing (VLS) grating, and an XUV-sensitive camera (also see Fig. 3 and 4 for more details). | ||
The absorption gas cell itself is a stainless-steel tube with two 100 μm entrance and exit pinholes for the focused beam with a full-width-at-half-maximum (FWHM) spot size of about 25 μm. In order to ensure that the entire interaction volume is confined within the focal peak-intensity region we chose a 2 mm inner diameter of the gas cell, which is an order of magnitude smaller than the Rayleigh length of the focused FEL beam. For molecular targets with small vapor pressures at room temperature, such as halogenated hydrocarbon molecules, the cell also comprises a heating jacket (see Fig. 4a) in order to raise the vapor pressure at elevated temperatures. The heating further prevents the cell from clogging the beam entrance and exit pinholes. For the presented experiments here, an optimal signal-to-noise ratio was found for moderately high target number densities of 1017 to 1018 cm−3 inside the cell. For the precise positioning of the gas cell into the beam focus, the gas cell is mounted on a motorized closed-loop XYZ positioning platform with sub-μm repeatability. An XUV-induced fluorescence image from an attached phosphor screen, mounted next to the cell in the focal plane, can be monitored using a long-working-distance microscope camera. Moving the phosphor screen into the attenuated FEL beam, this allows us to monitor the spatial overlap and provides focusing diagnostics under high-vacuum conditions.
The optical layout of the experiment incorporates the split-and-delay unit (SDU)24 and the ellipsoidal focusing mirror (f = 2 m) installed at the user port beamline 2 (BL2),26 as well as the VLS-grating of the online reference spectrometer25 at FLASH. Having passed those optics, the focused XUV-pump and XUV-probe pulses enter the experimental apparatus, side-by-side, split along the vertical dimension, i.e. separated horizontally (see Fig. 3a for a fluorescence image of the two beam halves and Fig. 3b for a schematic illustration of the optical layout). However, for the spectroscopy of both pump and probe pulses, separately, on the same grating (vertical grooves) the beam has to be converted into an up-down orientation behind the target. This was accomplished by an additional spatial beam splitting along the horizontal dimension using a home-built two-component mirror (see Fig. 4b). This mirror assembly consists of two 15-degree grazing incidence plane mirrors with a 30 nm Au-coating (roughness <0.2 nm rms) and a surface size of 50 × 30 mm2. To keep the loss of photons through the <200 μm gap between the mirrors as low as possible, the usual protection bevels are avoided. Each substrate is attached on a piezo-driven multi-axis tip-and-tilt actuator unit. This device builds on a piezo-driven tripod platform for tilting movements around a pivot point in two dimensions (angles ΘX, ΘY) with a 0.1 μrad closed-loop resolution. Now, the beam is divided into 4 partial beams, in total (see inset “front view” in Fig. 3b). By rotating the two mirror segments in opposite directions, the transmitted pump and probe signals can thus be steered onto the spectrometer slit, separately, with a vertical offset.
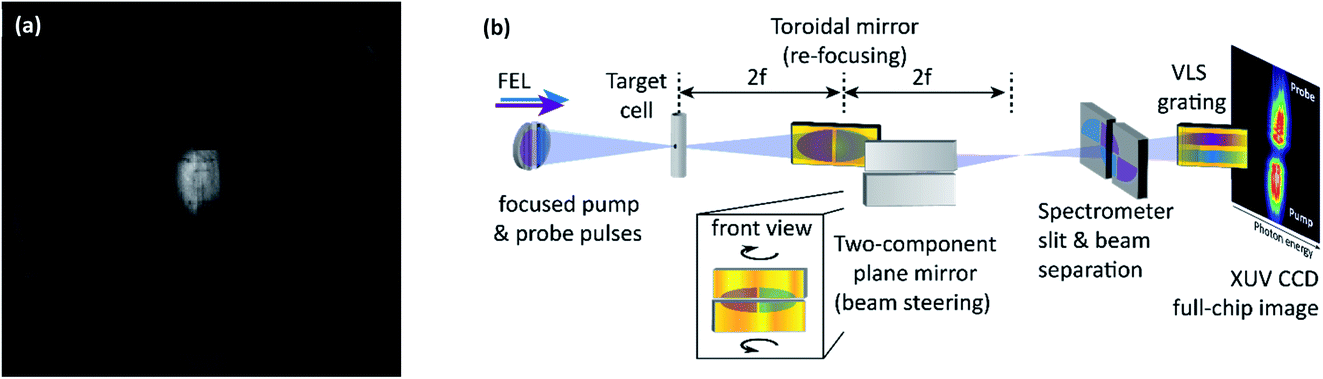 | ||
| Fig. 3 (a) Fluorescence image of pump (right of image center) and time-delayed probe (left of image center) partial beams taken from a retractable phosphor screen behind the FLASH in-house SDU right before the ellipsoidal focusing mirror. The FWHM beam diameter is of the order 10 mm. (b) Optical layout of the experimental setup. The FLASH in-house SDU (symbolically represented by the mirror halves on the left-hand side) and the ellipsoidal focusing mirror (not shown) are implemented in the setup to create pump (blue beam, variable mirror component of the SDU) and probe (violet beam, fixed mirror component) pulse pairs. Both FEL beams are focused into the target cell. An Au-coated 15-degree grazing incidence toroidal mirror (2f–2f imaging mirror) is implemented to maximize the XUV flux entering the XUV spectrometer. In addition, a plane two-component mirror allows us to further process the beam after the interaction with the target and directing it onto the spectrometer entrance slit. More specifically, the two plane mirrors are tilted in opposite directions such that pump and probe beam components are vertically separated on the spectrometer entrance slit. This allows to record the spectrally dispersed signal of both pump and probe beamlets, simultaneously, with the same XUV-grating spectrometer. See photographic depictions of those key components in Fig. 4. | ||
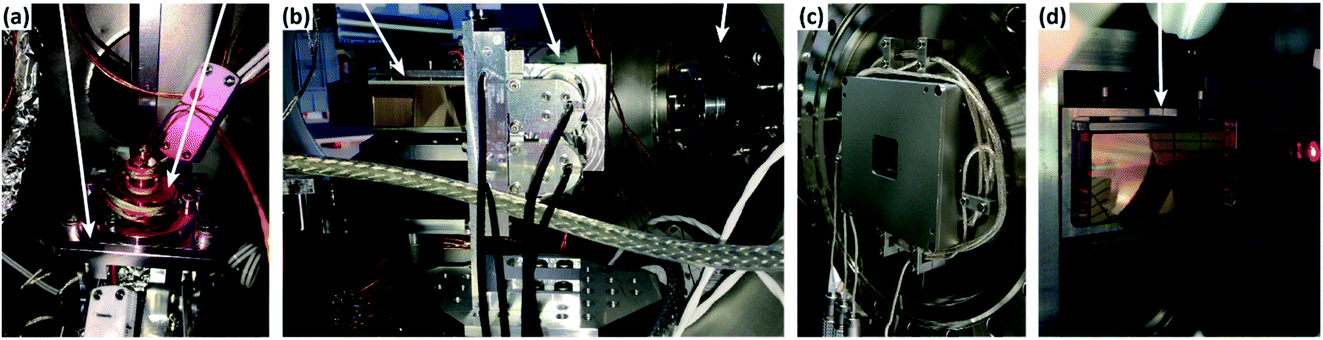 | ||
| Fig. 4 Photographic depictions of key components of the beamline. (a) Target-cell mounting and positioning unit (inner tube of the target cell is not visible as it is covered by the heating jacket). Residues from iodine-containing molecule targets are deposited on the instruments inside the target chamber (purple discolorations). (b) View into the mirror chamber housing a toroidal re-focusing mirror and a two-component plane mirror (mounted face-to-face under grazing incidence) which transport the beam into the spectrometer unit. A home-built motorized iris aperture is used for adjustment purposes. (c) Motorized high-precision spectrometer entrance slit with two pairs of blades for the X- and Y-dimensions, respectively. (d) Variable-line-spacing grating inside the spectrometer chamber. Picture taken during the adjustment procedure using a red helium-neon laser. | ||
The spectrometer endstation is based on a curved dispersive grating with a variable line spacing (VLS) for the imaging of the XUV/soft X-ray spectral region between ∼20 and ∼110 eV onto a flat spectral plane (see Fig. 4d). An XUV-sensitive CCD camera with 1340 spectral and 400 vertical pixels (pixel size: 20 × 20 μm2) is mounted on a mechanical translation stage which allows to shift the 26.8 × 8 mm2-sized camera chip along the full spectral image plane of ∼110 mm length. The spectrometer is equipped with a two-dimensional (2d) entrance slit system consisting of 4 piezo-driven (sub-μm resolution and repeatability) blades with a maximum opening of 20 × 20 mm2 (see Fig. 4c). The 2d slit allows to form a rectangular aperture in any size down to ∼1 μm in the X- and Y-direction at any travel range in the transverse plane of the beam. In combination with a toroidal 2f–2f imaging mirror (see Fig. 4b) positioned behind the target in order to maximize (through refocusing) the in-coupled XUV photon flux at the spectrometer entrance slit, this spectrometer setup provides a spectral resolving power of E/ΔE ≈ 1500, for both pump- and probe pulse spectra. Variable beam attenuation is accomplished by a mechanical home-built filter assembly that allows to insert a variety of different attenuation foils (foil thicknesses between 0.5–5 μm), which allows one to cover a three-orders-of-magnitude range of XUV flux (at 50 eV photon energy) and detection thereof on a single-shot basis. We note that due to the stochastic nature of the SASE FEL, ensembles with statistically varying pulse properties, such as the pulse energy, i.e., the number of photons contained in each pulse, are produced. These stochastic fluctuations are an important ingredient of our data analysis, where it is crucial to measure events on a shot-by-shot basis, and we make use of it in order to quantify the measurement results for different ranges of the FEL pulse energy. On average, for all measurements presented here, a mean pulse energy of 47.5 μJ was determined with a shot-to-shot rms deviation of ∼28%. The pulse energy was measured parasitically on a single-shot basis with a gas monitor detector (GMD)27 upstream of the experiment. Assuming an average temporal pulse duration of about 100 fs, as estimated from the duration of the electron bunches28 for our specific machine setting, and an estimated total beamline transmission of about 20% due to losses in the optics setup, including the VLS online spectrometer and the split-and-delay unit at FLASH as well as several beam steering apertures, these pulse energies correspond to average XUV intensities in the mid 1013 W cm−2 range at the interaction point in the target gas cell. It should be noted that all FEL pulse energies stated below refer to the directly measured quantity with the GMD.
3 Results and discussion
3.1 Time-resolved observation of ionization dynamics in neon
Now we discuss the capabilities of the experimental setup for the example of measuring the sequential ionization dynamics of neon via two FEL photons at 50 eV photon energy, as illustrated in the level scheme of Fig. 5a. The photoionization involves the sequential formation of singly-charged (Ne+) and doubly-charged (Ne2+) ions, each with a considerably large cross section of about 9 Mbarn. This is an ionization scheme at which the available FEL photon flux promotes the depletion of the neutral target (Ne) and an abundant relative production of Ne2+ (in the order of 70% (ref. 3)), while a relatively small amount of the intermediate Ne+ ions remain after the interaction with all photons of the pulse. This leads to the saturation of XUV photoabsorption and a non-linear dependency between pulse energy and transmitted photon number per pulse through the target-gas medium. The effect is demonstrated in Fig. 5b, where we show the single-shot correlation between the number of measured CCD counts and the FEL-pulse energy determined by the GMD. The orange data points show the linear behaviour of a reference measurement without the target, and the non-linear absorption measurement is shown by the violet data points (different colour variations indicate ranges of different pulse energy as categorized for the analysis of Fig. 6). Only for the lowest pulse energies (0–20 μJ, light-violet points in Fig. 5b), do we see the effect of linear absorption in the gas medium (linear dependency between CCD counts and pulse energy). For all higher pulse-energy ranges, the transmission through the gas medium increases non-linearly with increasing pulse energy.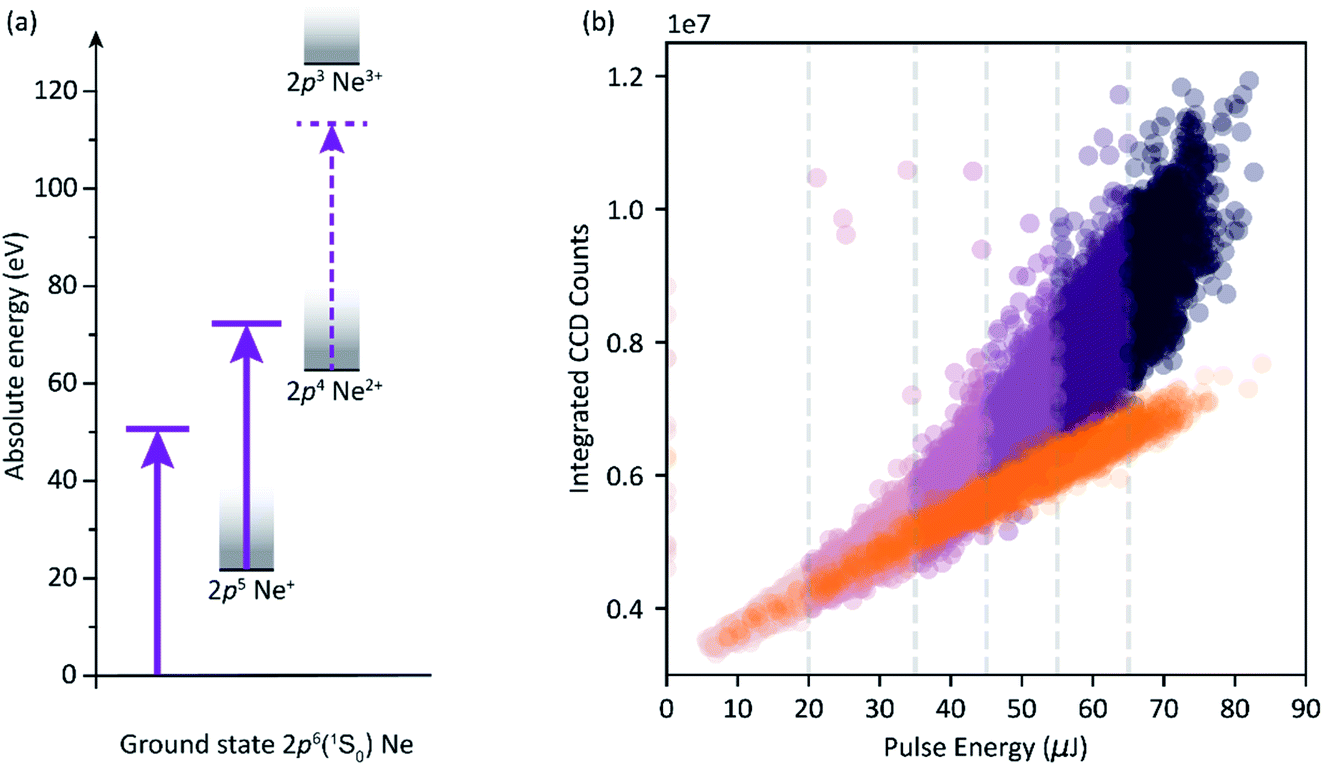 | ||
| Fig. 5 (a) Level scheme of the sequential two-photon double-ionization process of Ne. (b) Single-shot correlation map of the integrated CCD transmission signal (pump and probe spectra) through the Ne gas, and the pulse energy. Orange points represent the reference data (no target) of 3.300 single-shot measurements. Violet points are absorption data of an experimental run over 24.800 measurements. The colour variation indicates different ranges of pulse energy as partitioned for the photon-energy-resolved analysis of transient absorption data (cf.Fig. 6). Both data sets were taken successively under the same experimental conditions and the specified FLASH machine parameters. The reference measurement was conducted with an additional 1.5 μm of aluminium attenuation in the unfocused beam right before the CCD sensor to avoid saturation of the camera chip. | ||
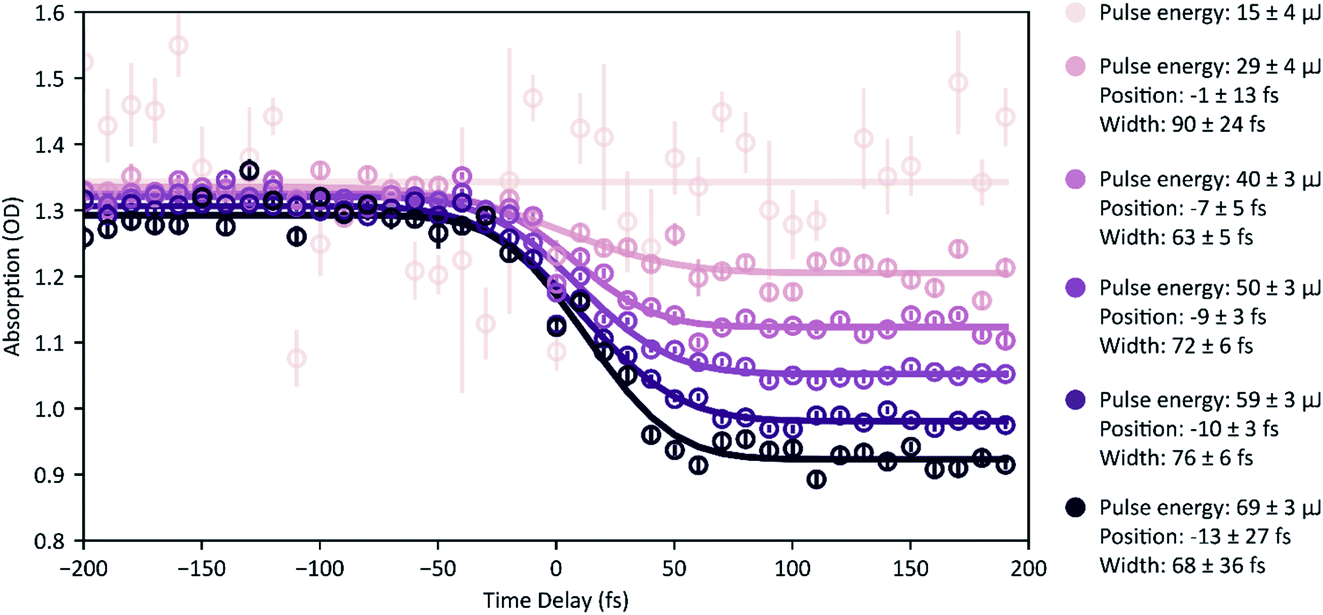 | ||
Fig. 6 XUV-pump XUV-probe transient absorption spectroscopy on Ne. Measurement points are the spectrally integrated absorption signal (absolute OD) of the probe pulse. In total, 600 single spectra were measured for each time-delay setting, which are analysed for different ranges of pulse energy (mean pulse-energy values and standard deviations are stated, colour code according to Fig. 4b). Given error bars specify the standard error of the mean, σn, i.e. the standard deviation divided by 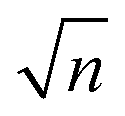 , where n denotes the total number of measurements. Solid lines represent error-function fits, and the stated errors of widths and positions are the fit errors. , where n denotes the total number of measurements. Solid lines represent error-function fits, and the stated errors of widths and positions are the fit errors. | ||
Now we evaluate the absorbance of the data presented in Fig. 5 as a function of the pump–probe time delay. Therefore, we determine the optical density according to eqn (1) from the spectrally integrated transmission signal of the probe pulse, Isig(τ), and an average spectrum of the probe pulse from the reference measurement (Fig. 5, orange points), Iref. In Fig. 6 we show the resulting transient absorption traces, which directly reflect the time-dependent ion buildup in response to the averaged temporal profile of the pump–probe cross-correlation signal. The reduction in the absorbance at positive delays (pump pulse precedes the probe pulse) occurs due to an enhanced transparency of the target medium due to pump-induced ionization processes. For a quantitative analysis we compare transient absorption traces for different ranges of pulse energy and determine their position in the time delay (i.e., the inflection point of the sigmoidal curve) and the width (FWHM) by error-function curve fitting to the measurement data. We find for increasing pulse energies a temporal shift of the error-function-like signal trace towards negative delays on the order of 10 fs and a reduction of the signal width of about 20–30 fs. We attribute these findings to variations in the spectro-temporal FEL-pulse properties, implying shorter average pulse durations for higher pulse energy. The spectro-temporal FEL-pulse properties can be precisely extracted from a two-dimensional, τ- and ω-dependent data analysis and also reveal the trend of a decreasing FEL-frequency chirp for increasing pulse energies.29 Furthermore, we find that only for those pulse energies in the range <20 μJ (mean pulse energy 15 ± 4 μJ), are the time-dependent (error-function-type) absorption changes absent. In accordance with the data representation of Fig. 5b, this indicates the absence of any non-linear absorption effect in this particular range.
3.2 Time-resolved observation of the AC Stark shift in doubly-charged neon ions
The aggregated Ne2+ ions in the target gas cannot be further ionized by one 50 eV photon, but can be resonantly excited by promoting a valence electron out of the triplet 2p4 ground state into the 3d shell. This results in a triplet (spin–orbit split) excited state and includes six ground-excited bound-electron transitions classified by 3PJ=0,1,2–3DJ=1,2,3 (P and D denote the orbital angular momentum of ground and excited state, respectively, and the quantum number J is the total angular momentum) as illustrated in the level-coupling scheme of Fig. 7a. However, due to a limited spectrometer resolution of about 30 meV we only observe three spectral resonance lines near 49.37 eV, 49.29 eV and 49.25 eV photon energy, corresponding to the fine-structure splitting of the triplet ground state. In a former work,3 we elucidated the XUV-induced AC Stark shift of these transitions in static absorption spectroscopy, i.e., as a function of the pulse energy only. We observed a fork-like splitting and shifting of the multiplet lines, most prominently seen for the 3P0–3D1 transition (cf.Fig. 7b). Now, we explicitly focus on the time dependence of this effect. Fig. 7c shows measured transient absorption data of the pump pulse for the pulse-energy range >65 μJ (mean pulse energy 69 ± 3 μJ, pulse-energy range indicated in dark violet in Fig. 5b). This measurement demonstrates the feasibility of the experimental apparatus to track time-dependent spectral line shifts. We observe a time-dependent error-function-type line shifting and splitting, which is scanned with a 10 fs incremental time-delay step size. The fitted spectral line positions (via triple-Gaussian model function) are presented in Fig. 7d at each time delay (red, green, and blue data points), which are thereafter error-function-curve fitted over time delay (solid lines). At negative delays, a significant amount of the pulse energy of the preceding probe pulse in the neon target is spent for the initial two-photon ionization processes to produce Ne2+, i.e., the actual target system for resonant coupling. Consequently, the subsequent pump pulse only loses a small number of photons due to continuum absorption (ionization) and virtually its full photon flux is available for the resonant coupling process (maximum line shifts). At positive delays (effectively pump only), the opposite is the case, and a considerable number of photons in the pump pulse are lost due to the sequential two-photon double ionization to create the Ne2+. Therefore, the resonantly coupled states in this case are exposed to a weaker photon flux only at later times within the pump pulse. The role of probe and pump pulse is thus interchanged in this case, which is realized by intentionally evaluating the transmitted XUV absorption spectra of the stronger pump pulse. The extracted line shift of the 3P0–3D1 transition from positive to negative delays amounts to ∼40 meV. Note that in this measurement strong-field and thus light-shift conditions are present at all time delays. The extracted temporal duration of this transient spectral shifting effect is about 41 ± 29 fs (FWHM). Effectively, this value reflects the temporal duration of the pump pulse alone. Furthermore, we extract a time delay of 82 ± 15 fs of this transient spectral light shift with respect to time zero. This value indicates the time-delay position at which the pulses start to overlap temporarily and the probe-produced Ne2+ ions become available for the pump photons. We note that such dominant spectral shifts are not seen, vice versa, in the corresponding transient absorption spectrum of the probe pulse, since the probe pulse was slightly less intense (1![[thin space (1/6-em)]](https://www.rsc.org/images/entities/char_2009.gif) :0.5 estimated pump–probe intensity ratio) in this specific experimental setting.
:0.5 estimated pump–probe intensity ratio) in this specific experimental setting.
 | ||
| Fig. 7 (a) Level scheme of the resonant coupling mechanism of the Ne2+ ion. Observed absorption lines correspond to the ground-state splitting, while the 1 meV-scale excited-state splitting is unresolved. The observed sets of multiplet transitions are indicated in blue, green, and red. (b) Static absorption spectroscopy of the pump pulse evaluated at large negative delays (probe first) for the mean pulse energies 18 ± 5 μJ (pulse-energy range <25 μJ), 40 ± 3 μJ (pulse-energy range 35–45 μJ), and 61 ± 5 μJ (pulse-energy range >55 μJ). Also see ref. 3 for further details on the experiment. (c) Time-resolved absorption data of the pump pulse at 69 ± 3 μJ mean pulse energy (pulse-energy range indicated in dark violet in Fig. 5b). (d) Fitted spectral positions of the observed lines (data points) and error-function fit to the fit results over time delay (corresponding solid lines) to find temporal duration and position of the transient spectral shift. | ||
3.3 XUV-induced molecular dynamics
 | ||
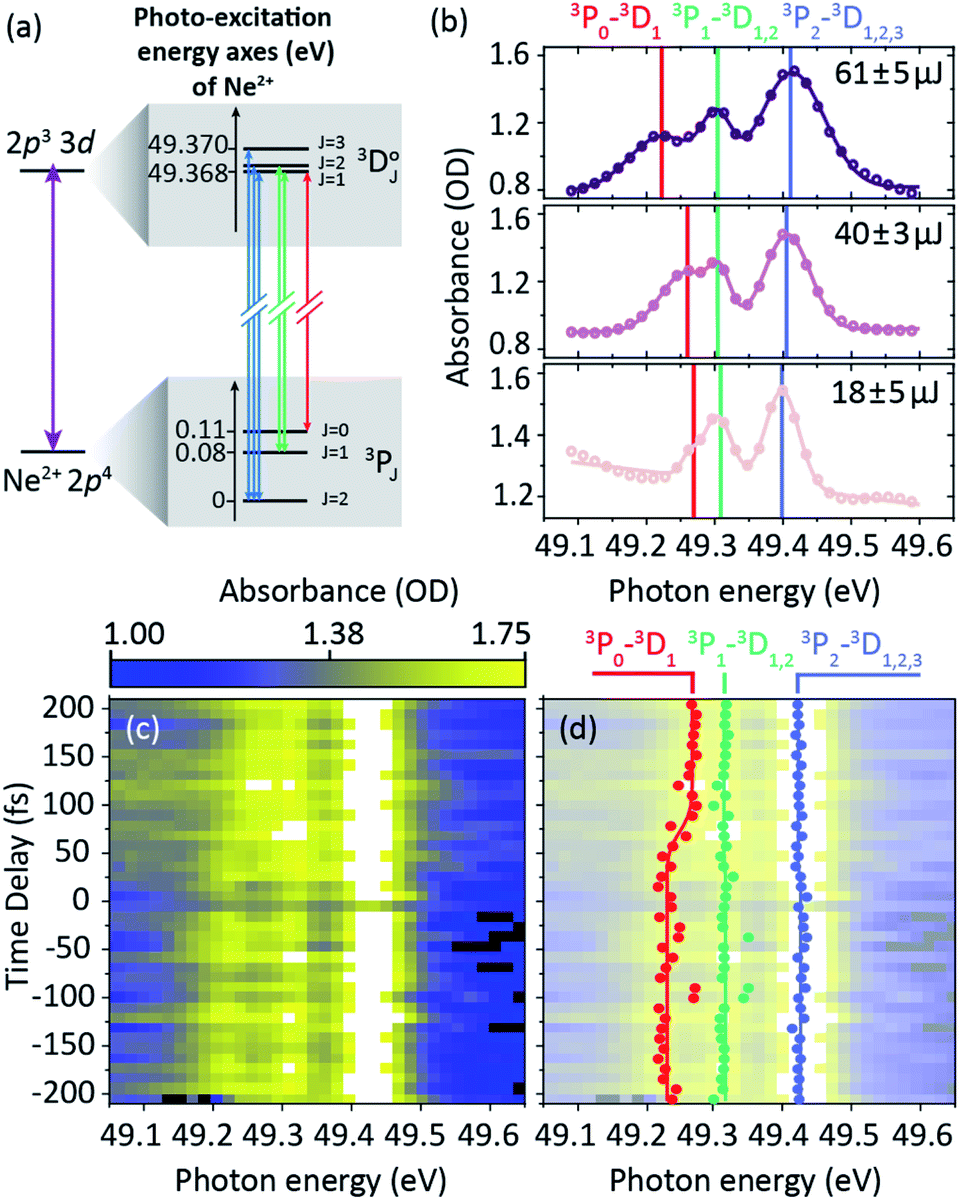
| Fig. 8 (a) Level scheme and resonant transitions (indicated by arrows) of the O2+-ion—the final atomic dissociation product. (b) XUV-pump XUV-probe transient absorption spectroscopy of molecular oxygen (probe–pulse spectrum). The absorbance is evaluated via a reconstructed reference signal, having excluded all fast oscillating resonance features from the transmitted spectrum by means of a Fourier low-pass filter. Observed absorption lines at positive delays (pump first) correspond to the resonant transitions of the atomic O2+ ion indicated in (a). | ||
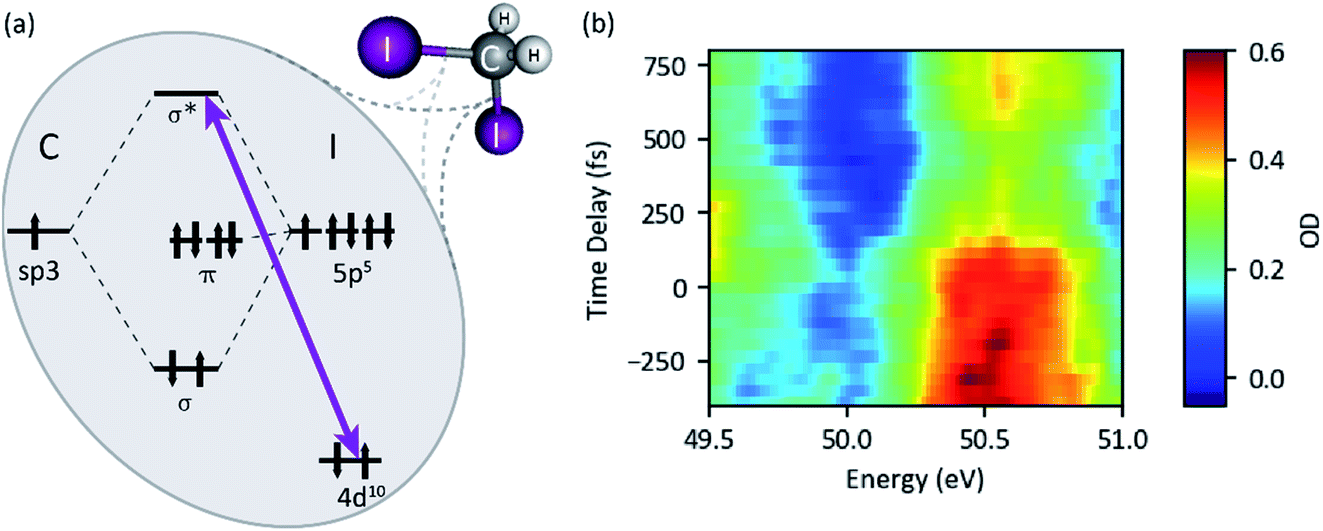 | ||
| Fig. 9 (a) Term scheme of the diiodomethane (CH2I2) target molecule. The resonant XUV excitation from the iodine 4d orbital to an antibonding σ* molecular orbital is indicated by the violet arrow. (b) XUV-pump XUV-probe transient absorption spectroscopy of diiodomethane (probe–pulse spectrum). | ||
3.4 XUV–XUV two-beam interferometry
The essential prerequisite for coherent XUV-pump XUV-probe spectroscopy is a sufficient (i.e., down to sub-XUV-wavelengths) interferometric stability of the split-mirror setup. However, mechanical vibrations and fluctuations in the environmental conditions are often responsible for considerable interferometric instabilities, such that the relative phase between two split-and-delayed XUV/X-ray (halve-) pulses is not preserved from one shot to the next. However, within each single shot those disturbances are virtually absent.Here, we present a new single-shot analysis approach in order to extract coherent signals from XUV-pump XUV-probe transient absorption spectra, which are otherwise washed out (or phase averaged) due to the shot-to-shot pump–probe timing jitter (0.28 fs at this specific setup24). This method is based on the Fourier analysis of each individually measured (i.e., single-shot) photon spectrum, in order to extract the spectral interference fringes from the random and spiky background of the SASE-power spectrum. The Fourier-frequency-component information (modulus of the Fourier transform) of this spectral interference fringe pattern corresponds to the pump–probe pulse delay (denoted by “Pseudo time”). In Fig. 10 we show the Fourier analysis (modulus of the Fourier transform) of the transmitted probe pulse spectrum through neon, corresponding to the transient absorption data of Fig. 6. The data is averaged over 200 single measurements for each time-delay setting after having taken the Fourier transform. The Fourier spectrum shows a prominent DC peak, the amplitude of which reflects the total (spectrally integrated) transmission of the probe pulse and is increased at positive delays (pump first) due to the increased relative abundance of Ne2+ (cf.Fig. 6 for the corresponding absorbance traces). In addition, a time-delay-dependent Fourier peak appears, which indicates the presence of spectral modulations of identical periodicity for each time-delay setting.
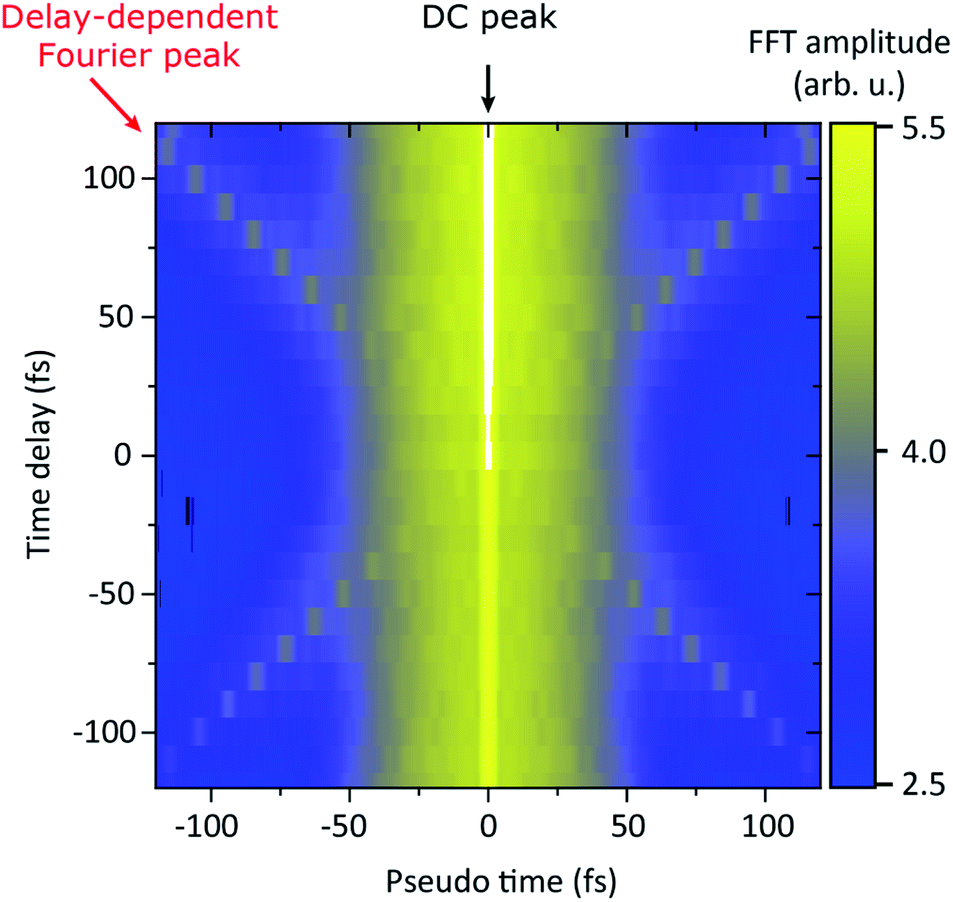 | ||
| Fig. 10 Single-shot Fourier analysis of pump–probe transient absorption spectroscopy data on neon (probe–pulse spectrum), where the time delay (y-axis, mirror setting) is plotted against Fourier-transformed SASE-pulse spectra (x-axis, Fourier domain denoted by “Pseudo time”). The spectrogram exhibits a DC peak on top of a broad range of “slow” time-delay-independent frequency components corresponding to the naturally random spike-structure of the SASE spectra. The time-delay-dependent Fourier peaks correspond to XUV–XUV spectral interference fringes with a periodicity corresponding to the relative pulse delay. | ||
4 Summary and conclusions
With the presented setup and methods, it is possible to obtain a time- and frequency-resolved view into atomic and molecular quantum dynamics. The method builds on phase-locked FEL-pump and FEL-probe pulses employed in transient absorption geometry and provides direct access to non-linear coherent phenomena at XUV frequencies. We have presented the time-resolved and pulse-energy-resolved observation of XUV-induced ionization dynamics of neon, as well as strong resonant coupling effects (AC Stark shift) in the doubly-charged neon ion. We also applied our method to molecular targets such as molecular oxygen in order to track the dissociation dynamics from the intact molecular system to its separated and isolated ionic constituents, revealing specific electronic states. Applied to diiodomethane (CH2I2), the presented results demonstrate the possibility to probe site-selective spectroscopic information with sensitivity to transient molecular geometries in heteronuclear polyatomic molecules. Combining a high joint spectral (30 meV) and temporal (fs) resolution and XUV-pump XUV-probe interferometric accessibility on a single-shot basis, the presented method opens up wide applicability for advanced coherent non-linear spectroscopies at high frequencies. With the latest technological advances towards intense XUV/X-ray attosecond pulses that are based on XFEL32,33 or high-harmonic-generation (HHG)34–37 sources, we expect a further push of the temporal resolution down to the attosecond timescale (while increasing the probing bandwidth up to the 10 eV scale) in the near future.Conflicts of interest
There are no conflicts to declare.Acknowledgements
We gratefully acknowledge technical support from C. Kaiser and B. Knape. We gratefully acknowledge the Technical and Scientific teams at FLASH, in particular Dr G. Brenner, for their support during the experiment. We acknowledge the use of the DESY photon facility. We acknowledge funding from the European Research Council (ERC) (X-MuSiC 616783). Z.-H. L. acknowledges the support of the Singapore Ministry of Education (RG105/17 and MOE2018-T2-1-081). H. Z. acknowledges the support of the BMBF (Project No. 05K13PM2).Notes and references
- A. A. Sorokin, M. Wellhöfer, S. V. Bobashev, K. Tiedtke and M. Richter, Phys. Rev. A: At., Mol., Opt. Phys., 2007, 75, 1–4 CrossRef.
- B. Rudek, S.-K. Son, L. Foucar, S. W. Epp, B. Erk, R. Hartmann, M. Adolph, R. Andritschke, A. Aquila, N. Berrah, C. Bostedt, J. Bozek, N. Coppola, F. Filsinger, H. Gorke, T. Gorkhover, H. Graafsma, L. Gumprecht, A. Hartmann, G. Hauser, S. Herrmann, H. Hirsemann, P. Holl, A. Hömke, L. Journel, C. Kaiser, N. Kimmel, F. Krasniqi, K.-U. Kühnel, M. Matysek, M. Messerschmidt, D. Miesner, T. Möller, R. Moshammer, K. Nagaya, B. Nilsson, G. Potdevin, D. Pietschner, C. Reich, D. Rupp, G. Schaller, I. Schlichting, C. Schmidt, F. Schopper, S. Schorb, C.-D. Schröter, J. Schulz, M. Simon, H. Soltau, L. Strüder, K. Ueda, G. Weidenspointner, R. Santra, J. Ullrich, A. Rudenko and D. Rolles, Nat. Photonics, 2012, 6, 858–865 CrossRef CAS.
- T. Ding, M. Rebholz, L. Aufleger, M. Hartmann, K. Meyer, V. Stooß, A. Magunia, D. Wachs, P. Birk, Y. Mi, G. D. Borisova, C. d. C. Castanheira, P. Rupprecht, Z.-H. Loh, A. R. Attar, T. Gaumnitz, S. Roling, M. Butz, H. Zacharias, S. Düsterer, R. Treusch, S. M. Cavaletto, C. Ott and T. Pfeifer, Phys. Rev. Lett., 2019, 123, 103001 CrossRef CAS.
- G. Doumy, C. Roedig, S.-K. Son, C. I. Blaga, A. D. DiChiara, R. Santra, N. Berrah, C. Bostedt, J. D. Bozek, P. H. Bucksbaum, J. P. Cryan, L. Fang, S. Ghimire, J. M. Glownia, M. Hoener, E. P. Kanter, B. Krässig, M. Kuebel, M. Messerschmidt, G. G. Paulus, D. A. Reis, N. Rohringer, L. Young, P. Agostini and L. F. DiMauro, Phys. Rev. Lett., 2011, 106, 083002 CrossRef CAS.
- C. Ott, L. Aufleger, T. Ding, M. Rebholz, A. Magunia, M. Hartmann, V. Stooß, D. Wachs, P. Birk, G. D. Borisova, K. Meyer, P. Rupprecht, C. Da Costa Castanheira, R. Moshammer, A. R. Attar, T. Gaumnitz, Z. H. Loh, S. Düsterer, R. Treusch, J. Ullrich, Y. Jiang, M. Meyer, P. Lambropoulos and T. Pfeifer, Phys. Rev. Lett., 2019, 123, 163201 CrossRef CAS.
- X. C. Lin, Annu. Rev. Phys. Chem., 2005, 56, 221–254 CrossRef.
- C. J. Milne, T. J. Penfold and M. Chergui, Coord. Chem. Rev., 2014, 277–278, 44–68 CrossRef CAS.
- M. Simon, M. N. Piancastelli and D. W. Lindle, in Hard X-ray Photoelectron Spectroscopy (HAXPES), ed. J. Woicik, Springer International Publishing, Cham, 2016, pp. 65–110 Search PubMed.
- M. N. Piancastelli, T. Marchenko, R. Guillemin, L. Journel, O. Travnikova, I. Ismail and M. Simon, Rep. Prog. Phys., 2020, 83, ab5516 CrossRef.
- C. Callegari, A. N. Grum-Grzhimailo, K. L. Ishikawa, K. C. Prince, G. Sansone and K. Ueda, arXiv:2008.11024v1 [physics.atom-ph], 2020.
- E. Goulielmakis, Z. H. Loh, A. Wirth, R. Santra, N. Rohringer, V. S. Yakovlev, S. Zherebtsov, T. Pfeifer, A. M. Azzeer, M. F. Kling, S. R. Leone and F. Krausz, Nature, 2010, 466, 739–743 CrossRef CAS.
- M. Holler, F. Schapper, L. Gallmann and U. Keller, Phys. Rev. Lett., 2011, 106, 123601 CrossRef CAS.
- M. Chini, X. Wang, Y. Cheng, Y. Wu, D. Zhao, D. A. Telnov, S.-I. Chu and Z. Chang, Sci. Rep., 2013, 3, 1105 CrossRef.
- C. Ott, A. Kaldun, P. Raith, K. Meyer, M. Laux, J. Evers, C. H. Keitel, C. H. Greene and T. Pfeifer, Science, 2013, 340, 716–720 CrossRef CAS.
- L. Gallmann, J. Herrmann, R. Locher, M. Sabbar, A. Ludwig, M. Lucchini and U. Keller, Mol. Phys., 2013, 111, 2243–2250 CrossRef CAS.
- B. Bernhardt, A. R. Beck, X. Li, E. R. Warrick, M. J. Bell, D. J. Haxton, C. W. McCurdy, D. M. Neumark and S. R. Leone, Phys. Rev. A: At., Mol., Opt. Phys., 2014, 89, 1–5 CrossRef.
- C. Ott, A. Kaldun, L. Argenti, P. Raith, K. Meyer, M. Laux, Y. Zhang, A. Blättermann, S. Hagstotz, T. Pfeifer and Others, Nature, 2014, 516, 374–378 CrossRef CAS.
- L. Young, K. Ueda, M. Gühr, P. H. Bucksbaum, M. Simon, S. Mukamel, N. Rohringer, K. C. Prince, C. Masciovecchio, M. Meyer, A. Rudenko, D. Rolles, C. Bostedt, M. Fuchs, D. A. Reis, R. Santra, H. Kapteyn, M. Murnane, H. Ibrahim, F. Légaré, M. Vrakking, M. Isinger, D. Kroon, M. Gisselbrecht, A. L’Huillier, H. J. Wörner and S. R. Leone, J. Phys. B: At., Mol. Opt. Phys., 2018, 51, 032003 CrossRef.
- R. N. Coffee, J. P. Cryan, J. Duris, W. Helml, S. Li and A. Marinelli, Philos. Trans. R. Soc., A, 2019, 377(2145), 20180386 CrossRef CAS.
- J. Rossbach, J. R. Schneider and W. Wurth, Phys. Rep., 2019, 808, 1–74 CrossRef CAS.
- S. Mukamel, D. Healion, Y. Zhang and J. D. Biggs, Annu. Rev. Phys. Chem., 2013, 64, 101–127 CrossRef CAS.
- F. Bencivenga, R. Cucini, F. Capotondi, A. Battistoni, R. Mincigrucci, E. Giangrisostomi, A. Gessini, M. Manfredda, I. P. Nikolov, E. Pedersoli, E. Principi, C. Svetina, P. Parisse, F. Casolari, M. B. Danailov, M. Kiskinova and C. Masciovecchio, Nature, 2015, 520, 205–208 CrossRef CAS.
- W. Ackermann, G. Asova, V. Ayvazyan, A. Azima, N. Baboi, J. Bähr, V. Balandin, B. Beutner, A. Brandt, A. Bolzmann, R. Brinkmann, O. I. Brovko, M. Castellano, P. Castro, L. Catani, E. Chiadroni, S. Choroba, A. Cianchi, J. T. Costello, D. Cubaynes, J. Dardis, W. Decking, H. Delsim-Hashemi, A. Delserieys, G. Di Pirro, M. Dohlus, S. Düsterer, A. Eckhardt, H. T. Edwards, B. Faatz, J. Feldhaus, K. Flöttmann, J. Frisch, L. Fröhlich, T. Garvey, U. Gensch, C. Gerth, M. Görler, N. Golubeva, H.-J. Grabosch, M. Grecki, O. Grimm, K. Hacker, U. Hahn, J. H. Han, K. Honkavaara, T. Hott, M. Hüning, Y. Ivanisenko, E. Jaeschke, W. Jalmuzna, T. Jezynski, R. Kammering, V. Katalev, K. Kavanagh, E. T. Kennedy, S. Khodyachykh, K. Klose, V. Kocharyan, M. Körfer, M. Kollewe, W. Koprek, S. Korepanov, D. Kostin, M. Krassilnikov, G. Kube, M. Kuhlmann, C. L. S. Lewis, L. Lilje, T. Limberg, D. Lipka, F. Löhl, H. Luna, M. Luong, M. Martins, M. Meyer, P. Michelato, V. Miltchev, W. D. Möller, L. Monaco, W. F. O. Müller, O. Napieralski, O. Napoly, P. Nicolosi, D. Nölle, T. Nuñez, A. Oppelt, C. Pagani, R. Paparella, N. Pchalek, J. Pedregosa-Gutierrez, B. Petersen, B. Petrosyan, G. Petrosyan, L. Petrosyan, J. Pflüger, E. Plönjes, L. Poletto, K. Pozniak, E. Prat, D. Proch, P. Pucyk, P. Radcliffe, H. Redlin, K. Rehlich, M. Richter, M. Roehrs, J. Roensch, R. Romaniuk, M. Ross, J. Rossbach, V. Rybnikov, M. Sachwitz, E. L. Saldin, W. Sandner, H. Schlarb, B. Schmidt, M. Schmitz, P. Schmüser, J. R. Schneider, E. A. Schneidmiller, S. Schnepp, S. Schreiber, M. Seidel, D. Sertore, A. V. Shabunov, C. Simon, S. Simrock, E. Sombrowski, A. A. Sorokin, P. Spanknebel, R. Spesyvtsev, L. Staykov, B. Steffen, F. Stephan, F. Stulle, H. Thom, K. Tiedtke, M. Tischer, S. Toleikis, R. Treusch, D. Trines, I. Tsakov, E. Vogel, T. Weiland, H. Weise, M. Wellhöfer, M. Wendt, I. Will, A. Winter, K. Wittenburg, W. Wurth, P. Yeates, M. V. Yurkov, I. Zagorodnov and K. Zapfe, Nat. Photonics, 2007, 1, 336–342 CrossRef.
- M. Wöstmann, R. Mitzner, T. Noll, S. Roling, B. Siemer, F. Siewert, S. Eppenhoff, F. Wahlert and H. Zacharias, J. Phys. B: At., Mol. Opt. Phys., 2013, 46, 164005 CrossRef.
- G. Brenner, S. Kapitzki, M. Kuhlmann, E. Ploenjes, T. Noll, F. Siewert, R. Treusch, K. Tiedtke, R. Reininger, M. D. Roper, M. A. Bowler, F. M. Quinn and J. Feldhaus, Nucl. Instrum. Methods Phys. Res., Sect. A, 2011, 635, S99–S103 CrossRef CAS.
- K. Tiedtke, A. Azima, N. von Bargen, L. Bittner, S. Bonfigt, S. Düsterer, B. Faatz, U. Frühling, M. Gensch, C. Gerth, N. Guerassimova, U. Hahn, T. Hans, M. Hesse, K. Honkavaar, U. Jastrow, P. Juranic, S. Kapitzki, B. Keitel, T. Kracht, M. Kuhlmann, W. B. Li, M. Martins, T. Núñez, E. Plönjes, H. Redlin, E. L. Saldin, E. A. Schneidmiller, J. R. Schneider, S. Schreiber, N. Stojanovic, F. Tavella, S. Toleikis, R. Treusch, H. Weigelt, M. Wellhöfer, H. Wabnitz, M. V Yurkov and J. Feldhaus, New J. Phys., 2009, 11, 023029 CrossRef.
- K. Tiedtke, J. Feldhaus, U. Hahn, U. Jastrow, T. Nunez, T. Tschentscher, S. V. Bobashev, A. A. Sorokin, J. B. Hastings, S. Möller, L. Cibik, A. Gottwald, A. Hoehl, U. Kroth, M. Krumrey, H. Schöppe, G. Ulm and M. Richter, J. Appl. Phys., 2008, 103, 094511 CrossRef.
- O. H. Altenmueller, R. R. Larsen and G. A. Loew, Rev. Sci. Instrum., 1964, 35, 438–442 CrossRef.
- T. Ding, M. Rebholz, L. Aufleger, M. Hartmann, V. Stooß, C. Castanheira, P. Rupprecht, Y. Mi, A. R. Attar, T. Gaumnitz, S. M. Cavaletto, C. Ott and T. Pfeifer, Nat. Commun., 2021, 12, 643 CrossRef CAS.
- R. L. Kelly and L. J. Palumbo, Atomic and Ionic Emission Lines Below 2000 Angstroms: Hydrogen Through Krypton, Naval Research Laboratory, 1973 Search PubMed.
- M. Rebholz, T. Ding, L. Aufleger, M. Hartmann, K. Meyer, V. Stooß, A. Magunia, D. Wachs, P. Birk, Y. Mil, G. D. Borisova, C. da C. Castanheira, P. Rupprecht, G. Schmid, K. Schnorr, C. D. Schröter, R. Moshammer, Z.-H. Loh, A. R. Attar, S. R. Leone, T. Gaumnitz, H. J. Wörner, S. Roling, M. Butz, H. Zacharias, S. Düsterer, R. Treusch, G. Brenner, M. Braune, J. Vester, V. Despré, A. I. Kuleff, C. Ott and T. Pfeifer, submitt. manuscr., 1–8.
- N. Hartmann, G. Hartmann, R. Heider, M. S. Wagner, M. Ilchen, J. Buck, A. O. Lindahl, C. Benko, J. Grünert, J. Krzywinski, J. Liu, A. A. Lutman, A. Marinelli, T. Maxwell, A. A. Miahnahri, S. P. Moeller, M. Planas, J. Robinson, A. K. Kazansky, N. M. Kabachnik, J. Viefhaus, T. Feurer, R. Kienberger, R. N. Coffee and W. Helml, Nat. Photonics, 2018, 12, 215–220 CrossRef CAS.
- J. Duris, S. Li, T. Driver, E. G. Champenois, J. P. MacArthur, A. A. Lutman, Z. Zhang, P. Rosenberger, J. W. Aldrich, R. Coffee, G. Coslovich, F.-J. Decker, J. M. Glownia, G. Hartmann, W. Helml, A. Kamalov, J. Knurr, J. Krzywinski, M.-F. Lin, M. Nantel, A. Natan, J. O’Neal, N. Shivaram, P. Walter, A. Wang, J. J. Welch, T. J. A. Wolf, J. Z. Xu, M. F. Kling, P. Bucksbaum, A. Zholents, Z. Huang, J. P. Cryan and A. Marinelli, Nat. Photonics, 2020, 14, 30–36 CrossRef CAS.
- P. Tzallas, E. Skantzakis, L. A. A. Nikolopoulos, G. D. Tsakiris and D. Charalambidis, Nat. Phys., 2011, 7, 781–784 Search PubMed.
- A. Nayak, I. Orfanos, I. Makos, M. Dumergue, S. Kühn, E. Skantzakis, B. Bodi, K. Varju, C. Kalpouzos, H. I. B. Banks, A. Emmanouilidou, D. Charalambidis and P. Tzallas, Phys. Rev. A, 2018, 98, 1–8 CrossRef.
- I. Orfanos, I. Makos, I. Liontos, E. Skantzakis, B. Major, A. Nayak, M. Dumergue, S. Kühn, S. Kahaly, K. Varju, G. Sansone, B. Witzel, C. Kalpouzos, L. A. A. Nikolopoulos, P. Tzallas and D. Charalambidis, J. Phys.: Photonics, 2020, 2, 042003 Search PubMed.
- I. Makos, I. Orfanos, A. Nayak, J. Peschel, B. Major, I. Liontos, E. Skantzakis, N. Papadakis, C. Kalpouzos, M. Dumergue, S. Kühn, K. Varju, P. Johnsson, A. L’Huillier, P. Tzallas and D. Charalambidis, Sci. Rep., 2020, 10, 1–18 CrossRef.
| This journal is © The Royal Society of Chemistry 2021 |