 Open Access Article
 This Open Access Article is licensed under a Creative Commons Attribution-Non Commercial 3.0 Unported Licence
Atomistic insight in the flexibility and heat transport properties of the stimuli-responsive metal–organic framework MIL-53(Al) for water-adsorption applications using molecular simulations†
Aran
Lamaire‡
 ,
Jelle
Wieme‡
,
Alexander E. J.
Hoffman
and
Veronique
Van Speybroeck
*
,
Jelle
Wieme‡
,
Alexander E. J.
Hoffman
and
Veronique
Van Speybroeck
*
Center for Molecular Modeling, Ghent University, Tech Lane Ghent Science Park Campus A, Technologiepark 46, 9052 Zwijnaarde, Belgium. E-mail: Veronique.VanSpeybroeck@UGent.be
First published on 30th March 2020
Abstract
To exploit the full potential of metal–organic frameworks as solid adsorbents in water-adsorption applications, many challenges remain to be solved. A more fundamental insight into the properties of the host material and the influence that water exerts on them can be obtained by performing molecular simulations. In this work, the prototypical flexible MIL-53(Al) framework is modelled using advanced molecular dynamics simulations. For different water loadings, the presence of water is shown to affect the relative stability of MIL-53(Al), triggering a phase transition from the narrow-pore to the large-pore phase at the highest considered loading. Furthermore, the effect of confinement on the structural organisation of the water molecules is also examined for different pore volumes of MIL-53(Al). For the framework itself, we focus on the thermal conductivity, as this property plays a decisive role in the efficiency of adsorption-based technologies, due to the energy-intensive adsorption and desorption cycles. To this end, the heat transfer characteristics of both phases of MIL-53(Al) are studied, demonstrating a strong directional dependence for the thermal conductivity.
1 Introduction
For more than two decades, metal–organic frameworks (MOFs) have been investigated for their exceptional adsorption properties. Today, these porous, hybrid inorganic–organic crystalline frameworks still hold a lot of potential for a wide range of adsorption technologies in fields related to sustainable energy storage and the reduction of the greenhouse effect.1–4 Water-adsorption applications are one of the many promising possibilities for the use of MOFs as advanced solid adsorbents.5–9 Water-stable MOFs could, for instance, find use in adsorption-driven heat pumps or chillers,10–15 and in atmospheric water harvesting.16–19However, just as for all applications involving repeated adsorption processes, the heat management in water-adsorption applications poses an important engineering challenge. Insight into the thermal transport characteristics of MOFs is therefore essential, as their efficiency as adsorbents is strongly reduced when the temperature of the system increases, thus requiring proper control over the heat released by adsorption. This not only holds for storage tanks, in which the slow dissipation of heat could hinder the tank-filling cycles, but also for heat pumps, in which heat should be transferred rapidly to the surroundings. External heat exchangers or more conductive MOF composites could be developed to meet these requirements, but this comes at a cost.20–23 As the thermal conductivity of MOFs is very complicated to measure accurately,24–28 relatively few experimental studies have discussed the importance of the intrinsic heat dissipation in MOFs, so that mainly computational investigations have provided explanations for their low thermal conductivities.29–36 Nevertheless, for most MOFs, reference data is still lacking in the literature.28,36 In this work, the thermal conductivity of MIL-53(Al) was simulated,37 a bistable material that possesses a narrow-pore (np) and a large-pore (lp) phase (Fig. 1) and is known for its anisotropic mechanical and thermal properties.38,39 For practical applications, quantification of the anisotropy in the heat transfer is required as it can affect the design and operation of certain devices.40 In this proof-of-principle study for the flexible MIL-53(Al) framework, we show that the intrinsic thermal conductivity of the framework differs between its (meta)stable states, which might be exploited in nanoscale applications that require precise control over the thermal conductivity via external stimuli, such as temperature and pressure.41–43
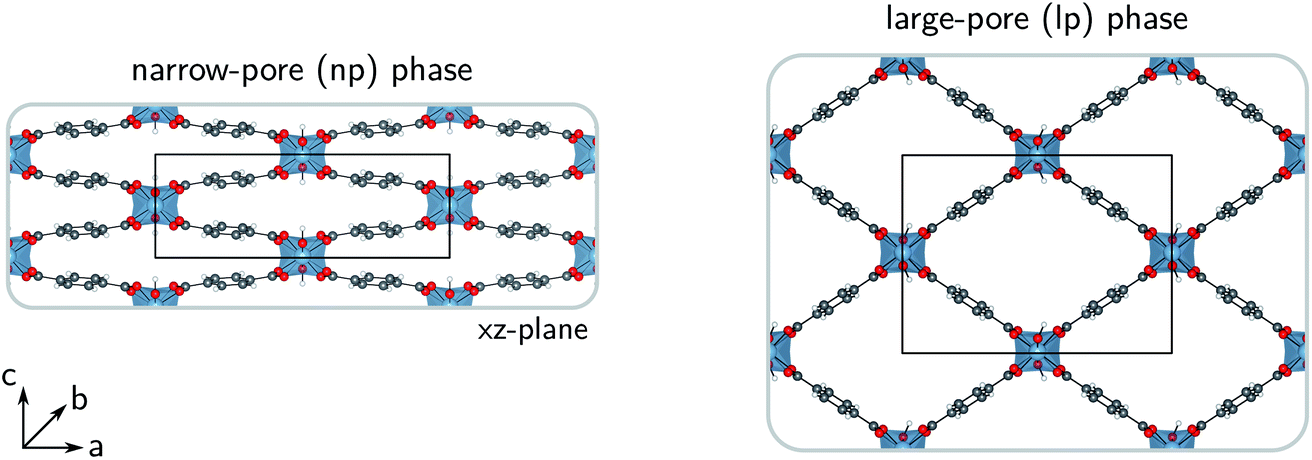 | ||
| Fig. 1 Molecular representations of the narrow-pore (np) and the large-pore (lp) phases of MIL-53(Al). The a-, b- and c-directions are indicated together with the conventional unit cells in the ac-plane. | ||
These stimuli, alongside guest adsorption, can trigger the intrinsic flexibility of MIL-53(Al), resulting in a reversible structural transformation44–47 that can contribute to the internal heat management during the adsorption process, as the heat of adsorption is partially used to overcome the energetic barrier between the different phases.48,49 In other words, by carefully selecting a MOF exhibiting a reversible phase transition in the desired adsorption range, it becomes possible to lower the overall amount of heat released in the adsorption process in comparison to a material without a phase transition.
However, designing a MOF with a reversible phase transition in the relevant adsorption window is a nontrivial task. Experimentally, this is accompanied by a high degree of trial and error, as the underlying thermodynamic potential cannot be directly accessed.46 Despite the abundance of adsorption studies in MOFs, only a limited number of theoretical studies have investigated the critical effect that guest molecules can have on the phase stability.46,50,51 Some of the present authors recently demonstrated that standard computational considerations typically do not suffice for these complex materials, as long-range dispersion interactions and correlated atomic motion might play an important qualitative and quantitative role in the description of these stimuli-responsive MOFs.52,53 In this work, the validity of another typical approximation – i.e. the neglect of nuclear quantum effects in the simulations54 – is tested for the modelling of guest-induced phase transitions.
We chose the rather extreme case of water in MIL-53(Al), where large nuclear quantum effects could be expected.55 This particular framework is known to be moderately stable with respect to water56,57 and the presence of water in MIL-53 materials has already been computationally explored in the past.51,58–61 Furthermore, MIL-53(Al) variants with different organic linkers (e.g. MOF-303 and A520) have been investigated specifically for water-adsorption applications.11,19 In this contribution, the phase stability of MIL-53(Al) in the presence of water is discussed, alongside the possible influence of neglecting nuclear quantum effects. Finally, we also try to obtain molecular-level insight into the water structure inside the pores, which is currently an active field of research for water-stable MOFs.58,60,62–65
Using advanced molecular simulation tools on the prototypical flexible material MIL-53(Al), this work thus considers two important fundamental issues strongly related to water-adsorption applications of MOFs: (1) the phase stability and the water structure inside the pores of a stimuli-responsive MOF and (2) the anisotropic thermal conductivity properties of the adsorbent.
2 Methodology
2.1 Force field
To model the potential energy surface of MIL-53(Al), a force field is used, as the computational cost of first-principles methods is currently too high to extract the properties under investigation. This force field was generated with our in-house developed QuickFF protocol for deriving force fields from first-principles input.66,67 In this way, we approximate the quantum mechanical potential energy surface in the neighbourhood of the equilibrium structure – which is defined by the optimized geometry and the Hessian at the PBE+D3(BJ) level of theory68–70 – using a combination of analytical covalent, electrostatic, and van der Waals force field terms. The covalent interactions are written in terms of bonds, bends, out-of-plane distances, and dihedral angles, and contain both anharmonic terms and cross terms. Minimal Basis Iterative Stockholder (MBIS) charges are used to describe the electrostatic potential between Gaussian charge distributions centered on the nuclei.71 The van der Waals interactions were modelled by the MM3-Buckingham model72 up to a finite cutoff of 12 Å and were supplemented with tail corrections.73 This particular force field was specifically constructed to accurately model structural, vibrational, mechanical, and thermal properties, and corresponds with the MCAM force field discussed in ref. 67. More details regarding the force field energy expression can be found in the ESI (Section S1†).For the simulations of MIL-53(Al) including water, the q-TIP4P/F74 force field was used to describe the water molecules. This force field was derived by Habershon et al. from the well-known TIP4P/2005 model75 and extended to include both flexibility and anharmonicity. The O–H stretch is described by a quartic potential, whereas the H–O–H bond angle is described by a harmonic potential (see ESI Section S1†). Similar to the rigid TIP4P/2005 model, the non-covalent interactions are modelled using four interaction sites, assigning an additional interaction site M to every water molecule, which is located at the bisector of the H–O–H angle. For the van der Waals interactions, described by a Lennard-Jones potential, only the oxygen atoms yield a non-zero contribution. The interactions between the water molecules and the framework can also be modelled by a Lennard-Jones potential, using the Lorentz–Berthelot mixing rules for the rescaled MM3 parameters of the framework: σLJ = 25/6σMM3, which ensures that the minima of both potentials occur at the same internuclear distance.
Complementary to the van der Waals interactions, only the H atoms and M sites of the water molecules yield contributions to the electrostatic interactions, as the oxygen atoms do not bear a charge. By placing the negative charge on the M site rather than on the oxygen atom, a better mean-field description of the polarization of the water molecules can be obtained. Although a more rigorous inclusion of electronic polarization might enhance the description of the interactions between the framework and the guest molecules, especially when making the framework polarizable as shown by Cirera et al.,59 it is by no means trivial to make the extension to fully polarizable force fields. Therefore, explicit electronic polarization is commonly not taken into account when studying water in confinement.62,63 In spite of these limitations of a mean-field description of the polarization, this water model does allow us to describe hydrogen bonding effects, as discussed in the ESI (Section S1†).
Finally, the q-TIP4P/F force field was also tailored for use in quantum simulations, making use of path integral molecular dynamics (PIMD)54 instead of classical molecular dynamics (MD), thereby exchanging the classical treatment of the atomic nuclei with a quantum mechanical one. Given the importance of an accurate description of the low mass protons, as they play a pivotal role in the behaviour of water, a proper inclusion of nuclear quantum effects (NQEs), such as the zero-point energy of the nuclei, is required.
2.2 Construction of the Helmholtz free energy profiles
The flexibility of MIL-53(Al) is investigated using the thermodynamic protocol discussed in ref. 46, starting from MD simulations in the (N, V, σa = 0, T) ensemble for a set of volumes. From these simulations, which were carried out at temperatures of 100 K and 300 K, the pressure profile is extracted (Fig. S2†), from which the Helmholtz free energy profile
  can be obtained as a function of the volume V for each temperature via thermodynamic integration.
The classical MD simulations are performed with Yaff,76 using a Verlet time step of 0.5 fs. The temperature is controlled by a Nosé–Hoover chain thermostat77–79 containing three beads with a relaxation time of 0.1 ps, while the pressure is controlled by a Martyna–Tuckerman–Tobias–Klein barostat80,81 using a relaxation time of 1 ps.
To examine the influence of nuclear quantum effects (NQEs), PIMD simulations54 are performed on the same volume grid and for the same temperatures. Applying PIMD on large structures such as MOFs is challenging due to the large computational cost that is associated with it, but it is necessary for a correct quantitative description of different properties, such as the thermal expansion and the heat capacity.82,83 The PIMD simulations were performed with i-PI,84,85 which delegates the evaluation of the forces to external codes. In this case, the covalent interactions are computed by Yaff76 and the long-range interactions are evaluated using LAMMPS for ring-polymers containing 32 beads.86 To control the temperature, a PILE-L thermostat87 is applied to the system and a white noise Langevin thermostat88 is applied to the cell. To control the pressure, a modified path-integral version of the Raiteri–Gale–Bussi barostat84,89 is used to sample the (N, V, σa = 0, T) ensemble. The time constants of the thermostats and the barostats are respectively 0.1 and 0.25 ps. A BAOAB type90 scheme is used to integrate the equations of motion.
Both classical and path integral MD simulations were performed with and without water in the pores, considering three different loadings, i.e. 2.5, 7.5, and 22.5 water molecules per conventional unit cell. All the simulations related to the calculation of Helmholtz free energy profiles were performed on a 1 × 2 × 1 supercell, containing 152 framework atoms including 8 aluminium atoms.
2.3 Thermal conductivity
The Green–Kubo approach91,92 was used in combination with classical MD simulations to determine the thermal conductivity. This formalism is based on the fluctuation–dissipation theorem and states that the thermal conductivity κ can be computed by integrating the heat current autocorrelation function (HCACF) over time: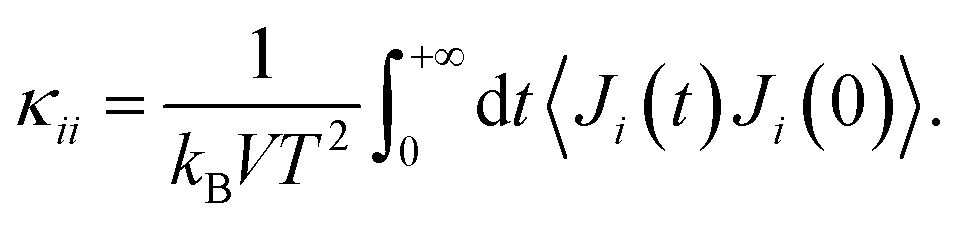 | (1) |
An advantage of this method is that the heat current Ji (i = x, y, or z) – and thus κii – can be simultaneously extracted in all directions from one set of simulations.
This method has been used previously by some of the present authors to compute the thermal conductivity of various well-known MOFs, such as UiO-66, HKUST-1, and MOF-5, at their equilibrium volume.36 In this work, we computed the thermal conductivity of MIL-53(Al) for different unit cell volumes ranging from 750 Å3 to 1500 Å3 in steps of 50 Å3. To this end, a series of one hundred independent simulations per volume point were conducted. First, a hundred starting structures were extracted from MD snapshots taken every 5 ps from an equilibrated classical MD simulation in the (N, V, σa = 0, T) ensemble at 300 K using a 1 × 2 × 1 supercell (i.e. a conventional cell elongated along the Al(OH) chain) in Yaff.76 These structures were subsequently converted to 7 × 8 × 7 supercells containing 29![[thin space (1/6-em)]](https://www.rsc.org/images/entities/char_2009.gif) 792 atoms, as this is necessary to limit finite size effects.93 Finally, classical MD simulations are performed with LAMMPS86 to equilibrate the supercells at 300 K for 375 ps in the (N, V, h0, T) ensemble and for 125 ps in the (N, V, E) ensemble. The HCACF is thereafter collected during one hundred 6 ns runs in the microcanonical ensemble. The heat flux is computed every 4 fs and the HCACF is averaged in blocks of 200 ps, of which an example is shown in Fig. S6.† All classical MD simulations were performed using a 0.5 fs timestep, except for the ones in the (N, V, E) ensemble which used a 1 fs timestep. The system’s temperature was also verified to be 300 K at the end of the NVE simulations.
792 atoms, as this is necessary to limit finite size effects.93 Finally, classical MD simulations are performed with LAMMPS86 to equilibrate the supercells at 300 K for 375 ps in the (N, V, h0, T) ensemble and for 125 ps in the (N, V, E) ensemble. The HCACF is thereafter collected during one hundred 6 ns runs in the microcanonical ensemble. The heat flux is computed every 4 fs and the HCACF is averaged in blocks of 200 ps, of which an example is shown in Fig. S6.† All classical MD simulations were performed using a 0.5 fs timestep, except for the ones in the (N, V, E) ensemble which used a 1 fs timestep. The system’s temperature was also verified to be 300 K at the end of the NVE simulations.
Afterwards, the thermal conductivity was computed by integrating the HCACF over time (Fig. S6†). As the resulting thermal conductivity can be substantially influenced by slow oscillations in the HCACF, it is necessary to integrate over a sufficiently long time interval.93 These slow oscillations in the tail of the autocorrelation function mix with numerical noise, which contaminates the HCACF and cumulates a considerable integration error for the thermal conductivity.94,95 For some simulations, this resulted in a slight deviation from zero for the HCACF’s tail, which we removed after fitting.94 Methods that take care of this in a systematic way are to the best of our knowledge not directly applicable to complex systems like MOFs due to a non-monotonic HCACF.96 Finally, we determined the thermal conductivity by taking the running average of the last 25 ps, similar to previous work.29,36,96
An error bar was estimated using bootstrapping. This is done by resampling the thermal conductivity results of the hundred independent trajectories. We find errors between 0.02 and 0.1 W m−1 K−1. Note that this error bar only captures sampling effects and does not take into account limitations of the force field and the simulation method.
2.4 Vibrational analysis
To understand the influence of NQEs on the Helmholtz free energy profile of MIL-53(Al), the vibrational frequency spectrum of MIL-53(Al) is also investigated.97,98 The normal modes and the corresponding frequencies of the np and lp phases are determined via diagonalization of the mass-weighted Hessian, obtained from ab initio calculations. For more details about the computational settings, we refer to previous work.98These lattice vibrations are furthermore also known to have an impact on the thermal properties of a material. For the specific case of MOFs, it was shown that vibrational modes can be linked with the direction of the heat transfer within the system.30 The effect of the lattice vibrations on the thermal conductivity can be assessed by constructing the so-called vibrational density of states (VDOS):30
 | (2) |
 | (3) |
The VDOS spectra of the different atom types in MIL-53(Al) can be calculated from the classical MD simulations on the 1 × 2 × 1 supercells. The integration in the VDOS expression is then reduced to a sum, resulting in a discrete Fourier transform that is evaluated using Yaff.76
3 Results and discussion
3.1 Flexibility of MIL-53(Al)
As the relative stability of the narrow-pore (np) and large-pore (lp) phases of MIL-53(Al) has already been demonstrated to depend critically on the description of long-range dispersion interactions52,99 and is altered by the presence of additional metastable phases of coexisting lp and np layers at a mesoscale level,53,100 we now revert our attention to the influence of NQEs on the phase stability. Given the intention to examine the presence of water molecules in the MIL-53 framework, the archetypal molecules investigated within the context of NQEs, we first assess the effect of including NQEs for the empty framework. Following the thermodynamic protocol outlined in Section 2.2, Helmholtz free energy profiles of MIL-53(Al) are constructed at 100 and 300 K, using both classical MD and PIMD, for which the results are depicted in Fig. 2a. At 300 K, classical MD predicts an lp–np Helmholtz free energy difference of 38.3 kJ mol−1, whereas PIMD yields a difference of 35.2 kJ mol−1. At 100 K, the Helmholtz free energy differences obtained from classical MD and PIMD are respectively 47.3 kJ mol−1 and 43.6 kJ mol−1. These moderate differences of about 3 to 4 kJ mol−1 in the relative lp–np stability can be explained by considering the vibrational frequencies characterizing the np and lp phases (Fig. 3), obtained from an ab initio normal mode analysis of the structures.98 From these vibrational frequencies, the classical and quantum mechanical partition functions can be calculated using a harmonic approximation. The ratio of both partition functions for a specific set of modes is then to be viewed as a measure of the degree of quantumness of these modes: | (4) |
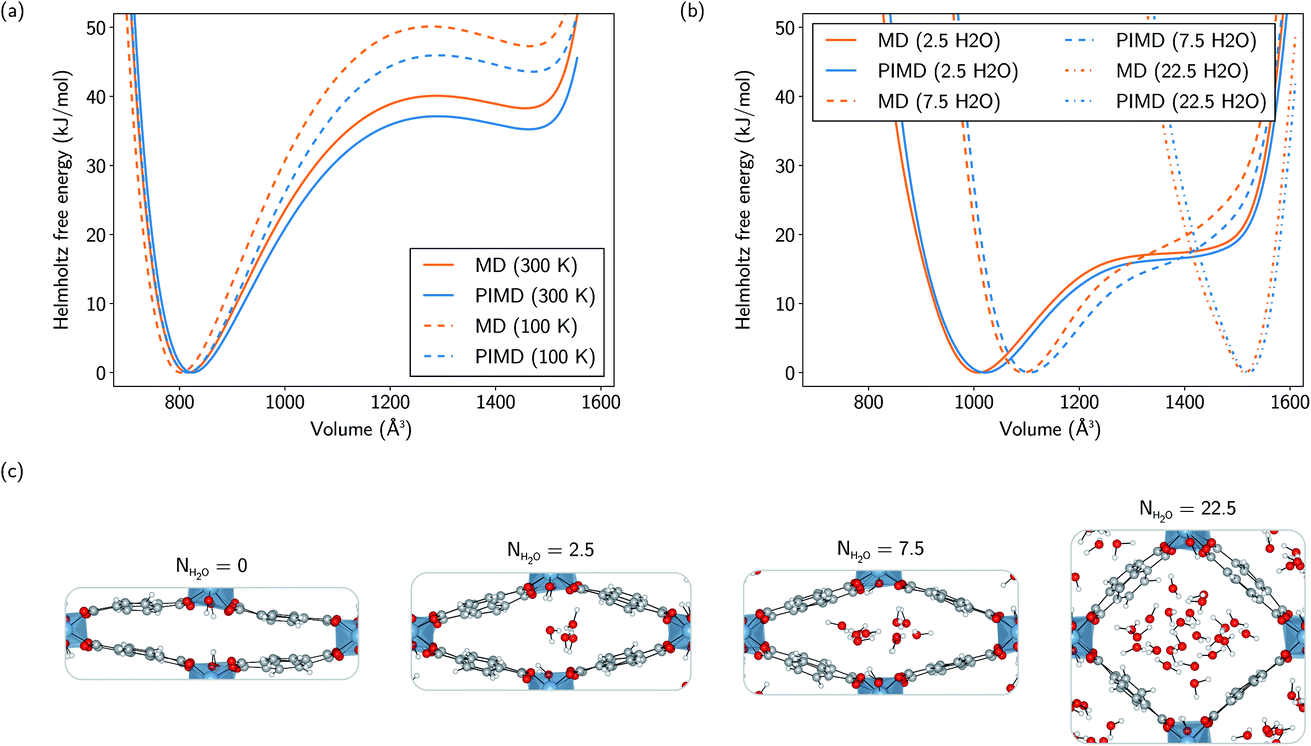 | ||
| Fig. 2 (a) Helmholtz free energy profiles of MIL-53(Al) as a function of volume at 100 K and 300 K, as calculated using both MD and PIMD simulations. (b) Helmholtz free energy profiles of MIL-53(Al) as a function of volume at 300 K for water loadings of 2.5, 7.5, and 22.5 water molecules per conventional unit cell, as calculated using both MD and PIMD simulations. (c) Molecular representations of an MD snapshot at the equilibrium volume with 0, 2.5, 7.5, and 22.5 water molecules in the pores. All simulations were performed with a 1 × 2 × 1 supercell. | ||
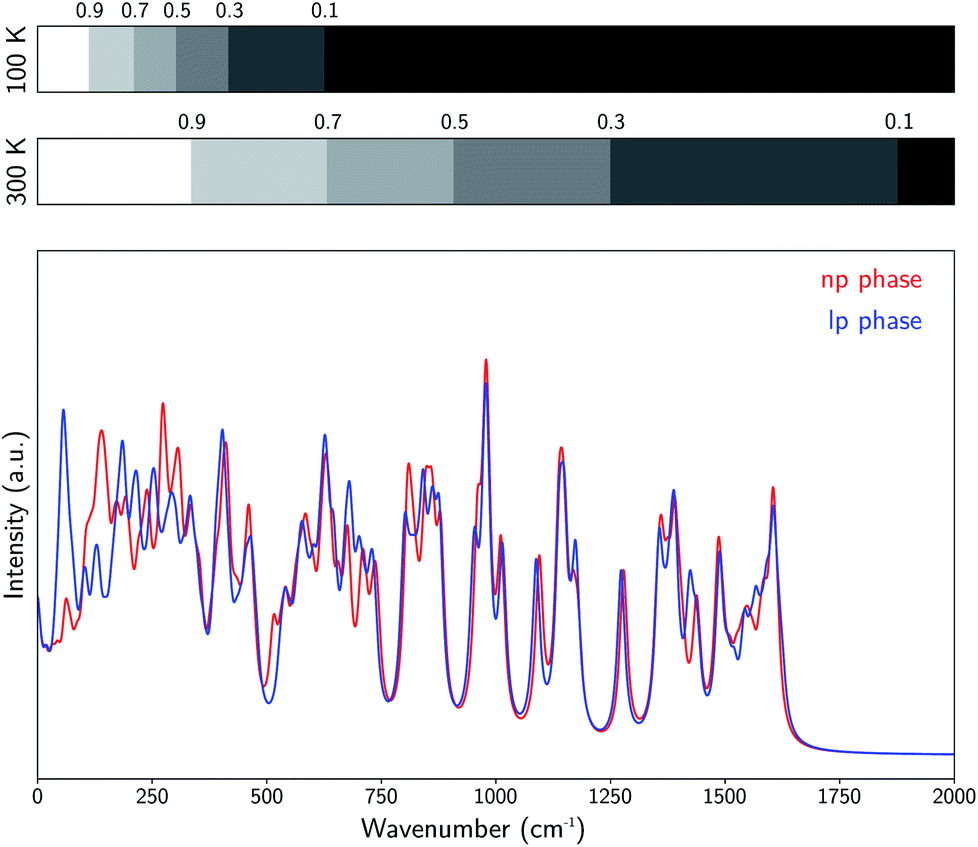 | ||
| Fig. 3 Visualization of the ab initio vibrational frequencies of the np and lp phases of MIL-53(Al). At each vibrational frequency, a Lorentzian curve was generated with a full-width-at-half-maximum of 10 cm−1. The bars on top indicate the wavenumber regions for which the ratio of the quantum mechanical and classical partition functions is larger than respectively 0.9, 0.7, 0.5, 0.3, and 0.1, both at 100 K and 300 K. | ||
3.2 Water in the pores of MIL-53(Al)
Although a substantial number of MOFs possess poor stability with respect to hydration, the MIL-53 family of soft porous crystals is known to have stable hydrated phases, which have been investigated both experimentally and computationally, focusing mainly on the chromium- and gallium-based variants.51,58–61,101–108Here, the influence of the presence of water on the Helmholtz free energy profile of MIL-53(Al) is investigated, closely monitoring the changes in behaviour of the adsorbed species along the profile. Three different water loadings are considered: 2.5, 7.5, and 22.5 water molecules per conventional unit cell, varying from a ratio of less than one molecule per aluminium atom to almost six molecules per aluminium atom. For the lowest loading, the metastable lp phase disappears, while the Helmholtz free energy profile retains a shape similar to the profile of the empty framework, but shifted to an equilibrium volume that is about 200 Å3 larger, thereby stabilizing an intermediate state with a volume in between those of the np and lp phases of the empty framework. On increasing the water loading up to 7.5 molecules per unit cell, the equilibrium volume is further shifted by an additional 85 Å3 and the Helmholtz free energy profile is no longer reminiscent of the bistable empty material. At the highest water loading, representing a ‘superhydrated’ state, the Helmholtz free energy profile possesses a sharp minimum which is only shifted towards higher volumes by about 55 Å3 with respect to the lp equilibrium volume.
The differences between the classically and quantum-mechanically calculated Helmholtz free energy profiles are similar to the ones observed for the empty framework, resulting in a Helmholtz free energy difference of the same order of magnitude, i.e. generally smaller than about 3 kJ mol−1, at larger volumes.
From these simulations, one can also infer the average adsorption enthalpy by simply conducting one additional simulation on a single water molecule. The average adsorption enthalpy ΔHads of the sequential adsorption of N gas phase water molecules into the empty framework is then given by
| ΔHads(0 → N; T) = ΔU(0 → N; T) + PΔV(0 → N; T) − N(UH2O + kBT), | (5) |
 and
and  are respectively the change in internal energy and volume of the system on adsorbing N water molecules and UH2O is the internal energy of a single water molecule in the gas phase. A derivation of this formula can be found in the ESI of ref. 36. The values of the adsorption enthalpy for the different water loadings, calculated using both MD and PIMD, are reported in Table 1 and are of the same order of magnitude as the experimental isosteric heat of adsorption mentioned in ref. 19 and 28 for other aluminium-based frameworks such as MIL-160(Al) and MOF-303. The differences related to the inclusion of NQEs are once more limited to about 2–3 kJ mol−1. As more water molecules are added to the framework, the increase in the magnitude of the adsorption energy decreases, as demonstrated by the small difference in adsorption enthalpy for 7.5 and 22.5 water molecules per unit cell. This also implies that the adsorption process of water within MIL-53(Al) cannot be described by means of a simplified mean-field model, which is of course related to the more complex nature of directional hydrogen bonding interactions that are essential in the description of water.
| N H2O = 2.5 | N H2O = 7.5 | N H2O = 22.5 | |
|---|---|---|---|
| Classical MD | −26.9 | −45.1 | −48.5 |
| PIMD | −24.2 | −42.9 | −46.6 |
Finally, the molecular organization of the water molecules within the MIL-53 framework can also be considered by means of density plots of the guest molecules, thereby visualizing their spatial probability distribution. These densities are shown in Fig. 4 and 5 for different volumes and for both 2.5 and 7.5 water molecules per unit cell, considering the projections onto the planes perpendicular to each of the three cell axes. The density plots for the case of 22.5 water molecules per unit cell can be found in the ESI (Fig. S3†). While no clear preferential hydrogen bonding is observed with the hydroxyl framework groups, which is most likely related to the lack of an explicit force field description of hydrogen bonding or polarization,59 Medders et al.104 also reported a disruption of these preferential hydrogen bonds for water loadings exceeding the number of hydroxyl framework groups. Hydrogen bonds are however formed with the oxygen atoms of the carboxylate groups of the linkers of the framework (see ESI Fig. S4†). Furthermore, the typical 1D water wires in the direction of the aluminium-oxide chains, which have been observed in previous studies of MIL-53-type frameworks,58,102,104 are also present in our simulations at lower volumes (within the np region). At higher volumes, the water molecules take advantage of the additional motional freedom gained through the increase in pore size, leading to a more diffuse picture when compared to the np region. Given that the larger densities are located near the edges of the pore, the presence of the framework is clearly also felt at higher volumes.
 | ||
| Fig. 4 Symmetrised water density in MIL-53(Al) projected onto the xz-plane (perpendicular to the b-axis), the xy-plane (perpendicular to the c-axis), and the yz-plane (perpendicular to the a-axis) for 2.5 water molecules per unit cell at different volumes. In each figure, a 1 × 2 × 1 supercell is shown, containing 5 water molecules. For the xy- and yz-planes, only the upper half of the simulation cell is shown, as the bottom half is its symmetrical equivalent. | ||
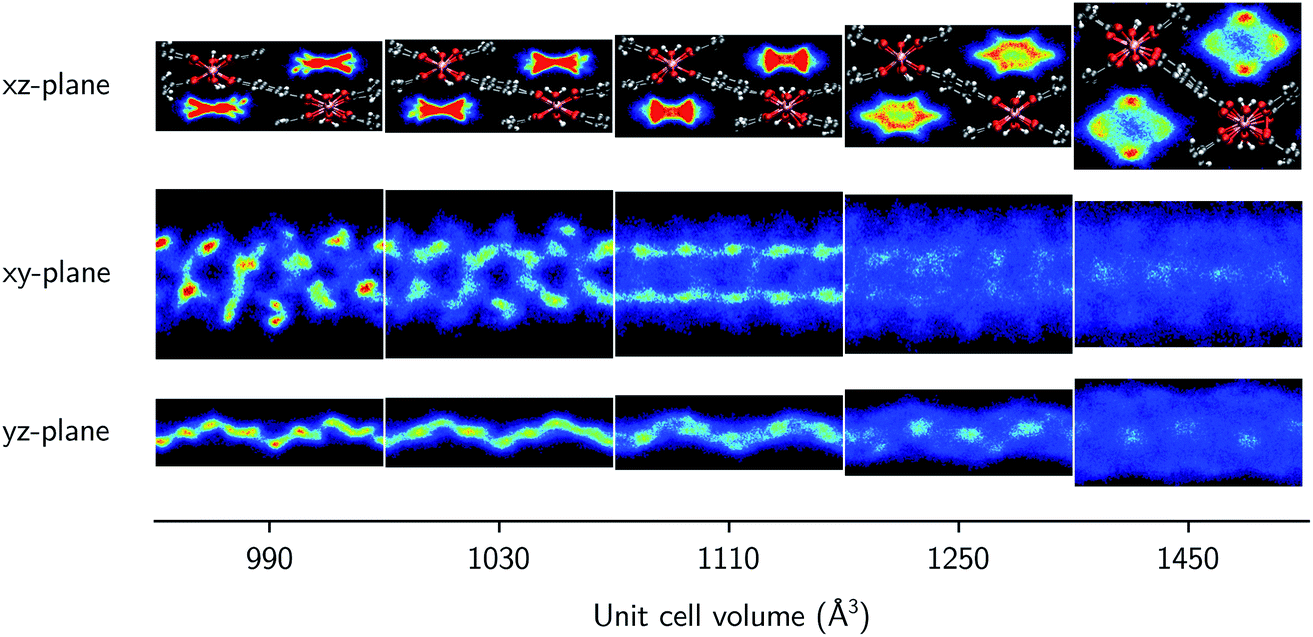 | ||
| Fig. 5 Symmetrised water density in MIL-53(Al) projected onto the xz-plane (perpendicular to the b-axis), the xy-plane (perpendicular to the c-axis), and the yz-plane (perpendicular to the a-axis) for 7.5 water molecules per unit cell at different volumes. In each figure, a 1 × 2 × 1 supercell is shown, containing 15 water molecules. For the xy- and yz-planes, only the upper half of the simulation cell is shown, as the bottom half is its symmetrical equivalent. | ||
3.3 Thermal conductivity
After having investigated the organization of water molecules within the framework of MIL-53(Al), as well as their impact on the flexibility, we now focus again on the framework itself, instead of on the host–guest and guest–guest effects. Insight into the intrinsic heat transfer characteristics of the adsorbent is also essential for a molecular-level understanding of water-adsorption applications. The influence of guest molecules on the thermal conductivity of MOFs is still a topic of debate, but lies beyond the scope of the current study.26,32,109,110 Some studies have suggested that guest molecules improve the heat transfer (i.e. the thermal conductivity increases with the loading), while others have reported the opposite.In general, MOFs are poor heat conductors, especially in comparison with other materials (Fig. 6),36 which can pose a major technological barrier for practical applications. Therefore, both experimental and theoretical in-depth investigations are required to address this problem. However, apart from an already established relationship between the difficult heat dissipation in MOFs and their inherent porosity,29,30,33,36,109 the directional dependence of the thermal conductivity has barely been investigated.31,33,40 Given that flexible MOFs can have a very anisotropic response to different stimuli,38,111 the heat transfer is also expected to show a directional dependence. For a set of idealized MOFs, Wilmer and co-workers studied the anisotropy of the thermal conductivity,33 considering frameworks with a simple cubic structure, a triangular-channel structure, and a hexagonal-channel structure, and discussed how the pore shape and size affect the thermal conductivity in different directions. Their study indicated that MOFs with smaller pores are likely to have a better thermal performance, i.e. a higher thermal conductivity, which was also demonstrated for the IRMOF series.36,109
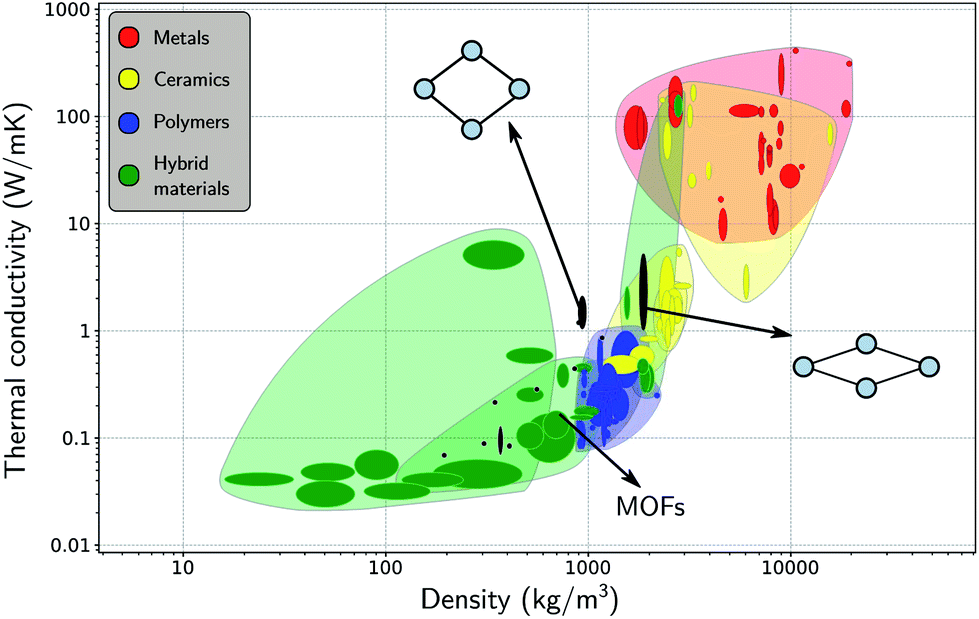 | ||
| Fig. 6 Materials property chart displaying the thermal conductivity and the density of MOFs alongside other material classes, namely, metals (and alloys), ceramics (glasses and (non-)technical ceramics), polymers, and hybrid materials (composites, foams, and natural materials). The thermal conductivities of the lp and the np phases are indicated with black ovals. Figure adapted from ref. 36 with permission of the American Chemical Society. | ||
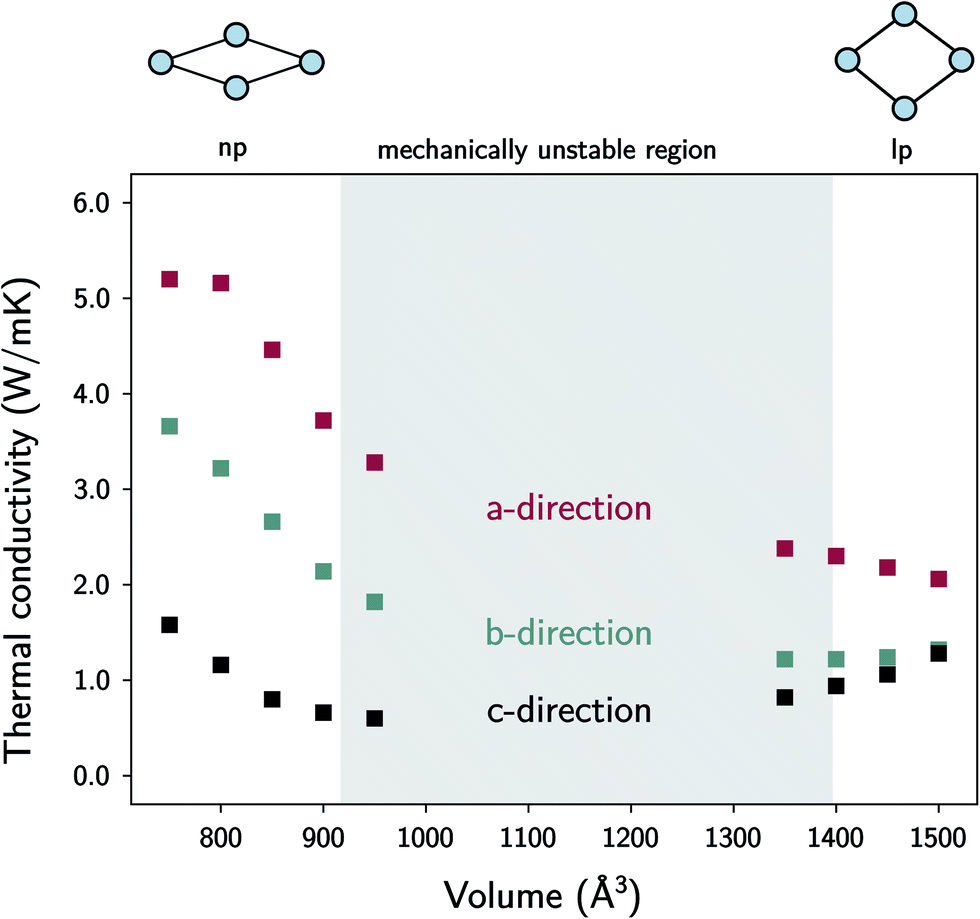 | ||
| Fig. 7 The thermal conductivity of MIL-53(Al) as a function of the volume at room temperature. The volumes in between the lp and the np phases are mechanically unstable. | ||
In the lp region (Fig. 7), the thermal conductivity in the a-direction is clearly higher than the thermal conductivity in the c-direction. In these directions, the heat is transferred along the bonds of the organic linkers, which are more aligned with the a-direction than with the c-direction (Fig. 1). As the angle between the organic linkers and the a-direction increases from approximately 30 to 40 degrees in the lp region, the alignment with the a-direction decreases at larger volumes and so does the thermal conductivity. Consequently, the opposite trend is found for the c-direction. For the one-dimensional Al(OH) chains (i.e. the b-direction), the heat conduction is also observed to be worse than for the a-direction.
The trends in the np region are less intuitive. The thermal conductivity along the a-direction generally increases when the volume decreases (Fig. 7). At the lowest volumes, the organic linkers are nearly parallel with this direction due to the knee-cap configuration of MIL-53(Al), and the dominant thermal resistance along this direction will reside in the organic–inorganic connections in between connecting linkers (Fig. 8). A very strong increase in the thermal conductivity along the c-direction is absent, which shows that although the organic linkers are stacked very closely, not a lot of heat is transported along the pore vacuum.
 | ||
| Fig. 8 Schematic illustration of the energy carriers along the a-, b- and c-directions. | ||
The thermal conductivity in the b-direction strongly increases at the lowest volumes. However, note that the thermal conductivity in a certain direction is defined as the ability of a material with unit length thickness along this direction to transfer heat per unit of cross-sectional surface area in the perpendicular direction (Fig. S5†). In MIL-53(Al), the unit cell surface area perpendicular to the b-direction increases substantially during the phase transition towards increasing volume, while the lattice parameter b does not, as schematically illustrated in Fig. 9. Hence, the thermal conductivity along this direction follows to some extent the trend in the inverse of the area as a function of the volume (Fig. 9). In other words, per unit of surface area, fewer conducting Al(OH) chains are present, causing the thermal conductivity to decrease. The same reasoning holds for the number of stacked organic linkers in the surface area perpendicular to the a-direction.
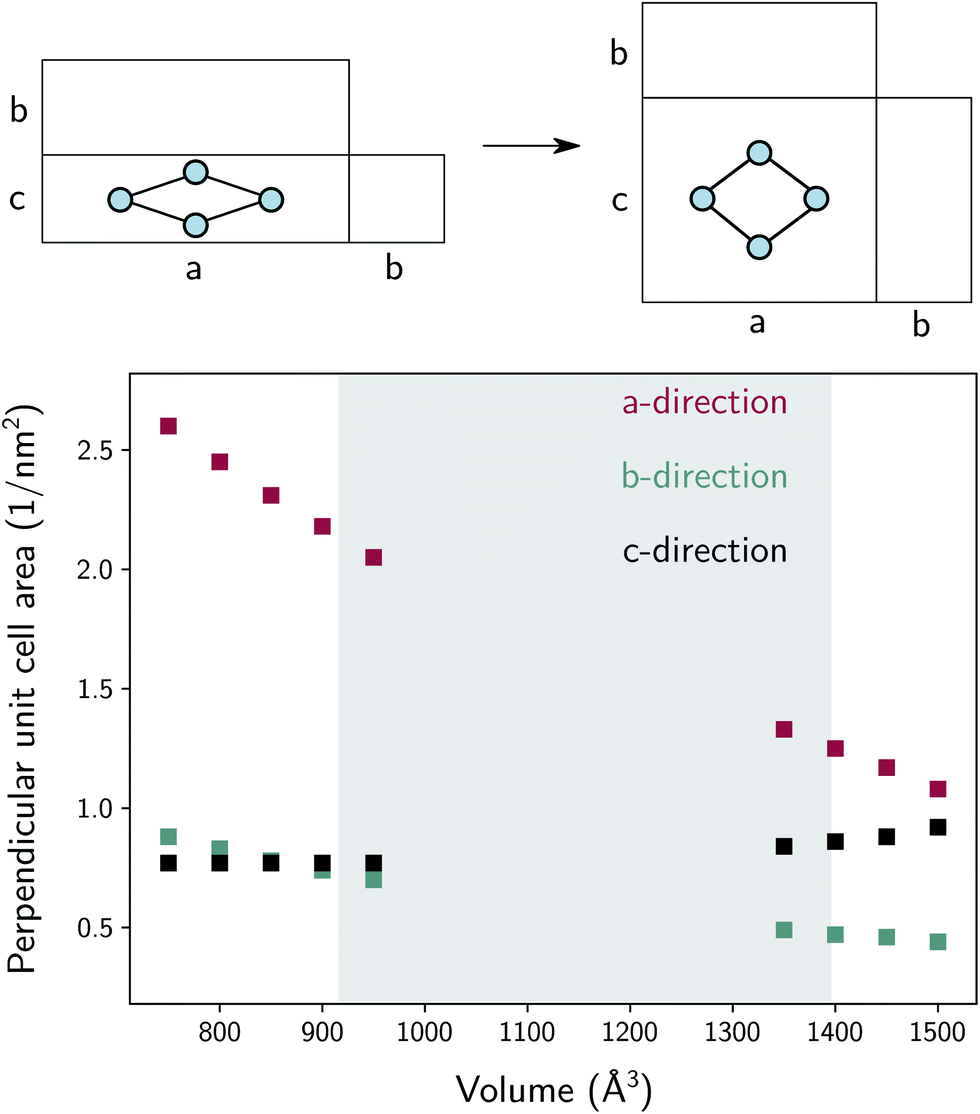 | ||
| Fig. 9 Inverse of the cross-sectional area in the unit cell perpendicular to the indicated lattice direction as a function of the volume. A schematic representation of the cross-sectional area in the three directions is shown on top. | ||
Furthermore, the sharp increase in the thermal conductivity along the b-direction at the lowest volumes is believed to be connected to another phenomenon. As the interchain thermal resistance is heavily reduced by both the close approach of the Al(OH) chains (in the c-direction) and the almost parallel stacking of the organic linkers, the heat dissipated along the direction of the Al(OH) chain can spread more easily over multiple chains. This might also explain why the volume dependence of the thermal conductivity in the a- and b-directions roughly follows the same trend.
| lp | np | |
|---|---|---|
| κ aa (W m−1 K−1) | 2.06 ± 0.02 | 5.16 ± 0.08 |
| κ bb (W m−1 K−1) | 1.32 ± 0.02 | 3.22 ± 0.06 |
| κ cc (W m−1 K−1) | 1.28 ± 0.02 | 1.16 ± 0.02 |
| ρ (kg m−3) | 922 | 1727 |
| κ absaa (nW K−1) | 1.2 | 1.0 |
| κ absbb (nW K−1) | 4.4 | 5.8 |
| κ abscc (nW K−1) | 1.0 | 2.4 |
| MOF | κ (W m−1 K−1) | |
|---|---|---|
| Experiment | Simulations | |
| Al-soc-MOF-1 | — | 0.22 (ref. 36) |
| HKUST-1 | 0.27–0.39 (ref. 25 and 27) | 0.45–0.58 (ref. 25 and 36) |
| IRMOF-10 | — | 0.02–0.09 (ref. 36 and 109) |
| IRMOF-16 | — | 0.07 (ref. 36) |
| MIL-160 | 0.06 (ref. 28) | — |
| MOF-5 | 0.34 (ref. 24) | 0.12–0.31 (ref. 25, 29, 36 and 109) |
| MOF-177 | — | 0.08–0.09 (ref. 36) |
| MOF-505 | — | 1.16–1.26 (ref. 36) |
| UiO-66 | 0.11 (ref. 27) | 0.87 (ref. 36) |
| UiO-67 | 0.19 (ref. 27) | — |
| UMCM-1 | — | 0.07–0.13 (ref. 36) |
| ZIF-8 | 0.33 (ref. 26) | 0.17 (ref. 30 and 110) |
Although these values for the specific thermal conductivity seem to imply that heat is conducted much easier in the np phase than in the lp phase, a fair comparison should also take the difference in cell shape of the two phases into account. For practical MOF applications, the required amount of material will play an important role and is expected to remain constant throughout the operation of the device. Therefore, it is instructive to determine the absolute thermal conductivity κabs, which is an extensive property (with units W K−1):
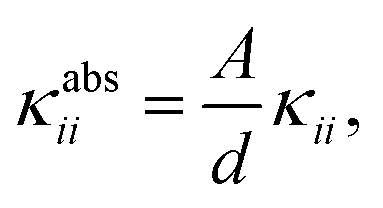 | (6) |
A possible strategy to exploit the anisotropy of the thermal conductivity of MOFs was suggested by Wilmer et al.33 Given that structures with large channels are known to be beneficial for rapid gas adsorption, but also give rise to ultra-low thermal conductivities, MOFs could be designed to rapidly dissipate heat along the channel direction to remedy the problem of heat conduction. For MIL-53(Al), the heat transfer per unit cell was shown to behave anisotropically (Table 2), with heat dissipating more easily along the one-dimensional aluminium-oxide chains following the b-direction. This result is in line with the good thermal conductivity of aluminium oxide (Al2O3, κ ≈ 30 W m−1 K−1).
 | (7) |
It is a measure of the correlation between two spectra  and
and  in a certain frequency range. We determined this similarity index for all chemically bonded atom pairs by computing the overlap between the VDOS of both atoms in the frequency range 0–4000 cm−1 and in the low-frequency range 0–700 cm−1. Using this approach, a large overlap in the VDOS along the aluminium-oxide chain is found, as displayed in Fig. 10. This similarity index is especially large when compared to the similarity indices of the Al–O2, O2–C1, and C1–C2 bonds along which the heat needs to transfer for the a- and c-directions (Fig. 8), so that the similarity index corroborates the absolute thermal conductivity results. Finally, the results in Fig. 10 also show that the overlap is systematically larger in the np phase, which again agrees well with Table 2.
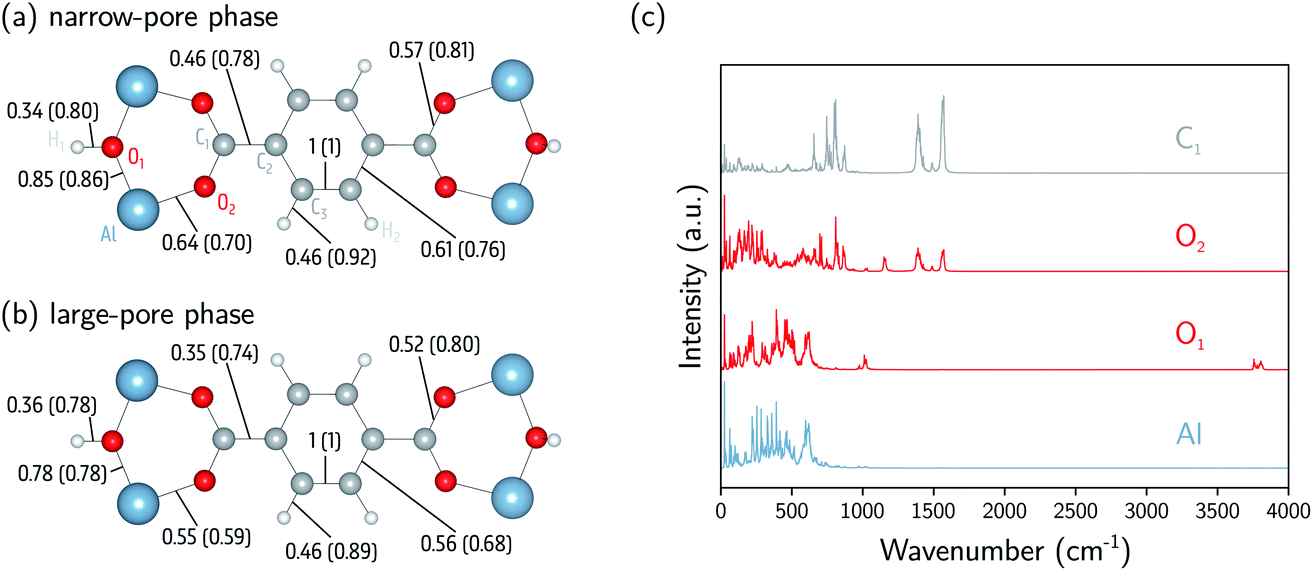 | ||
| Fig. 10 Analysis of the atomic vibrational density of states (VDOS). (a) The similarity index calculated at 0–4000 cm−1 (0–700 cm−1) for the np phase (800 Å3). (b) The similarity index calculated at 0–4000 cm−1 (0–700 cm−1) for the lp phase (1500 Å3). (c) The atomic VDOS for Al, O1, O2, and C1. The atomic VDOS for other atoms is reported in the ESI (Fig. S9 and S10†). The intensities have been rescaled by dividing the complete spectrum by the square root of the integral of the square of the spectrum. | ||
4 Conclusions
Within the past few years, MOFs have gradually gained a more established reputation as promising solid adsorbents in the field of water-adsorption applications. To obtain a more fundamental understanding of their potential performance and shed light on current barriers, such as the slow heat transfer of MOFs, molecular simulations can be performed to theoretically investigate the framework properties and the interactions with water. In this work, the flexible MIL-53(Al) framework was analysed, focusing on the influence of water on the phase stability and the structural properties, as well as on the thermal conductivity of the framework.To assess the flexibility of the framework, an adequate modelling technique is required, such as the thermodynamic protocol in ref. 46, which allows the construction of Helmholtz free energy profiles to identify the (meta)stable states of the system as a function of the loading. Several studies have already highlighted the importance of the weak dispersion forces36,99 and structural disorder53,100 in the description of the flexibility of MIL-53(Al), but the quantum nature of the atoms has not yet been taken into account. However, as evidenced by this study of MIL-53(Al) with and without water in the pores, nuclear quantum effects do not seem to play a major role in the relative phase stability of the material. Both classical and path integral molecular dynamics simulations indicate that the volume of the np phase continuously increases with the water loading until the lp phase becomes the only stable state at a very high loading. For all the considered water loadings, the adsorbed molecules are observed to engage in ordered hydrogen bonded structures resembling 1D water wires along the aluminium-oxide chains for volume states located around the equilibrium volume. If the pore volume, on the contrary, substantially deviates from the equilibrium volume, the water molecules spread more freely inside the pores, although they remain predominantly located near the edges of the pores due to their interaction with the framework.
Furthermore, the thermal conductivity of the framework was also calculated in the three crystal directions as a function of the volume, which allows us to compare the thermal performance of the np and lp phases. To capture the influence of long-range spatial disorder present in experimental samples, new simulation strategies will have to be developed. In this work, the thermal conductivity of MIL-53(Al) was found to be strongly linked to the geometry of the unit cell, and in absolute numbers the heat transfer in the np phase was shown to be more efficient. The aluminium-oxide chain was thereby identified as the best conducting fragment of the material, as confirmed by the overlap in the vibrational density of states of the aluminium and oxygen atoms.
These findings clearly demonstrate that molecular simulations can offer useful insights into the fundamental properties relevant for water-adsorption applications. Promising water-adsorption materials pointed out by experimental studies will be further explored in future studies.
Conflicts of interest
There are no conflicts to declare.Note added after first publication
This article replaces the version published on 29 October 2020, which contained a formatting error in section 2.3 and an error in eqn (3).Acknowledgements
This work is supported by the Fund for Scientific Research Flanders (FWO, grant no. 11D2220N). V. V. S. acknowledges funding from the European Union’s Horizon 2020 Research and Innovation Program (consolidator ERC grant agreement No. 647755 - DYNPOR (2015–2020)). The work is furthermore supported by the Research Board of Ghent University (BOF). The computational resources and services used in this work were provided by VSC (Flemish Supercomputer Center), funded by Ghent University, FWO, and the Flemish Government department EWI.Notes and references
- A. Schoedel, Z. Ji and O. M. Yaghi, Nat. Energy, 2016, 1, 16034 CAS.
- Y. He, F. Chen, B. Li, G. Qian, W. Zhou and B. Chen, Coord. Chem. Rev., 2018, 373, 167–198 CAS.
- H. Li, K. Wang, Y. Sun, C. T. Lollar, J. Li and H.-C. Zhou, Mater. Today, 2018, 21, 108–121 CAS.
- M. Ding, R. W. Flaig, H.-L. Jiang and O. M. Yaghi, Chem. Soc. Rev., 2019, 48, 2783–2828 CAS.
- N. C. Burtch, H. Jasuja and K. S. Walton, Chem. Rev., 2014, 114, 10575–10612 CAS.
- J. Carnivet, A. Fateeva, Y. Guo, B. Coasne and D. Farrusseng, Chem. Soc. Rev., 2014, 43, 5594–5617 Search PubMed.
- H. Furukawa, F. Gándara, Y.-B. Zhang, J. Jiang, W. L. Queen, M. R. Hudson and O. M. Yaghi, J. Am. Chem. Soc., 2014, 136, 4369–4381 CAS.
- C. Wang, X. Liu, N. K. Demir, P. J. Chen and K. Li, Chem. Soc. Rev., 2016, 45, 5107–5134 CAS.
- J. Duan, W. Jin and S. Kitagawa, Coord. Chem. Rev., 2017, 332, 48–74 CAS.
- J. Ehrenmann, S. K. Henninger and C. Janiak, Chem.–Eur. J., 2011, 2011, 471–474 Search PubMed.
- F. Jeremias, D. Fröhlich, C. Janiak and S. K. Henninger, RSC Adv., 2014, 4, 24076–24082 Search PubMed.
- A. Cadiau, J. S. Lee, D. B. Borges, P. Fabry, T. Devic, M. T. Wharmby, C. Martineau, D. Foucher, F. Taulelle, C.-H. Jun, Y. K. Hwang, N. Stock, M. F. De Lange, F. Kapteijn, J. Gascon, G. Maurin, J.-S. Chang and C. Serre, Adv. Mater., 2015, 27, 4775–4780 CAS.
- M. F. de Lange, K. J. F. M. Verouden, T. J. H. Vlugt, J. Gascon and F. Kapteijn, Chem. Rev., 2015, 115, 12205–12250 CAS.
- S. Wang, J. S. Lee, M. Wahiduzzaman, J. Park, M. Muschi, C. Martineau-Corcos, A. Tissot, K. H. Cho, J. Marrot, W. Shepard, G. Maurin, J.-S. Chang and C. Serre, Nat. Energy, 2018, 3, 985–993 CAS.
- D. Lenzen, J. Zhao, S.-J. Ernst, M. Wahiduzzaman, A. K. Inge, D. Fröhlich, H. Xu, H.-J. Bart, C. Janiak, S. Henninger, G. Maurin, X. Zou and N. Stock, Nat. Commun., 2019, 10, 3025 Search PubMed.
- H. Kim, S. Yang, S. R. Rao, S. Narayanan, E. A. Kapustin, H. Furukawa, A. S. Umans, O. M. Yaghi and E. N. Wang, Science, 2017, 356, 430–434 CAS.
- A. J. Rieth, S. Yang, E. N. Wang and M. Dinca, ACS Cent. Sci., 2017, 3, 668–672 CAS.
- M. J. Kalmutzki, C. S. Diercks and O. M. Yaghi, Adv. Mater., 2018, 30, 1704304 Search PubMed.
- N. Hanikel, M. S. Prévot, F. Fathieh, E. A. Kapustin, H. Lyu, H. Wang, N. J. Diercks, G. T. Glover and O. M. Yaghi, ACS Cent. Sci., 2019, 5, 1699–1706 CAS.
- J. J. Purewal, D. Liu, J. Yang, A. Sudik, D. J. Siegel, S. Maurer and U. Müller, Int. J. Hydrogen Energy, 2012, 37, 2723–2727 CAS.
- J. Purewal, D. Liu, A. Sudik, M. Veenstra, J. Yang, S. Maurer, U. Müller and D. J. Siegel, J. Phys. Chem. C, 2012, 116, 20199–20212 CAS.
- D. Liu, J. J. Purewal, J. Yang, A. Sudik, S. Maurer, U. Müller, J. Ni and D. J. Siegel, Int. J. Hydrogen Energy, 2012, 37, 6109–6117 CAS.
- Y. Ming, J. Purewal, D. Liu, A. Sudik, C. Xu, J. Yang, M. Veenstra, K. Rhodes, R. Soltis, J. Warner, M. Gaab, U. Müller and D. J. Siegel, Microporous Mesoporous Mater., 2014, 185, 235–244 CAS.
- B. L. Huang, Z. Ni, A. Millward, A. J. H. McGaughey, C. Uher, M. Kaviany and O. M. Yaghi, Int. J. Heat Mass Transfer, 2007, 50, 405–411 CAS.
- K. J. Erickson, F. Léonard, V. Stavila, M. E. Foster, C. D. Spataru, R. E. Jones, B. M. Foley, P. E. Hopkins, M. D. Allendorf and A. A. Talin, Adv. Mater., 2015, 27, 3453–3459 CAS.
- B. Cui, C. O. Audu, Y. Liao, S. T. Nguyen, O. K. Farha, J. T. Hupp and M. Grayson, ACS Appl. Mater. Interfaces, 2017, 9, 28139–28143 CAS.
- J. Huang, X. Xia, X. Hu, S. Li and K. Liu, Int. J. Heat Mass Transfer, 2019, 138, 11–16 CAS.
- S. Cui, A. Marandi, G. Lebourleux, M. Thimon, M. Bourdon, C. Chen, M. I. Severino, V. Steggles, F. Nouar and C. Serre, Appl. Therm. Eng., 2019, 161, 114135 CAS.
- B. L. Huang, A. J. H. McGaughey and M. Kaviany, Int. J. Heat Mass Transfer, 2007, 50, 393–404 CAS.
- X. Zhang and J. Jiang, J. Phys. Chem. C, 2013, 117, 18441–18447 CAS.
- X. Wang, R. Guo, D. Xu, J. Chung, M. Kaviany and B. Huang, J. Phys. Chem. C, 2015, 119, 26000–26008 CAS.
- H. Babaei and C. E. Wilmer, Phys. Rev. Lett., 2016, 116, 025902 Search PubMed.
- H. Babaei, A. J. H. McGaughey and C. E. Wilmer, Chem. Sci., 2017, 8, 583–589 CAS.
- H. Babaei, A. J. H. McGaughey and C. E. Wilmer, ACS Appl. Mater. Interfaces, 2018, 10, 2400–2406 CAS.
- K. B. Sezginel, P. A. Asinger, H. Babaei and C. E. Wilmer, Chem. Mater., 2018, 30, 2281–2286 CAS.
- J. Wieme, S. Vandenbrande, A. Lamaire, V. Kapil, L. Vanduyfhuys and V. Van Speybroeck, ACS Appl. Mater. Interfaces, 2019, 11, 38697–38707 CAS.
- T. Loiseau, C. Serre, C. Huguenard, G. Fink, F. Taulelle, M. Henry, T. Bataille and G. Férey, Chem.–Eur. J., 2004, 10, 1373–1382 CAS.
- A. U. Ortiz, A. Boutin, A. H. Fuchs and F.-X. Coudert, Phys. Rev. Lett., 2012, 109, 195502 Search PubMed.
- C. Nanthamathee, S. Ling, B. Slater and M. P. Attfield, Chem. Mater., 2015, 27, 85–95 CAS.
- Y. Ming, H. Chi, R. Blaser, C. Xu, J. Yang, M. Veenstra, M. Gaab, U. Müller, C. Uher and D. J. Siegel, Int. J. Heat Mass Transfer, 2015, 82, 250–258 Search PubMed.
- P. D. Shima and J. Philip, J. Phys. Chem. C, 2011, 115, 20097–20104 CAS.
- G. Zhu, J. Liu, Q. Zheng, R. Zhang, D. Li, D. Banerjee and D. G. Cahill, Nat. Commun., 2016, 7, 13211 CAS.
- J. Shin, J. Sung, M. Kang, X. Xie, B. Lee, K. M. Lee, T. J. White, C. Leal, N. R. Sottos, P. V. Braun and D. G. Cahill, Proc. Natl. Acad. Sci. U. S. A., 2019, 116, 5973–5978 CAS.
- S. Horike, S. Shimomura and S. Kitagawa, Nat. Chem., 2009, 1, 695–704 CAS.
- A. Schneemann, I. Schwedler, I. Senkovska, S. Kaskel and R. A. Fischer, Chem. Soc. Rev., 2014, 43, 6062–6096 CAS.
- L. Vanduyfhuys, S. M. J. Rogge, J. Wieme, S. Vandenbrande, G. Maurin, M. Waroquier and V. Van Speybroeck, Nat. Commun., 2018, 9, 204 CAS.
- J. H. Lee, S. Jeoung, Y. G. Chung and H. R. Moon, Coord. Chem. Rev., 2019, 389, 161–188 CAS.
- J. A. Mason, J. Oktawiec, M. K. Taylor, M. R. Hudson, J. Rodriguez, J. E. Bachman, M. I. Gonzalez, A. Cervellino, A. Guagliardi, C. M. Brown, P. L. Llewellyn, N. Masciocchi and J. R. Long, Nature, 2015, 527, 357–361 CAS.
- S. Hiraide, H. Tanaka, N. Ishikawa and M. T. Miyahara, ACS Appl. Mater. Interfaces, 2017, 9, 41066–41077 CAS.
- J. S. Grosch and F. Paesani, J. Am. Chem. Soc., 2012, 134, 4207–4215 CAS.
- F.-X. Coudert, A. U. Ortiz, V. Haigis, D. Bousquet, A. H. Fuchs, A. Ballandras, G. Weber, I. Bezverkhyy, N. Geoffroy, J.-P. Bellat, G. Ortiz, G. Chaplais, J. Patarin and A. Boutin, J. Phys. Chem. C, 2014, 118, 5397–5405 CAS.
- J. Wieme, K. Lejaeghere, G. Kresse and V. Van Speybroeck, Nat. Commun., 2018, 9, 4899 CAS.
- S. M. J. Rogge, M. Waroquier and V. Van Speybroeck, Nat. Commun., 2019, 10, 4842 Search PubMed.
- T. M. Markland and M. Ceriotti, Nat. Rev. Chem., 2018, 2, 0109 CAS.
- M. Ceriotti, W. Fang, P. G. Kusalik, R. H. McKenzie, A. Michealides, M. A. Morales and T. E. Markland, Chem. Rev., 2016, 116, 7529 CAS.
- I. J. Kang, N. A. Khan, E. Haque and S. H. Jhung, Chem.–Eur. J., 2011, 17, 6437–6442 CAS.
- I. Bezverkhyy, G. Ortiz, G. Chaplais, C. Marichal, G. Weber and J.-P. Bellat, Microporous Mesoporous Mater., 2014, 183, 156–161 CAS.
- F. Paesani, Mol. Simul., 2012, 38, 631–641 CAS.
- J. Cirera, J. C. Sung, P. B. Howland and F. Paesani, J. Chem. Phys., 2012, 137, 054704 Search PubMed.
- F. Paesani, J. Phys. Chem. C, 2013, 117, 19508–19516 CAS.
- J. M. Salazar, G. Weber, J. M. Simon, I. Bezverkhyy and J. P. Bellat, J. Chem. Phys., 2015, 142, 124702 CAS.
- D. D. Borges, R. Semino, S. Devautour-Vinot, H. Jobic, F. Paesani and G. Maurin, Chem. Mater., 2017, 29, 1569–1576 CAS.
- A. J. Rieth, K. M. Hunter, M. Dinca and F. Paesani, Nat. Commun., 2019, 10, 4771 Search PubMed.
- T. Ichii, T. Arikawa, K. Omoto, N. Hosono, H. Sato, S. Kitagawa and K. Tanaka, Commun. Chem., 2020, 3, 16 CAS.
- N. C. Burtch, I. M. Walton, J. T. Hungerford, C. R. Morelock, Y. Jiao, J. Heinen, Y.-S. Chen, A. A. Yakovenko, W. Xu, D. Dubbeldam and K. S. Walton, Nat. Chem., 2020, 12, 186–192 CAS.
- L. Vanduyfhuys, S. Vandenbrande, T. Verstraelen, R. Schmid, M. Waroquier and V. Van Speybroeck, J. Comput. Chem., 2015, 36, 1015–1027 CAS.
- L. Vanduyfhuys, S. Vandenbrande, J. Wieme, M. Waroquier, T. Verstraelen and V. Van Speybroeck, J. Comput. Chem., 2018, 39, 999–1011 CAS.
- J. P. Perdew, K. Burke and M. Ernzerhof, Phys. Rev. Lett., 1996, 77, 3865–3868 CAS.
- S. Grimme, J. Antony, S. Ehrlich and H. Krieg, J. Chem. Phys., 2010, 132, 154104 Search PubMed.
- S. Grimme, S. Ehrlich and L. Goerigk, J. Comput. Chem., 2011, 32, 1456–1465 CAS.
- T. Verstraelen, S. Vandenbrande, F. Heidar-Zadeh, L. Vanduyfhuys, V. Van Speybroeck, M. Waroquier and P. W. Ayers, J. Chem. Theory Comput., 2016, 12, 3894–3912 CAS.
- J. H. Lii and N. L. Allinger, J. Am. Chem. Soc., 1989, 111, 8576–8582 CAS.
- H. Sun, J. Phys. Chem. B, 1998, 102, 7338–7364 CAS.
- S. Habershon, T. E. Markland and D. E. Manolopoulos, J. Chem. Phys., 2009, 131, 024501 CrossRef.
- J. L. F. Abascal and C. Vega, J. Chem. Phys., 2005, 123, 234505 CrossRef CAS.
- T. Verstraelen, L. Vanduyfhuys, S. Vandenbrande and S. M. J. Rogge, Yaff 1.4.2, 2017, http://molmod.github.io/yaff/index.html Search PubMed.
- W. G. Hoover, Phys. Rev. A: At., Mol., Opt. Phys., 1985, 31, 1695–1697 CrossRef.
- S. Nosé, Mol. Phys., 1986, 57, 187–191 CrossRef.
- G. J. Martyna, M. L. Klein and M. E. Tuckerman, J. Chem. Phys., 1992, 97, 2635–2643 CrossRef.
- G. J. Martyna, D. J. Tobias and M. L. Klein, J. Chem. Phys., 1994, 101, 4177–4189 CrossRef CAS.
- G. J. Martyna, M. E. Tuckerman, D. J. Tobias and M. L. Klein, Mol. Phys., 1996, 87, 1117–1157 CrossRef CAS.
- A. Lamaire, J. Wieme, S. M. J. Rogge, M. Waroquier and V. Van Speybroeck, J. Chem. Phys., 2019, 150, 094503 CrossRef.
- V. Kapil, J. Wieme, S. Vandenbrande, A. Lamaire, V. Van Speybroeck and M. Ceriotti, J. Chem. Theory Comput., 2019, 15, 3237–3249 CrossRef CAS.
- M. Ceriotti, J. More and D. E. Manolopoulos, Comput. Phys. Commun., 2014, 185, 1019–1026 CrossRef CAS.
- V. Kapil, M. Rossi, O. Marsalek, R. Petraglia, Y. Litman, T. Spura, B. Cheng, A. Cuzzocrea, R. H. Meißner, D. M. Wilkins, P. Juda, S. P. Bienvenue, W. Fang, J. Kessler, I. Poltavsky, S. Vandenbrande, J. Wieme, C. Corminboeuf, T. D. Kühne, D. E. Manolopoulos, T. E. Markland, J. O. Richardson, A. Tkatchenko, G. A. Tribello, V. Van Speybroeck and M. Ceriotti, Comput. Phys. Commun., 2019, 236, 214–223 CrossRef CAS.
- S. Plimpton, J. Comput. Phys., 1995, 117, 1–19 CrossRef CAS.
- M. Ceriotti, M. Parrinello, T. E. Markland and D. E. Manolopoulos, J. Chem. Phys., 2010, 133, 124104 CrossRef.
- G. Bussi and M. Parrinello, Phys. Rev. E: Stat., Nonlinear, Soft Matter Phys., 2007, 75, 56707 CrossRef.
- P. Raiteri, J. D. Gale and G. Bussi, J. Phys.: Condens. Matter, 2011, 23, 334213 CrossRef.
- B. Leimkuhler and C. Matthews, J. Chem. Phys., 2013, 138, 174102 CrossRef.
- M. S. Green, J. Chem. Phys., 1954, 22, 398–413 CrossRef CAS.
- R. Kubo, J. Phys. Soc. Jpn., 1957, 12, 570–586 CrossRef.
- P. K. Schelling, S. R. Phillpot and P. Keblinski, Phys. Rev. B: Condens. Matter Mater. Phys., 2002, 65, 144306 CrossRef.
- J. Chen, G. Zhang and B. Li, Phys. Lett. A, 2010, 374, 2392–2396 CrossRef CAS.
- L. de Sousa Oliveira and A. P. Greaney, Phys. Rev. E, 2017, 95, 023308 CrossRef.
- A. J. H. McGaughey and M. Kaviany, Int. J. Heat Mass Transfer, 2004, 47, 1799–1816 CrossRef CAS.
- A. E. J. Hoffman, L. Vanduyfhuys, I. Nevjestic, J. Wieme, S. M. J. Rogge, H. Depauw, P. Van Der Voort, H. Vrielinck and V. Van Speybroeck, J. Phys. Chem. C, 2018, 122, 2734–2746 CrossRef CAS.
- A. E. J. Hoffman, J. Wieme, S. M. J. Rogge, L. Vanduyfhuys and V. Van Speybroeck, Z. Kristallogr. - Cryst. Mater., 2019, 234, 529–545 CAS.
- A. M. Walker, B. Civalleri, B. Slater, C. Mellot-Draznieks, F. Corá, C. M. Zicovich-Wilson, G. Román-Pérez, J. M. Soler and J. D. Gale, Angew. Chem., Int. Ed., 2010, 49, 7501–7503 CrossRef CAS.
- J. Keupp and R. Schmid, Adv. Theory Simul., 2019, 2, 1900117 CrossRef CAS.
- F. Salles, S. Bourrelly, H. Jobic, T. Devic, V. Guillerm, P. LLewellyn, C. Serre, G. Férey and G. Maurin, J. Phys. Chem. C, 2011, 115, 10764–10776 CrossRef CAS.
- N. Guillou, F. Millange and R. I. Walton, Chem. Commun., 2011, 47, 713–715 RSC.
- V. Haigis, F.-X. Coudert, R. Vuilleurmier and A. Boutin, Phys. Chem. Chem. Phys., 2013, 15, 19049–19056 RSC.
- G. R. Medders and F. Paesani, J. Phys. Chem. Lett., 2014, 5, 2897–2902 CrossRef CAS.
- V. Haigis, F.-X. Coudert, R. Vuilleumier, A. Boutin and A. H. Fuchs, J. Phys. Chem. Lett., 2015, 6, 4365–4370 CrossRef CAS.
- G. Weber, I. Bezverkhyy, J.-P. Bellat, A. Ballandras, G. Ortiz, G. Chaplais, J. Patarin, F.-X. Coudert, A. H. Fuchs and A. Boutin, Microporous Mesoporous Mater., 2016, 222, 145–152 CrossRef CAS.
- L. R. Parent, H. C. Pham, J. P. Patterson, M. S. J. Denny, S. M. Cohen, N. C. Gianneschi and F. Paesani, J. Am. Chem. Soc., 2017, 139, 13973–13976 CrossRef CAS.
- E. Cockayne, Powder Diffr., 2019, 34, 227–232 CrossRef CAS.
- L. Han, M. Budge and A. P. Greaney, Comput. Mater. Sci., 2014, 94, 292–297 CrossRef CAS.
- W. Wei, J. Huang, W. Li, H. Peng and S. Li, J. Phys. Chem. C, 2019, 123, 27369–27374 CrossRef CAS.
- S. Henke, A. Schneemann and R. A. Fischer, Adv. Funct. Mater., 2013, 23, 5990–5996 CrossRef CAS.
- E. T. Swartz and R. O. Pohl, Rev. Mod. Phys., 1989, 61, 605 CrossRef.
- M. Hu, Y. Jing and X. Zhang, Phys. Rev. B: Condens. Matter Mater. Phys., 2015, 91, 155408 CrossRef.
- A. Giri and P. E. Hopkins, Adv. Funct. Mater., 2019, 1903857 Search PubMed.
Footnotes |
| † Electronic supplementary information (ESI) available: Additional information on the force field and extra figures regarding the molecular dynamics simulations. See DOI: 10.1039/d0fd00025f |
| ‡ Both authors contributed equally to this work. |
| This journal is © The Royal Society of Chemistry 2021 |