 Open Access Article
 This Open Access Article is licensed under a
 Creative Commons Attribution 3.0 Unported Licence
The interaction of CO with a copper(II) chloride oxy-chlorination catalyst
Shaoliang
Guan
abc,
Giovanni E.
Rossi
b,
John M.
Winfield
b,
Claire
Wilson
 b,
Donald
MacLaren
d,
David J.
Morgan
ac,
Philip R.
Davies
ac,
David J.
Willock
a and
David
Lennon
*b
b,
Donald
MacLaren
d,
David J.
Morgan
ac,
Philip R.
Davies
ac,
David J.
Willock
a and
David
Lennon
*b
aCardiff Catalysis Institute, School of Chemistry, Cardiff University, Cardiff, CF10 3AT, UK
bSchool of Chemistry, University of Glasgow, Joseph Black Building, Glasgow, G12 8QQ, UK. E-mail: David.Lennon@glasgow.ac.uk; Tel: +44-141-330-4372
cHarwellXPS, Rutherford Appleton Laboratory, Research Complex at Harwell, Didcot, OX11 0FA, UK
dSchool of Physics and Astronomy, University of Glasgow, Kelvin Building, Glasgow, G12 8QQ, UK
First published on 11th February 2020
Abstract
The interaction of CO with an attapulgite-supported, KCl modified CuCl2 catalyst has previously been examined using a combination of XANES, EXAFS and DFT calculations. Exposing the catalyst to CO at elevated temperatures leads to the formation of CO2 as the only identifiable product. However, phosgene production can be induced by a catalyst pre-treatment stage, where the supported CuCl2 sample is exposed to a diluted stream of dichlorine; subsequent CO exposure at ∼643 K then leads to phosgene production. This communication describes a series of FTIR based micro-reactor measurements, coupled with characterisation measurements utilising TEM, XRD and XPS to define the nature of the catalyst at different stages of the reaction coordinate. The CuCl2 catalyst is able to support Deacon activity 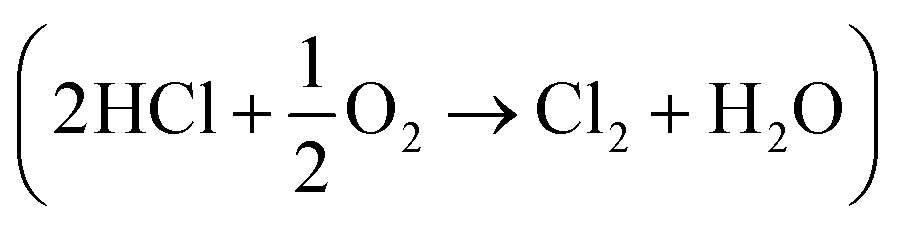 , establishing this work with the possibility of utilising the oxy-chlorination of CO to produce phosgene. Continuous dosing of CO at elevated temperatures over the chlorine pre-dosed CuCl2 catalyst shows diminishing phosgene production as a function of time-on-stream, indicating surface chlorine supply to be rate-limiting under the reaction conditions studied. A pictorial reaction scheme is proposed to account for the surface chemistry observed.
1. Introduction
Phosgene (COCl2) is a reactive and important chemical reagent that finds wide application in process operations of the chemical manufacturing industry. Typically it is produced by the reaction of carbon monoxide (CO) and dichlorine over an activated carbon catalyst (eqn (1)).1,2| CO + Cl2 ⇌ COCl2. | (1) |
| RNH2 + COCl2 → RNHC(O)Cl + HCl. | (2) |
| RNHC(O)Cl ⇌ RNCO + HCl. | (3) |
The total global production capacity for MDI in 2010 was 5 million tonnes,5 with this material often prepared on-site within an integrated chemical complex. With respect to eqn (2) and (3), it is seen that 1 mole of phosgene produces 2 moles of HCl and that there is no incorporation of chlorine into the product. All major phosgene producers have outlets for the HCl but, of course, HCl recycling processes can provide an extra degree of operational flexibility.
One way to improve the atom economy of the MDI manufacturing process is to utilise the Deacon process to facilitate the conversion of HCl to dichlorine. The Deacon reaction is traditionally associated with copper based catalysts, for which the reaction may be described in terms of the following reaction steps:6,7
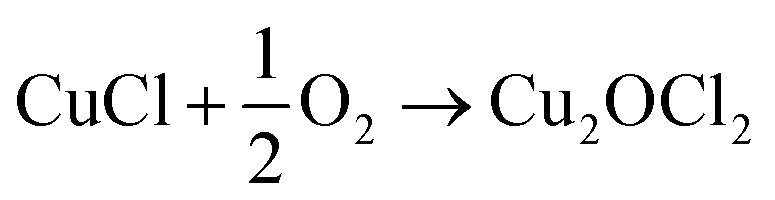
| 2CuIICl2 → 2CuICl + Cl2 | (4) |
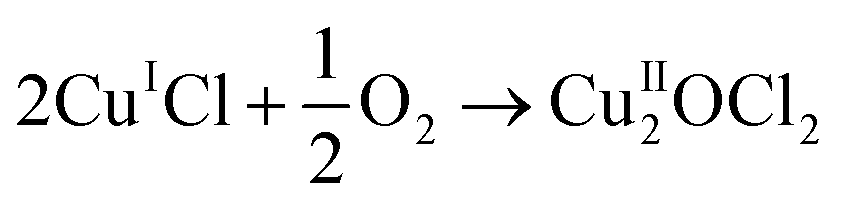 | (5) |
| CuII2OCl2 + 2HCl → 2CuIICl2 + H2O | (6) |
Overall, this leads to eqn (7),
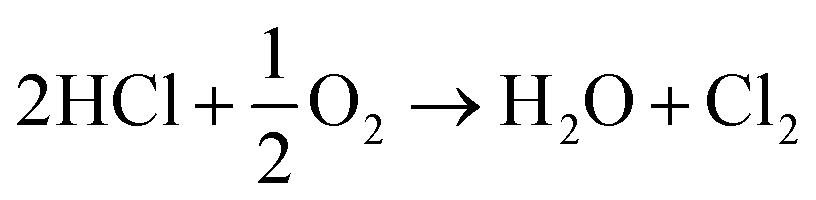 | (7) |
Eqn (4)–(6) describe how the interplay of the CuI/CuII redox couple simultaneously facilitates chlorine formation, whilst regeneration of the active CuII oxidation state is thought to occur via formation of a copper oxychloride intermediate. Chlorine recovered by this route can then be re-utilised for phosgene production (eqn (1)).
Sumitomo have developed a RuO2/TiO2 variant of the copper based catalytic system;8 this process is proven and operates now at the industrial scale. Alternatively, McFarland et al. have examined a role for chlorine production by HCl oxidation in a molten chloride salt catalyst.9 These recycling processes are not widely adopted at this time. Any new phosgene manufacturing process would have to compete with fully developed and deployed processes.
An alternative and imaginative route to work towards closing the chlorine cycle in the isocyanate manufacturing sector has been noted by Calvani, who has considered the topic of catalytic selective oxidation for a more sustainable chemical industry.10 Specifically, the potential of oxy-chlorination to play a role in phosgene production within the isocyanate sector utilising the HCl by-product is highlighted. A significant development in realising that potential has been demonstrated by a series of three papers by Zhang and co-workers who explored the oxy-chlorination of carbon monoxide to phosgene based on copper(II) chloride, with the reaction undertaken in batch mode. In the first paper, the reaction of CO over a silica-supported Cu(II)Cl2/KCl catalyst was examined for phosgene production over a range of reaction conditions. Elevated CO pressures enhanced phosgene yields.11 In the second paper, optimisation of the silica-supported copper(II) chloride substance is discussed, including an awareness of structural complexities in the CuCl2–KCl binary system under reaction conditions linked to phosgene formation.12 The third paper of this series proposes a three-step reaction cycle that overcomes issues connected with a catalyst regeneration stage, namely separation of the phosgene product from water produced in the neutralisation of Cu2OCl2 with HCl to produce CuCl2.13Eqn (8)–(10) define the three individual steps, whilst eqn (11) describes the overall chemical equation for the multi-stage process.
| CO + 2CuCl2 → COCl2 + 2CuCl | (8) |
 | (9) |
| Cu2OCl2 + 2HCl → 2CuCl2 + H2O | (10) |
 | (11) |
Thus, the work of Zhang et al. describes a protocol by which a by-product (HCl) could be utilised to produce a primary feedstock (COCl2), thereby constituting a commercially and environmentally desirable outcome of relevance to the isocyanate manufacturing sector. However, the overall process involves a number of specific interactions across a number of interfaces, for which the awareness and understanding are not fully developed. One example is the reaction of CO over CuCl2 to produce phosgene (eqn (8)).
The present work concentrates on the interaction of CO with a representative CuCl2 catalyst. As the overall concept proposed by Zhang and co-workers involves oxy-chlorination,13 the catalyst selected should facilitate oxy-chlorination. To this end, we have selected a commercial grade supported CuCl2 catalyst (10% CuCl2/8% KCl supported on attapulgite) that provides the CuII/CuI redox couple (eqn (4)–(6)). It has previously been used for the manufacture of the refrigerant feedstocks trichloroethene and tetrachloroethene.7,14 Attapulgite was selected as the support material for its suitability for large-scale fluidised bed applications, such as the oxy-chlorination of dichloroethane to produce tetrachloroethene and trichloroethene.14 The reaction is studied here in a continuous flow reactor arrangement and its catalytic behaviour is studied under laboratory conditions.
In an earlier study we used X-ray absorption near-edge spectroscopy (XANES) and extended X-ray absorption fine structure spectroscopy (EXAFS) together with DFT calculations to investigate the interaction of CO over the same 10% CuCl2/8% KCl/attapulgite catalyst under consideration here.15 Interestingly, that work showed that for temperatures <673 K, CO exposure to the dried 10% CuCl2/8% KCl/attapulgite catalyst yielded no phosgene but, instead, CO2 was selectively produced. However, a chlorine pre-treatment stage induced phosgene production at ∼643 K at the expense of CO2, leading to the suggestion that the two processes were in competition. XANES measurements established that at the elevated temperatures connected with the formation of phosgene, the base catalyst was primarily composed of Cu+ and a small amount of Cu2+. On the basis of calculated CO adsorption energies, DFT calculations indicated that a mixture of Cu+/Cu2+ was required to support CO chemisorption.15
In the present work, a micro-reactor arrangement is used to examine conditions that support phosgene production from continuous exposure of CO over the 10% CuCl2/8% KCl/attapulgite catalyst at elevated temperatures and ambient pressure. The article is constructed as follows. Firstly it reaffirms the catalyst’s Deacon credentials (eqn (7)), then it examines the product distribution on continuous CO dosing in the absence and presence of a dichlorine pre-treatment. Temporal trends are investigated and a schematic diagram is presented to account for the trends observed. In this way, the article describes aspects of the surface chemistry of a conceptually simple chemical transformation (eqn (8)), a reaction that could be important in helping to close the chlorine cycle in certain large-scale isocyanate manufacturing processes.
2. Experimental
2.1 Catalyst specification
The commercial catalyst used was copper(II) chloride supported on the clay mineral attapulgite with a promoter, KCl (Ineos ChlorVinyls Ltd., catalyst reference: Cu0951, Lot 31). The catalyst contained 10% CuCl2 and 8% KCl. The BET surface area of the catalyst was 80.8 m2 g−1 and the pore volume was 0.34 cm3 g−1. The catalyst’s performance in facilitating the formation of trichloroethene and tetrachloroethene via the chlorination of tetrachloroethane is reported elsewhere.7,142.2 Pre- and post-reaction analysis
Powder X-ray diffraction (XRD) patterns for (i) the as-received CuCl2/KCl/attapulgite catalyst and (ii) the CuCl2/K+/attapulgite catalyst after a chlorine pre-treatment stage (12.8 mmol Cl2 per g(cat)) were measured as follows. The sample was mounted on an alumina sample carrier and placed in an Anton Paar HTK-1200N oven under a trickle flow of N2 gas. The X-ray diffraction pattern was measured using a Panalytical X’Pert Pro diffractometer using Cu Kα X-radiation (λ = 1.54060 Å) from 5–75° with a step size of 0.017° 2θ at 120 s per step. In both cases a peak search was carried out using X’Pert HighScore Plus software, and the search and match run against the ICDD PDF-2 database was restricted to structures containing K, Cu, Cl and O.Transmission electron microscopy (TEM) was performed using a Tecnai T20 microscope operated with an accelerating voltage of 200 keV. Samples were ground and suspended in MeOH (Sigma Aldrich, 99.8%) before deposition on a holey carbon grid, and dried for insertion into the microscope chamber. Particle size analysis was performed using the ImageJ software using the particle size routine applied to an ensemble of >120 particles.
Diffuse reflection infrared spectroscopic (DRIFTS) measurements of the as-received catalyst were performed using a Nicolet Nexus FTIR spectrometer fitted with an MCT high D* detector employing a SpectraTech Smart diffuse reflectance cell and environmental chamber using ca. 50 mg of catalyst. The output flow from the environmental chamber was diverted to a quadrupole mass spectrometer (MKS Microvision plus, closed ion source) for analysis of water desorption during the catalyst drying stage (dried overnight at 383 K in flowing helium, 20 cm3 min−1).
X-ray photoelectron spectroscopy (XPS) of the as-received catalyst was performed using a Kratos Axis Ultra-DLD photoelectron spectrometer using a monochromatic Al Kα X-ray source and the ‘hybrid spectroscopy’ mode, resulting in an analysis area of 700 × 300 μm at a pass energy of 40 eV for high resolution scans and 160 eV for survey scans. The catalyst (0.1 g) was placed into a quartz reaction cup and mounted within a catalyst treatment cell connected to the spectrometer. Once sealed within a miniature quartz bell-jar type assembly within the treatment cell, the sample was heated to 653 K before 10% CO/Ar (1 bar) was introduced into the cell for 15 min. Once this time had elapsed, the reaction was quenched by switching to a flow of pure argon (BOC, Specpure 99.999%) and allowed to cool. The XPS data were analysed using CasaXPS v2.3.19PR1.0, with all binding energies referenced to the C(1s) peak at 284.8 eV. Curve fits were made using Gaussian line profiles.
2.3 Micro-reactor and reaction testing procedures
The micro-reactor arrangement employs FTIR and UV-visible spectroscopy to identify and quantify reagents and products and was originally constructed to investigate phosgene synthesis over activated carbon catalysts; the configuration is comprehensively described elsewhere.16 In order to undertake the measurements presented here, the apparatus was modified to additionally monitor the copper(II) chloride oxy-chlorination catalyst. Fig. 1 presents a schematic diagram of the facility. The original arrangement16 was supplemented by the addition of HCl and dioxygen lines, which enabled the oxy-chlorination capability of the CuCl2 catalyst to be examined.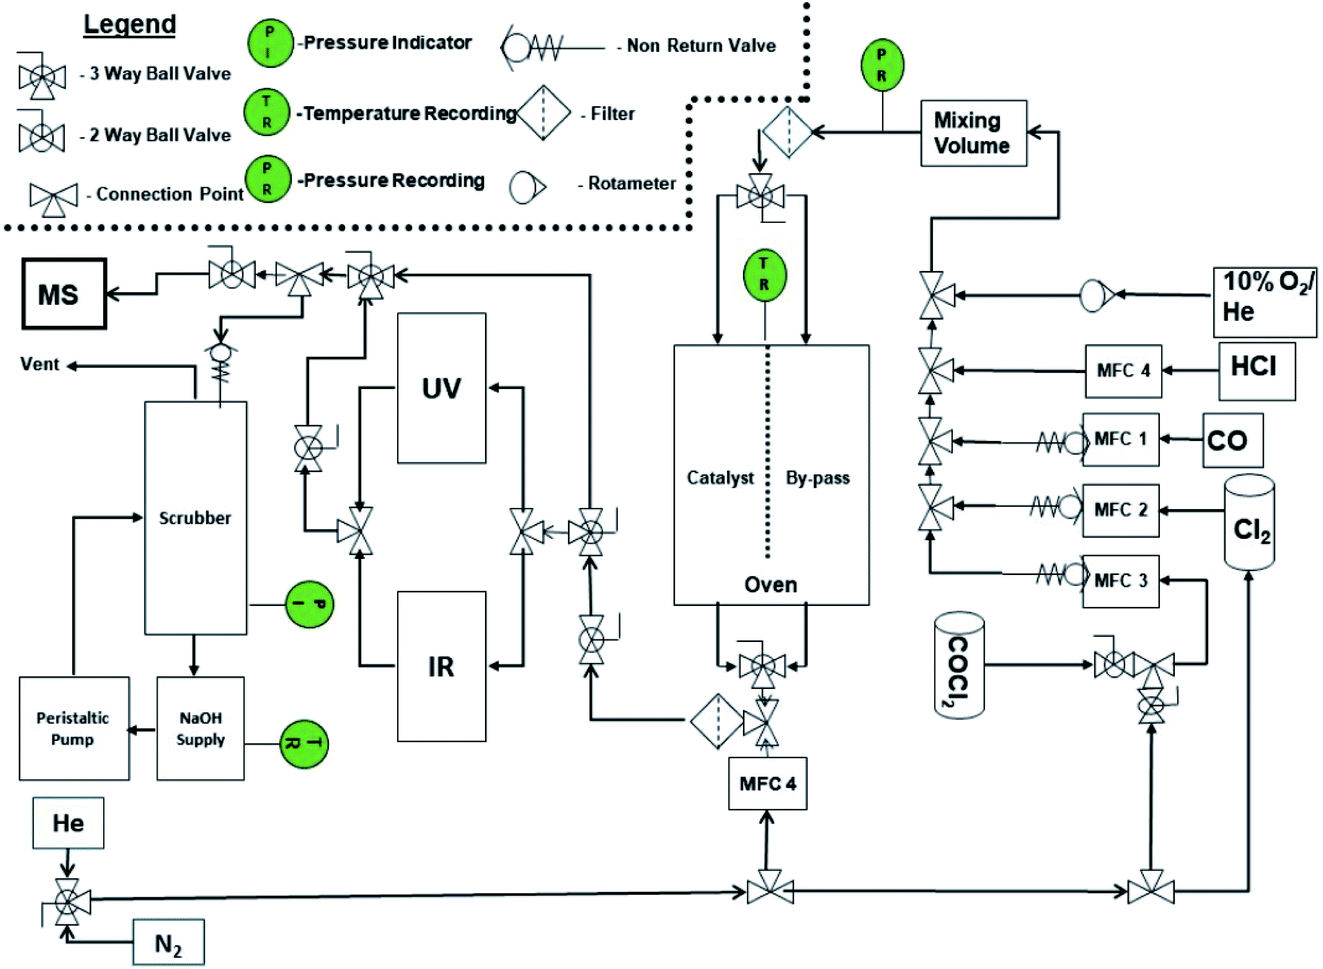 | ||
| Fig. 1 A schematic representation of the reaction test apparatus. | ||
The reactor was typically charged with 0.500 g of catalyst. This was placed on a sinter in the middle of a quartz reactor and the reactor inlet was plugged using quartz wool (Sigma). For activation, the catalyst sample was dried overnight at 383 K in flowing dinitrogen (flow rate = 20 cm3 min−1); this procedure removed physisorbed water. The total flow of the exit gas was kept constant at 159 cm3 min−1. For examination of the Deacon reaction, the flow conditions were as follows: O2/He 20 cm3 min−1, HCl 6 cm3 min−1, N2 (carrier gas) 33 cm3 min−1, and N2 (diluent post-reactor) 100 cm3 min−1. Standard flow conditions for the reaction of CO over the catalyst were as follows: CO 5 cm3 min−1, N2 (carrier gas) 54 cm3 min−1, and N2 (diluent post-reactor) 100 cm3 min−1, corresponding to a gas hourly space velocity (GHSV) of 8429 h−1. The initial flow rate (A0) was determined by passing the gas flow over a by-pass line contained within the oven that contained ground quartz (250–500 μm) of comparable volume to the reactor containing the catalyst. Errors associated with the catalytic testing measurements are considered in Section 3.2.
In some cases, Cl2 treatment of the catalyst prior to the reaction was conducted at 653 K. The flow conditions were as follows: Cl2 6 cm3 min−1, N2 (carrier gas) 53 cm3 min−1, and N2 (diluent post-reactor) 100 cm3 min−1. Dichlorine pre-treatment doses are presented as a cumulative exposure (units = mmol Cl2 per g(cat)), where the exposure time determines the overall dose. At the end of the exposure time the dichlorine was switched off and the catalyst was purged with dinitrogen for approximately 20 min. The catalyst temperature was then switched to the designated reaction temperature and the specific reactant gas flow was applied.
3. Results
3.1 Catalyst characterisation
Fig. 2(a) and (b) show respectively low and high magnification TEM images of the CuCl2/KCl/attapulgite catalyst supported by holey carbon. The attapulgite adopts a fibrous morphology and the darker spots decorating the fibres and dispersed onto the carbon support are consistent with discrete CuCl2 particles. A series of images obtained at the same magnification used in Fig. 2(b) was used to produce the particle size histogram shown in Fig. 2(c), which shows a relatively broad particle size distribution centred around 7 nm.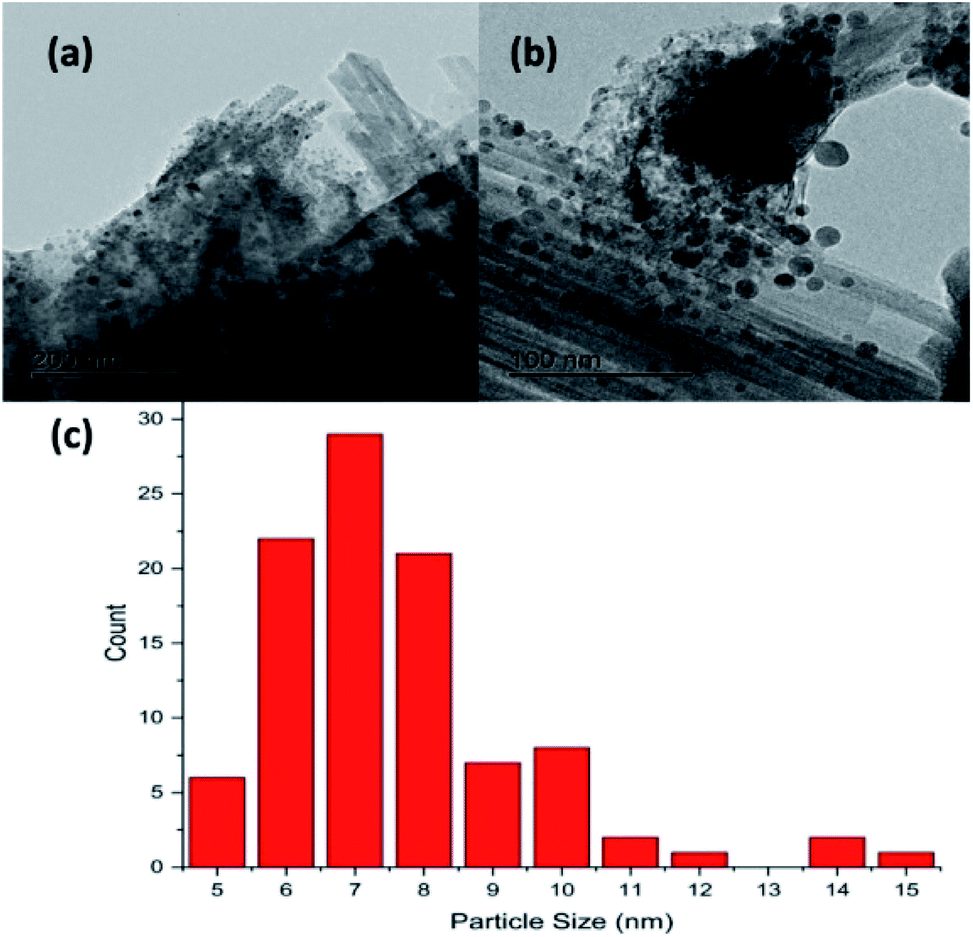 | ||
| Fig. 2 Transmission electron micrographs of the as-received CuCl2/KCl/attapulgite catalyst: (a) scale bar = 200 nm, (b) scale bar = 100 nm. (c) TEM derived particle size distribution of the CuCl2 particles. | ||
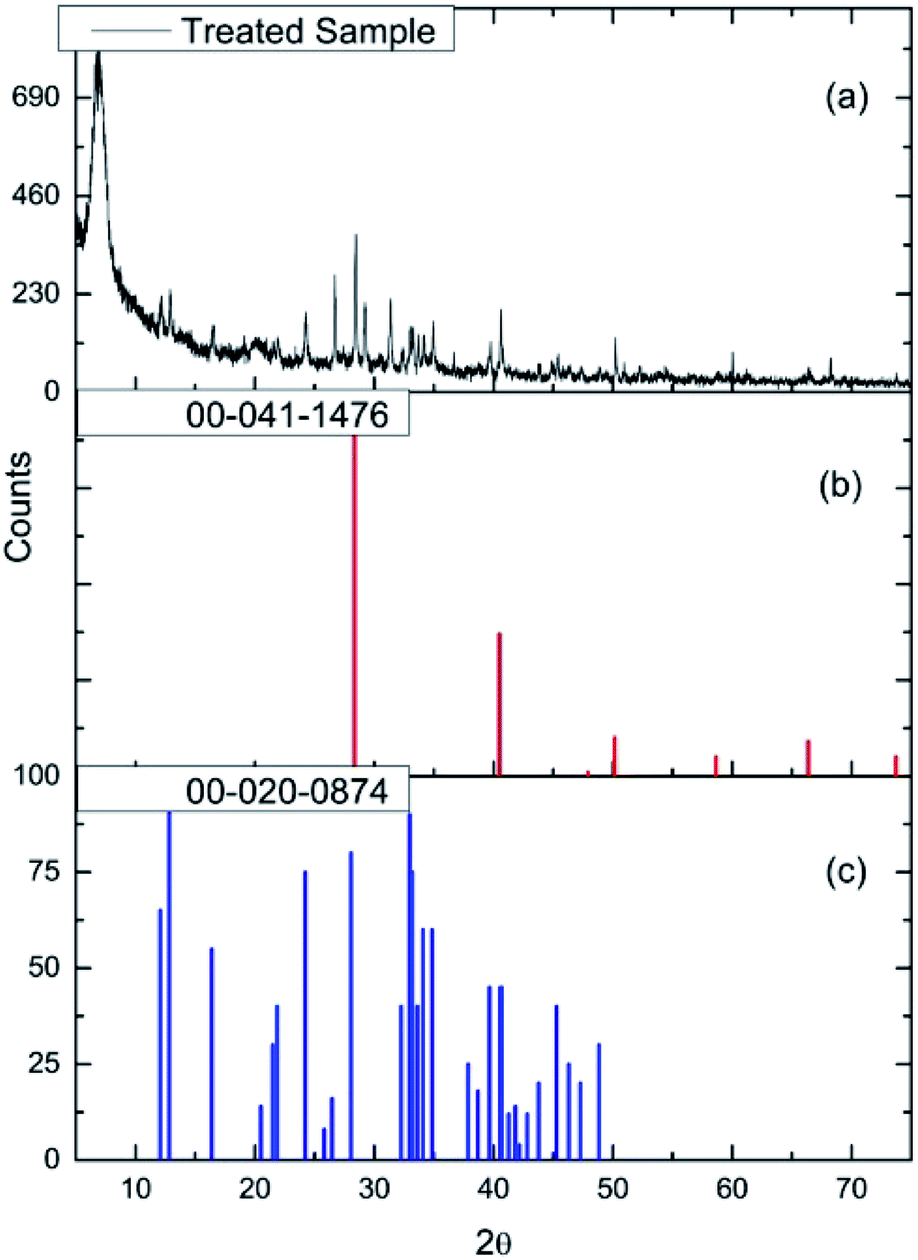
Fig. 3(a) shows the X-ray diffraction pattern of the as-received catalyst. On analysis (see Section 2.2), this was assigned to three principal compounds: potassium chloride, potassium trichlorocuprate (KCuCl3) and potassium decachlorooxotetracuprate (K4Cu4OCl10, also known as ponomarevite). The broad intense feature at 2θ = 4° is attributed to the support material. The absence of X-ray diffraction peaks associated with crystalline CuCl2 is interpreted as indicating that any CuCl2 phase present has no long-range order. The copper containing species are copper(II).
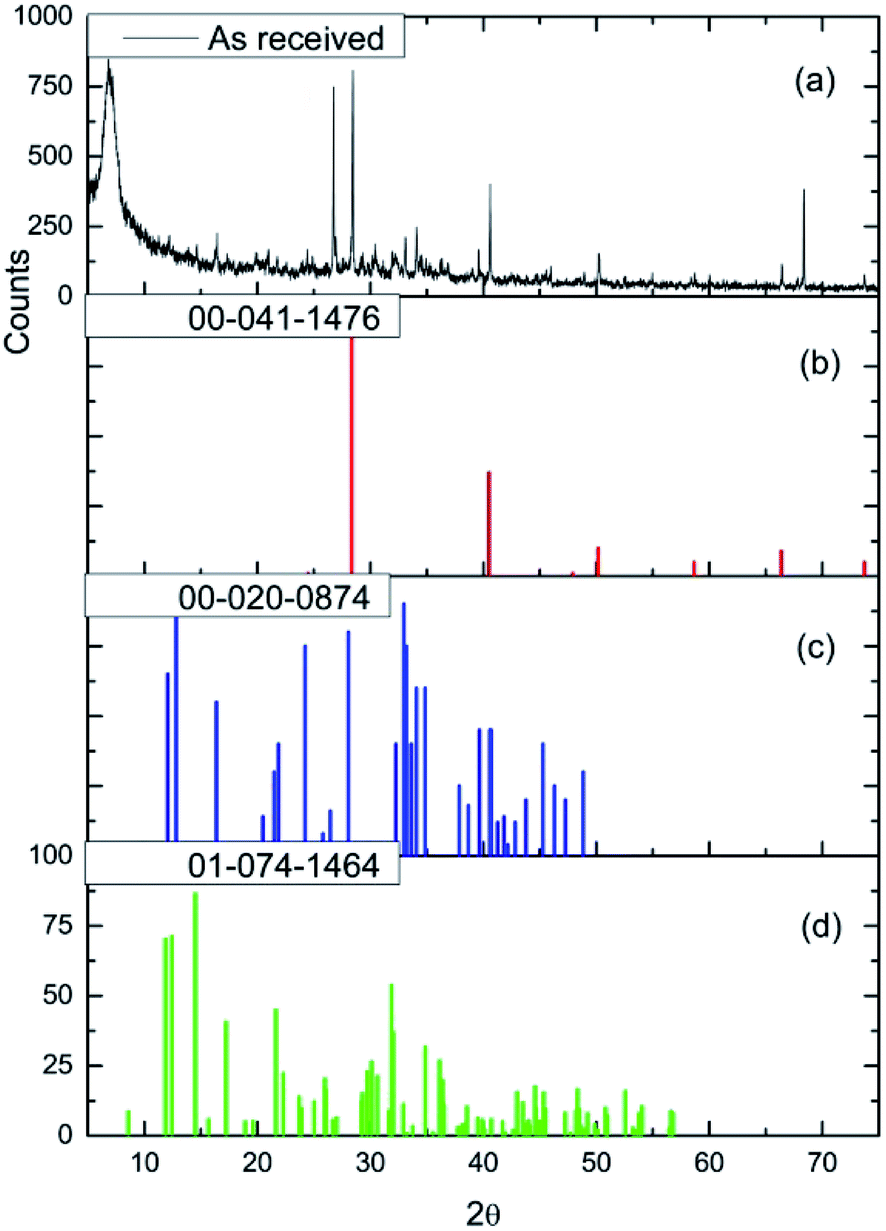 | ||
| Fig. 3 (a) The X-ray diffraction pattern of the as-received CuCl2/KCl/attapulgite catalyst. Reference diffraction patterns for (b) KCl (red), (c) KCuCl3 (blue) and (d) K4Cu4OCl10 (green). | ||
Fig. 4 shows the diffuse reflectance infrared spectrum (DRIFTS) for the dried catalyst. The inset to Fig. 4 shows the in-line mass spectrometer trace for mass 18 (H2O) during the drying stage recorded from the outlet of the DRIFTS environmental cell. After an initial peak in the desorption profile on the commencement of heating whilst the sample is continuously purged with helium, the water signal diminishes to baseline level over a drying period of 12 h, with the profile indicating that the sample has achieved full dehydration for this combination of drying temperature and purge gas flow conditions at the end of the drying stage. The DRIFTS spectrum itself is characterised by a strong and broad ν(OH) feature at about 3400 cm−1 and a distinct δ(OH) band at 1633 cm−1. The ν(OH) band is assigned to a combination of hydroxyl groups and water molecules associated with the support material, whilst the δ(OH) band is uniquely attributed to water within the open structure of the support material. Attapulgite is the mineralogical name for palygorskite, a porous material formed from inter-dispersed sheets of silica and octahedrally coordinated cations drawn from Mg2+, Al3+ and Fe3+.17,18 Thus, Fig. 4 shows the dried material to include hydroxyl groups and water molecules within the structural framework, most likely located in the galleries of this clay like material. Some fine structure is discernible within the broad ν(OH) feature band with peak maxima at 3199, 3311, 3404, 3489 and 3583 cm−1. On the basis of the intensity of the δ(OH) peak, these signals are thought to correspond to a population of hydrogen bonded hydroxyl groups that are almost masked by a dominant envelope of hydrogen bonded water molecules.
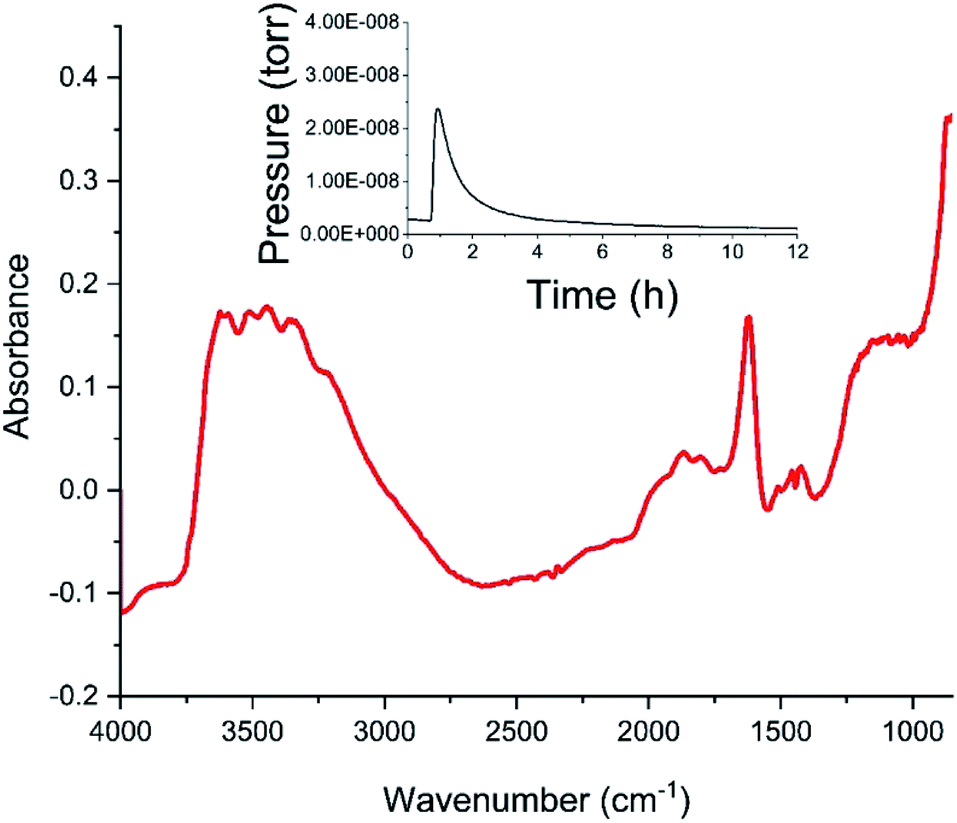 | ||
| Fig. 4 The diffuse reflectance infrared spectrum of the dried, as-received CuCl2/KCl/attapulgite catalyst. The inset presents the mass spectrometer water signal measured at the outlet of the environmental cell as a function of time during the 12 h drying period. | ||
3.2 Deacon capability
The catalyst was selected for its durability and ability to tolerate the corrosive conditions associated with CO chlorination to give phosgene. The catalyst’s oxy-chlorination behaviour has been considered previously at pressures <0.5 bar g employing a different reactor configuration7 to that employed here. Therefore, in order to assess properly the material’s redox suitability in the apparatus employed here (Section 2.3), the catalyst’s capability for the Deacon reaction was re-evaluated; a co-feed of HCl and dioxygen with dinitrogen as a diluent was established over the by-pass reactor. Once stabilised, the feedstream was switched over to the catalyst.Fig. 5 presents a series of UV-vis spectra of the exiting gas as the catalyst is progressively heated. At 603 K no features are observable, but over the range of 623–663 K a broad single peak centred at 330 nm is observed, which is assigned to the π* → σ* transition of dichlorine.19 The minor glitch observed at about 364 nm corresponds to a grating change in the spectrometer at this wavelength. The integrated peak area between 275 and 474 nm was used to calibrate the chlorine spectral response, whilst the IR intensity of the ν(HCl) mode enabled quantification of the HCl consumption.
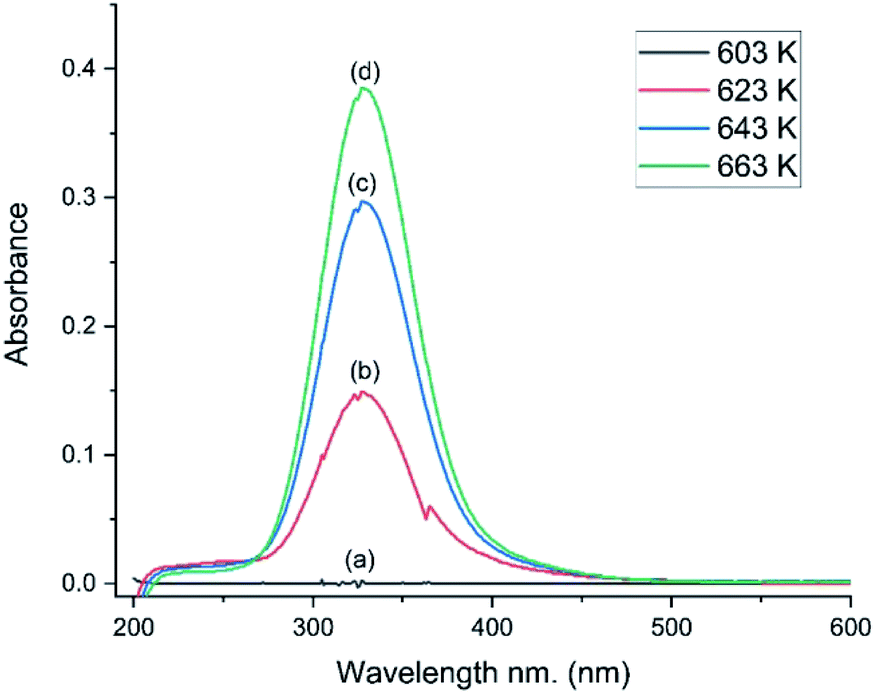 | ||
| Fig. 5 UV-visible spectra as a function of temperature for a HCl + O2 feedstream passed over the CuCl2/KCl/attapulgite catalyst: catalyst temperature = (a) 603, (b) 623, (c) 643 and (d) 663 K. Flow conditions: O2/He 20 cm3 min−1, HCl 6 cm3 min−1, N2 (carrier gas) 33 cm3 min−1, and N2 (diluent post-reactor) 100 cm3 min−1. | ||
Fig. 6 presents the flow rates of HCl and dichlorine exiting the reactor as a function of temperature and time-on-stream. In this reaction the temperature was increased from 603 to 663 K over a period of 460 min using three 20 K steps. After each temperature step the production of chlorine is seen to increase whilst the HCl consumption increases. It can also be seen that after 10–20 min reaction, steady-state operation at higher temperature is obtained. At 663 K the HCl flow rate has decreased by 0.072 mmol min−1 g−1, which corresponds to a conversion of 25.4%. The dichlorine formation rate is 0.037 mmol min−1 g−1, consistent with the stoichiometric balance indicated in eqn (7).
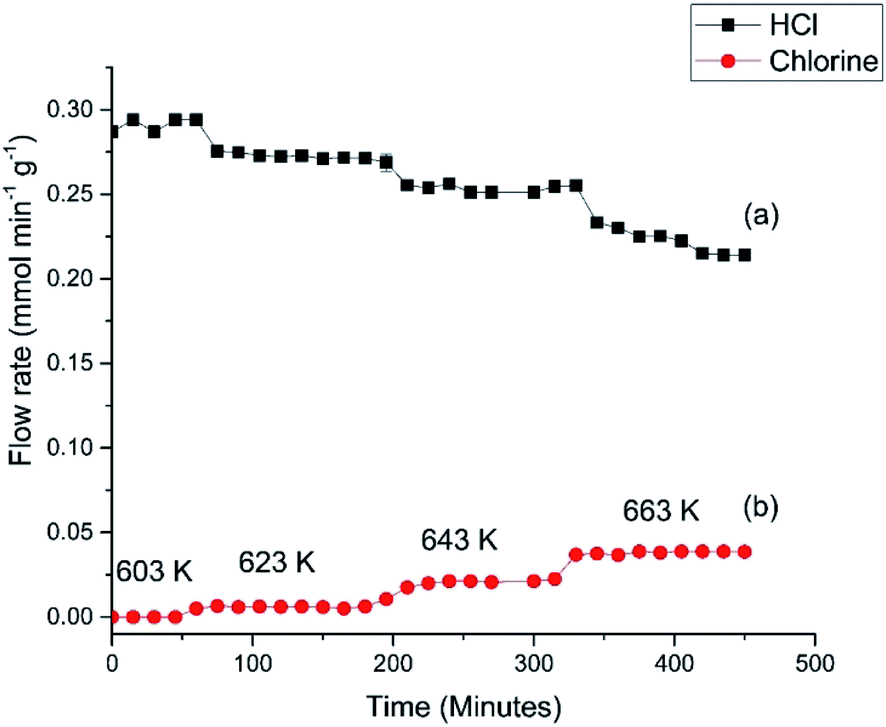 | ||
| Fig. 6 (a) HCl and (b) Cl2 flow rates observed for Deacon operation over the CuCl2/KCl/attapulgite catalyst as a function of increasing temperature. Flow conditions: O2/He 20 cm3 min−1, HCl 6 cm3 min−1, N2 (carrier gas) 33 cm3 min−1, and N2 (diluent post-reactor) 100 cm3 min−1. | ||
The profile in Fig. 6 provides data for reaction temperatures that are required to initiate chlorination (≥623 K). The melting point of copper chloride is 893 K (ref. 20) and there is a possibility of molten salt formation with this compound.9,12 Modification of copper chloride catalysts with group one halides such as potassium chloride is well documented;9 one reason for the addition is to lower the copper chloride volatility.9 We have previously used X-ray absorption spectroscopy to investigate the catalyst under consideration here.15 XANES measurements recorded on application of a temperature ramp up to a maximum temperature of 640 K showed a decrease in Cu2+ character, and at temperatures from 633 K onwards there was an increasing contribution from Cu+ species; at 640 K the sample consisted of a mixture of Cu+ and a small amount of Cu2+.15
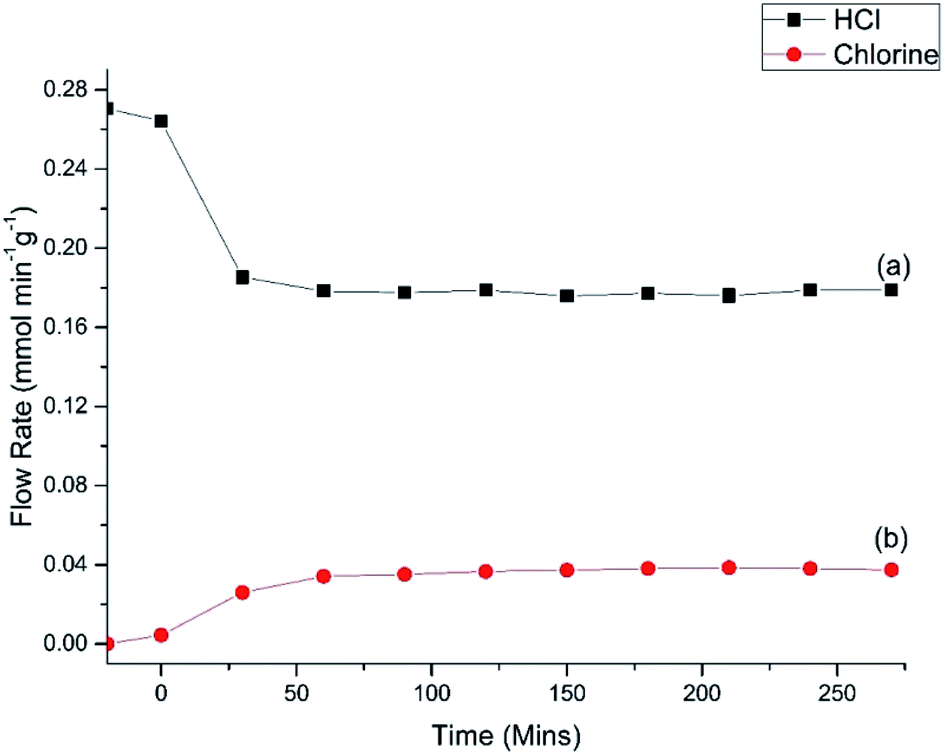
Fig. 7 shows the HCl oxy-chlorination profile over the catalyst at 653 K for an extended period of time-on-stream. These isothermal measurements show equilibrium to be achieved within approximately 1 h; continuous turnover is observed over the approximately 3 h period studied, with no deactivation evident. Fig. 7 provides an indication of error in these Deacon measurements. For reaction times ≥60 min the variance in the HCl and Cl2 measurements is <5%. This constitutes steady-state operation. The greater variability apparent in Fig. 6, more evident with the HCl values than the Cl2, is therefore thought to represent small changes in the reaction system as the system approaches equilibrium after the perturbation of the thermal stepping.
 | ||
| Fig. 7 (a) HCl and (b) Cl2 flow rates observed for Deacon operation over the CuCl2/KCl/attapulgite catalyst as a function of time-on-stream at 653 K. Flow conditions: O2/He 20 cm3 min−1, HCl 6 cm3 min−1, N2 (carrier gas) 33 cm3 min−1, and N2 (diluent post-reactor) 100 cm3 min−1. | ||
Previous studies have considered how dichlorine yields can be dependent on parameters such as residence time, catalyst mass and relative oxygen concentration.7 In order to ensure that the Deacon activity displayed in Fig. 6 and 7 is representative of previous reports on this catalyst,7Fig. 8 presents the Deacon reaction profile at 653 K but with an increased oxygen flow rate (HCl = 6 cm3 min−1, O2 = 40 cm3 min−1). Fig. 8 shows the HCl flow rate to have decreased from 0.325 mmol min−1 g−1 to 0.105 mmol min−1 g−1 over a period of ∼30 min, corresponding to an enhanced conversion of 67%. Meanwhile, over the same time period, chlorine production is stabilised at a flow rate of 0.100 mmol min−1 g−1, a value broadly consistent with the stoichiometric balance indicated in eqn (7). This higher level of conversion correlates with previous reports on dichlorine yields over this catalyst.7 Contrasting Fig. 8 with Fig. 6 and 7 suggests some complexity within the Deacon activity over a KCl doped CuCl2 catalyst but, nonetheless, it indicates that this catalyst can support Deacon chemistry under the reaction conditions considered here.
 | ||
| Fig. 8 HCl and Cl2 flow rates observed for Deacon operation at 653 K over the CuCl2/KCl/attapulgite catalyst as a function of time-on-stream in the presence of an increased oxygen flow rate. Flow conditions: O2/He 40 cm3 min−1, HCl 6 cm3 min−1, N2 (carrier gas) 13 cm3 min−1, and N2 (diluent post-reactor) 100 cm3 min−1. | ||
3.3 CO exposure to the CuCl2/KCl/attapulgite catalyst and the effect of a dichlorine pre-treatment stage
Fig. 9(a) shows the IR spectra for CO dosing over the dried catalyst as a function of increasing temperature. Up to 473 K only CO is observed, as signified by the ν(CO) doublet centred at about 2140 cm−1. However, at 573 K the ν(CO) signal decreases and a new feature appears at 2345 cm−1, assigned to the νasym(OCO) mode of CO2. Increasing the temperature to 653 K leads to increased CO2 production, with the δ(OCO) mode at 665 cm−1 also observable. No other products are observed in Fig. 9(a). This outcome correlates with a previous communication concerning CO exposure to this catalyst at elevated temperatures.15 However, this outcome is not that expected from eqn (8).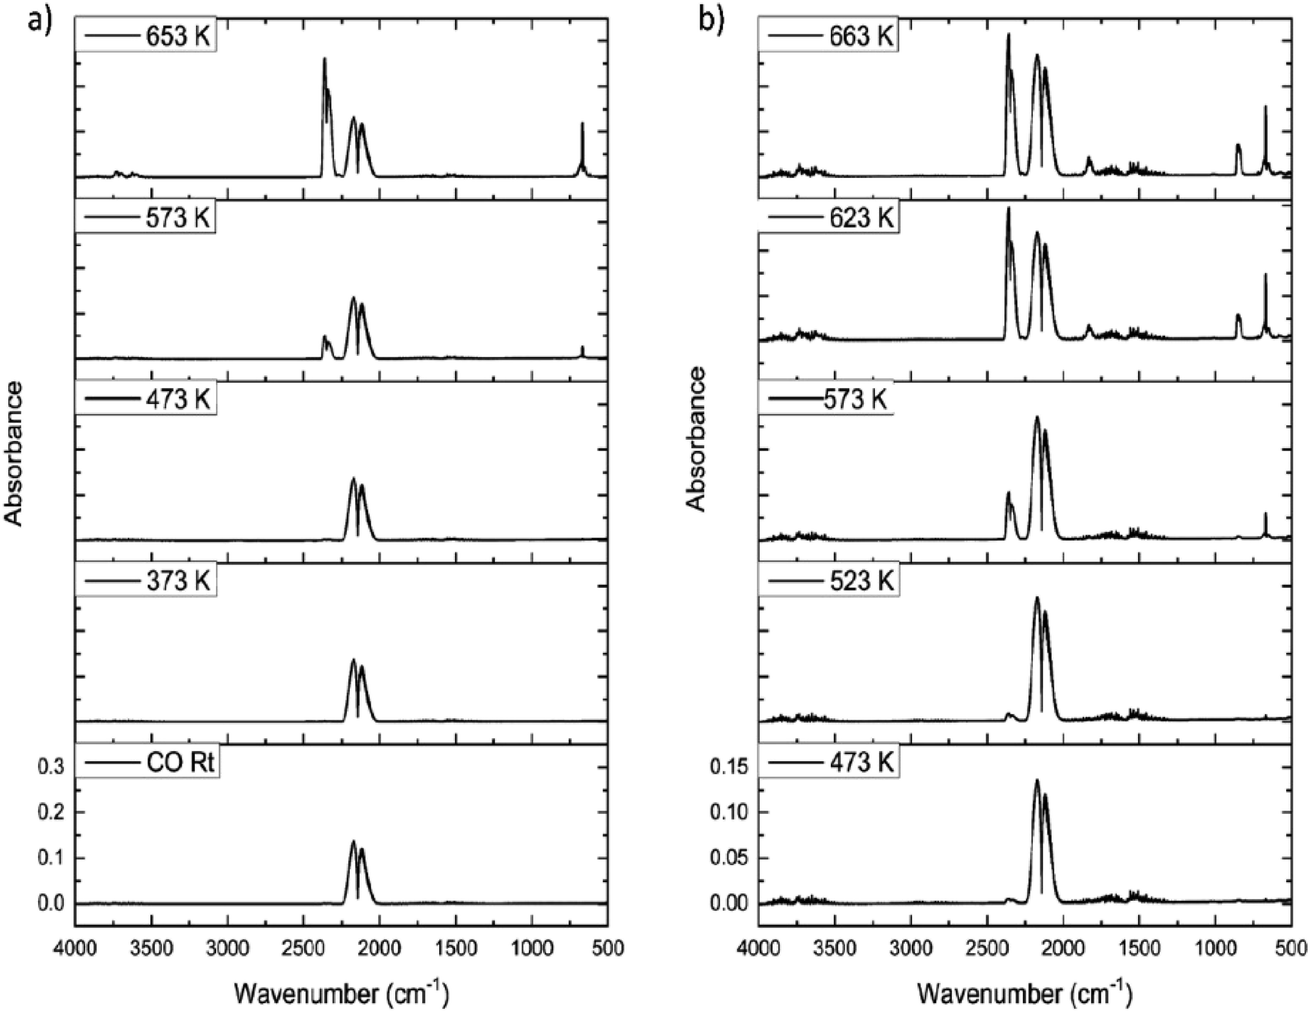 | ||
| Fig. 9 FTIR spectra as a function of temperature for the reaction of CO with (a) as-received and (b) Cl2 pre-treated (12.8 mmol Cl2 per g(cat)) CuCl2/KCl/attapulgite catalyst. Flow conditions: CO 5 cm3 min−1, N2 (carrier gas) 54 cm3 min−1, and N2 (diluent post-reactor) 100 cm3 min−1. | ||
The only procedure that led to COCl2 production was the application of a dichlorine pre-treatment. Here, a flow of dichlorine diluted within a dinitrogen carrier gas stream for a fixed period of time prior to CO/N2 flow induced phosgene production at elevated temperatures. Fig. 9(b) presents a representative set of IR spectra recorded for a CO/N2 feedstream after a dichlorine pre-treatment of 12.8 mmol Cl2 per g(cat). At 473 K CO dominates the spectrum (ν(CO) mode), although a small contribution from CO2 is also apparent (νasym(OCO) mode). At 623 K CO2 formation has increased but weak bands at 1830/1820 and 840 cm−1 are observed, respectively assigned to the ν(CO) and ν(C–Cl) modes of phosgene. At 663 K more phosgene is produced. Under these conditions, eqn (8) is operational.
Calibration of the FTIR spectra enables the reaction profiles for a continuous flow of CO as a function of temperature to be obtained: CO2 formation is presented in Fig. 10(a), whilst Fig. 10(b) shows COCl2 production. For both products, comparisons are made between the performance of (i) the as-received then dried catalyst and that of (ii) the catalyst after a dichlorine pre-treatment stage with 12.8 mmol Cl2 per g(cat). Fig. 10(a) shows the un-treated catalyst to produce CO2 from approximately 553 K, with the rate progressively increasing as the temperature is raised. It also shows that the CO2 production rate is significantly reduced after the dichlorine pre-treatment. At 653 K CO2 formation is reduced from 0.049 to 0.023 mmol CO2 per min per g(cat) (a reduction of 47%). Fig. 10(b) shows the reaction profile for COCl2 formation to differ significantly. Phosgene production is observed on the pre-treated catalyst at temperatures in excess of 613 K. Thereafter, the rate increases approximately linearly with temperature up to a value of 1.5 × 10⁻³ mmol COCl2 per min per g(cat) at 653 K. For the pre-treated catalyst (12.8 mmol Cl2 per g(cat)), CO2 production still dominates at 653 K, with the phosgene formation rate being 6.5% of that observed for CO2.
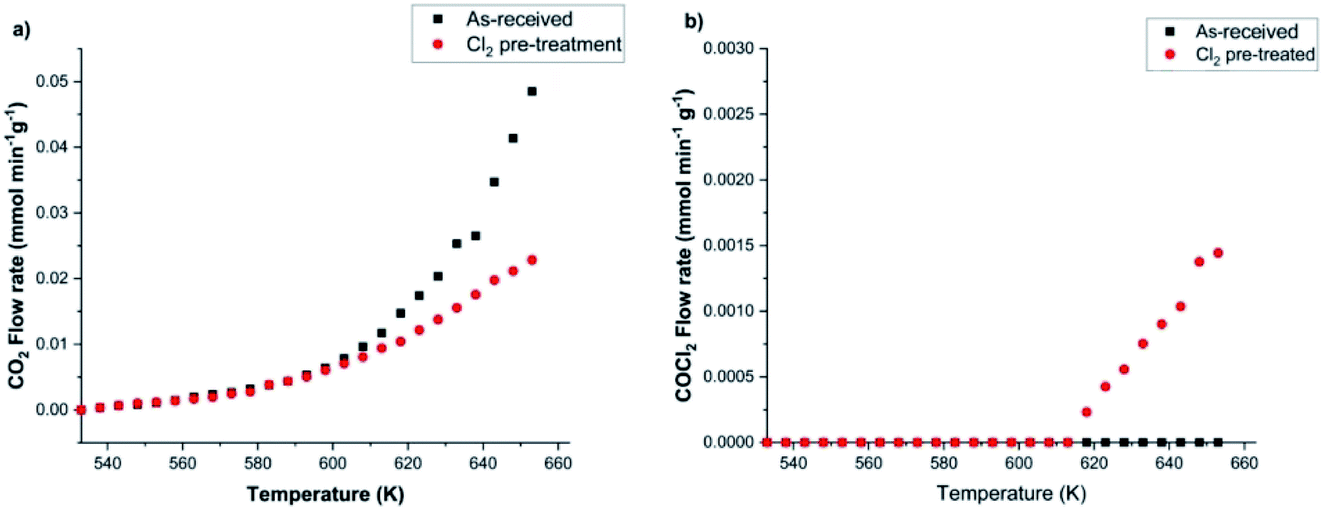 | ||
| Fig. 10 Profiles of (a) CO2 and (b) COCl2 flow rates as a function of temperature in the case of (i) as-received [black squares] and (ii) chlorine pre-treated (12.8 mmol Cl2 per g(cat)) [red circles] CuCl2/KCl/attapulgite catalyst. Flow conditions: CO 5 cm3 min−1, N2 (carrier gas) 54 cm3 min−1, and N2 (diluent post-reactor) 100 cm3 min−1. | ||
In order to determine how the catalyst was inducing CO conversion, CO was exposed to the dried support material, i.e. attapulgite with no CuCl2 or KCl present. Fig. 11 presents the IR spectra of the reactor exit stream for continuous CO exposure to the dried attapulgite at (a) 383 and (b) 653 K. At the lower temperature a negligible quantity of CO2 is observed. This is only marginally increased at the higher temperature. Indeed the quantity of CO2 detected at 653 K for the support material (Fig. 11(b)) represents ∼0.8% of that observed for the non-dichlorine pre-treated catalyst (Fig. 9(a)). Given that Fig. 11 shows the absence of any other products other than these small quantities of CO2, it is deduced that the pathways of both CO oxidation and phosgene formation require the presence of CuCl2.
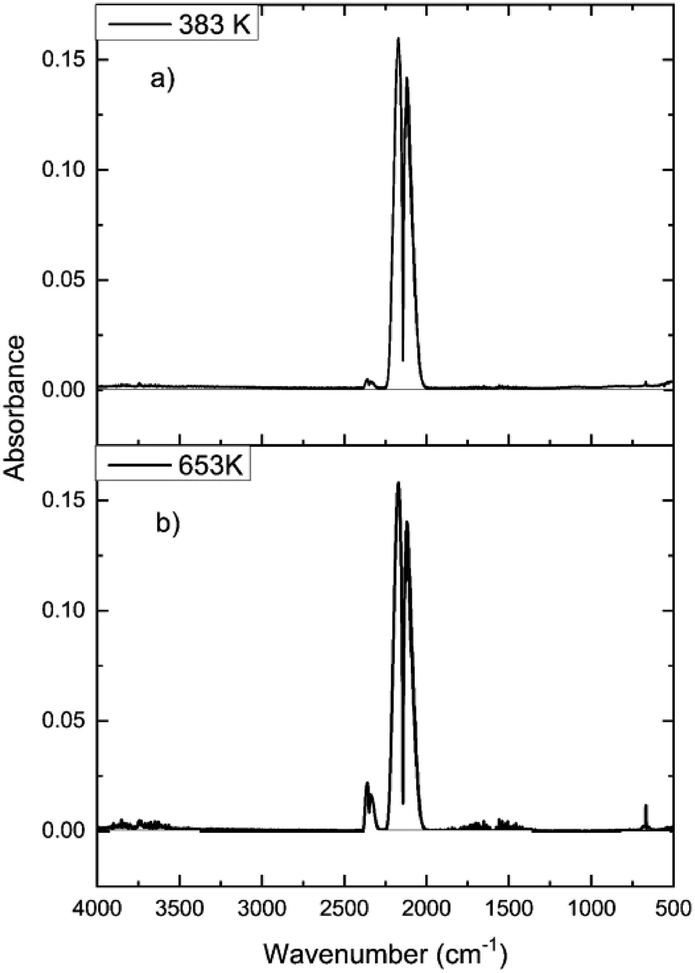 | ||
| Fig. 11 FTIR spectra for continuous CO dosing over the dried support material (attapulgite) at (a) 383 and (b) 653 K. Flow conditions: CO 5 cm3 min−1, N2 (carrier gas) 54 cm3 min−1, and N2 (diluent post-reactor) 100 cm3 min−1. | ||
Fig. 12 presents a series of XPS spectra for the as-received catalyst as a function of increasing temperature (a–d). After this heating ramp and whilst maintaining the sample at 653 K, the sample was exposed to CO by means of a 10% CO in Ar mixture at a pressure of 1 bar for 15 min. The final XPS spectrum in Fig. 12(e) was obtained after this treatment. Spectra (a–d) indicate that the surface copper species remain as Cu2+ during temperature ramping up to 653 K, due to the observation of a strong peak centred at 932 eV that is accompanied by distinct Cu2+ satellite peaks at 939 and 960 eV. However, on exposure to CO at 653 K (Fig. 12(e)) the copper signal shifts to 930 eV and the Cu(II) satellites disappear. This sequence indicates reduction of Cu2+ to Cu+ by CO, a process consistent with eqn (8). However, some contrast to the XANES measurements is noted here, with the XANES measurements revealing that heating of the as-received catalyst in the range of 473–640 K leads to reduction of Cu2+ to Cu+, resulting in a mixture of Cu2+ and Cu+.15 This scenario indicates some discrepancy between the copper oxidation states in the bulk and at the surface of the CuCl2 crystallites on thermal treatment.
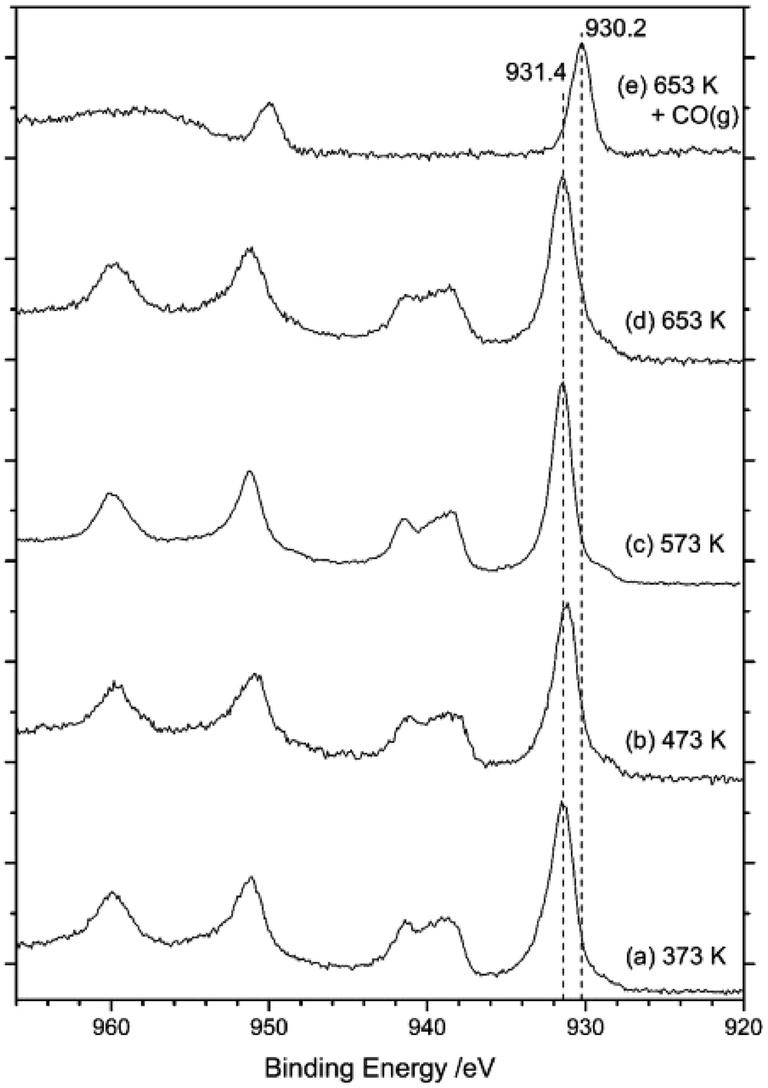 | ||
| Fig. 12 Cu(2p) core-level XPS spectra of CuCl2/KCl/attapulgite catalyst on progressive heating: (a) 373, (b) 473, (c) 573 and (d) 653 K. (e) At 653 K the catalyst was exposed to a mixture of 10% CO in Ar at a pressure of 1 bar for 15 min. | ||
It is evident from Fig. 9 that the dichlorine pre-treatment enables phosgene production over this catalyst at the conditions described in Section 2.3. Fig. 13 considers how the extent of the dichlorine pre-treatment affects the maximum amounts of CO2 and COCl2 observed. Specifically, Fig. 13 shows that exposure of 32.3 mmol Cl2 per g(cat) reduces CO2 production from 0.073 to 0.015 mmol CO2 per min per g(cat) (a reduction of 79%), whilst inducing a maximum phosgene flow rate of 0.013 mmol COCl2 per min per g(cat). Thus, after this extended chlorine pre-treatment, the flow rates for formation of CO2 and COCl2 are broadly comparable. Moreover, Fig. 13 shows a greater attenuation of CO oxidation relative to phosgene formation, suggestive of the presence of connected but, nonetheless, distinct chemical pathways.
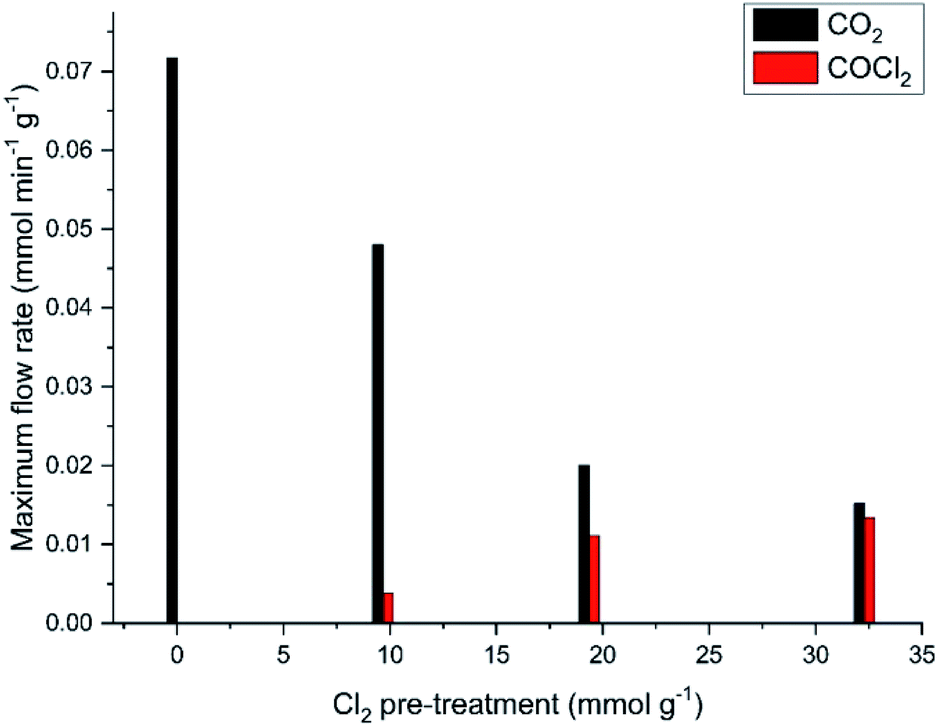 | ||
| Fig. 13 Maximum CO2 and phosgene flow rates at 653 K as a function of increasing chlorine pre-treatment. Reaction flow conditions: CO 5 cm3 min−1, N2 (carrier gas) 54 cm3 min−1, and N2 (diluent post-reactor) 100 cm3 min−1. | ||
 | ||
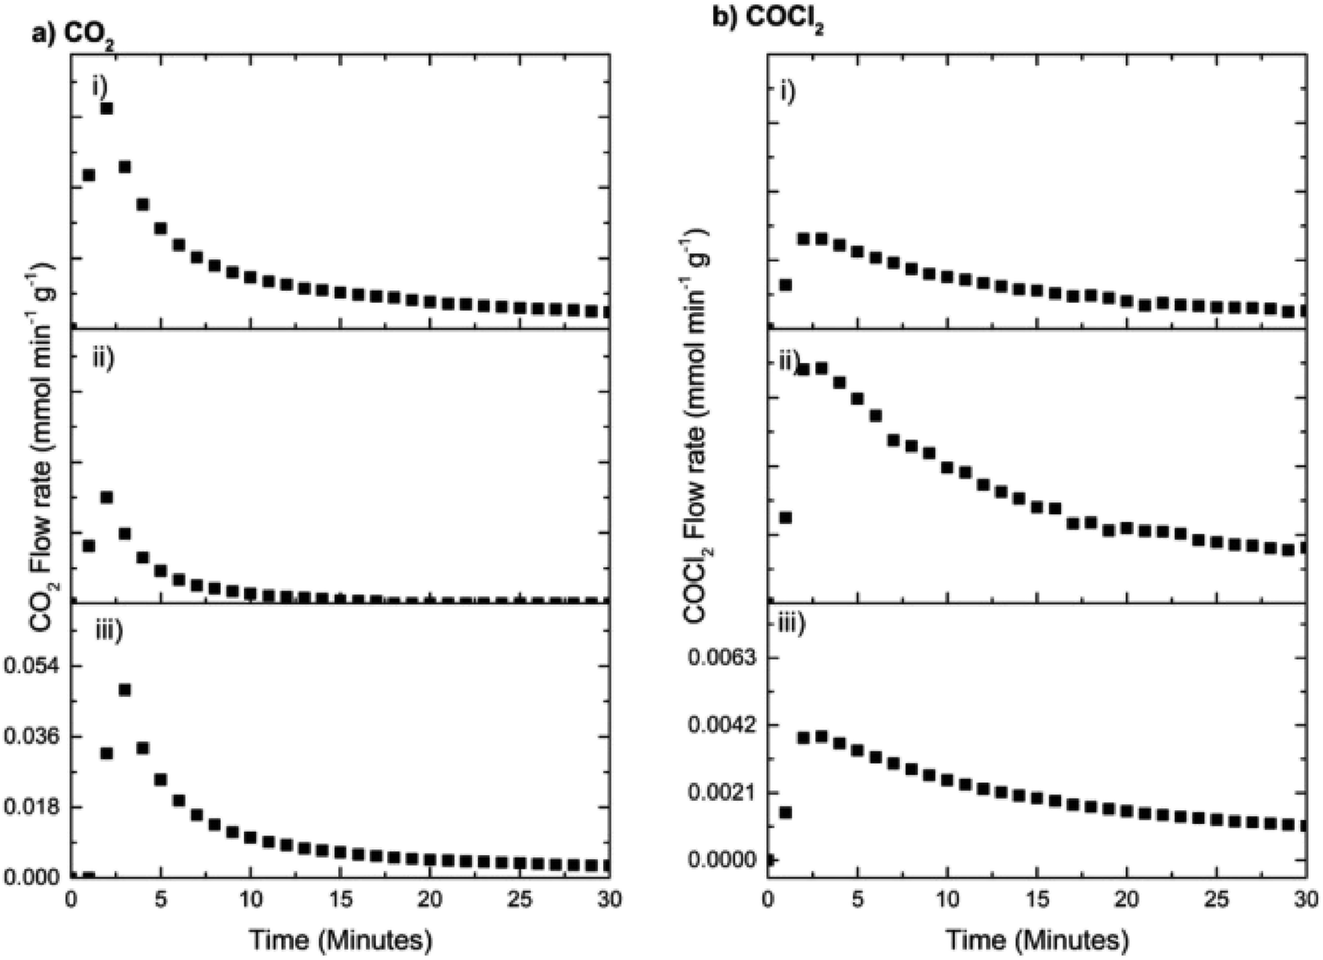
| Fig. 14 (a) CO2 and (b) phosgene flow rates at 653 K with respect to time-on-stream for (i) a low (12.8 mmol Cl2 per g(cat)) and (ii) a higher dose (25.6 mmol Cl2 per g(cat)) chlorine pre-treatment. Flow conditions: CO 5 cm3 min−1, N2 (carrier gas) 54 cm3 min−1, and N2 (diluent post-reactor) 100 cm3 min−1. | ||
Concentrating first on the CO2 flow rates (Fig. 14(a)), the low chlorine pre-treatment exposure of 12.8 mmol Cl2 per g(cat) results in a maximum flow rate of 0.048 mmol CO2 per min per g(cat), which over a period of 60 min decays to 2.5 μmol CO2 per min per g(cat). For the higher dichlorine exposure (25.6 mmol Cl2 per g(cat)), the maximum in the CO2 flow rate is significantly reduced to 0.0155 mmol CO2 per min per g(cat) that decays to 2.0 μmol CO2 per min per g(cat) at t = 60 min.
In terms of flow rate intensity as a function of chlorine pre-treatment, Fig. 14(b) shows opposite trends to those displayed in Fig. 14(a). Namely, the low chlorine pre-treatment exposure (12.8 mmol Cl2 per g(cat)) leads to a maximum flow rate of 0.004 mmol COCl2 per min per g(cat), which then progressively decays over a period of 60 min to a value of ∼0.7 μmol COCl2 per min per g(cat). Increasing the chlorine pre-treatment exposure to 25.6 mmol Cl2 per g(cat) dramatically increases the maximum flow rate of phosgene to 0.0135 mmol COCl2 per min per g(cat); this then decays to a value of ∼2.6 μmol COCl2 per min per g(cat) over the 60 minute acquisition period.
Two main outcomes arise from Fig. 14 concerning continuous CO exposure over the catalyst at an elevated temperate of 653 K. Firstly, increasing the magnitude of the chlorine pre-treatment exposure leads to a reduction in the maximum value of the CO2 formation rate, whereas it enhances the maximum rate of phosgene production. This indicates that the two processes, i.e. CO oxidation and chlorination, are connected, seemingly in a competitive way, where expansion of one pathway occurs at the expense of the other. The second matter concerns the general profile observed for Fig. 14(a) and (b), namely both products on continuous CO dosing unambiguously present decay profiles, i.e. either product formation cannot be maintained for even short periods of time-on-stream. This suggests that the observed processes over this substrate may not be catalytic. Furthermore, it is possible that the reactions are a surface phenomenon with diminution of the CO oxidation rate, with either oxidation to CO2 or chlorination to COCl2 being a surface process where a co-reactant is progressively being lost from the surface zone and, importantly, not being replenished during the reaction process.
A further aspect that can be extracted from Fig. 14 is the fact that the decay profiles for CO2 and COCl2 differ, with CO2 decaying faster than COCl2. Although the decay curves do not readily conform to a simple mathematical expression (e.g. single exponential decay), thereby preventing a simple kinetic analysis, initial half-life values (t1/2) provide an indication of differences in the product attenuation rates. From a series of repeat measurements, the CO2 profile returned a consistent t1/2 = 4 min. The COCl2 profiles exhibited a greater variability, being seemingly sensitive to the degree of chlorine pre-treatment but, nevertheless, a value of t1/2 = 9 min was representative for this product. The times are sufficiently different to indicate that they correspond to different chemical processes. Thus, a picture is emerging of two surface processes, CO oxidation and chlorination, that are in competition with each other but that occur via different chemical pathways. If they had been directly linked, more comparable decay curves would have been anticipated.
 | ||
| Fig. 15 (a) The X-ray diffraction pattern of the dichlorine pre-treated CuCl2/KCl/attapulgite catalyst (chlorine exposure = 12.8 mmol Cl2 per g(cat)). Reference diffraction patterns for (b) KCl (red) and (c) KCuCl3 (blue). | ||
 | ||
| Fig. 16 (a) CO2 and (b) COCl2 formation rates on continuous dosing of CO at 653 K as a function of time-on-stream after three sets of chlorine pre-treatments with a fixed aliquot of 12.8 mmol Cl2 per g(cat). Run (i) corresponds to a single exposure of 12.8 mmol Cl2 per g(cat) prior to monitoring the reaction with CO. Run (ii) corresponds to an additional exposure of 12.8 mmol Cl2 per g(cat) again prior to reaction with CO. Upon completion of run (ii) the catalyst experienced a further dichlorine pre-treatment (12.8 mmol Cl2 per g(cat)) prior to the reactor being purged with nitrogen for 30 min. Heating was then switched off, the reactor was isolated, and the catalyst was cooled to 293 K and left overnight in an inert atmosphere. After 12 h, the reaction with CO was repeated as normal at 653 K. Flow conditions: CO 5 cm3 min−1, N2 (carrier gas) 54 cm3 min−1, and N2 (diluent post-reactor) 100 cm3 min−1. | ||
As expected, Fig. 16 shows that the first two dichlorine pre-treatments lead to decreasing rates of CO2 formation (Fig. 16(a)) but increasing phosgene production (Fig. 16(b)), outcomes consistent with Fig. 13 and 14. However, in the case of the third dichlorine pre-treatment there is a distinct increase in the maximum flow rate of CO2 (Fig. 16(a,iii)) whilst, concomitantly, a reduction in the maximum flow rate of phosgene is seen (Fig. 16(b,iii)). Two processes could contribute to the trends associated with run (iii). Firstly, there could be a degree of desorption of chlorine from the catalyst surface that reduces the effect of the dichlorine pre-treatment. Secondly, and thought to be more probable, is the possibility that active chlorine present at the surface of the CuCl2 crystallites has slowly diffused from the surface to the bulk. As above, this diminishes the surface contribution and attenuates the associated surface chemistry. The issue of a chlorine surface → bulk diffusion process is worthy of further investigation. It is also acknowledged that the regained intensity of the CO2 signal could reflect diffusion of hydroxyl groups from within the network of the support material to the active sites to ultimately enhance that particular transformation.
4. Discussion
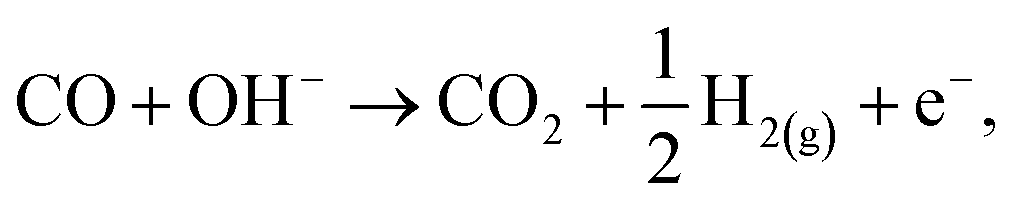
Despite the catalyst exhibiting Deacon activity (Fig. 6–8), the reaction channel for the chlorination of CO to phosgene (eqn (8)) did not become activated unless the catalyst experienced a dichlorine pre-treatment. In the absence of that pre-treatment, CO2 was the only identifiable product (Fig. 9). In this way, the continuously dosed CO can experience two chemical pathways: oxidation and chlorination. Blank experiments on just the attapulgite support material indicated both processes to be CuCl2-mediated (Fig. 11). Diffuse reflectance IR measurements of the dried, as-received catalyst established that the dried catalyst retains a population of hydrogen bonded hydroxyl groups (Fig. 4). The majority of these hydroxyls will be present throughout the galley structure of the support material; however, some are expected to reside at the CuCl2/support interface and to convey chemical reactivity. Specifically, these hydroxyl groups are thought to facilitate oxidation of in-bound CO molecules to yield CO2. Eqn (12) describes the process.21,22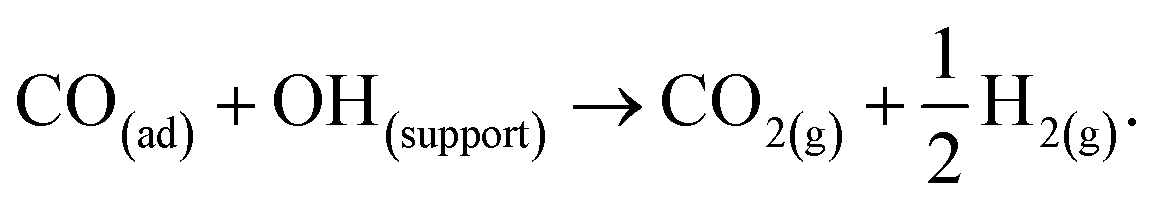 | (12) |
 | (13) |
| CO + 2OH− → CO2 + H2O + 2e−, | (14) |
| COCl2 + H2O → CO2 + 2HCl | (15) |
Moving on to the CO chlorination pathway (eqn (8)), Fig. 9 shows that this exists alongside the oxidation pathway, although it exhibits a different onset temperature (Fig. 10) and decay profile (Fig. 14). In addition, successive dichlorine pre-treatments preferentially attenuate CO2 formation with respect to COCl2 enhancement (Fig. 13). These observations lead to the proposal that the reaction chemistry is surface driven, with the dichlorine pre-treatment differentially affecting both oxidation and chlorination channels. In this way, the dichlorine pre-treatment is thought to depopulate hydroxyl groups at the CuCl2/support interface that would otherwise facilitate CO oxidation. It is the reduction of this hydroxyl population that leads to the decreased CO2 production rates (Fig. 10, 13 and 14). Somewhat surprisingly, under the reaction conditions described (Section 2.3), continuous CO exposure to dried CuCl2 at elevated temperatures does not lead to any chlorinated products (Fig. 9). Therefore, it is suggested that the dichlorine pre-treatment induces additional chlorine defect sites at the surface of the CuCl2 particles and that it is the chlorine at these sites that is responsible for phosgene production (eqn (8)).
Linking back to the Introduction, it is useful to consider aspects of the redox chemistry. Fig. 11 shows that continuous CO exposure at elevated temperature over the support material alone effectively produced no reaction. The reaction chemistry displayed in Fig. 9 is CuCl2-mediated. Depending on the conditions, adsorbed CO can be oxidised to either (i) CO2 in the absence of surface chlorine, or (ii) phosgene if surface chlorine is present. In both cases Cu(II) chloride is reduced to Cu(I) chloride.
Fig. 14 shows both CO oxidation and chlorination to decrease with time-on-stream; steady state operation is not obtained in either case. This indicates a finite resource at the surface where CO reaction progressively depletes both surface hydroxyl groups and the chlorine at defect sites. Slow or inefficient diffusion of bulk chlorine to the surface region and slow hydroxyl group diffusion within the support pore structure will lead to the decay curves observed. Since the two decay processes have different origins, they exhibit different t1/2 values (Section 3.3.1).
Fig. 17 provides a schematic representation of the key steps in the observed process chemistry. The precise nature of the proposed chlorine derived defect sites that support the CO chlorination reaction is unknown at this time. However, it is noted that the proposed reaction scheme does broadly agree with our previous XAS and DFT based study on this reaction system that indicated that a mixed Cu+/Cu2+ catalyst was required to support CO chemisorption.15 Without CO chemisorption, phosgene formation is not possible. Clearly, further work is required on the CuCl2/CO reaction system in order to better understand the viability and durability of the oxy-chlorination process to help close the chlorine cycle in large-scale isocyanate production facilities. Based on the work of Zhang and co-workers,11 this should include investigations at elevated CO pressures.
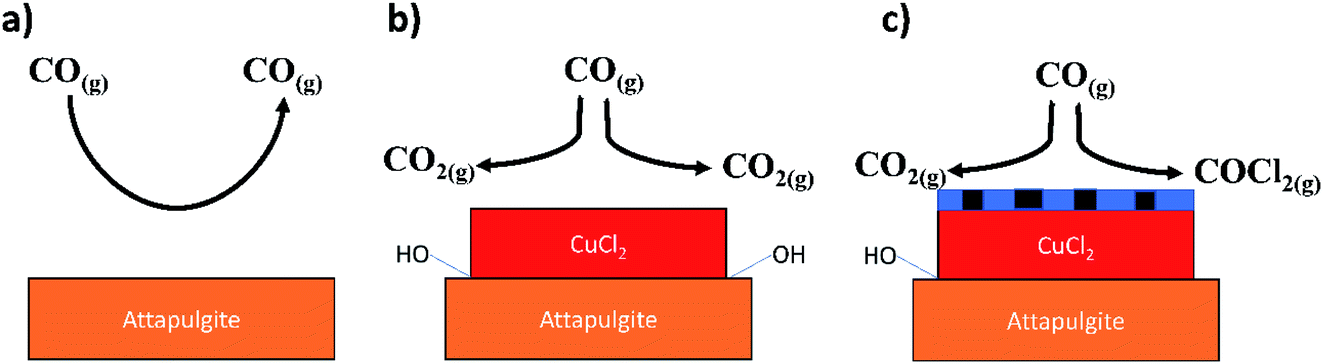 | ||
| Fig. 17 Schematic representation of processes associated with the reactions described in Section 3.1. (a) CO exposure over the support material at elevated temperatures – no significant degree of reaction (Fig. 11); (b) CO exposure to supported CuCl2 at elevated temperature and in the absence of a chlorine pre-treatment – CO2 formation is exclusively observed that is thought to occur via a reaction with hydroxyl groups present at the CuCl2/support interface (Fig. 9(a)); (c) CO exposure to a chlorine pre-treated supported CuCl2 catalyst at elevated temperature – CO oxidation pathway is inhibited due to displacement of interfacial hydroxyl groups by the chlorine, whilst the chlorine pathway is activated by the presence of copper chloride surface defect sites (Fig. 9(b)). The chlorine defect sites are schematically indicated in (c) by the thin blue hatched area at the surface of the CuCl2 crystallite. | ||
5. Conclusions
In relation to possible opportunities in the oxy-chlorination of CO to produce phosgene, a CuCl2/KCl/attapulgite catalyst has been investigated in a continuous flow reactor for its interaction with CO at ambient pressure. The following conclusions can be drawn.• The catalyst is active for the Deacon reaction at ambient pressure and elevated temperatures. Chlorine production is induced at temperatures in excess of 623 K. At 653 K steady state operation is achieved within approximately 60 min, with no evidence of deactivation.
• CO exposure to the dried catalyst over the temperature range 293–653 K uniquely produces CO2. Phosgene formation can be induced via application of a dichlorine pre-treatment stage that simultaneously retards CO2 production; no other gas phase products are identified.
• CO exposure to the dried attapulgite support material over the temperature range 383–653 K produced only negligible quantities of CO2, indicating the CO oxidation and chlorination channels to be CuCl2-mediated.
• Increasing the extent of the chlorine pre-treatment decreases the maximum rate of CO2 production, whilst increasing the maximum phosgene formation rate. These changes in rates are not matched; the dichlorine pre-treatment stage preferentially affects the CO oxidation channel. After a chlorine pre-treatment of 32.3 mmol Cl2 per g(cat) the rates for formation of CO2 and COCl2 are broadly comparable.
• The temporal dependence of CO2 and COCl2 production on continuous exposure to CO at 653 K yields distinct decay curves that are consistent with both CO oxidation and chlorination involving a surface reaction with insufficient replenishment of reagent in the surface region. Repeat dosing experiments additionally indicate there to be a role for surface/bulk diffusion processes for both chlorine and hydroxyl species but that this diffusion is slow compared to the rate of reaction.
• A schematic diagram is presented that describes reaction processes which are consistent with the surface chemistry observed.
Conflicts of interest
There are no conflicts to declare.Acknowledgements
The resources and support provided by the UK Catalysis Hub via membership of the UK Catalysis Hub consortium and funded by EPSRC (grants EP/K014706/1, EP/K014668/1, EP/K014854/1, EP/K014714/1 and EP/M013219/1) are gratefully acknowledged. Ineos Chlor Ltd. is thanked for provision of the catalyst. XPS data collection was performed at the EPSRC National Facility for XPS (“HarwellXPS”) under contract number PR16195. Colin How (School of Physics and Astronomy, University of Glasgow) is thanked for technical support for the TEM measurements. Dr James Campbell (School of Chemistry, University of Glasgow) is thanked for assistance with the DRIFTS measurements.References
- T. A. Ryan, C. Ryan, E. A. Seddon and K. R. Seddon, Phosgene and Related Carbonyl Halides, Elsevier, 1996 Search PubMed.
- C. J. Mitchell, W. van der Borden, K. van der Velde, M. Smit, R. Scheringa, K. Ahrika and D. H. Jones, Catal. Sci. Technol., 2012, 2, 2109 RSC.
- D. Randall and S. Lee, The Polyurethanes Book, John Wiley & Sons, 2002 Search PubMed.
- E. K. Gibson, J. M. Winfield, K. W. Muir, R. H. Carr, A. Eaglesham, A. Gavezzotti, S. F. Parker and D. Lennon, Phys. Chem. Chem. Phys., 2009, 11, 288 RSC.
- E. K. Gibson, J. M. Winfield, K. W. Muir, R. H. Carr, A. Eaglesham, A. Gavezzotti and D. Lennon, Phys. Chem. Chem. Phys., 2010, 12, 3824 RSC.
- N. López, J. Gómez-Segura, R. P. Marin and J. Pérez-Ramírez, J. Catal., 2008, 255, 29 CrossRef.
- I. W. Sutherland, N. G. Hamilton, C. C. Dudman, P. Jones, D. Lennon and J. M. Winfield, Appl. Catal., A, 2011, 399, 1 CrossRef CAS.
- S. Seki, Catal. Surv. Asia, 2010, 14, 168 CrossRef.
- S. Su, D. Mannini, H. Metiu, M. J. Gordon and E. W. McFarland, Ind. Eng. Chem. Res., 2018, 57, 7795 CrossRef CAS.
- F. Calvini, Catal. Today, 2010, 157, 8 CrossRef.
- T. Zhang, C. Troll, B. Rieger, J. Kintrup, O. F.-K. Schlüter and R. Weber, Appl. Catal., A, 2009, 357, 51 CrossRef CAS.
- T. Zhang, C. Troll, B. Rieger, J. Kintrup, O. F.-K. Schlüter and R. Weber, Appl. Catal., A, 2009, 365, 20 CrossRef CAS.
- T. Zhang, C. Troll, B. Rieger, J. Kintrup, O. F.-K. Schlüter and R. Weber, J. Catal., 2010, 270, 76 CrossRef CAS.
- I. W. Sutherland, N. G. Hamilton, C. C. Dudman, P. Jones, D. Lennon and J. M. Winfield, Appl. Catal., A, 2014, 471, 149 CrossRef CAS.
- S. Guan, P. R. Davies, E. K. Gibson, D. Lennon, G. E. Rossi, J. M. Winfield, J. Callison, P. P. Wells and D. J. Willock, Faraday Discuss., 2018, 208, 67 RSC.
- G. E. Rossi, J. M. Winfield, C. J. Mitchell, W. van der Borden, K. van der Velde, R. H. Carr and D. Lennon, Appl. Catal., A, 2020, 594, 117467 CrossRef CAS.
- J.-B. d’Espinose de la Caillerie and J. J. Fripiat, Clays Clay Miner., 1992, 40, 457 CrossRef.
- M. Suárez and E. García-Romero, Appl. Clay Sci., 2006, 31, 154 CrossRef.
- D. Maric, J. P. Burrows and G. K. Moortgat, J. Photochem. Photobiol., A, 1994, 83, 179 CrossRef CAS.
- Handbook of Chemistry and Physics, ed. R. C. Weast, CRC Press, 64th edn, 1984 Search PubMed.
- H. Dropsch and M. Bearns, Appl. Catal., A, 1997, 158, 163 CrossRef CAS.
- T. Lear, N. G. Hamilton and D. Lennon, Catal. Today, 2007, 126, 219 CrossRef CAS.
| This journal is © The Royal Society of Chemistry 2021 |