 Open Access Article
 This Open Access Article is licensed under a
 Creative Commons Attribution 3.0 Unported Licence
Effect of thermal treatment on the stability of Na–Mn–W/SiO2 catalyst for the oxidative coupling of methane†
Dorota
Matras
 *ab,
Antonios
Vamvakeros
cd,
Simon D. M.
Jacques
*c,
Nicolas
Grosjean
e,
Benjamin
Rollins
e,
Stephen
Poulston
e,
Gavin B. G.
Stenning
f,
Hamid R.
Godini
gh,
Jakub
Drnec
i,
Robert J.
Cernik
a and
Andrew M.
Beale
*bcd
*ab,
Antonios
Vamvakeros
cd,
Simon D. M.
Jacques
*c,
Nicolas
Grosjean
e,
Benjamin
Rollins
e,
Stephen
Poulston
e,
Gavin B. G.
Stenning
f,
Hamid R.
Godini
gh,
Jakub
Drnec
i,
Robert J.
Cernik
a and
Andrew M.
Beale
*bcd
aSchool of Materials, University of Manchester, Manchester, Lancashire M13 9PL, UK. E-mail: matras.dorota@gmail.com
bResearch Complex at Harwell, Harwell Science and Innovation Campus, Rutherford Appleton Laboratory, Didcot, Oxon OX11 0FA, UK
cFinden Ltd, Merchant House, 5 East St Helen Street, Abingdon, OX14 5EG, UK. E-mail: simon@finden.co.uk
dDepartment of Chemistry, University College London, 20 Gordon Street, London, WC1H 0AJ, UK. E-mail: andrew.beale@ucl.ac.uk
eJohnson Matthey Technology Centre, Blount’s Court Road, Sonning Common, RG4 9NH, UK
fISIS Neutron and Muon Source, Rutherford Appleton Laboratory, Didcot, OX11 0QX, UK
gTechnische Universität Berlin, Straße des 17 Juni 135, Sekr. KWT-9, D-10623 Berlin, Germany
hDepartment of Chemical Engineering and Chemistry, Eindhoven University of Technology, P.O. Box 513, Eindhoven, The Netherlands
iESRF – The European Synchrotron, Grenoble, 38000 France
First published on 29th January 2020
Abstract
In this study, we investigate the effect of thermal treatment/calcination on the stability and activity of a Na–Mn–W/SiO2 catalyst for the oxidative coupling of methane. The catalyst performance and characterisation measurements suggest that the W species are directly involved in the catalyst active site responsible for CH4 conversion. Under operating conditions, the active components, present in the form of a Na–W–O–Mn molten state, are highly mobile and volatile. By varying the parameters of the calcination protocol, it was shown that these molten components can be partially stabilised, resulting in a catalyst with lower activity (due to loss of surface area) but higher stability even for long duration OCM reaction experiments.
1. Introduction
The large abundance of natural gas has resulted in extensive research on exploring economically viable direct routes for methane conversion into higher value chemicals.1–3 Oxidative coupling of methane (OCM), first introduced by Keller and Bhasin,4 is an example of direct catalytic methane conversion into ethylene, a vital building block in the chemical industry. Despite 30 years of studies on the OCM process investigating the optimal reaction conditions, different reactor designs and catalyst formulations,5–10 there are still limiting factors for the industrial implementation of OCM technology. One of the main challenges in methane activation is related to the fact that the desired products (i.e. ethylene) are more reactive than methane itself, and in the presence of oxygen and at high temperatures they can be easily oxidised to COx species.Multiple catalyst formulations have been tested for the OCM reaction, including alkaline oxides, rare earth metal oxides and transition metal oxides.6,7,11–14 Among them, Na–Mn–W/SiO2 is generally accepted to be one of the most promising catalyst materials, showing high catalytic performance (>20% yield) and long-term stability.15–17 Numerous studies and reviews18–20 have focused on investigating the nature of the active phases/species as well as on determining the optimal catalyst composition, preferred preparation method and the role of catalyst promoters. It should be noted though that there is still much debate regarding the phases/species of the Na–Mn–W/SiO2 catalyst, including two main theories regarding the nature of the active site(s). According to Lunsford and co-workers,21,22 the active site was suggested to contain Na–O–Mn species, with Mn responsible for the activation of gas-phase oxygen, Na suppressing the total oxidation of methane, and W stabilizing the catalyst. On the other hand, Li’s group23,24 proposed a tetrahedral WO4 surface species, with one W![[double bond, length as m-dash]](https://www.rsc.org/images/entities/char_e001.gif) O and three W–O–Si surface bonds as the active sites. It was later suggested by Li and co-workers25 that the OCM reaction incorporates a redox mechanism involving a two-metal site model; the oxygen is activated on the Mn3+/Mn2+ site and methane is activated on the adjacent W6+/W5+ site.26–31 The two-site model was also recently suggested by Wang et al.32 in a study of a TiO2-promoted Na–Mn–W/SiO2 catalyst for the ‘low’ temperature OCM reaction.
O and three W–O–Si surface bonds as the active sites. It was later suggested by Li and co-workers25 that the OCM reaction incorporates a redox mechanism involving a two-metal site model; the oxygen is activated on the Mn3+/Mn2+ site and methane is activated on the adjacent W6+/W5+ site.26–31 The two-site model was also recently suggested by Wang et al.32 in a study of a TiO2-promoted Na–Mn–W/SiO2 catalyst for the ‘low’ temperature OCM reaction.
The interaction between the catalyst support and metal oxides can greatly enhance (or suppress) the catalyst performance and stability. As an example, the presence of Na+ has been reported to be a critical factor in the phase transition of amorphous silica to cristobalite during catalyst calcination.16,33 Generally, the catalyst preparation (i.e. method, protocol and used precursors) is considered to be an important step, providing high catalytic performance through dispersion and stabilisation of catalyst active components.34,35
In the work of Yildiz et al.,36 the effect of different support materials on the Na–Mn–W catalyst was investigated. The authors reported that a silica support showed the best overall performance (selectivity/conversion trade off), however SiC, Fe2O3 and TiO2 were also suggested as promising candidates for supports. Further work by the same research group37,38 focused on investigating the impact of different silica supports on the performance of a Na–Mn–W/SiO2 catalyst. Although all support materials seemed to yield similar specific surface areas for as-prepared Na–Mn–W/SiO2 catalysts, a significant enhancement in performance for the OCM reaction was shown when the catalyst was supported on SBA-15 mesoporous silica (increase in C2+ yield from 3–4% to 10% with stability tests performed over 16 h time on stream). As shown with SEM-EDX mapping, such high performance was due to a more homogenous dispersion of catalyst active components.
The most common preparation method for Na–Mn–W/SiO2 catalysts is incipient wetness impregnation. However, as shown in the study by Wang et al.,16 this method yields catalysts with the active components mainly distributed on the catalyst surface, which may result in the loss of active components during the reaction. In contrast, catalysts prepared via sol–gel and mixture slurry methods led to a more uniform distribution of active components between the catalyst surface and the bulk. The catalyst prepared with the mixture slurry method achieved a similar performance to catalysts prepared via incipient wetness impregnation (C2+ yield ∼20%), while the catalyst prepared with a sol–gel method exhibited a slightly inferior performance (C2+ yield of 15%). In fact, as shown in the study reported by Godini et al.,39 establishing the right sol–gel state in this catalyst preparation method is crucial to ensure its selective performance.
The aim of this study was to investigate the impact of thermal treatment on the activity, selectivity and stability of a Na–Mn–W/SiO2 catalyst under OCM reaction conditions. First, two catalyst samples were prepared with the incipient wetness impregnation method and calcined for 2 and 29 h. The physicochemical properties of both catalysts were investigated with X-ray diffraction (XRD), X-ray fluorescence (XRF) and Brunauer–Emmett–Teller (BET) specific surface area measurements. In addition, the evolution of solid-state chemistry in the Na–Mn–W/SiO2 catalyst was investigated with the X-ray diffraction computed tomography technique (XRD-CT)40,41 during prolonged calcination and under various OCM operating conditions (CH4![[thin space (1/6-em)]](https://www.rsc.org/images/entities/char_2009.gif) :O2 ratio and GHSV). The obtained results helped us design a calcination protocol (i.e. 8 h calcination) that yielded a Na–Mn–W/SiO2 catalyst with lower but stable CH4 conversion for an 80 h long OCM reaction experiment.
:O2 ratio and GHSV). The obtained results helped us design a calcination protocol (i.e. 8 h calcination) that yielded a Na–Mn–W/SiO2 catalyst with lower but stable CH4 conversion for an 80 h long OCM reaction experiment.
2. Experimental section
2.1 Catalyst preparation
The incipient wetness impregnation method used in this work was based upon methods found in the literature.16,42 Manganese nitrate (Sigma Aldrich) was impregnated onto an amorphous silica support (Evonik Industries); the material was then dried in an oven at 105 °C. Next, sodium tungstate (Sigma Aldrich) was impregnated onto the mixture before it was again dried at 105 °C and then calcined at 750 °C for two hours with a ramp rate of 3 °C min−1 in air. Sufficient amounts of precursor were used so that the final catalyst comprised 1.6 wt% manganese and 5 wt% sodium tungstate after calcination.2.2 Catalyst performance testing
A quartz reactor tube (4 mm internal diameter) was used to test 100 mg of the catalyst sample. The total flows calculated for the two studied values of GHSV, 36000 and 72000 mL g−1 h−1, were 60 and 120 sccm, respectively. Pure O2, CH4, and N2 gases were delivered to the reactor (with 5% nitrogen dilution) in three different CH4:O2 ratios (CH4:O2 2:1, 4:1, and 6:1). The catalyst was heated under an atmosphere of Ar up to 780 °C with a temperature ramp of 10 °C min−1, using an electrical tube furnace. The OCM reaction was performed at atmospheric pressure and the outlet gases were analysed by gas chromatography (Varian CP-4900 MicroGC equipped with a thermal conductivity detector (TCD)). The OCM reaction lasted for 30 min under each set of conditions.
2.3 Structure analyses
The specific surface area was determined using a Quadrasorb gas sorption surface area and pore size analyser (Quantachrome) with N2 gas adsorption at 77 K. The BET method was applied to determine the specific surface area. Before the BET measurements, samples were outgassed at 220 °C for 6 h to eliminate adsorbed water from the sample surface. The lowest detectable specific surface area is estimated at 0.01 m2 g−1.The elemental analysis was performed using a PANalytical Epsilon3 XL fluorescence spectrometer with Ag anode and high-resolution Si drift detector. The results of the qualitative analysis were obtained with the Omnian package. The microstructure analyses were performed with recovered samples from the laboratory measurements.
Laboratory XRD measurements were performed in the Bragg–Brentano geometry with a Rigaku Miniflex 600 powder X-ray diffractometer (Cu Kα). The angular range covered was 10–80° 2θ with a step size of 0.02° (acquisition speed of 1.2° min−1).
2.4 Operando XRD-CT
The zigzag XRD-CT and interlaced XRD-CT (IXRD-CT) measurements43 were performed at station ID31 at the ESRF using a monochromatic beam of 70 keV with a size of 20 μm × 20 μm. For both experiments, the sample was scanned with 160 angular steps (with angular step size of 1.125°) and 224 translation steps (with translation step equal to the beam size) covering in total 4.48 mm. The obtained reconstructed images of the reactor consisted of 224 × 224 pixels, with a pixel size of 20 μm. Diffraction patterns were collected using a PILATUS3 X CdTe (Dectris) area detector. Calibration of the detector was performed using a CeO2 NIST standard. All collected 2D diffraction images were radially integrated (to 1D powder diffraction patterns) using the PyFAI software,44 using a trimmed mean filter (20%)45 to remove artefacts due to hot spots of crystalline material. The reconstructed diffraction data were obtained using the filtered back projection algorithm. For both experiments the XRD-CT data were corrected for beam decay using the air scatter signal. A photograph of the set up used during this experiment is presented in Fig. 1.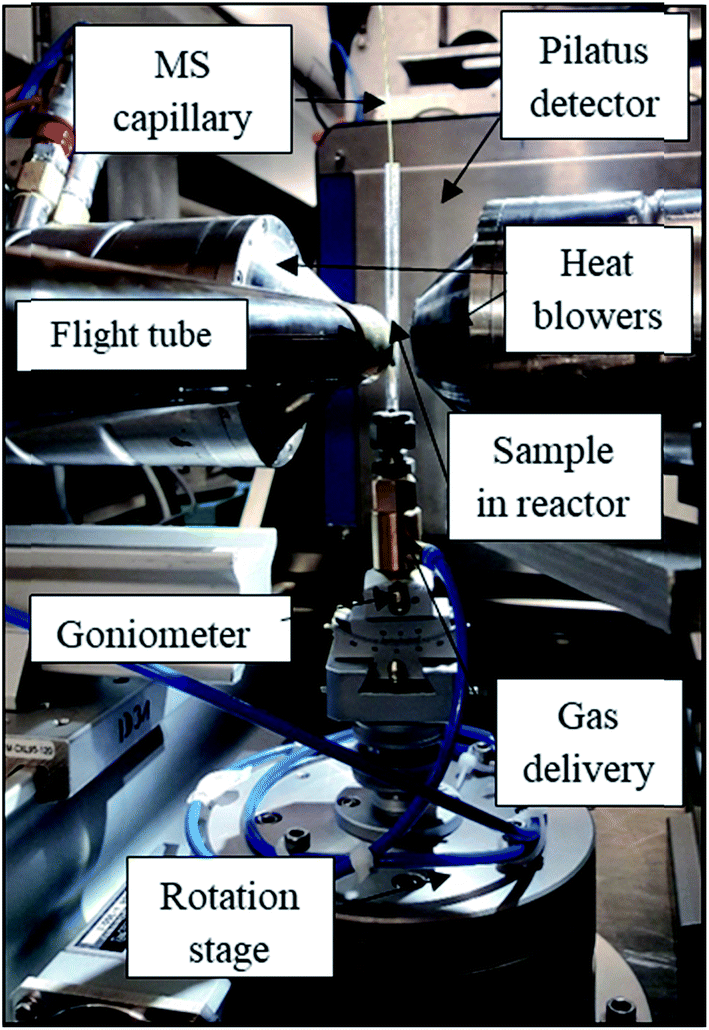 | ||
| Fig. 1 Photograph of the setup used for the experiment at ID31 at the ESRF. | ||
30 mg of catalyst were loaded into a quartz tube reactor (external diameter 4 mm, internal diameter 2.5 mm) to form an 8 mm long catalyst bed, supported by glass wool. Pure O2, CH4, and He gases were delivered to the reactor by mass flow controllers (Brooks). The total flows calculated for the two studied values of GHSV, 36000 and 72000 mL g−1 h−1, were 18.2 and 36.5 sccm, respectively. The catalyst was heated under an atmosphere of He (18.2 sccm) up to 780 °C with a temperature ramp of 20 °C min−1, using two air gas heat blowers (Cyberstar). After reaching the required high temperature, the catalyst was first treated with a pure CH4 stream for the duration of one XRD-CT measurement (25 min) and then left under an atmosphere of He for 27 h of prolonged re-calcination. The OCM reaction was performed at atmospheric pressure and the outlet gases were analysed by mass spectrometry using an Ecosys portable mass spectrometer. Two different values of GHSV (36000 and 72000 mL g−1 h−1) as well as different ratios of CH4:O2 (2:1, 4:1, and 6:1) were tested for the OCM conditions (for experimental protocol see Fig. S1 in the ESI†). When changing the CH4:O2 ratio and GHSV, a time period of 5 min was used for catalyst stabilization before acquiring data.
2.5 Long-term performance testing
A quartz reactor tube (4 mm internal diameter) was used to test 85 mg of the catalyst samples (with the initial calcination protocol of 2 h and extended calcination protocol of 8 h). Pure O2, CH4, and Ar gases were delivered to the reactor (with 32.5% Ar dilution) in CH4:O2 ratio 8:1. The total gas flow calculated for the studied GHSV of 54000 mLCH4 g−1 h−1 (90000 mL g−1 h−1) was 150 sccm. The catalyst was heated under an atmosphere of Ar up to 900 °C with a temperature ramp of 10 °C min−1 using an electrical tube furnace. The OCM reaction was performed at atmospheric pressure and the outlet gases were analysed by gas chromatography (Varian CP-4900 MicroGC equipped with a thermal conductivity detector (TCD)).
3. Results and discussion
3.1 Effect of calcination protocol on the catalyst structure
Initially, two Na–Mn–W/SiO2 catalyst samples were prepared using two different calcination periods (2 vs. 29 h) and tested under OCM reaction conditions. The results from the laboratory catalyst performance experiments are presented in Fig. 2. One of the catalysts (named here IWI 29 h) was kept under an atmosphere of He for 27 h before introducing the reactive gases (total calcination time of 29 h, Fig. S1†). The second catalyst (named here IWI 2 h) was directly exposed to the OCM reaction mixture upon reaching the operating temperature (total calcination time of 2 h; see also the preparation protocol section).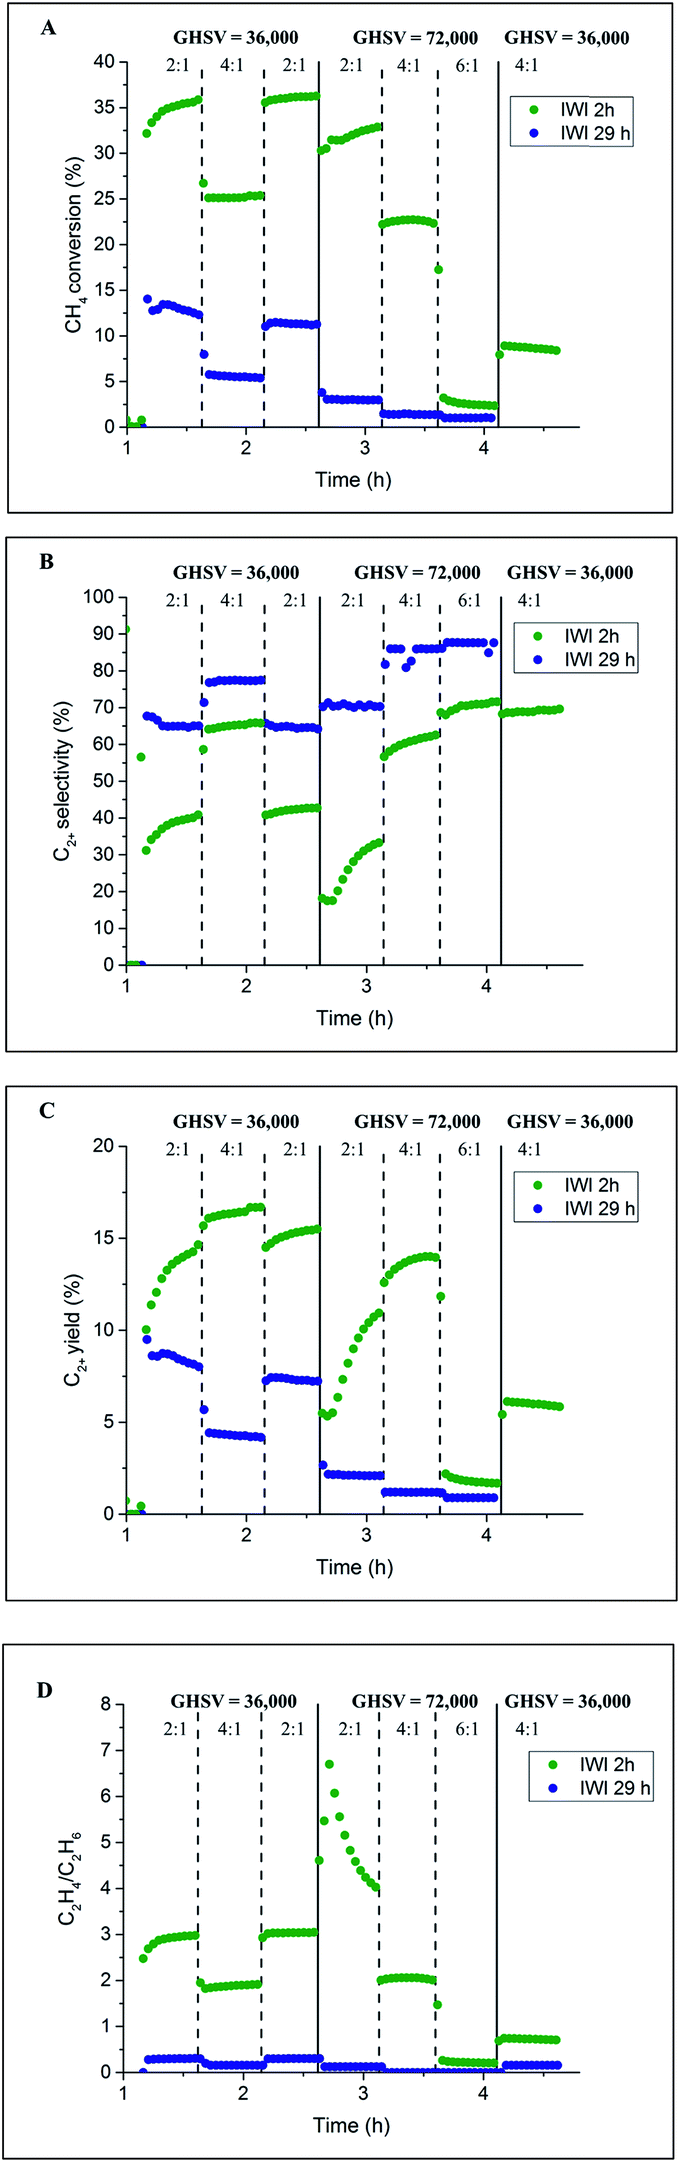 | ||
| Fig. 2 Influence of prolonged calcination on the catalyst performance. Panel A: methane conversion, panel B: C2+ selectivity, panel C: C2+ yield and panel D: C2H4/C2H6 ratio. | ||
According to the laboratory measurements, the prolonged calcination protocol had a significant impact on the catalyst performance. More specifically, prolonged calcination resulted in a less active catalyst (35% CH4 conversion for IWI 2 h as opposed to 12.5% for IWI 29 h). However, the initial high conversion of CH4 for the IWI 2 h catalyst decreased over time (a decrease in CH4 conversion from 25% to 10%), suggesting that this catalyst was not stable under the imposed temperature and chemical environment (highly reducing reaction mixture); the most significant decrease in CH4 conversion was observed for the reaction conditions with CH4:O2 ratio equal to 6:1. Regarding the C2+ selectivity, the IWI 29 h catalyst was shown to be more selective towards C2+ molecules (∼70% selectivity for IWI 29 h and ∼40% for IWI 2 h) but the ratio of C2H4/C2H6 was higher for the IWI 2 h catalyst. The overall trends in CH4 conversion and C2+ selectivity were seen to depend on the applied OCM reaction conditions (CH4:O2 ratio and GHSV), an observation which is in agreement with previous studies.12,14
The IWI 2 h and IWI 29 h catalyst samples were characterised before and after the OCM experiments with XRD, XRF and BET. The results from the specific surface area measurements of the four Na–Mn–W/SiO2 catalyst samples are presented in Table 1. Clearly, the temperature treatment, including both the prolonged calcination and the OCM reaction conditions, led to a decrease in the catalyst surface area. The observed difference in the performances of the two Na–Mn–W/SiO2 catalysts, particularly regarding the CH4 conversion (Fig. 2A), was most likely caused by the decrease in surface area during the prolonged calcination protocol. At high temperatures, the silica support is expected to evolve into the crystalline polymorphs of cristobalite, tridymite and quartz.46–49 It is important to note that after exposure to the OCM reaction conditions, the surface areas of both samples decreased below 1 m2 g−1 (close to the BET detection limit).
| Catalyst | Before OCM (m2 g−1) | After OCM (m2 g−1) |
|---|---|---|
| IWI 2 h | 3.5 | 0.1 |
| IWI 29 h | 1.4 | 0.5 |
The recovered catalyst samples were also examined with X-ray fluorescence (which in contrast to XRD captures also the amorphous species) in order to determine their elemental compositions; the results obtained from the semi-quantitative analysis are presented in Table 2 while the XRF spectra are shown in Fig. 3. It should be noted that the presence of Na could not be determined with these measurements.
| Catalyst | Before OCM | After OCM | ||
|---|---|---|---|---|
| Mn | W | Mn | W | |
| IWI 2 h | 1 | 1 | 0.96 | 0.64 |
| IWI 29 h | 0.99 | 0.91 | 1.06 | 0.93 |
 | ||
| Fig. 3 XRF spectra of Na–Mn–W/SiO2 catalysts calcined for 2 h and 29 h before and after the OCM reaction. | ||
The main difference in elemental composition between the four Na–Mn–W/SiO2 catalyst samples was related to the quantity of the W-containing species. The IWI 2 h catalyst sample recovered after the OCM experiment contained less W species than the spent IWI 29 h catalyst sample. This observation is also confirmed by examining the spent reactor tubes (Fig. 4). The quartz reactor with the IWI 2 h catalyst contained brown deposits at the reactor outlet which were identified as Na–W–O species with XRD (Fig. 4), whereas no brown deposits were observed in the other reactor (containing the IWI 29 h catalyst). From these measurements it can be concluded that the prolonged calcination had a positive effect on the stabilisation of W species that are otherwise partially lost under the applied OCM reaction conditions (IWI 2 h catalyst).
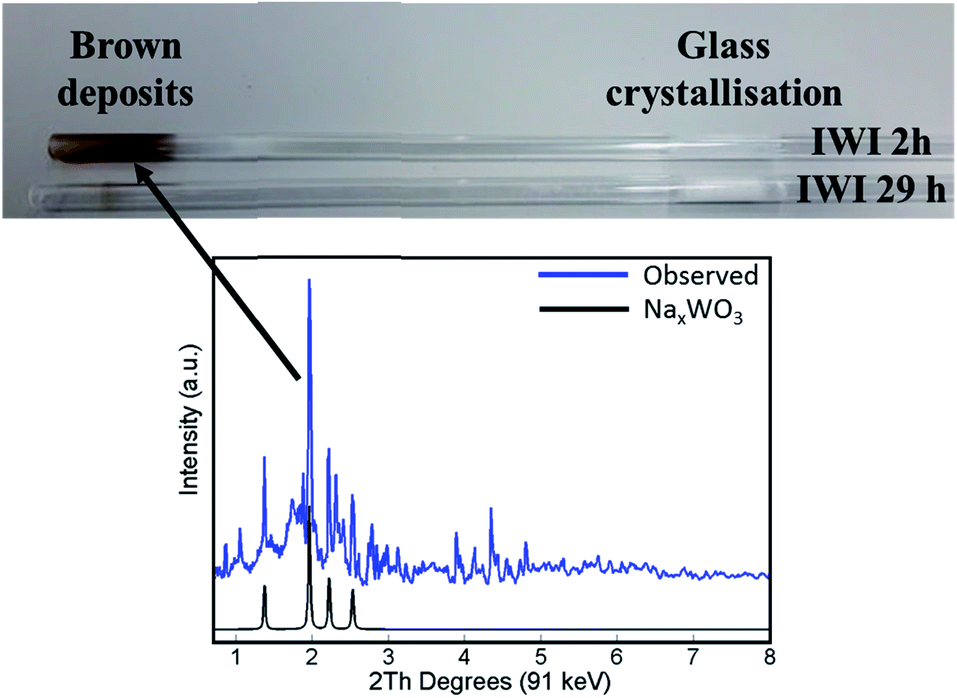 | ||
| Fig. 4 Top panel: photograph of reactor tubes after laboratory catalyst performance testing with the two Na–Mn–W/SiO2 catalysts (IWI 2 h and IWI 29 h). Bottom panel: diffraction pattern of the brown deposits from the reactor tube collected by point XRD measurement (blue) and simulated diffraction peaks of the NaxWO3 phase based on the intensities reported by Bamberger and Kopp50 (black). | ||
3.2 Operando imaging during the prolonged calcination and the OCM reaction with Na–Mn–W/SiO2 catalyst
An operando XRD-CT experiment was performed while applying the prolonged calcination (29 h) and the OCM reaction conditions protocol in order to gain a better understanding of the state of the W species and indeed the Na–Mn–W/SiO2 catalyst under the aforementioned conditions. The initial composition of the as-prepared catalyst consisted of: SiO2 cristobalite (88%), SiO2 tridymite (6%), Mn2O3 (2.6%) and Na2WO4 (2.6%). The quantitative analysis (Fig. S2 in the ESI†) as well as the spatial distribution of the catalyst components collected at room temperature (Fig. 5, first column) clearly demonstrate that the catalyst support was mainly present in the form of SiO2 cristobalite and that only a few particles contained a minor amount of SiO2 tridymite. The distributions of Na2WO4 and Mn2O3 phases were not perfectly correlated with each other; their distributions were seen mainly as discrete regions in the catalyst particles.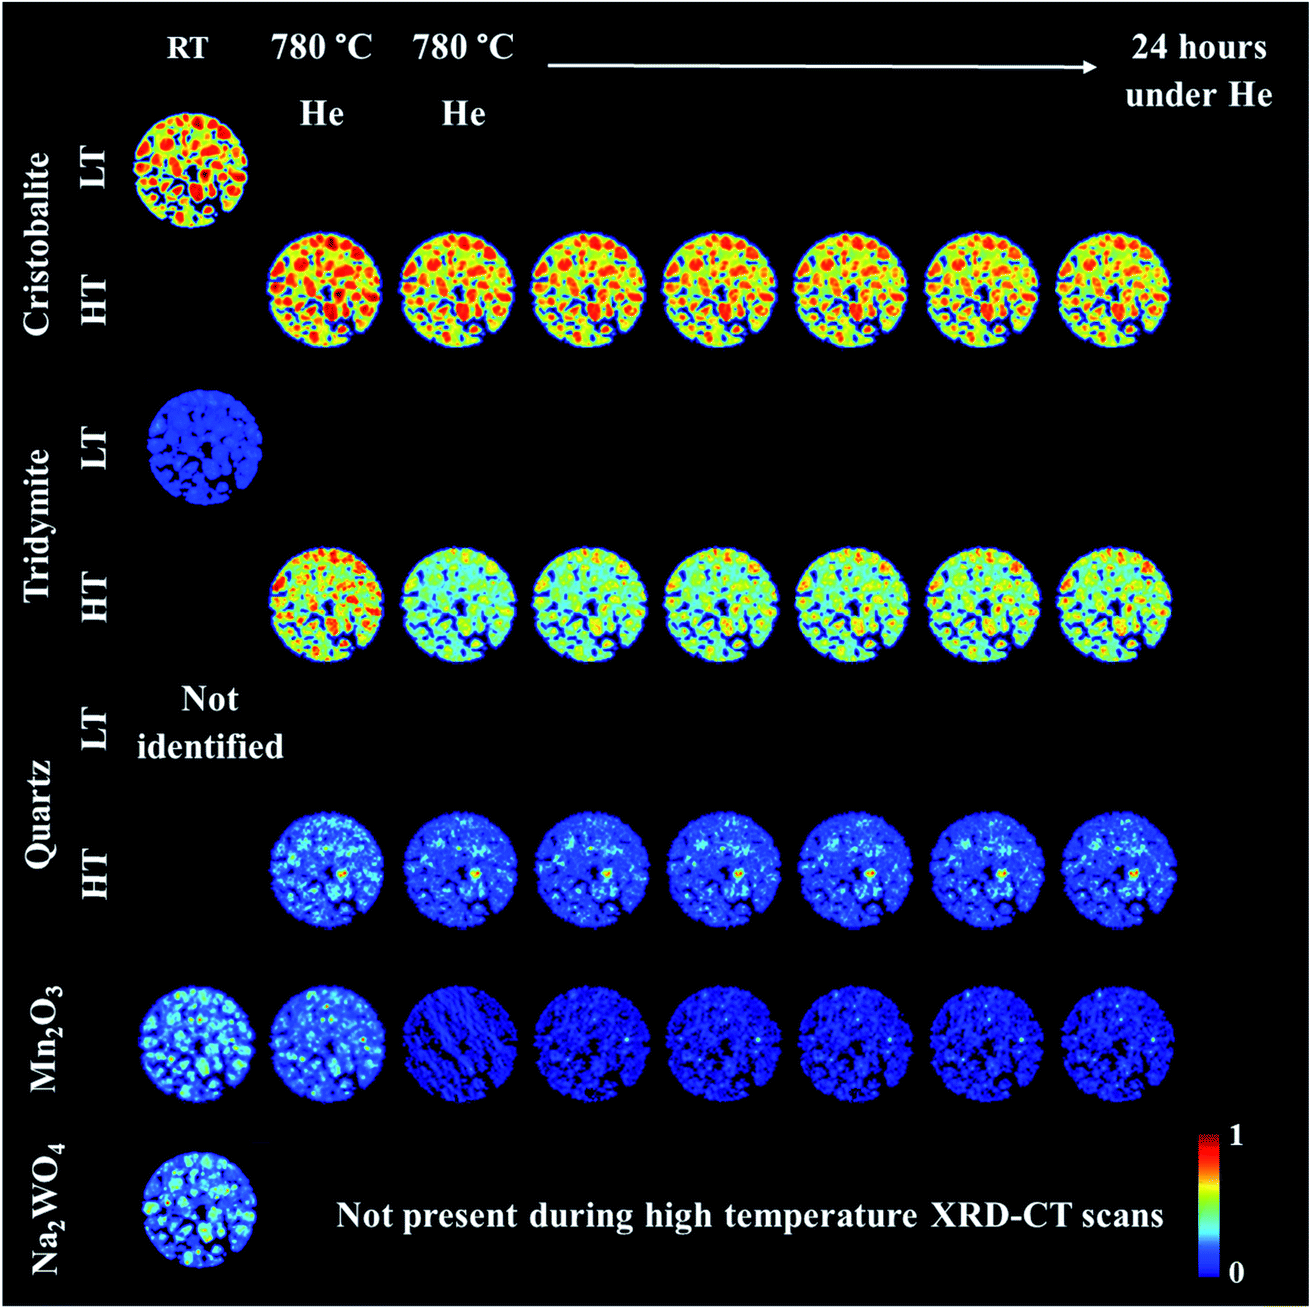 | ||
| Fig. 5 Spatial distribution of catalyst crystalline components: cristobalite, tridymite, quartz (SiO2), Mn2O3 and Na2WO4 during the preparation of the IWI catalyst, as obtained from Rietveld analysis. The images were obtained through normalising the scale factors to the maximum value observed over the entire experiment. | ||
During the temperature ramp to 780 °C under He, SiO2 cristobalite and SiO2 tridymite transformed into their high temperature polymorphs (tetragonal → cubic and monoclinic → hexagonal, respectively46–49). Here the transition between the tetragonal and cubic polymorphs of SiO2 cristobalite was observed at ca. 200 °C (Fig. S3†). The transition between the monoclinic and hexagonal polymorphs of SiO2 tridymite was not as clearly visible in the diffraction pattern as in the case of SiO2 cristobalite due to the presence of only a few characteristic peaks belonging to SiO2 tridymite (112 and 204 reflections).
Additionally, during the temperature ramp, the Na2WO4 phase disappeared. As previously reported, this component is expected to melt at around 680 °C.43 However, its complete disappearance was preceded by the formation and decomposition of a high temperature orthorhombic polymorph (Fig. S4†).43 After reaching the OCM operating temperature, the quantity of Mn2O3 was also found to decrease. Regarding the SiO2 polymorphs, at high temperature a material hot spot of SiO2 quartz was observed to form in the middle of the catalyst cross section. The catalyst was left under He at 780 °C for 27 h before the introduction of the OCM reaction mixture.
The prolonged calcination under He over 27 h resulted in significant solid-state changes with respect to the catalyst support (Fig. 6, first column and Fig. S5 and S6 in the ESI†). The previously present cristobalite transformed into tridymite and quartz, whereas the quantity of Mn2O3 phases became non-significant. During the OCM reaction, the main changes corresponded to a gradual increase in the amount of tridymite with a simultaneous decrease in the amount of cristobalite.
 | ||
| Fig. 6 Spatial distribution of SiO2 crystalline phases: cristobalite, tridymite, quartz, Mn2O3, Na2WO4 and Na6WO6 during the OCM reaction with the IWI catalyst, as obtained from Rietveld analysis. The images were obtained through normalising the scale factors to the maximum value observed over the entire experiment. The plots on the right correspond to temporal changes in the scale factors over the entire duration of the experiment (i.e. encompassing XRD-CT scan time points from Fig. 5 and 6). | ||
Finally, the reactor was cooled to room temperature, and the spent catalyst consisted of the SiO2 polymorphs cristobalite, tridymite and quartz (in their low temperature forms) as well as Mn2O3, Na2WO4 and Na6WO6 (Fig. S7†). Both Na–W–O species could not be observed during the high temperature XRD-CT scans but they reappeared after cooling to room temperature (these species solidified from a molten state during cooling). The final composition of the catalyst consisted of cristobalite (42%), tridymite (51%), quartz (3%), Mn2O3 (2.6%), Na2WO4 (0.9%) and Na6WO6 (1%). Overall, when comparing the composition of the catalyst before and after the OCM experiment (Fig. 7), we conclude that a partial loss of Na–W–O species and Mn2O3 phase occurred during the reaction. More specifically, we observed a strong interaction of the catalyst material with the reactor vessel (Fig. S8†). Due to the high mobility and volatile nature of the Na+ species at high temperatures (above 700 °C), the Na–W–O species left the catalyst bed and migrated towards the reactor vessel, where amorphous silica crystallised.51
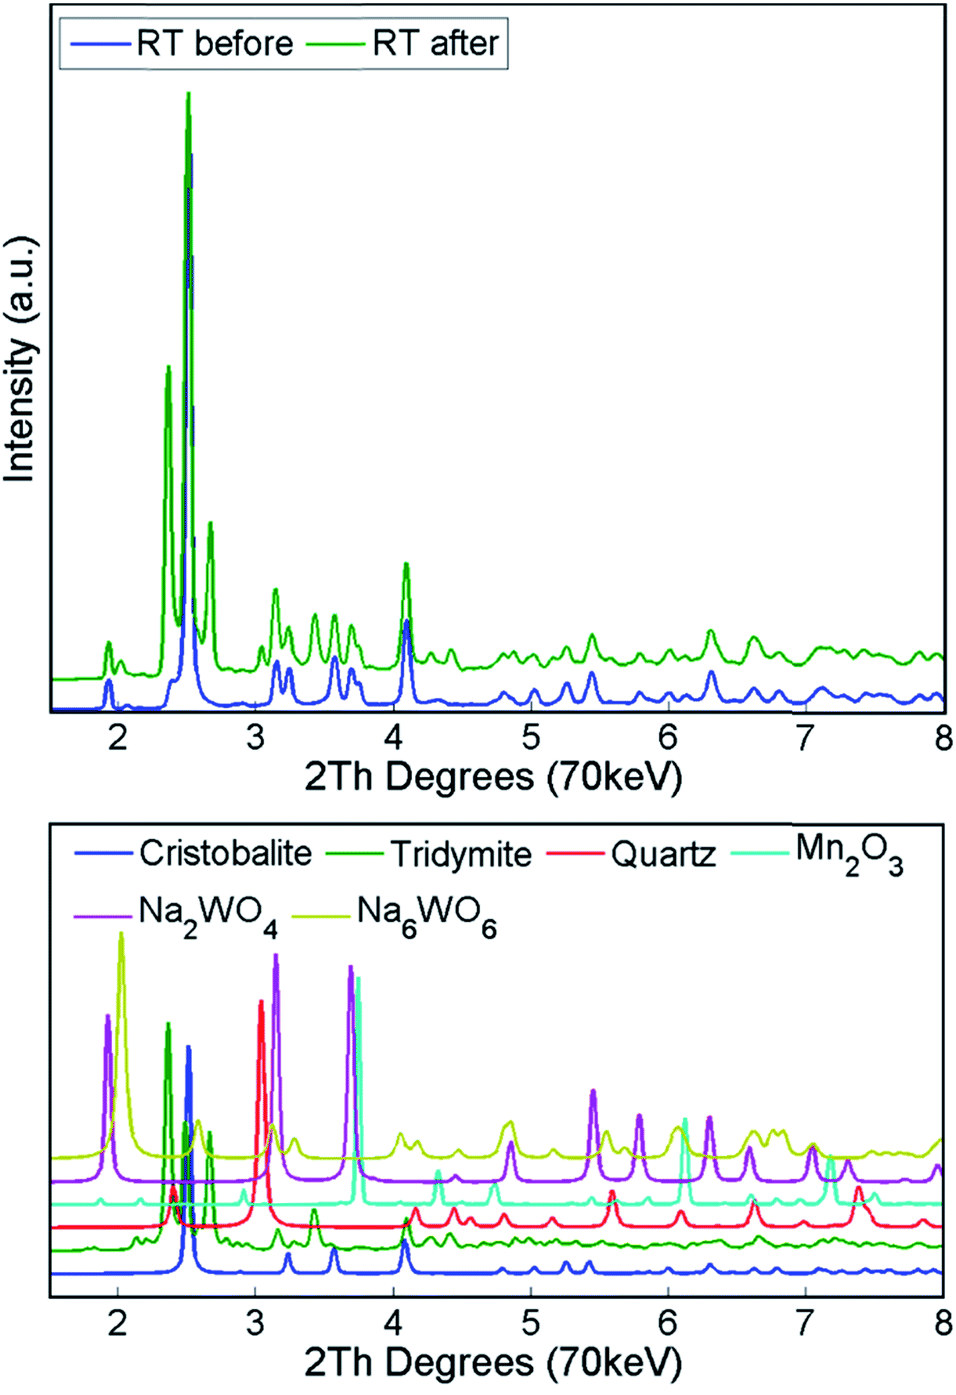 | ||
| Fig. 7 Top panel: diffraction patterns of Na–Mn–W/SiO2 catalyst (IWI) collected at room temperature before and after the OCM reaction. Bottom panel: simulated diffraction patterns for crystalline phases present in the catalyst. | ||
Regarding the spatial distribution of the catalyst components in the collected cross section, the cristobalite and tridymite polymorphs were uniformly distributed in the catalyst particles whereas quartz was only present in a few particles, albeit in high concentration. The Na2WO4 and Mn2O3 phases maintained their previous distributions (i.e. not homogeneously distributed over the catalyst particles). The XRD-CT measurements showed that the evolution of the silica support at high temperatures (i.e. regardless of calcination or OCM operating conditions) is inevitable and the catalyst support is susceptible to a decrease in surface area as a result of the cristobalite transformation to other crystalline silica polymorphs (i.e. tridymite and quartz). At the same time, under the OCM reaction conditions, the catalyst active components are present in a molten state (not detectable with X-ray diffraction) and therefore important interactions can occur between these components that are bound to have an effect on the catalyst activity and stability.52
The catalyst performance during the OCM reaction was monitored with mass spectrometry analysis and the results are presented in Fig. 8. The conversion of CH4 depended on the applied OCM conditions; higher CH4:O2 ratio led to lower CH4 conversion. At the same time, the catalyst converted less CH4 at higher GHSV (lower contact times). For higher CH4:O2 ratios, the production of combustion products (CO2 and CO) was lower, and in addition doubling the total flow of gases again resulted in overall lower production of combustion products.
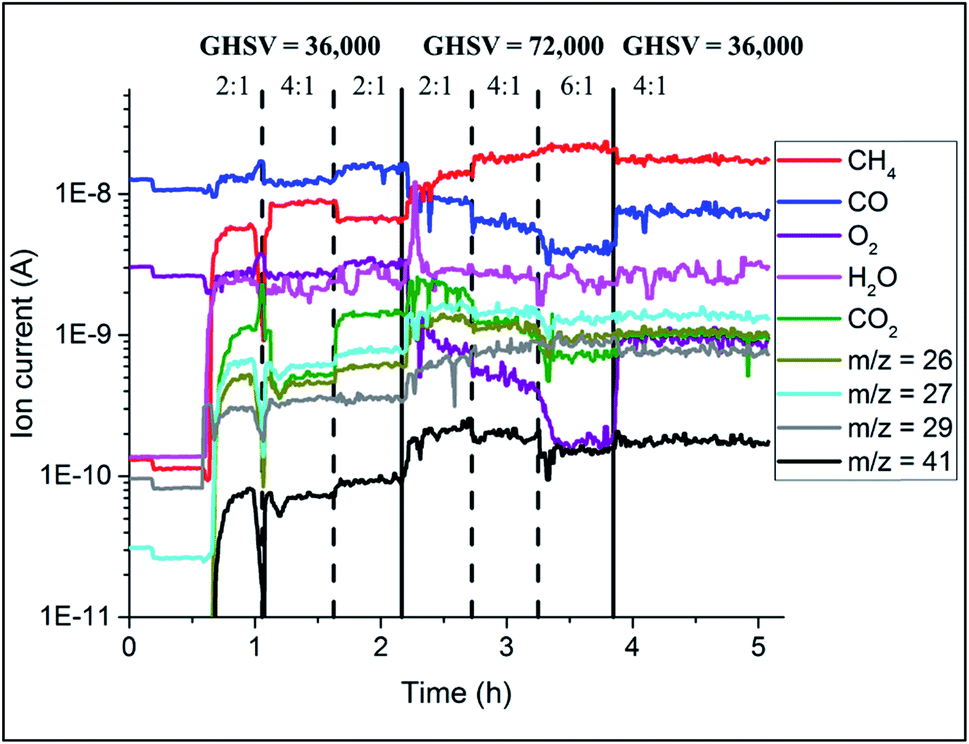 | ||
| Fig. 8 Results of mass spectrometry during the OCM reaction collected during operando XRD-CT measurements at 780 °C on the Na–Mn–W/SiO2 catalyst (IWI). | ||
3.3 Long-term performance testing
From the previous section we conclude that the calcination protocol has an important effect on the stability and activity of the Na–Mn–W/SiO2 catalyst. Although the longer calcination time yields a catalyst with lower surface area and therefore lower CH4 conversion, its stability could be significantly improved by stabilising the W-containing species. Therefore, it was proposed to compare the activity and stability of Na–Mn–W/SiO2 catalysts prepared with two different calcination protocols (calcination for 2 h vs. calcination for 8 h) over a longer operating time and under highly reducing OCM reaction conditions (CH4:O2 ratio 8:1). It should be also emphasised that in this case, the two samples were calcined in air (calcination inside a furnace) to investigate the impact of the calcination atmosphere.
The catalyst performance results from two 80 h long OCM experiments are presented in Fig. 9. For both catalysts, the CH4 conversion decreased during the first several hours of operation, which is in agreement with the previously performed laboratory tests (Section 3.1). After around 20 h of operation, the CH4 conversion for the catalyst calcined for 8 h stabilised and remained constant until the end of the experiment at a level of 8%. However, in the case of the catalyst calcined for 2 h, the CH4 conversion gradually decreased from the beginning of the experiment (16%) to the end of the experiment (6%). These catalytic measurements showed that a beneficial effect of prolonged calcination can be observed after long operation (here 65 h) for the applied operating conditions. The selectivity for C2+ molecules was seen to be relatively stable for the duration of both experiments: 80% for the catalyst calcined for 2 h and 45% for the catalyst calcined for 8 h. Both C2+ yield and C2H4/C2H6 ratio demonstrated a similar trend to CH4 conversion for the two studied catalysts; at the end of the experiment, the C2H4/C2H6 ratio was found to be around 1, and the C2+ yield was between 4% and 5% for both materials.
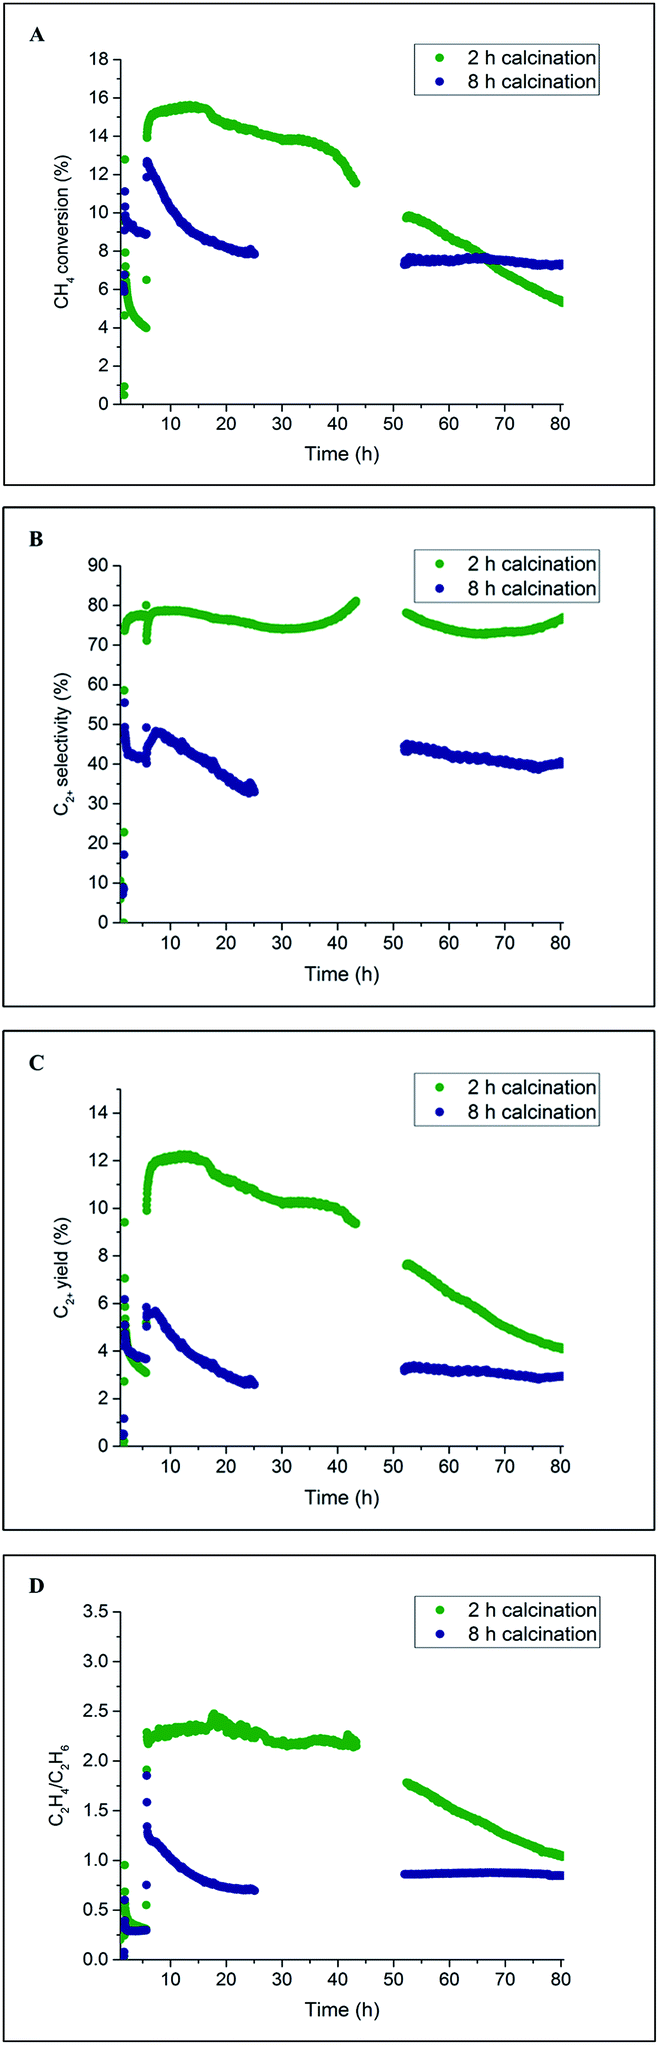 | ||
| Fig. 9 Influence of prolonged calcination on the catalyst performance over long operation time (80 h). Panel A: methane conversion, panel B: C2+ selectivity, panel C: C2+ yield and panel D: C2H4/C2H6 ratio. Note: for both catalyst samples the reaction was run consecutively for 80 h, despite the lack of performance data. | ||
The structural changes in both samples were investigated ex situ with XRD and XRF. After long operation under OCM reaction conditions, both samples showed significant evolution of the silica support from cristobalite to tridymite and a minor amount of the quartz phase (Fig. 10). In addition, neither Na2WO4 nor Mn2O3 were observed in the recovered samples of both catalysts. At the same time, the samples contained minor amounts of MnWO4 (marked with circles in Fig. 10), and an additional peak was observed that could potentially be associated with Na–W–O species (marked with star in Fig. 10).
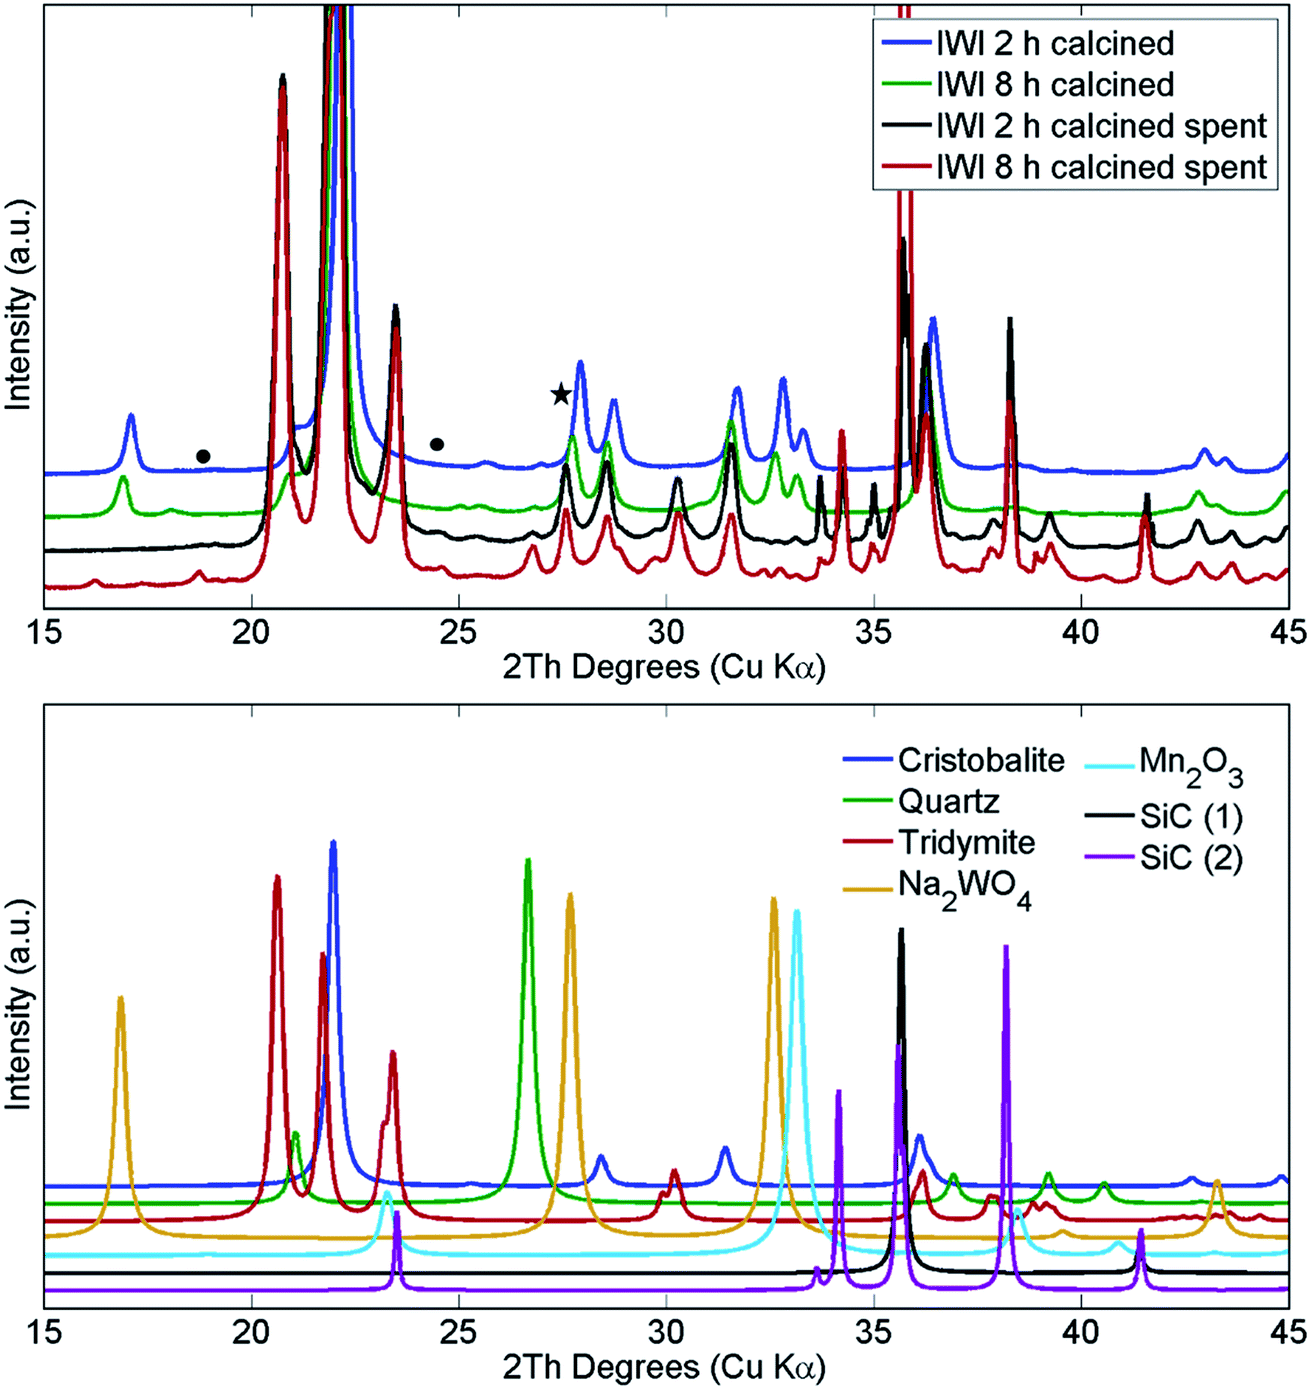 | ||
| Fig. 10 Comparison of X-ray diffraction patterns of two Na–Mn–W/SiO2 catalysts calcined for 2 h and 8 h before and after the OCM reaction. SiC was used for dilution of the catalyst bed. | ||
Similarly, the XRF measurements showed a significant decrease in quantity of both W and Mn species in both samples (Fig. 11 and Table 3). However, the catalyst calcined for 8 h was shown to contain more W species than the catalyst calcined for 2 h, which could explain the difference in CH4 conversion for these two materials. An analysis of the spent reactor tubes from these two experiments showed similar behaviour as in the case of the shorter duration laboratory tests presented in Section 3.1; brown deposits of Na–W–O species were found at the outlet in the reactor containing the catalyst calcined for 2 h (Fig. S9†). These results showed that under highly reducing OCM reaction conditions (CH4:O2 ratio equal to 8:1), the catalyst samples underwent substantial reduction (bulk reduction of the Mn species) and loss of active components, despite the attempt to stabilise the W species through the prolonged calcination protocol. The resulting catalysts were still active for the OCM reaction, however this also suggests that the catalyst stability can only be improved using the new thermal treatment under optimal reaction conditions.
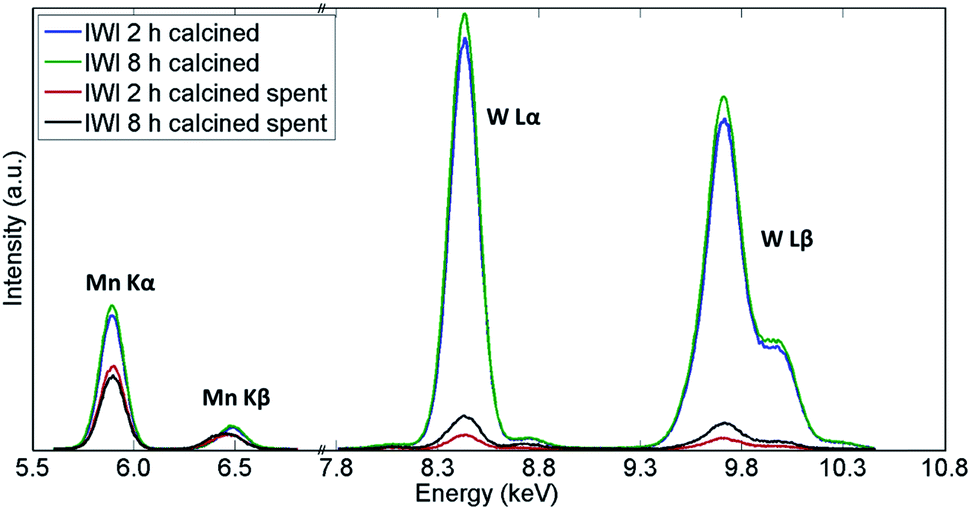 | ||
| Fig. 11 Comparison of X-ray fluorescence spectra of two Na–Mn–W/SiO2 catalysts calcined for 2 h and 8 h before and after the OCM reaction. | ||
| Catalyst | Before OCM | After OCM | ||
|---|---|---|---|---|
| Mn | W | Mn | W | |
| IWI 2 h | 0.93 | 0.94 | 0.65 | 0.03 |
| IWI 8 h | 1 | 1 | 0.68 | 0.07 |
4. Discussion
In this study it was shown that the Na–Mn–W/SiO2 catalyst is susceptible to deactivation under OCM reaction conditions, due to both the high temperature of the reaction and the reducing environment. One of the reasons behind the deactivation of this family of catalysts has been previously suggested to be associated with the preparation method; catalysts prepared via the incipient wetness method have been shown to be prone to fast deactivation due to inhomogeneous distribution of the active components between the catalyst surface and the bulk (higher concentration at the catalyst surface).16 However, as shown in previous studies, the stability of the catalyst can be improved by using a high surface area support or by applying different metal precursors.35–37 It is interesting to note that previous studies suggest that the initial support material and the preparation of the catalyst play an important role in the catalyst activity and stability despite the inevitable transformation of amorphous silica into crystalline phases, and thus the decrease in surface area, at high temperatures.18,33,53In this work, it is shown that prolonged calcination improves the stabilisation of the W species. As shown in Fig. 2, the loss of W species during the OCM reaction can be directly associated with a decrease in CH4 conversion (catalyst calcined for 2 h). A significant decrease in CH4 conversion and partial catalyst deactivation was observed for the reaction mixture with high CH4:O2 ratio (6:1). These results suggest that the W species are part of the catalyst active sites responsible for CH4 activation. This suggestion is further supported by the results from the long duration OCM experiment performed under highly reducing conditions (CH4:O2 ratio 8:1) where the catalysts lost significant amounts of W species. The higher CH4 conversion for the catalyst calcined for 8 h when compared to the catalyst calcined for 2 h can be explained by the difference in the amount of W species preserved in the catalyst structure (Fig. 11). In addition, the highly reducing reaction mixture led to the bulk reduction of Mn species (Mn2O3 reduced to MnWO4 as seen with XRD) and the partial loss of Mn species (seen with XRF), but to a lower extent than W species. These observations show that although the prolonged calcination protocol was applied to one of the catalyst materials, the highly reducing OCM reaction conditions have an overall negative effect on catalyst stability regarding both W and Mn species which cannot be fully stabilised through the new thermal treatment protocol.
As shown from the operando XRD-CT measurements (Fig. 5 and 6), the main solid-state changes taking place in the Na–Mn–W/SiO2 catalyst structure during the calcination and OCM reaction were related to the evolution of the SiO2 support. Initially, the SiO2 support was present as cristobalite with a small quantity of tridymite. During the calcination under He atmosphere and at high temperature (i.e. 780 °C), almost half of the cristobalite transformed into tridymite and small amounts of quartz. This transition was temperature driven and mainly dependent on the time on stream, rather than the applied conditions. With the further transition of cristobalite to tridymite and quartz, the surface area of the catalyst is expected to decrease, however it still remains comparable with the surface area of the catalyst containing only cristobalite.16,22,53 The evolution of the catalyst support is also in agreement with long-term stability tests performed by Wang et al.,16 where the catalyst was found to contain large amounts of quartz and tridymite after 500 h time on stream.
During the calcination and under the operating conditions, none of the catalyst active components were present in the collected diffraction patterns. Specifically, the Na–W–O species could only be observed at room temperature, before and after the OCM reaction. During the temperature ramp, the Na–W–O species melted at around 650 °C26,43,54 and this was preceded by the transition of cubic Na2WO4 into the orthorhombic polymorph Na2WO4 at around 560 °C.43,55,56 As suggested previously, the Na+ species play an important role, acting as both structural promoters (facilitating the crystallisation of amorphous silica33) and chemical promoters, participating in the dispersion of W–O active species sites over the catalyst particles. However, as the active components are present in a molten state, more specialised techniques need to be applied to elucidate the role of Na species. After cooling to room temperature, the Na–W–O species crystallised into two different crystallographic forms: (1) cubic Na2WO4 and (2) Na6WO6 with possible trigonal symmetry. In the diffraction pattern, only one characteristic reflection can be associated with the second Na–W–O phase, and in previous studies it was identified as Na4WO526,36 (only suggested, no refinement analysis performed). However, in this work, the refinement of the created model containing the proposed phase did not lead to a satisfactory fit, therefore we proposed using another phase in the model, based on the trigonal Li6TeO6. The appearance of the secondary crystalline Na–W–O phase at room temperature suggests that the molten Na–W–O species are mobile at the OCM operating temperature (i.e. 780 °C) and can form different compounds containing the catalyst active components. However, at high temperatures the Na–W–O species also become volatile, and with the flow of gases through the reactor they migrate both in the catalyst bed and towards the reactor vessel (crystallisation of amorphous silica observed during the prolonged calcination).
During the operando XRD-CT measurements, we also observed the partial disappearance of crystalline Mn2O3, possibly due to the reduction of Mn3+ to Mn2+26,29,57,58 with high temperature treatment and/or reducing environment. However, neither the Mn3+ nor Mn2+ species were present in the diffraction data, suggesting that these active species are also present in a molten or amorphous state.36 The ex situ XRF measurements indicated that the Mn species were almost fully preserved after the OCM experiment (Fig. 3), whereas the XRD-CT measurements showed only partial reappearance of Mn2O3. This would suggest that at room temperature the Mn species are crystallised together with the new Na–W–O phase. However, as shown by the long term OCM experiment, the Mn species are susceptible to leaving the catalyst structure when the OCM reaction is performed with a highly reducing reaction mixture. This phenomenon was seen to be more apparent for the W species, suggesting a better interaction between the Mn and the silica support (most likely through the formation of a MnMn6SiO12 phase that cannot be distinguished from Mn2O3 with XRD measurements).
5. Summary and conclusions
In this study, we presented a thorough investigation on the effect of thermal treatment on the activity–stability relationship in Na–Mn–W/SiO2 for the oxidative coupling of methane. Under operating temperatures (i.e. 780 °C), an evolution of the silica support was observed with real-time XRD-CT measurements; cristobalite transformed into tridymite and quartz. The evolution of the silica support (from amorphous to various crystalline phases) is responsible for the decrease in catalyst surface area. In addition, at high temperatures the active catalyst components were present in a molten state form containing W, Mn and most likely Na species. The presence of W species was seen to be directly related to CH4 conversion, as the loss of W species led to lower CH4 conversion. It was also shown that the loss of activity predominantly occurs with OCM reaction mixtures with high CH4:O2 ratios (6:1 and higher). The stabilisation of W species can be improved by applying a longer calcination protocol, however there is a trade-off between the stability and the surface area of the Na–Mn–W/SiO2 catalyst (i.e. longer calcination times result in lower specific surface area and thus lower CH4 conversion). The atmosphere in which the calcination is performed was found to influence the catalyst selectivity. More specifically, performing the calcination under neutral gas atmosphere yielded a catalyst with higher selectivity for C2+ molecules. This could be attributed to an enhanced interaction between the W and reduced Mn species, as the Mn species remain in the oxidised form of Mn2O3 when the calcination is performed in air. It is suggested that the catalyst calcination protocol plays an important part in establishing the best interaction between the molten active components and the catalyst support, yielding a stable and active catalyst for the OCM reaction. The current study found that the preferred calcination protocol includes thermal treatment under inert atmospheres for longer than 2 h, and that the OCM reaction should be performed with a CH4:O2 ratio less than 6:1 in order to extend the catalyst lifetime. However, future experiments should focus on investigating thoroughly the following: (1) duration of the calcination protocol, (2) gas atmosphere composition during the calcination step, (3) ramp rates during the calcination step. Optimising these experimental conditions is of utmost importance to yield a catalyst that exhibits both stability and high performance. It should be emphasised though that understanding the complex relationships between the performance of this multi-component catalyst and its structure/chemistry is of equal importance. In order to fully elucidate the state and composition of the catalyst active site(s), future operando measurements should include X-ray pair distribution function analysis and X-ray absorption fine structure spectroscopy targeting both Mn and W.
Author contributions
Experimental plan: D. M., S. D. M. J., H. R. G. and A. M. B.; Material preparation: N. G., B. R. and S. P.; Synchrotron measurements: D. M., A. V. and S. D. M. J.; Beamline support: J. D.; Laboratory measurement support: G. B. G. S.; Data analysis: D. M. and A. V.; Original draft preparation: D. M and A. V.; Manuscript review: all authors; Supervision: S. D. M. J., R. J. C. and A. M. B.; Funding acquisition: S. D. M. J. and A. M. B.Conflicts of interest
There are no conflicts to declare.Acknowledgements
This project has received funding from the European Union’s Horizon 2020 research and innovation programme under grant agreement No 679933 (MEMERE project). We acknowledge the European Synchrotron Radiation Facility for provision of synchrotron radiation facilities. A. M. B. acknowledges the EPSRC (award EP/K007467/1) for funding.References
- W. Taifan and J. Baltrusaitis, Appl. Catal., B, 2016, 198, 525–547 CrossRef CAS.
- P. Schwach, X. Pan and X. Bao, Chem. Rev., 2017, 117, 8497–8520 CrossRef CAS.
- Y. Gao, L. Neal, D. Ding, W. Wu, C. Baroi, A. M. Gaffney and F. Li, ACS Catal., 2019, 9, 8592–8621 CrossRef CAS.
- G. E. Keller and M. M. Bhasin, J. Catal., 1982, 73, 9–19 CrossRef CAS.
- S. Bhatia, C. Y. Thien and A. R. Mohamed, Chem. Eng. J., 2009, 148, 525–532 CrossRef CAS.
- L. Olivier, S. Haag, H. Pennemann, C. Hofmann, C. Mirodatos and A. C. van Veen, Catal. Today, 2008, 137, 80–89 CrossRef CAS.
- E. V. Kondratenko, M. Schlüter, M. Baerns, D. Linke and M. Holena, Catal. Sci. Technol., 2015, 5, 1668–1677 RSC.
- A. Cruellas, T. Melchiori, F. Gallucci and M. van Sint Annaland, Catal. Rev.: Sci. Eng., 2017, 59, 234–294 CrossRef CAS.
- Y. Gambo, A. A. Jalil, S. Triwahyono and A. A. Abdulrasheed, J. Ind. Eng. Chem., 2018, 59, 218–229 CrossRef CAS.
- L. A. Vandewalle, R. Van de Vijver, K. M. Van Geem and G. B. Marin, Chem. Eng. Sci., 2019, 198, 268–289 CrossRef CAS.
- U. Zavyalova, M. Holena, R. Schlögl and M. Baerns, ChemCatChem, 2011, 3, 1935–1947 CrossRef CAS.
- D. Matras, S. D. M. Jacques, S. Poulston, N. Grosjean, C. Estruch Bosch, B. Rollins, J. Wright, M. Di Michiel, A. Vamvakeros, R. J. Cernik and A. M. Beale, J. Phys. Chem. C, 2019, 123, 1751–1760 CrossRef CAS.
- T. Chukeaw, S. Sringam, M. Chareonpanich and A. Seubsai, Mol. Catal., 2019, 470, 40–47 CrossRef.
- D. Matras, S. D. M. Jacques, H. R. Godini, M. Khadivi, J. Drnec, A. Poulain, R. Cernik and A. Beale, J. Phys. Chem. C, 2018, 122, 2221–2230 CrossRef CAS.
- C. Karakaya and R. J. Kee, Prog. Energy Combust. Sci., 2016, 55, 60–97 CrossRef.
- J. Wang, L. Chou, B. Zhang, H. Song, J. Zhao, J. Yang and S. Li, J. Mol. Catal. A: Chem., 2006, 245, 272–277 CrossRef CAS.
- H. Liu, X. Wang, D. Yang, R. Gao, Z. Wang and J. Yang, J. Nat. Gas Chem., 2008, 17, 59–63 CrossRef CAS.
- S. Arndt, T. Otremba, U. Simon, M. Yildiz, H. Schubert and R. Schomäcker, Appl. Catal., A, 2012, 425–426, 53–61 CrossRef CAS.
- Y. Gambo, A. A. Jalil, S. Triwahyono and A. A. Abdulrasheed, J. Ind. Eng. Chem., 2018, 59, 218–229 CrossRef CAS.
- D. Kiani, S. Sourav, J. Baltrusaitis and I. E. Wachs, ACS Catal., 2019, 9, 5912–5928 CrossRef CAS.
- D. Wang, M. P. Rosynek and J. H. Lunsford, J. Catal., 1995, 155, 390–402 CrossRef CAS.
- S. Pak and J. H. Lunsford, Appl. Catal., A, 1998, 168, 131–137 CrossRef CAS.
- Z.-C. Jiang, C.-J. Yu, X.-P. Fang, S.-B. Li and H.-L. Wang, J. Phys. Chem., 1993, 97, 12870–12875 CrossRef CAS.
- J. Wu, S. Li, J. Niu and X. Fang, Appl. Catal., A, 1995, 124, 9–18 CrossRef CAS.
- Z.-C. Jiang, H. Gong and S.-B. Li, Stud. Surf. Sci. Catal., 1997, 112, 481–490 CrossRef CAS.
- S. Hou, Y. Cao, W. Xiong, H. Liu and Y. Kou, Ind. Eng. Chem. Res., 2006, 45, 7077–7083 CrossRef CAS.
- S. Ji, T. Xiao, S. Li, C. Xu, R. Hou, K. S. Coleman and M. L. Green, Appl. Catal., A, 2002, 225, 271–284 CrossRef CAS.
- S. Mahmoodi, M. R. Ehsani and S. M. Ghoreishi, J. Ind. Eng. Chem., 2010, 16, 923–928 CrossRef CAS.
- P. Wang, G. Zhao, Y. Wang and Y. Lu, Sci. Adv., 2017, 3, e1603180 CrossRef.
- A. Malekzadeh, A. Khodadadi, M. Abedini, M. Amini, A. Bahramian and A. K. Dalai, Catal. Commun., 2001, 2, 241–247 CrossRef CAS.
- V. Fleischer, U. Simon, S. Parishan, M. G. Colmenares, O. Görke, A. Gurlo, W. Riedel, L. Thum, J. Schmidt, T. Risse, K.-P. Dinse and R. Schomäcker, J. Catal., 2018, 360, 102–117 CrossRef CAS.
- P. Wang, G. Zhao, Y. Wang and Y. Lu, Sci. Adv., 2017, 3(6), e1603180 CrossRef.
- A. Palermo, J. Holgadovazquez, A. Lee, M. Tikhov and R. Lambert, J. Catal., 1998, 177, 259–266 CrossRef CAS.
- R. T. Yunarti, S. Gu, J. Choi, J. Jae, D. J. Suh and J. Ha, ACS Sustainable Chem. Eng., 2017, 5, 3667–3674 CrossRef CAS.
- N. S. Hayek, N. S. Lucas, C. W. Damouny and O. M. Gazit, ACS Appl. Mater. Interfaces, 2017, 9, 40404–40411 CrossRef CAS.
- M. Yildiz, U. Simon, T. Otremba, Y. Aksu, K. Kailasam, A. Thomas, R. Schomäcker and S. Arndt, Catal. Today, 2014, 228, 5–14 CrossRef CAS.
- M. Yildiz, Y. Aksu, U. Simon, T. Otremba, K. Kailasam, C. Göbel, F. Girgsdies, O. Görke, F. Rosowski, A. Thomas, R. Schomäcker and S. Arndt, Appl. Catal., A, 2016, 525, 168–179 CrossRef CAS.
- M. Yildiz, Y. Aksu, U. Simon, K. Kailasam, O. Goerke and F. Rosowski, Chem. Commun., 2014, 14440–14442 RSC.
- H. R. Godini, a. Gili, O. Görke, S. Arndt, U. Simon, a. Thomas, R. Schomäcker and G. Wozny, Catal. Today, 2014, 236, 12–22 CrossRef CAS.
- A. Vamvakeros, S. D. M. Jacques, M. Di Michiel, D. Matras, V. Middelkoop, I. Z. Ismagilov, E. V. Matus, V. V. Kuznetsov, J. Drnec, P. Senecal and A. M. Beale, Nat. Commun., 2018, 9, 4751 CrossRef CAS.
- S. D. M. Jacques, M. Di Michiel, A. M. Beale, T. Sochi, M. G. O’Brien, L. Espinosa-Alonso, B. M. Weckhuysen and P. Barnes, Angew. Chem., Int. Ed., 2011, 50, 10148–10152 CrossRef CAS.
- T. Serres, C. Aquino, C. Mirodatos and Y. Schuurman, Appl. Catal., A, 2015, 504, 509–518 CrossRef CAS.
- A. Vamvakeros, S. D. M. Jacques, M. Di Michiel, P. Senecal, V. Middelkoop, R. J. Cernik and A. M. Beale, J. Appl. Crystallogr., 2016, 49, 485–496 CrossRef CAS.
- G. Ashiotis, A. Deschildre, Z. Nawaz, J. P. Wright, D. Karkoulis, F. E. Picca and J. Kieffer, J. Appl. Crystallogr., 2015, 48, 510–519 CrossRef CAS.
- A. Vamvakeros, S. D. M. Jacques, M. Di Michiel, V. Middelkoop, C. K. Egan, R. J. Cernik and A. M. Beale, J. Appl. Crystallogr., 2015, 48, 1943–1955 CrossRef CAS.
- K. S. Finnie, J. G. Thompson and R. L. Withers, J. Phys. Chem. Solids, 1994, 55, 23–29 CrossRef CAS.
- D. Hatch and S. Ghose, Phys. Chem. Miner., 1991, 17, 554–562 CrossRef CAS.
- A. Nurur and H. Nakazawa, Am. Mineral., 1978, 63, 1252–1259 Search PubMed.
- D. Cellai, M. A. Carpenter, R. J. Kirkpatrick, E. K. H. Salje and M. Zhang, Phys. Chem. Miner., 1995, 22, 50–60 CrossRef CAS.
- C. E. Bamberger and O. C. Kopp, J. Cryst. Growth, 1993, 131, 473–480 CrossRef CAS.
- A. Vamvakeros, Operando chemical tomography of packed bed and membrane reactors for methane processing, University College London, 2017 Search PubMed.
- M. Sinev, E. Ponomareva, I. Sinev, V. Lomonosov, Y. Gordienko, Z. Fattakhova and D. Shashkin, Catal. Today, 2019, 333, 36–46 CrossRef CAS.
- H. Wang, R. Schmack, B. Paul, M. Albrecht, S. Sokolov, S. Rümmler, E. V Kondratenko and R. Kraehnert, Appl. Catal., A, 2017, 537, 33–39 CrossRef CAS.
- B. Beck, V. Fleischer, S. Arndt, M. G. Hevia, A. Urakawa, P. Hugo and R. Schomäcker, Catal. Today, 2014, 228, 212–218 CrossRef CAS.
- C. Luz Lima, G. D. Saraiva, P. T. C. Freire, M. Maczka, W. Paraguassu, F. F. de Sousa and J. Mendes Filho, J. Raman Spectrosc., 2011, 42, 799–802 CrossRef.
- C. W. F. T. Pistorius, J. Chem. Phys., 1966, 44, 4532–4537 CrossRef CAS.
- A. Vamvakeros, S. D. M. Jacques, V. Middelkoop, M. Di Michiel, C. K. Egan, I. Z. Ismagilov, G. B. M. Vaughan, F. Gallucci, M. van Sint Annaland, P. R. Shearing, R. J. Cernik and a. M. Beale, Chem. Commun., 2015, 51, 12752–12755 RSC.
- A. Vamvakeros, D. Matras, S. D. M. Jacques, M. di Michiel, S. W. T. Price, P. Senecal, M. A. Aran, V. Middelkoop, G. B. G. Stenning, J. F. W. Mosselmans, I. Z. Ismagilov and A. M. Beale, J. Catal., 2020, 386, 39–52 CrossRef CAS.
Footnote |
| † Electronic supplementary information (ESI) available. See DOI: 10.1039/c9fd00142e |
| This journal is © The Royal Society of Chemistry 2021 |