 Open Access Article
 This Open Access Article is licensed under a Creative Commons Attribution-Non Commercial 3.0 Unported Licence
Enhanced liquid phase exfoliation of graphene in water using an insoluble bis-pyrene stabiliser†
Yuyoung
Shin
 a,
Xavier
Just-Baringo
a,
Matthew
Boyes
a,
Adyasha
Panigrahi
a,
Marco
Zarattini
a,
Yingxian
Chen
b,
Xinyun
Liu
c,
Gareth
Morris
a,
Eric
Prestat
cd,
Kostas
Kostarelos
b,
Sandra
Vranic
b,
Igor
Larrosa
*a and
Cinzia
Casiraghi
*a
a,
Xavier
Just-Baringo
a,
Matthew
Boyes
a,
Adyasha
Panigrahi
a,
Marco
Zarattini
a,
Yingxian
Chen
b,
Xinyun
Liu
c,
Gareth
Morris
a,
Eric
Prestat
cd,
Kostas
Kostarelos
b,
Sandra
Vranic
b,
Igor
Larrosa
*a and
Cinzia
Casiraghi
*a
aDepartment of Chemistry, University of Manchester, Oxford Road, Manchester, M13 9PL, UK. E-mail: cinzia.casiraghi@manchester.ac.uk; igor.larrosa@manchester.ac.uk
bNanomedicine Lab, National Graphene Institute, Faculty of Biology, Medicine & Health, University of Manchester, AV Hill Building, Manchester, M13 9PT, UK
cDepartment of Materials, University of Manchester, Oxford Road, Manchester, M13 9PL, UK
dSuperSTEM Laboratory, SciTech Daresbury Campus, Daresbury, WA4 4AD, UK
First published on 22nd September 2020
Abstract
Stabilisers, such as surfactants, polymers and polyaromatic molecules, offer an effective way to produce graphene dispersions in water by Liquid Phase Exfoliation (LPE) without degrading the properties of graphene. In particular, pyrene derivatives provide better exfoliation efficiency than traditional surfactants and polymers. A stabiliser is expected to be relatively soluble in order to disperse hydrophobic graphene in water. Here, we show that exfoliation can also be achieved with insoluble pyrene stabilisers if appropriately designed. In particular, bis-pyrene stabilisers (BPSs) functionalised with pyrrolidine provide a higher exfoliation efficiency and percentage of single layers compared to traditional pyrene derivatives under the same experimental conditions. This is attributed to the enhanced interactions between BPS and graphene, provided by the presence of two pyrene binding groups. This approach is therefore attractive not only to produce highly concentrated graphene, but also to use graphene to disperse insoluble molecules in water. The enhanced adsorption of BPS on graphene, however, is reflected in higher toxicity towards human epithelial bronchial immortalized cells, limiting the use of this material for biomedical applications.
Introduction
Graphene, a single layer of graphite, shows great potential for numerous applications due to its outstanding properties, including extreme mechanical strength and exceptionally high electronic and thermal conductivity.1 Out of all of the graphene synthesis techniques, Liquid-Phase Exfoliation (LPE)2 allows for mass-scalable, cost-effective and versatile production of graphene formulations suitable for a wide range of practical uses, ranging from composites to biomedical applications.1,3–5Liquid phase exfoliation relies on the use of solvents with surface tension comparable to that of graphene.2 Thus, N-methyl-2-pyrrolidone (NMP) is typically the solvent of choice.2 However, its toxicity, high cost and boiling point do not make it an ideal solvent. Water is a low cost and environmentally friendly solvent, required in many applications. However, in order to effectively exfoliate graphite in water, the graphene surface needs to be altered, either covalently or non-covalently.6–8 The use of stabilisers offers an effective method to functionalise the material without introducing defects, hence maintaining the intrinsic properties of graphene, while allowing dispersibility in water.9–11 Different types of stabiliser, including surfactants,9,12–14 polymers15–17 and polyaromatic molecules10,18,19 have been investigated.
Stabilisers are typically amphiphilic, i.e. they have a hydrophobic binding group, which adsorbs onto the graphene surface through van der Waals interactions, and a hydrophilic group, which prevents re-stacking of exfoliated graphene nanosheets through steric hindrance and/or electrostatic stabilisation.10,20 Out of all stabilisers, pyrene derivatives have been shown to be very effective at exfoliating graphite, when compared to typical surfactants and polymers, due to the effective adsorption of pyrene on graphene through π–π interactions.10,11,21–23 In particular, in our group, we have extensively used 1-pyrenesulfonic acid sodium salt (PS1) to obtain biocompatible and inkjet-printable graphene dispersions in water.4,21,24
Despite the wide use of pyrene derivatives as stabilisers, the effective mechanisms leading to exfoliation are very poorly understood. Seminal works have shown that not all pyrene derivatives are effective exfoliating agents.10,11,25 Exfoliation efficiency, as defined by the concentration of graphene, depends strongly on many factors, such as type and number of functional groups, and the charge distribution in the stabiliser. These determine the thermodynamics of the interaction between the stabiliser and graphene, e.g. the adsorption of the pyrene binding group on the graphene surface, the affinity of the functional groups for the solvent medium, and the effectiveness of deterring the re-stacking of the graphene sheets.9,10,26–28 Since the affinity of the functional groups for the solvent medium is one of the key parameters, stabilisers with relatively good aqueous solubility have been used up to now.
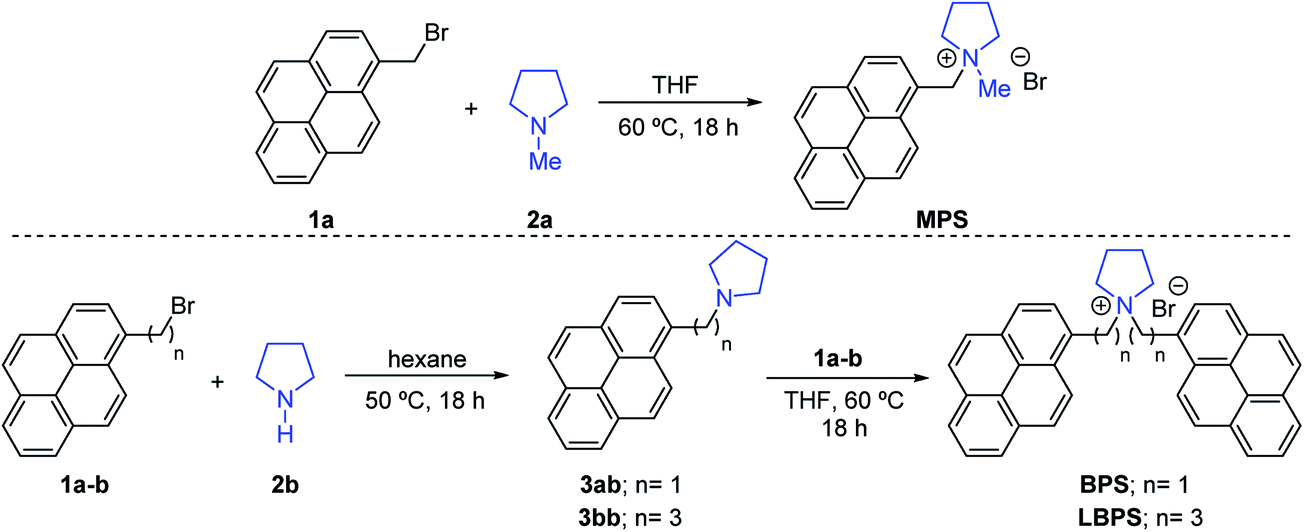
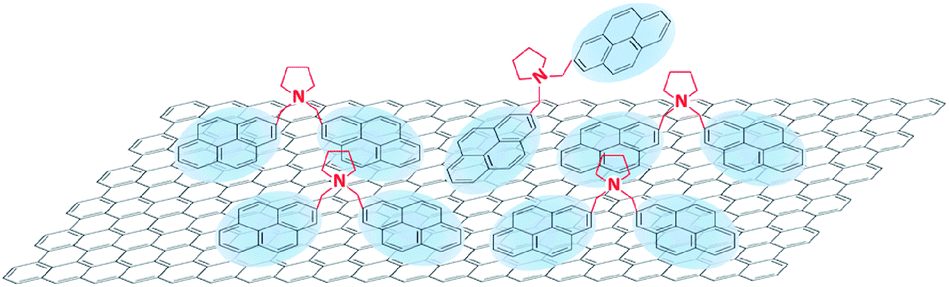
In this work, we show that pyrene derivatives with extremely low solubility can be exceptionally efficient as exfoliating agents, contradicting the common assumption that an effective stabiliser needs to be soluble in water. A bis-pyrene stabiliser (BPS), functionalized with a pyrrolidine central group (Scheme 1), was designed and synthesized ad hoc for this study. Its exfoliation efficiency was compared to that of two pyrene derivatives with the same functional group: one with longer linking chains between the pyrene binding groups and the functional group (LBPS), and the other with a mono-pyrene binding group (MPS) (Scheme 1). BPS has been found to be insoluble in aqueous media, i.e. the aqueous solubility of BPS is under the detection limit of NMR. Despite this, the BPS molecule showed an exfoliation efficiency up to 3–5 times higher than that obtained with PS1 or MPS. Furthermore, the graphene dispersion prepared with BPS showed a higher percentage of single layer graphene (SLG) compared to PS1. The enhanced exfoliation efficiency of BPS compared to the other stabilisers is attributed to the higher interaction strength between BPS and graphene, driven by stronger π–π interactions due to the presence of two pyrene binding groups in BPS, and the insolubility of BPS in water (as confirmed by Nuclear Magnetic Resonance (NMR)). Finally, cytotoxicity studies on the graphene dispersions prepared with BPS show the toxicity of graphene to be dependent on the initial BPS concentration, whereas the graphene dispersion prepared with MPS showed no cytotoxic effect. Since the sizes of the nanosheets prepared with BPS and MPS are comparable, the difference in toxicity is attributed to the presence of the two pyrene binding groups in BPS, which may affect how these molecules assemble on graphene, in particular at high BPS concentrations.
 | ||
| Scheme 1 General schematic plan for the synthesis of the pyrene stabilisers. | ||
Methods
Materials
![[thin space (1/6-em)]](https://www.rsc.org/images/entities/char_2009.gif) 000 rpm (16600 g) for 60 min to increase the concentration further by collecting the sediment and re-dispersing in a smaller volume of DI water. In the case of the graphene dispersions prepared with BPS, the supernatant was also collected for characterisation. In the case of the graphene dispersions prepared with MPS, the second centrifugation step was repeated twice to remove excess pyrene from the solution.
000 rpm (16600 g) for 60 min to increase the concentration further by collecting the sediment and re-dispersing in a smaller volume of DI water. In the case of the graphene dispersions prepared with BPS, the supernatant was also collected for characterisation. In the case of the graphene dispersions prepared with MPS, the second centrifugation step was repeated twice to remove excess pyrene from the solution.
Characterization
768 complex data points, and a recycle time of 3.4 s. The diffusion-ordered spectroscopy (DOSY) data were acquired in a total time of 11 h using the Oneshot pulse sequence,35 with a spectral width of 19.8 kHz, a recycle delay of 5 s, and 32768 complex data points, and processed with the manufacturer’s VnmrJ software. The Oneshot pulse sequence used a total diffusion-encoding gradient pulse duration of 2 ms (i.e. two encoding and two decoding pulses, each of 1 ms duration), a diffusion time of 0.1 s, and 8 diffusion-encoding gradient amplitudes ranging from nominal values of 6 to 54 G cm−1 in equal increments of gradient squared. The graphene dispersion used for the DOSY experiment was produced via the same LPE process as the rest of this study. Exfoliation of 60 mg of graphite with 12 mg of BPS in 20 mL of D2O allowed the production of a dispersion with a final concentration of 0.8 mg mL−1.
Results and discussion
Synthesis of pyrene derivatives
In a general synthetic approach, the stabilisers were synthesised via alkylation of pyrrolidine 2a–b using the parent (1-pyrenyl)bromoalkane 1a–b for MPS or two consecutive alkylations for BPS and LBPS.Liquid-phase exfoliation
To compare the exfoliation efficiency of BPS, MPS and LBPS, the graphene dispersions were prepared with the same initial stabiliser concentration (0.4 mg mL−1). Fig. 1(a) shows that a graphene concentration of 0.72 mg mL−1 was achieved by BPS, compared to 0.28 mg mL−1 obtained with MPS and 0.06 mg mL−1 with LBPS. The higher exfoliation efficiency of BPS compared to MPS is attributed to the presence of two pyrene binding groups. This improves the π–π interactions between the molecules and graphene, and also affects the solubility of BPS in water (details in ESI†), driving the BPS molecules to minimize their interaction with water by adsorbing on graphene. It is interesting to note that the concentration obtained with MPS is comparable to that obtained by PS1 (Fig. 1(a)), possibly because the two molecules have relatively good solubility (details in ESI†) and a similar structure. Remarkably, LBPS, which also has two pyrene binding groups and is also insoluble in water, showed almost negligible exfoliation efficiency (Fig. 1(a)). This could be attributed to the different ways that these molecules are expected to assemble on graphene. The long chain connecting the pyrene binding groups in LBPS gives rise to some conformational freedom for the two pyrene binding groups, which may result in disruption of the controlled adsorption of the LBPS molecules due to possible interaction between the two pyrene bases. In the case of BPS, due to the relatively short carbon linking chain between the pyrene binding group and the functional group, the BPS molecule is more rigid. This allows more controlled assembly of BPS on graphene as well as adsorption of both the pyrene binding groups, exposing the charged functional group towards the water solvent. Alternatively, the poorer exfoliation efficiency of MPS could be attributed to intramolecular π–π stacking of the molecules in solution. | ||
| Fig. 1 (a) Graphene concentrations obtained for different graphene dispersions. Inset: photographs of graphene dispersions prepared with different stabilisers. From left to right: BPS, MPS and LBPS at 0.4 mg mL−1, all diluted by a factor of 10. (b) UV-vis spectra of selected graphene dispersions with different pyrene concentrations. (c) Standard 1H spectrum of a graphene dispersion that was produced with an initial BPS concentration of 0.6 mg mL−1 in D2O at 1× and 1000× magnification. (d) 2D DOSY spectrum of a graphene dispersion that was produced with an initial BPS concentration of 0.6 mg mL−1 in D2O. | ||
The stability of the graphene dispersions was estimated by measuring the zeta potential at ambient conditions. Typically, aqueous suspensions with |ζ| > 30 mV are regarded as stable suspensions.28 The zeta potentials of all the dispersions prepared in this study are between 30 and 50 mV, indicating very good stability (Table 1 and Fig. S2†).
| BPS at 0.4 mg mL−1 | BPS at 0.6 mg mL−1 | MPS at 0.4 mg mL−1 | |
|---|---|---|---|
| Concentration of dispersion (mg mL−1) | 0.72 | 0.78 | 0.28 |
| Concentration of supernatant (mg mL−1) | 0.06 | 0.06 | — |
| Zeta potential of dispersion (mV) | 40 | 38 | 39 |
| Zeta potential of supernatant (mV) | 47 | 40 | — |
| % SLG of dispersion | ∼58% | ∼44% | 16% |
| % SLG of supernatant | ∼90% | ∼97% | — |
| Av. flake size of dispersion (nm) | 124 | 121 | 230 |
| Av. flake size of supernatant (nm) | 44 | 50 | — |
The enhanced exfoliation efficiency of BPS is attributed to the ability of these molecules to adsorb better on graphene. This is also supported by the observed trend of increasing concentration of the exfoliated graphene with increasing initial BPS concentration, reaching saturation above 0.4 mg mL−1 of BPS (Fig. 1(a) and S1†). UV-vis spectroscopy, in particular, shows clear BPS residual peaks (Fig. 1(b)). It is interesting to compare the spectra obtained with BPS and MPS. Note that for better comparison of the intensities of the absorbance peaks of pyrene in the region between 250 nm and 400 nm, the spectra have been normalised against graphene absorbance at 660 nm. The prominent pyrene absorption peak in the dispersions obtained by MPS can easily be removed by a washing step (see the Methods section), leaving no residual pyrene peaks in the UV-vis spectrum after washing. In the case of BPS, however, there was no noticeable change of absorbance in that region after the washing step (Fig. S3†). As BPS is insoluble, this signal can only be attributed to the BPS adsorbed on the nanosheets. Furthermore, as shown in Fig. 1(b), an increase in pyrene absorbance is observed with increasing initial PBS concentration, which should be attributed to the increased amount of BPS molecules adsorbed on the graphene surface.
In order to confirm that all BPS molecules are adsorbed on graphene, we performed 1D and DOSY 1H NMR experiments. DOSY uses measurements of diffusion to enable the separation of the NMR signals of different components in a mixture, and can be used to probe interactions between components.36,37 Initially, a standard 1H spectrum of a graphene dispersion with a BPS concentration of 0.6 mg mL−1 was collected, shown in Fig. 1(c). This spectrum is dominated by the 0.2% of protons present in the D2O used and no pyrene aromatic signals are seen. The DOSY spectrum of Fig. 1(d) shows only the signals of rapidly diffusing water and trace acetone. No free BPS is detected, indicating that the pyrene present is tightly bound to the graphene nanosheets, which tumble slowly in solution, and hence shows rapid spin–spin relaxation. A wide 1H spectrum (Fig. S4†) confirmed that most of the 1H signal intensity comes from very broad signals.
Characterisation of the exfoliated graphene nanosheets
Three graphene dispersions (BPS at 0.4 mg mL−1, BPS at 0.6 mg mL−1 and MPS at 0.4 mg mL−1) were chosen for further characterisation of the exfoliated graphene flakes by Raman spectroscopy, AFM and TEM. Supernatants collected for the two BPS dispersions were also characterised for comparison. Note that a higher exfoliation yield is not necessarily an indication of a higher percentage of single layers, hence further characterisation is mandatory. The results are summarised in Table 1.Raman spectroscopy is the most commonly used characterization tool for graphene.38 The Raman spectrum of graphene is characterized by the G, D and 2D peaks, lying at ∼1580 cm−1, ∼1350 cm−1, and 2680 cm−1, respectively. In the case of graphene produced by LPE, which typically has a size smaller than 500 nm, the D peak is activated by the edges of the nanosheets,39 thus the intensity ratio between D and G peaks, I(D)/I(G), changes with the size of the flakes.13,26,27,33 The 2D peak shape is typically used to identify single layer graphene.40 However, this identification method cannot be applied with the same accuracy to graphene produced by LPE, as the shape of the 2D peak is affected by edge effects, solvent or stabiliser doping and/or re-stacking of flakes.21,41 Here we performed qualitative thickness analysis using a protocol developed and tested in our group, based on Lorentzian fitting of the 2D peak (details in the Methods section).13,26,27,33,34Fig. 2(a) shows representative Raman spectra obtained from the BPS at 0.6 mg mL−1 dispersion and supernatant. The Raman analysis shows that BPS is highly efficient at exfoliating graphene: both the dispersions had a SLG percentage between 40 and 60%, compared to 16% measured for the MPS dispersion. Thus, BPS gives a high exfoliation yield, as well as a high percentage of single and few layers, compared to traditional pyrene derivatives. Moreover, Fig. 2(a) shows that the flakes in the supernatant are characterised by a higher R2 value as well as higher I(D)/I(G). Thus, the supernatant is expected to contain thinner flakes, mostly single-layers and of smaller size, compared to the dispersion. This is confirmed by AFM, see Fig. 2(c) and (d). These figures show the lateral size distribution for the dispersion and supernatant of the same sample (AFM images used for statistical analysis and the distribution histograms for the other samples are shown in the ESI†). AFM results show that the average flake size of the two BPS dispersions are in both cases centered at ∼125 nm, slightly smaller than the average size of the flakes in the MPS dispersion, which peaks at ∼230 nm. This is in agreement with previous studies.4,11,21,29 The average flake size of the two supernatant dispersions obtained with BPS was about ∼50 nm, which is expected, as smaller and thinner flakes are likely to be found in the supernatant. Note that with traditional pyrene derivatives, the concentration of graphene in the supernatant is too small, typically below 0.01 mg mL−1, for further use; in contrast, LPE with BPS offers a very simple way to achieve concentrated and enriched graphene dispersions, although of much reduced flake size.
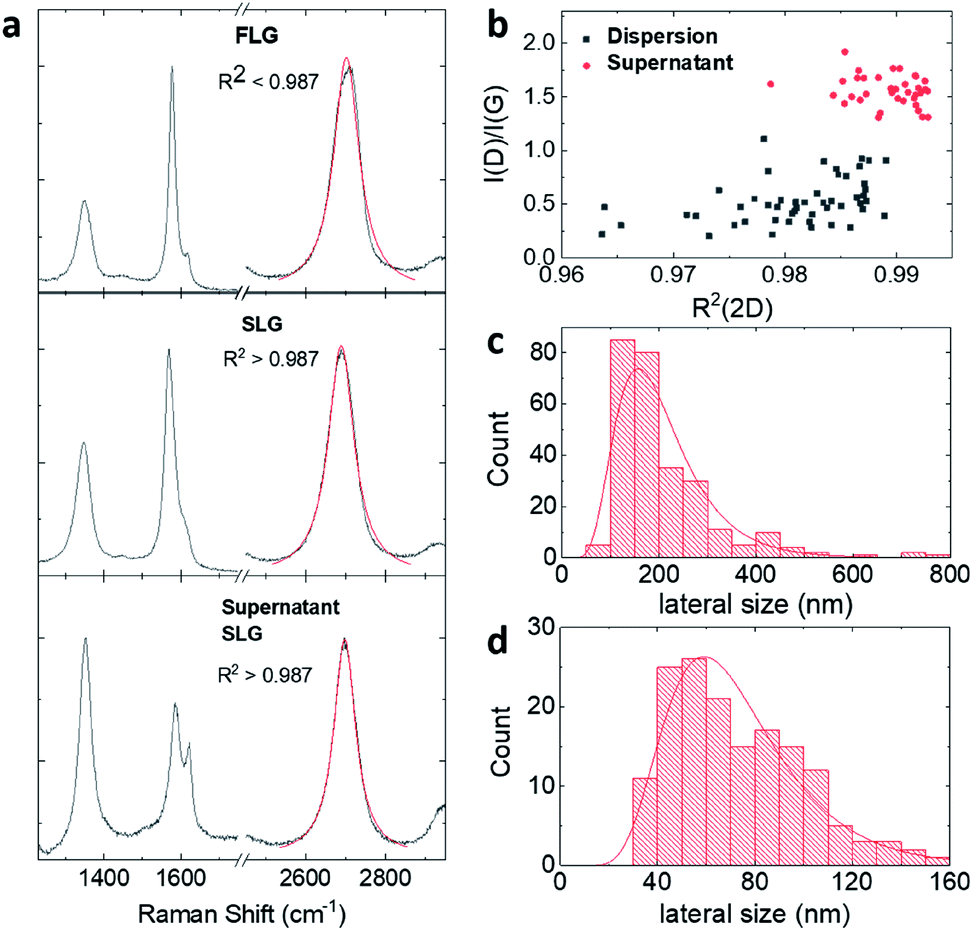 | ||
| Fig. 2 Characterisation of graphene dispersion prepared with BPS at 0.6 mg mL−1. (a) Representative Raman spectra taken from the dispersion and the supernatant of BPS at 0.6 mg mL−1. The fit of the 2D peak is also shown (red line). (b) I(D)/I(G) vs. fit residual of the 2D peak plot for both dispersions and supernatant samples. (c and d) Lateral size distribution histograms measured by AFM for dispersion and supernatant samples, respectively. | ||
Thickness distributions obtained by AFM (Fig. S5 and S6†) confirm the Raman analysis, showing that BPS dispersions contain a higher number of thinner flakes than dispersions made with MPS. However, the thickness distribution obtained by AFM should be viewed with caution as the adsorption of stabilisers and solvent molecules on the surface of graphene flakes leads to higher thicknesses than those theoretically expected.21,42,43 Because of this, the BPS at 0.6 mg mL−1 sample was further characterised by TEM. Fig. 3(a) shows the lateral size distribution histogram obtained from TEM analysis, which is in good agreement with that obtained from AFM (Fig. 2(c)).
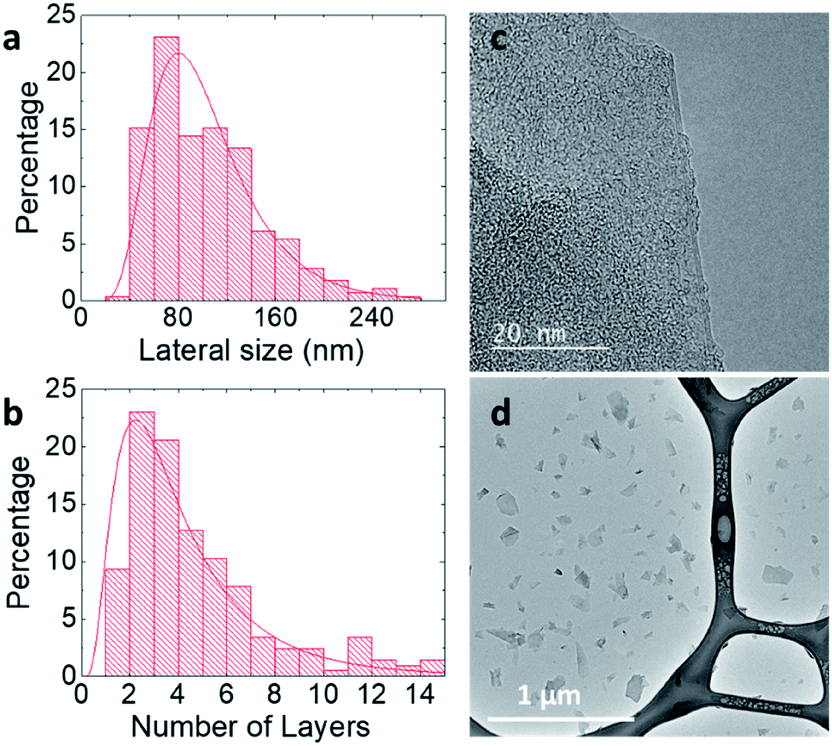 | ||
| Fig. 3 TEM characterisation of graphene dispersion prepared with BPS at 0.6 mg mL−1: (a) lateral size and (b) thickness distribution, (c) HRTEM image of a three-layer-thick graphene flake and (d) overview TEM image of graphene flakes. | ||
Fig. 3(b) shows the thickness distribution histogram, collected for statistical analysis of more than 200 individual flakes: the dispersion is mostly composed of thin (<10 layers) flakes. It should be noted that the discrepancy between the SLG percentages estimated by Raman and by TEM analysis is attributable to the different sample preparation: the Raman sample was prepared by drop casting on silicon wafer whereas the TEM sample was prepared by dip-coating on a lacey carbon grid. However, despite the discrepancy, both techniques show that the graphene dispersion prepared with BPS is well exfoliated, mostly containing thin layers, as further confirmed in Fig. 3(c) and (d).
Biocompatibility study
Previous work from our group4 has shown that graphene flakes prepared by LPE with PS1 are highly biocompatible in vitro, with no cytotoxicity observed for concentrations up to 100 μg mL−1. It is, however, unclear whether the cytotoxicity is related to the type of pyrene derivative used. Thus, here we compare the cytotoxicity of the dispersions obtained with MPS and BPS, which have the same functional group, but different numbers of pyrene binding groups. As the nanosheets of the graphene dispersions produced by BPS and MPS have comparable size, the comparison of cytotoxicity between the two samples allows to study the effect of the stabiliser, which determines the surface chemistry, on cellular interactions.To establish the cytotoxicity profile, optical microscopy was used with BEAS-2B cell lines as in vitro model for four different graphene dispersions prepared in this study: three graphene dispersions prepared with BPS (BPS at 0.2 mg mL−1, BPS at 0.6 mg mL−1, and BPS at 1.0 mg mL−1, to determine the effect of BPS concentration), and one graphene dispersion prepared with MPS (MPS at 0.4 mg mL−1). Cells were exposed to increasing concentrations of graphene, from 25 μg mL−1 to 100 μg mL−1. As a control, untreated cells were also observed (Fig. 4, top left panel).
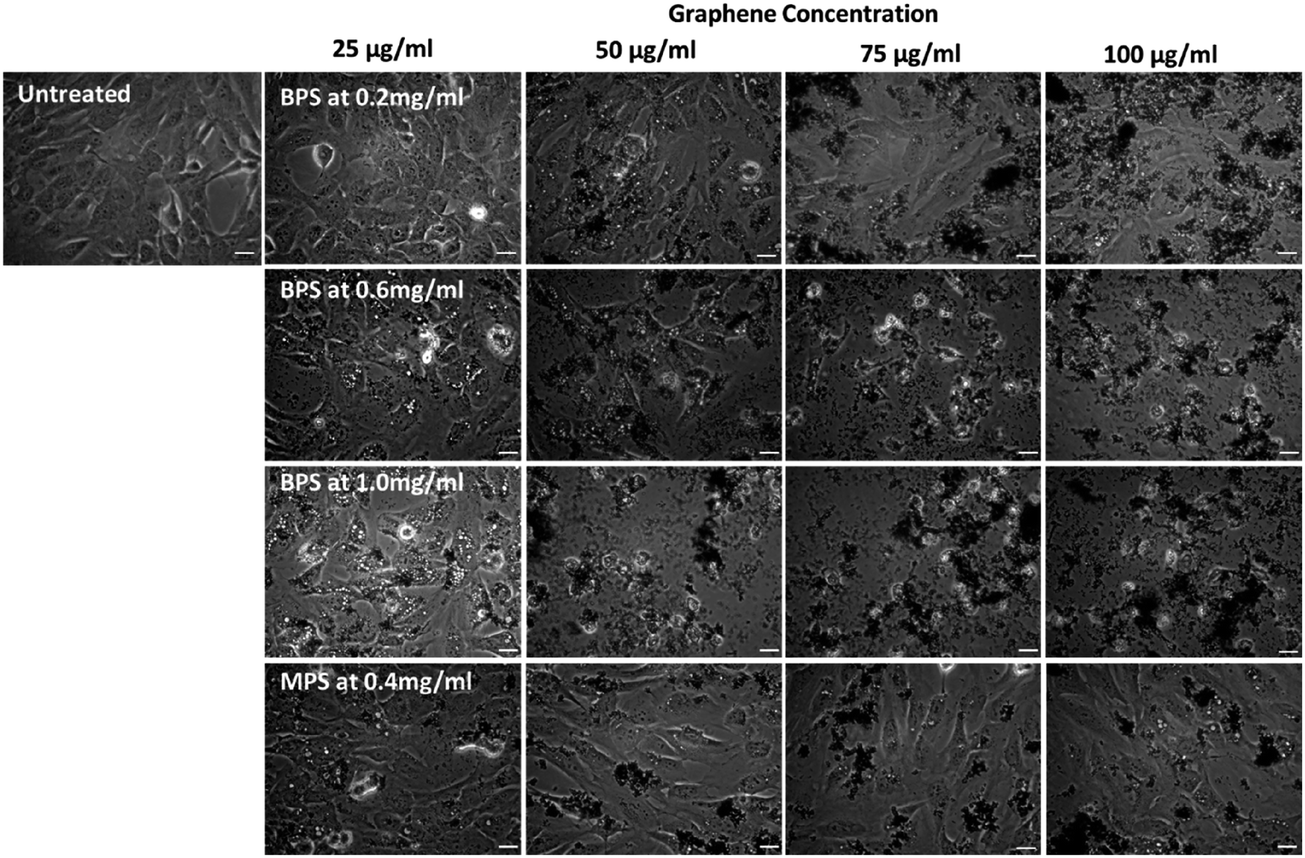 | ||
| Fig. 4 Optical images of BEAS-2B cells, exposed to 4 different graphene dispersions: BPS at 0.2 mg mL−1, BPS at 0.6 mg mL−1, BPS at 1.0 mg mL−1, and MPS at 0.4 mg mL−1, at 4 different concentrations: 25 μg mL−1, 50 μg mL−1, 75 μg mL−1, and 100 μg mL−1. Cells were observed for morphological changes and loss of viability indicated by detachment from the support, in comparison to untreated cells. The scale bar is 10 μm. | ||
Fig. 4 shows the optical images of the cells exposed to graphene flakes and morphological changes/cellular detachment, as indicators of cell death. Fig. 4 clearly shows that the cytotoxicity of graphene flakes increases with increasing concentration of BPS. No noticeable changes in cell morphology were observed for BPS at 0.2 mg mL−1 at any of the graphene concentrations used. However, for BPS at 0.6 mg mL−1, the appearance of the vesicles is visible already at a dose of 25 μg mL−1, indicating cellular stress and lysosomal swelling. Dose dependent toxic effects on the cells were also observed: at 75 μg mL−1 rounding of the cells is apparent, indicating apoptotic cell death as well as detachment of dead cells from the support. As expected, highly stressed cells were observed using BPS at 1.0 mg mL−1 even at the lowest dose of 25 μg mL−1 (high numbers of vesicles appearing in the cells), while cell death and detachment from the support occurred at the dose of 50 μg mL−1 using the same sample.
On the other hand, cells exposed to MPS at 0.4 mg mL−1 showed no evident morphological changes or detachment from the support, with few vesicles appearing inside the cells, demonstrating good biocompatibility at high dose (100 μg mL−1) after 24 h of treatment.
These results clearly demonstrate the cytotoxic effect of BPS. The simplest explanation is to attribute the higher cytotoxicity to the higher number of molecules adsorbed (Fig. 1(b)). However, it is interesting to note that BPS and MPS are characterised by the same functional group interacting with the cells, but graphene produced by MPS does not show any cytotoxicity even at high concentrations. Thus, a more complex scenario may be possible. In the case of soluble MPS, not all stabiliser is adsorbed on graphene, and the free MPS molecules in water are removed during the washing steps. In the case of the insoluble BPS, the stabiliser needs to be adsorbed on graphene. However, after a certain BPS concentration, the graphene surface could reach complete coverage. As these molecules are insoluble, they will still want to interact with graphene and therefore may be accommodated on its surface by adopting a frustrated configuration, in which only one pyrene binding group is adsorbed on graphene. As the other pyrene group is now exposed to the water, this reflects an effective increase in concentration of pyrene accessible to cells in solution at high BPS concentrations (Fig. 5), giving rise to a higher cytotoxic effect compared to the case of the MPS molecules. However, this would not affect graphene concentration, as there are enough BPS molecules completely adsorbed on graphene, providing electrostatic stabilization. Alternatively, the molecules may start interacting with each other, forming large aggregates on graphene, which may affect the cytotoxicity. Further studies are required to fully understand the exact mechanism of the increased cytotoxicity observed with BPS molecules.
 | ||
| Fig. 5 Possible adsorption of BPS at high concentration, giving rise to higher graphene cytotoxicity, compared to MPS. | ||
Conclusion
In summary, we have demonstrated the use of an insoluble stabiliser to achieve highly concentrated aqueous graphene dispersions, mostly containing single or few layer flakes. Although their use in biomedical applications is limited by their reduced biocompatibility, these graphene dispersions are still suitable for many applications, where water is the preferred solvent. Our work also shows that the LPE of graphene can be used to disperse insoluble molecules in water, as graphene and the hydrophobic side of the molecules self-assemble together to minimize interactions with water molecules, similar to micellization.Contribution statement
CC, IL, and KK conceived and supervised the project. YY and MB performed the exfoliation experiments and related data analysis. AP and XJ-B made the pyrene derivatives and performed their characterization. YC and SV performed the biological studies and related data analysis. XL and EP performed the electron microscopy measurements and related data analysis. GM performed DOSY NMR and related data analysis. MZ performed AFM measurements and related data analysis. The manuscript was written with contributions from all authors.Conflicts of interest
There are no conflicts of interest to declare.Acknowledgements
This work was supported by the EPSRC in the framework of the project 2D Health (EP/P00119X/1). MB acknowledges financial support by the European Research Council (ERC) in the framework of the European Union’s Horizon 2020 research and innovation program under the grant agreement No. 648471. MZ acknowledges the Hewlett-Packard Company for financial support in the framework of the Graphene NowNano Doctoral Training Center.References
- K. S. Novoselov, et al., A roadmap for graphene, Nature, 2012, 490, 192–200 CrossRef CAS.
- Y. Hernandez, et al., High-yield production of graphene by liquid-phase exfoliation of graphite, Nat. Nanotechnol., 2008, 3, 563–568 CrossRef CAS.
- V. Nicolosi, M. Chhowalla, M. G. Kanatzidis, M. S. Strano and J. N. Coleman, Liquid Exfoliation of Layered Materials, Science, 2013, 340, 1226419 CrossRef.
- D. McManus, et al., Water-based and biocompatible 2D crystal inks for all-inkjet-printed heterostructures, Nat. Nanotechnol., 2017, 12, 1–19 CrossRef.
- J. N. Coleman, Liquid exfoliation of defect-free graphene, Acc. Chem. Res., 2013, 46, 14–22 CrossRef CAS.
- A. C. Ferrari, et al., Science and technology roadmap for graphene, related two-dimensional crystals, and hybrid systems, Nanoscale, 2015, 7, 4598–4810 RSC.
- A. Ciesielski and P. Samorì, Supramolecular Approaches to Graphene: From Self-Assembly to Molecule-Assisted Liquid-Phase Exfoliation, Adv. Mater., 2016, 28, 6030–6051 CrossRef CAS.
- K. P. Loh, Q. Bao, G. Eda and M. Chhowalla, Graphene oxide as a chemically tunable platform for optical applications, Nat. Chem., 2010, 2, 1015–1024 CrossRef CAS.
- M. Lotya, et al., Liquid phase production of graphene by exfoliation of graphite in surfactant/water solutions, J. Am. Chem. Soc., 2009, 131, 3611–3620 CrossRef CAS.
- D. Parviz, et al., Dispersions of non-covalently functionalized graphene with minimal stabilizer, ACS Nano, 2012, 6, 8857–8867 CrossRef CAS.
- A. Schlierf, et al., Nanoscale insight into the exfoliation mechanism of graphene with organic dyes: effect of charge, dipole and molecular structure, Nanoscale, 2013, 5, 4205 RSC.
- M. Lotya, P. J. King, U. Khan, S. De and J. N. Coleman, High-concentration, surfactant-stabilized graphene dispersions, ACS Nano, 2010, 4, 3155–3162 CrossRef CAS.
- S. Haar, et al., Enhancing the Liquid-Phase Exfoliation of Graphene in Organic Solvents upon Addition of n-Octylbenzene, Sci. Rep., 2015, 5, 16684 CrossRef CAS.
- Y. Hernandez, M. Lotya, D. Rickard, S. D. Bergin and J. N. Coleman, Measurement of multicomponent solubility parameters for graphene facilitates solvent discovery, Langmuir, 2010, 26, 3208–3213 CrossRef CAS.
- S. Villar-Rodil, J. I. Paredes, A. Martínez-Alonso and J. M. D. Tascón, Preparation of graphene dispersions and graphene-polymer composites in organic media, J. Mater. Chem., 2009, 19, 3591 RSC.
- P. May, U. Khan, J. M. Hughes and J. N. Coleman, Role of solubility parameters in understanding the steric stabilization of exfoliated two-dimensional nanosheets by adsorbed polymers, J. Phys. Chem. C, 2012, 116, 11393–11400 CrossRef CAS.
- L. Xu, et al., Production of high-concentration graphene dispersions in low-boiling-point organic solvents by liquid-phase noncovalent exfoliation of graphite with a hyperbranched polyethylene and formation of graphene/ethylene copolymer composites, J. Phys. Chem. C, 2013, 117, 10730–10742 CrossRef CAS.
- A. Ghosh, K. V. Rao, S. J. George and C. N. R. Rao, Noncovalent Functionalization, Exfoliation, and Solubilization of Graphene in Water by Employing a Fluorescent Coronene Carboxylate, Chem.–Eur. J., 2010, 16, 2700–2704 CrossRef CAS.
- J. M. Englert, et al., Soluble Graphene: Generation of Aqueous Graphene Solutions Aided by a Perylenebisimide-Based Bolaamphiphile, Adv. Mater., 2009, 21, 4265–4269 CrossRef CAS.
- A. Amiri, M. Naraghi, G. Ahmadi, M. Soleymaniha and M. Shanbedi, A review on liquid-phase exfoliation for scalable production of pure graphene, wrinkled, crumpled and functionalized graphene and challenges, FlatChem, 2018, 8, 40–71 CrossRef CAS.
- H. Yang, et al., A simple method for graphene production based on exfoliation of graphite in water using 1-pyrenesulfonic acid sodium salt, Carbon, 2013, 53, 357–365 CrossRef CAS.
- D. W. Lee, T. Kim and M. Lee, An amphiphilic pyrene sheet for selective functionalization of graphene, Chem. Commun., 2011, 47, 8259–8261 RSC.
- M. Zhang, et al., Production of graphene sheets by direct dispersion with aromatic healing agents, Small, 2010, 6, 1100–1107 CrossRef CAS.
- H. Yang, et al., Dielectric nanosheets made by liquid-phase exfoliation in water and their use in graphene-based electronics, 2D Mater., 2014, 1, 011012 CrossRef.
- K. W. J. Heard, et al., Initial Studies Directed toward the Rational Design of Aqueous Graphene Dispersants, ACS Omega, 2019, 4, 1969–1981 CrossRef CAS.
- S. Conti, et al., Perchlorination of Coronene Enhances its Propensity for Self-Assembly on Graphene, ChemPhysChem, 2016, 17, 352–357 CrossRef CAS.
- S. Haar, et al., A supramolecular strategy to leverage the liquid-phase exfoliation of graphene in the presence of surfactants: Unraveling the role of the length of fatty acids, Small, 2015, 11, 1691–1702 CrossRef CAS.
- R. J. Smith, M. Lotya and J. N. Coleman, The importance of repulsive potential barriers for the dispersion of graphene using surfactants, New J. Phys., 2010, 12, 125008 CrossRef.
- Y. Shin, et al., Charge-tunable graphene dispersions in water made with amphoteric pyrene derivatives, Mol. Syst. Des. Eng., 2019, 4, 503–510 RSC.
- F. Bonaccorso, et al., Production and processing of graphene and 2d crystals, Mater. Today, 2012, 15, 564–589 CrossRef CAS.
- U. Khan, A. O’Neill, M. Lotya, S. De and J. N. Coleman, High-concentration solvent exfoliation of graphene, Small, 2010, 6, 864–871 CrossRef CAS.
- R. J. Hunter, Zeta potential in colloid science: principles and applications. Colloid science 2, Academic Press, 1981 Search PubMed.
- A. Ciesielski, et al., Harnessing the Liquid-Phase Exfoliation of Graphene Using Aliphatic Compounds: A Supramolecular Approach, Angew. Chem., Int. Ed., 2014, 53, 10355–10361 CrossRef CAS.
- Y. Shin, et al., Synthesis and characterization of composite membranes made of graphene and polymers of intrinsic microporosity, Carbon, 2016, 102, 357–366 CrossRef CAS.
- M. D. Pelta, G. A. Morris, M. J. Stchedroff and S. J. Hammond, A one-shot sequence for high-resolution diffusion-ordered spectroscopy, Magn. Reson. Chem., 2002, 40, S147–S152 CrossRef CAS.
- C. S. Johnson, Diffusion ordered nuclear magnetic resonance spectroscopy: principles and applications, Prog. Nucl. Magn. Reson. Spectrosc., 1999, 34, 203–256 CrossRef CAS.
- E. V. Bichenkova, et al., NMR detects molecular interactions of graphene with aromatic and aliphatic hydrocarbons in water, 2D Mater., 2017, 5, 15003 CrossRef.
- A. Jorio, R. Saito, G. Dresselhaus and M. S. Dresselhaus, Raman Spectroscopy in Graphene Related Systems. Raman Spectroscopy in Graphene Related Systems, 2011, DOI:10.1002/9783527632695.
- C. Casiraghi, et al., Raman spectroscopy of graphene edges, Nano Lett., 2009, 9, 1433–1441 CrossRef CAS.
- A. C. Ferrari, et al., Raman spectrum of graphene and graphene layers, Phys. Rev. Lett., 2006, 97, 1–4 Search PubMed.
- V. Carozo, et al., Resonance effects on the Raman spectra of graphene superlattices, Phys. Rev. B: Condens. Matter Mater. Phys., 2013, 88, 1–10 CrossRef.
- K. R. Paton, et al., Scalable production of large quantities of defect-free few-layer graphene by shear exfoliation in liquids, Nat. Mater., 2014, 13, 624–630 CrossRef CAS.
- C. Backes, et al., Guidelines for Exfoliation, Characterization and Processing of Layered Materials Produced by Liquid Exfoliation, Chem. Mater., 2017, 29, 243–255 CrossRef CAS.
Footnote |
| † Electronic supplementary information (ESI) available. See DOI: 10.1039/c9fd00114j |
| This journal is © The Royal Society of Chemistry 2021 |