Sewage treatment at 4 °C in anaerobic upflow reactors with and without a membrane – performance, function and microbial diversity†
Evangelos
Petropoulos
 *a,
Burhan
Shamurad
a,
Shamas
Tabraiz
a,
Yongjie
Yu
a,
Russell
Davenport
a,
Thomas P.
Curtis
a and
Jan
Dolfing
 ab
ab
aNewcastle University, School of Engineering, Newcastle upon Tyne, NE1 7RU, UK. E-mail: vagpetrop@gmail.com
bNorthumbria University, Faculty Engineering and Environment, Newcastle upon Tyne, NE1 8QH, UK
First published on 10th November 2020
Abstract
In this study, we investigated the feasibility of anaerobic sewage treatment at extremely low temperatures (4 °C) using two reactor setups: upflow anaerobic sludge blanket reactors (UASB) without and with (AnMBRUASB(UF)) a membrane. Both reactors were inoculated with seeds derived from sediments that were putatively acclimatized to low temperatures. A preliminary batch trial showed that treatment is feasible with the removal of carbon coupled to methane and sulphide production. The reactors operated for 180 days at a hydraulic retention time of 3 days. After 40 days acclimation, both systems met the EU chemical oxygen demand (COD) effluent standard (<125.0 mg L−1). Initially, the removal efficiency and methane production rate of the AnMBR were slightly higher than those of the UASB. However, over time, both the performance (COD removal and methane production) and the intrinsic capability of the biomass (expressed as cell specific activity) became similar. The wastewater-fed biomass produced <7.0 fmolCH4 per cellmethanogen per day at cell densities of observation <1.4 × 10⁶ methanogens per mL. Acetate/formate-fed specific methanogenic activities at 4 °C (<18 fmol CH4 per cellmethanogen per day) confirmed that acetoclastic methanogenesis is important in both setups and hydrogenotrophic methanogenesis was only unequivocally observed in the UASB reactors. The microbial diversity of the two systems was similar, and interestingly revealed several putatively hydrogenotrophic methanogens (i.e., Methanospirillum, Methanobrevibacter and unassigned Methanomassilococeae). Methanosaeta; the archetypal acetoclastic methanogen was present but not abundant and largely confined to the biofilm. These observations suggest that at 4 °C methane can be produced not only through direct acetoclastic methanogenesis, but also through acetate oxidation coupled with hydrogenotrophic methanogenesis.
Water impactThis study examines the feasibility of domestic wastewater treatment at the extreme temperature of 4 °C using two different conventional treatment reactors seeded with cold-adapted inocula. The results showed that sufficient COD treatment occurs in both systems proving that degradation is a property of the biomass, independent of reactor setups. The operation and the microbial community were studied to further understand the features of low temperature wastewater treatment. |
1. Introduction
Water is a valuable resource,1 wastewater, doubly so, as the waste in wastewater (just 1% by mass) contains energy and other valuable resources.2 In particular, the organic matter in a typical wastewater has 16.1 kJ g−1 of chemical oxygen demand or COD.3,4 If this stored energy is not reused it will be ‘lost’.Successful implementation of a “circular economy”, in which all natural resources are used sustainably and regenerated, relies on us solving the problem of that 1%.5
Wastewater, inevitably, requires treatment, before it can be reused (as per UWWTD 91/271/EC).6 In temperate climates, domestic wastewater is mainly treated aerobically using technologies that not only require energy (0.21 kW h m−3 in Northumbrian Water Ltd, UK) but also tend to increase the greenhouse gas (GHG) footprint of the water industry, rendering treatment a major environmental polluter.7
Anaerobic treatment might be more sustainable.8 Using at this technology, the organic fraction (usually expressed either as COD or BOD (chemical or biochemical oxygen demand)) is converted to methane-biogas, which can then be used to generate energy.9 The treated effluent can be either discharged or further polished depending on the prevailing standards (for example, COD <125 mg L−1; UWWTD, 91/271/EC).6 Thus, anaerobic technologies can turn ‘pollution’ into a useful by-product with a market value – a resource.
Although these anaerobic systems operate well in warm climate (>20 °C),10 performance at lower temperatures is regarded as problematic. Numerous studies have tried to adapt mesophilic biomasses to low temperatures to tackle this issue, but many of them had issues, especially when using real wastewater.11
Other studies though had some success, especially after prolonged (>2 years) acclimation periods using artificial wastewaters.12,13
The use of cold-adapted inocula has been reported to address the issue of prolonged acclimation and unsatisfactory hydrolysis/methanogenesis at low temperatures.11,14,15 Assessing the biomass using cell-specific activity as criterium showed that both hydrolysis and methanogenesis are feasible at temperatures as low as 4 to 15 °C. Indeed, although hydrolysis can be the rate limiting step, especially at temperatures below 8 °C,16 operation is feasible at ‘fairly’ cold temperatures (15 °C).17
This raises the question of which reactor format to use for the treatment of wastewaters at extremely low temperatures. The AnMBR (anaerobic membrane bio-reactor) has been promoted in numerous studies of low temperature anaerobic wastewater treatment.18,19 The operational costs of this technology20 though make AnMBR's utility questionable for domestic wastewater applications; there is simply not enough energy in domestic wastewater to run a membrane bioreactor.21
UASB reactors are a proven low-cost technology for the treatment of wastewaters: albeit so far only in tropical climates.10 We wished to know if UASB will treat wastewater at 4 °C. In so doing we were mindful that the lower the temperature, the more solidified/crystallized the organic compounds become.22,23 Moreover, early work may have sidestepped this important practical issue by working with synthetic wastewaters, lacking sulphate and indigenous (non-acclimated) bacteria.13,19,24,25
We therefore elected to compare UASB with and without a membrane, fed with really wastewater at 4 °C. We characterized the microbial community developed in the reactor(s) to understand which consortia developed in each phase (MBR, mixed liquor). Cell specific methanogenic activities were obtained in situ (wastewater-fuelled) to determine the intrinsic treatment properties of the biomass.
2. Methodology
2.1. Reactor setup and operation
![[thin space (1/6-em)]](https://www.rsc.org/images/entities/char_2009.gif) :
:![[thin space (1/6-em)]](https://www.rsc.org/images/entities/char_2009.gif) 6; height: 600 mm; upflow velocity: 0.6 m h−1) were seeded with a cold-adapted inoculum (16.8 ± 3.0 gTSS L−1 and 1.0 ± 0.1 gVSS L−1 mixed liquor); the low VSS
6; height: 600 mm; upflow velocity: 0.6 m h−1) were seeded with a cold-adapted inoculum (16.8 ± 3.0 gTSS L−1 and 1.0 ± 0.1 gVSS L−1 mixed liquor); the low VSS![[thin space (1/6-em)]](https://www.rsc.org/images/entities/char_2009.gif) :
:![[thin space (1/6-em)]](https://www.rsc.org/images/entities/char_2009.gif) TSS (volatile and total suspended solids) reflects the origin of the biomass (soils/sediments rich in silt and gravel) collected from Lake Geneva (N 46° 23′04′′, E 6° 25′07′′; (average temperature −11–17 °C)). The inoculum has been previously subjected to low temperature wastewater treatment trials (published and un-published).16,17,24,26 After a preliminary batch trial, one of the two UASBs, was equipped with a polyvinylidene fluoride (PVDF) hollow fibre membrane (hydrophobic, pore size 0.1 μm) unit. Both reactors were equipped with a gasbag (Sigma Aldrich, UK) for gas storage, fitted with a sample port. The hoses of both reactors were frequently cleansed to prevent biofilm formation. A syringe was incorporated downstream of the membrane to allow evaluation of the resistance of the membrane to safeguard the membrane against over-pressure and damage.
TSS (volatile and total suspended solids) reflects the origin of the biomass (soils/sediments rich in silt and gravel) collected from Lake Geneva (N 46° 23′04′′, E 6° 25′07′′; (average temperature −11–17 °C)). The inoculum has been previously subjected to low temperature wastewater treatment trials (published and un-published).16,17,24,26 After a preliminary batch trial, one of the two UASBs, was equipped with a polyvinylidene fluoride (PVDF) hollow fibre membrane (hydrophobic, pore size 0.1 μm) unit. Both reactors were equipped with a gasbag (Sigma Aldrich, UK) for gas storage, fitted with a sample port. The hoses of both reactors were frequently cleansed to prevent biofilm formation. A syringe was incorporated downstream of the membrane to allow evaluation of the resistance of the membrane to safeguard the membrane against over-pressure and damage.
The starting sludge loading rate (SLR) was initially 0.2 kgCOD kgVSS−1 per day (conc. of VSS in the mixed liquor during start-up of 1.0 g m−3); however, since the inocula were initially soils and sediments rich in plant materials not all this VSS encompasses bacteria. From enumeration (Petropoulos et al., 2019),17 we expect a population of ≈5 × 10⁷ cells per ml inoculum. Using a bacterial mass of 10−12 gVSS per cell this would correspond to a start up at an excessive SLR of 46 ± 1.5 kgCOD kg VSbacterial−1 per day. This operational variable may be far too increased for satisfactory operation, but is expected due to the biomass' nature (sediment rather than anaerobic sludge).
2.2. Chemical analysis
Samples from the liquid phase were removed from reactors using sterile syringes and transferred to sterile 2 ml microcentrifuge tubes and then centrifuged (3 min at 13![[thin space (1/6-em)]](https://www.rsc.org/images/entities/char_2009.gif) 000 × g) to obtain a supernatant for analysis. The supernatant was analysed by ion exchange chromatography.
000 × g) to obtain a supernatant for analysis. The supernatant was analysed by ion exchange chromatography.
2.3. Molecular analysis
Detailed procedure for microbial analysis including DNA extraction, qPCR and Illumina HiSeq sequencing analysis was similar to that previously described in Shamurad et al., (2019).29–31![[thin space (1/6-em)]](https://www.rsc.org/images/entities/char_2009.gif) 000 rpm of total vol. of 1 ml). This DNA extract was used for quantification. The mixture was generated after scraping the biofilm from the membrane, allowing it to drop into the mixed liquor. For sequencing, separate biofilm and mixed liquor masses were used for extraction. Total genomic DNA was extracted using a protocol based on CTAB and C6H6O:CHCl3:C5H12O in which the addition of CHCl3:C5H12O was carried out twice to minimize the presence of C6H6O in the sample; 2 ml Eppendorf tubes with Phase Lock Gel® (VWR, UK) were also used to separate the generated phases (described at Petropoulos et al., 2019).17 The DNA extractions for qPCR enumeration were carried out on samples collected on days 6, 39, 50, 60, 68, 130 and 181, DNA for sequencing was only abstracted on the final experimental date after relatively stable operation with regard to feeding and microbial counts (as per cell enumeration, qPCR – see below). The quality of the DNA, prior to further analysis were found within 1.8 to 2.1 for the 260
000 rpm of total vol. of 1 ml). This DNA extract was used for quantification. The mixture was generated after scraping the biofilm from the membrane, allowing it to drop into the mixed liquor. For sequencing, separate biofilm and mixed liquor masses were used for extraction. Total genomic DNA was extracted using a protocol based on CTAB and C6H6O:CHCl3:C5H12O in which the addition of CHCl3:C5H12O was carried out twice to minimize the presence of C6H6O in the sample; 2 ml Eppendorf tubes with Phase Lock Gel® (VWR, UK) were also used to separate the generated phases (described at Petropoulos et al., 2019).17 The DNA extractions for qPCR enumeration were carried out on samples collected on days 6, 39, 50, 60, 68, 130 and 181, DNA for sequencing was only abstracted on the final experimental date after relatively stable operation with regard to feeding and microbial counts (as per cell enumeration, qPCR – see below). The quality of the DNA, prior to further analysis were found within 1.8 to 2.1 for the 260![[thin space (1/6-em)]](https://www.rsc.org/images/entities/char_2009.gif) :
:![[thin space (1/6-em)]](https://www.rsc.org/images/entities/char_2009.gif) 280 and 230
280 and 230![[thin space (1/6-em)]](https://www.rsc.org/images/entities/char_2009.gif) :
:![[thin space (1/6-em)]](https://www.rsc.org/images/entities/char_2009.gif) 260 ratios (Nanodrop (ThermoFisher, UK)). The quality control of each batch of DNA extraction was ensured by preparing blank DNA samples following the same sample-preparation and DNA extraction methods.
260 ratios (Nanodrop (ThermoFisher, UK)). The quality control of each batch of DNA extraction was ensured by preparing blank DNA samples following the same sample-preparation and DNA extraction methods.
![[thin space (1/6-em)]](https://www.rsc.org/images/entities/char_2009.gif) 000 sequences per sample, covering ≥90% of the diversity.38
000 sequences per sample, covering ≥90% of the diversity.38
The feature table data was used to visualise microbial diversity (alpha and beta diversity) and non-metric multidimensional scaling (NMDS) on Unifrac distances (PCoA) using the phyloseq39 and MicrobiomSeq40 packages in R.41 Most of the bacterial sequences were not taxonomically assignable below genus level. Therefore, in this manuscript, the discussion of bacterial composition is mainly based on family and genus level with references to taxonomic levels at species levels where appropriate.
Quantitative PCR (qPCR) was used for the quantitation of methanogens and total bacteria in the reactors. The methanogenic groups were quantified using functional gene primers (mlas-f, mcrA-rev) for methanogens by using a previously described method by Steinberg and Regan (2008).42 The qPCR took place on a CFX96 real-time PCR system (Biorad, UK) using 39 cycles. Reaction conditions and reagents are given at Petropoulos et al., (2019).17 All qPCR reactions were performed in triplicates, efficiency was calculated based on the standards' trend. Starting quantity (SQ) from the qPCR as per gene copies per ml was converted to cells per ml.43 For quality control, the blank genomic DNA samples (see above) were analysed with each batch of real-time PCR and Illumina sequencing analyses.
2.4. Methanogenic activity assays
At the end of experimentation, the methanogenic activity of the biomass developed in the reactors was evaluated in 100 mL glass vials (with a rubber borosilicate seal) using two direct methanogenic substrates, acetate and formate, at concentrations of 1000 mgCOD L−1. The biomass added was adequate to achieve an assay F![[thin space (1/6-em)]](https://www.rsc.org/images/entities/char_2009.gif) :
:![[thin space (1/6-em)]](https://www.rsc.org/images/entities/char_2009.gif) M of ≈0.50 (gCOD
M of ≈0.50 (gCOD![[thin space (1/6-em)]](https://www.rsc.org/images/entities/char_2009.gif) :
:![[thin space (1/6-em)]](https://www.rsc.org/images/entities/char_2009.gif) gVSS). The operational temperature of the assay was selected as 4 and 37 °C as per the operational and the common assay temperature. Controls with unamended biomass were also included (fed with distilled water). All treatments were prepared in duplicate, prior to incubation, the pH was set to 7.0 ± 0.1. Methane was measured twice per day at 12 h intervals.
gVSS). The operational temperature of the assay was selected as 4 and 37 °C as per the operational and the common assay temperature. Controls with unamended biomass were also included (fed with distilled water). All treatments were prepared in duplicate, prior to incubation, the pH was set to 7.0 ± 0.1. Methane was measured twice per day at 12 h intervals.
The results are expressed as activity per methanogenic cell, after a qPCR enumeration that was carried out at the start of the assay (as per Petropoulos et al., (2019)17) as well as per gram of VS (assay VS). For the activity fuelled from the wastewater, the same cell-based approach as above was followed, where the methane produced through qPCR enumeration intervals was divided by the average number of cells measured between the two data points (as per Petropoulos et al., (2017)24) – the experimental days for that were: 6, 39, 50, 60, 68, 130 and 181.
3. Results and discussion
3.1. Batch trials
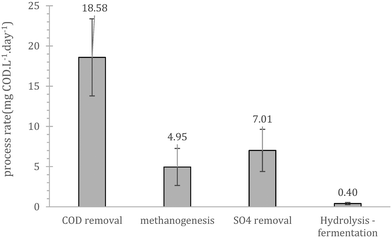
Prior to continuous operation the reactors were operated as batch fed reactors with internal recycle, to evaluate the salient process bio-conversion rates (hydrolysis/fermentation, sulphate reduction, methanogenesis and COD removal). Overall, the initial performance showed that cold adapted cells in the inoculum can utilize the substrate present in wastewater (Fig. 1). The rate limiting step during this trial was hydrolysis/fermentation, a result that was in line with those of previous batch studies using similar cold-adapted inocula.24 These scoping experiments showed that COD removal is mainly a combination of methane production and sulphate reduction with a combined rate equal to 12.0 mgCOD per day. The importance and competence of the sulfate reducing bacteria (SRB) at low temperatures has been previously highlighted by Virpiranta et al., (2019)44 and Madden et al., (2014)45 whilst their importance at wastewater treatment processes has been previously commented by van den Brand et al., (2018).46 The biological COD reduction processes accounted for 65% of the reduction, yielding a mass balance gap of 6.6 mgCOD per day. Similar gaps have been observed before,16,17,24 and were attributed to accumulation of un-hydrolysed matter, which is challenging to detect since such compounds are usually associated with biomass and typically not sampled for COD measurements.3.2. Acclimation period
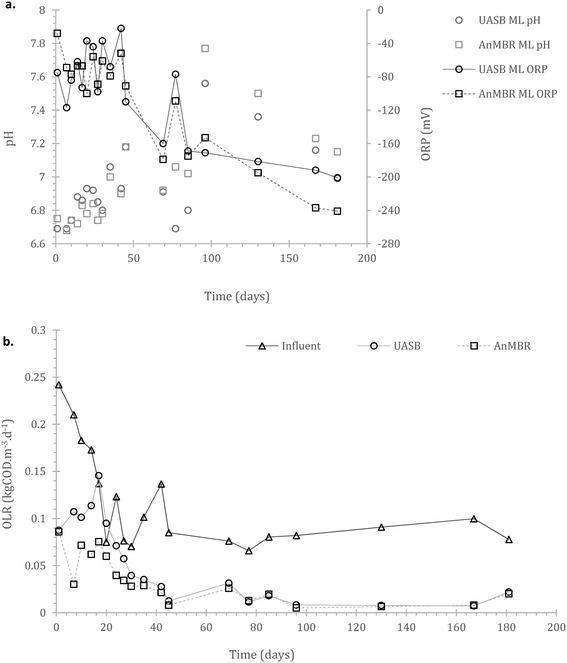
Acclimation period: after the initial batch fed period, the reactors were operated using a continuous feeding strategy, incorporating a membrane unit (MBR) in one of the two replicates. Their operation was monitored for 181 days. Operational consistency in most of the parameters monitored started appearing from day 40 onwards. This presumably signified the initiation of acclimation of the cells to both substrate and temperature.3.3. Continuous operation – wastewater treatment and process limitations
Inclusion of a membrane in a UASB accelerates start-up but comes with an increased CAPEX (capital cost). However, membranes can reduce operational cost especially during start-up, as in many cases collection and treatment of sub-standard effluent (until the consent is met) will be required. Hence, a key factor of an MBR setup at low temperatures is solely the trade-off between membrane cost and cost for effluent trucking during the start-up; after that a membrane is no longer necessary (as also has been demonstrated at 15 °C).17
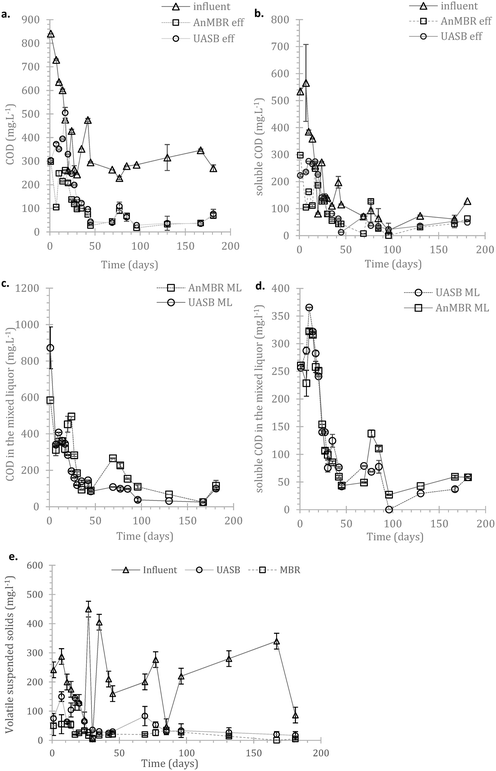
In the AnMBR the mixed liquor contributed to the COD treatment by 54.0 ± 8.9%, whilst the rest of the organic matter was removed by the biofilm (based on COD inlet, COD mixed liquor (ML) and COD effluent). The mixed liquor removal mechanism for the UASB contributed to the overall treatment by 87.1 ± 9.9% (whilst the rest was removed in the upper part of the UASB). Similarly, for the sCOD, 55.5 ± 8.8% and 70.3 ± 4.8% was removed by the mixed liquor of the AnMBR and the UASB respectively (Fig. 3a–d in the manuscript). This shows that the biofilm on the membrane was active; however, the activity was not as critical as previously observed by Smith et al., (2014).19 This may be attributed to the long HRT as well as the low LMH that allowed most of the treatment to take place in the mixed liquor.
Throughout operation, granulation was not apparent, and indeed not expected, due to the operational temperature and loading.50–52 In principle, granulation at low temperature is feasible, but the slow metabolic rates negatively impact cell-based agglomerates and making their preservation challenging.53
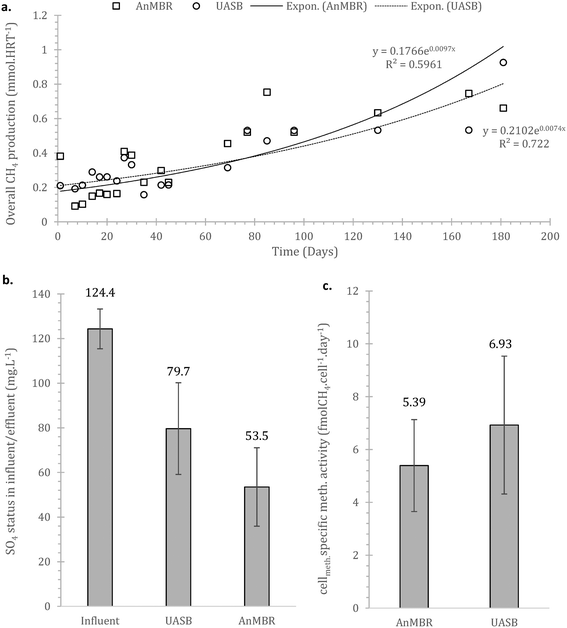
Sulphate reduction contributed in the COD removal as expected,55 also shown at the preliminary batch phase. On Fig. 4b it is observed that sulphate reduction was higher at the AnMBR compared to the UASB, this is likely related to the SRB (sulphate reducing bacteria) originated from the wastewater that due to the membrane remain in the system, acclimate and contribute to treatment whilst in the case of the UASB such cells will plausibly shock from the conditions and washout (ΔG0 −47 compared to −31 kJ per sulphate reduction and methanogenesis respectively).
The overall methane production from both systems was poor, with only the UASB able to almost reach energy neutrality (−0.001 ± 0.012 kW h m−3, as compared to the AnMBR with −0.3113 ± 0.006 kW h m−3) – under the assumption that all methane in the effluent can be recovered (detailed references and life cycle assessment in Appendix Table S1†). In the scenario where the SO4 in the influent is depleted or not absent, the balance becomes positive for the UASB, the AnMBR though remains energy negative (0.0664 ± 0.025 and −0.288 ± 0.024 kW h m−3 respectively). This highlights that the COD in the domestic wastewater that can be methanised at 4 °C will generally not be sufficient to support energy neutrality in the case of advanced treatment (i.e. with membranes). Employing more simple setups (i.e. UASB) can be a viable option, especially as this anaerobic (pre-)treatment technology does not require energy for oxygenation, which was kept out of the above calculations.
Due to the high error bars (rates above) it is unclear whether AnMBR or UASB hydrolysis occurred consistently faster. The status of the COD and sCOD in the mixed liquor of the two systems (Fig. 3c and d) indicates that hydrolysis of particulate matter in AnMBR is increased compared to for the UASB. This is expected considering that more of the metabolically active cells remain in the reactor. Another interesting observation is the abundance of Bacteroidales (also shown later), a robust hydrolyser,56 on the biofilm. The overall picture though shows that hydrolysis is crucial in these temperatures but AnMBR has clear advantage over UASB only during the start-up.
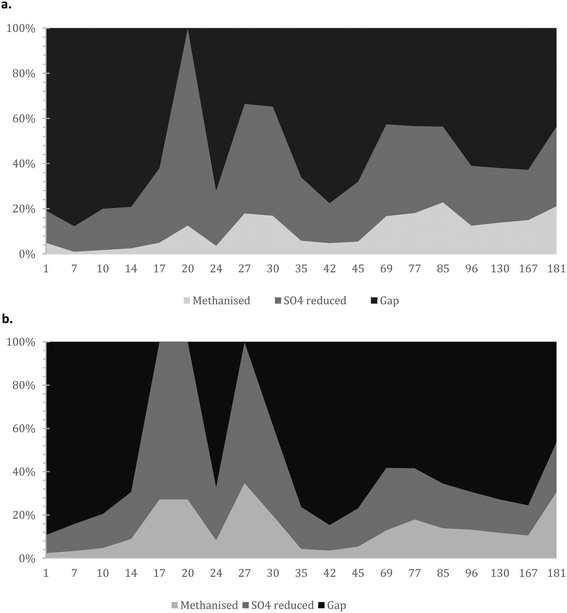 | ||
| Fig. 5 Mass balance with focus on i) COD methanised; ii) COD used for sulphate reduction; and iii) presumably accumulated/un-hydrolysed COD for the a) AnMBR and b) UASB reactors. | ||
It is crucial that the rate of gasification via methane or sulphate reduction increases over time (to claim treatment and prevent solids' build up). The rates of methane production in the mass balance were increasing faster than the sulphate reduction rates, a fact that might need further investigation since this is thermodynamically unfavourable (plausible syntrophic interaction). The increase of the number of the methanogenic cells though support this finding (Fig. 6). The rate of increase of methanogenesis in the balance is slightly higher for the AnMBR compared to the UASB (trends of: AnMBR 2.2% increase per day; UASB 1.99% increase per day (Fig. 5a and b)). Overall, only a small amount of organic matter turns into methane during the start-up of the reactors where the larger amount is utilized for sulphate reduction (SRB). This is reversible for the UASB due to the fact that mainly resilient cells remain in the reactor and adapt to the conditions.17
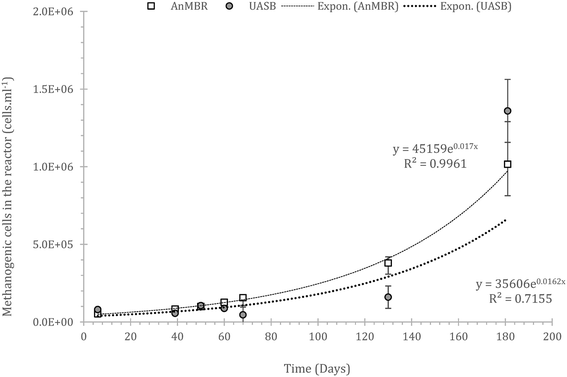 | ||
| Fig. 6 Population of the methanogenic cells developed in the two reactors (AnMBR, summation of the cells grown in both biofilm and mixed liquor); error bars stand for standard error, n = 3. | ||
Interestingly, gas formation/sulphate reduction peaks between the two systems were aligned signifying the importance of the wastewater composition in biodegradability and indirectly showing that the qualitative parameters in the reactor (diversity) is similar, the quantity of the cells may not. Thus, acclimation is related to the number of cells that can only increase at optimal conditions.
3.4. Microbial diversity and dynamics
Generally, the overall number of methanogens was low. Populations in upflow reactors are typically ≈109 methanogens per ml,59,60 whilst, there is no reason, in principle, why these numbers cannot be reached in such reactors under such conditions, but it could take a very long time (>590 days as per the equations from Fig. 6). However, much lower numbers can lead to satisfactory treatment if the cell specific activity is high enough.24 It is not yet known what is the maximum capacity of the reactor with regards to community size as a plateau in the methanogenic population has not been observed; however, the lack of lag-phase in both cells or mass balance has not appeared, underlining the slow growth at such conditions.
The methanogens in the AnMBR, grew consistently whilst in the UASB growth rates fluctuated. Fluctuations are typical in biological reactors operating under harsh conditions where acclimation is essential.13 In lab-scale, fluctuations after acclimation is not expected as conditions are consistent, in reality though, conditions vary (diurnal and seasonal cycle), thus, acclimation must be rapid to cope with treatment.
![[thin space (1/6-em)]](https://www.rsc.org/images/entities/char_2009.gif) 048
048![[thin space (1/6-em)]](https://www.rsc.org/images/entities/char_2009.gif) 000 reads. The number of sequences in the highest and smallest libraries ranged between 35
000 reads. The number of sequences in the highest and smallest libraries ranged between 35![[thin space (1/6-em)]](https://www.rsc.org/images/entities/char_2009.gif) 000 and 89
000 and 89![[thin space (1/6-em)]](https://www.rsc.org/images/entities/char_2009.gif) 000. Qiime2 pipeline analysis of the sequence libraries identified a total of 12
000. Qiime2 pipeline analysis of the sequence libraries identified a total of 12![[thin space (1/6-em)]](https://www.rsc.org/images/entities/char_2009.gif) 850 bacterial taxa (accounting for ∼95% of sequence reads) and 142 archaeal taxa (∼5.0% of reads).
850 bacterial taxa (accounting for ∼95% of sequence reads) and 142 archaeal taxa (∼5.0% of reads).
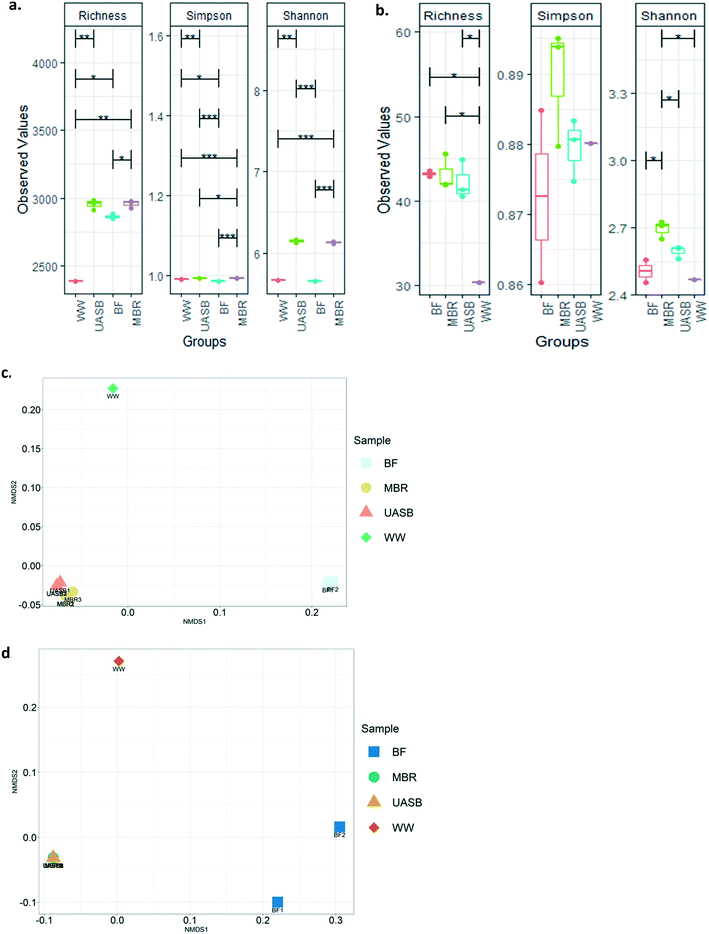
There were little or no detectable differences between diversity indices in the mixed liquors in both kinds of reactors. However, the diversity (richness) of the MBR biofilm was significantly lower (p < 0.05) than the MBR mixed liquor (Fig. 7a and b). The diversity indices indicated that the community of the wastewater was significantly lower in diversity (Fig. 7a and b) and distinct (p < 0.05) from (Fig. 7c and d) that of the reactors.
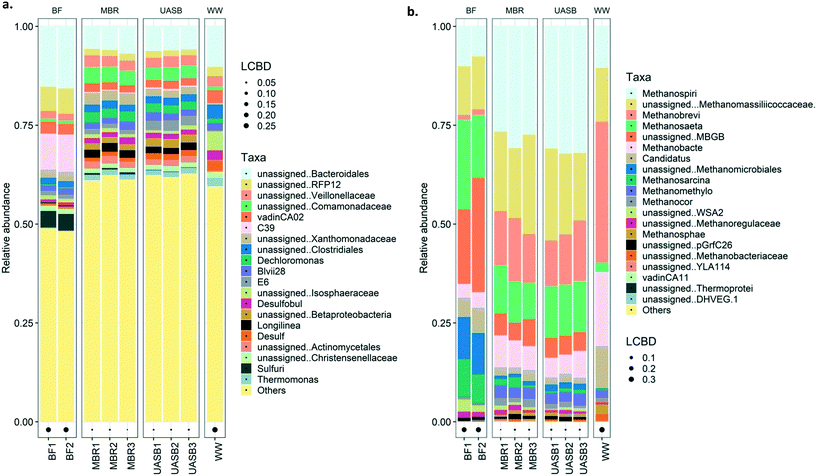
The composition of the archaea and the bacteria in the UASB and the MBR were reproducible within the replicate samples taken (Fig. 7c and d and S2a and b†). There were small, but clear differences, between the bacterial, but not in the archael composition of the reactors (Fig. 7c and d and 8a and b and S2a and b†). We cannot say with certainty that treatment relied on biofilm since as we will see above the treatment efficiencies between AnMBR and UASB were not tremendously different, confirming that treatment can be independent of reactor regime after satisfactory acclimation.17,24 This explains why bio-augmentation could work when the inoculum amended is specialized on the operational conditions (i.e. Cui et al., (2014)61 at 10 °C).
However, archaea in the biofilms were the exception and were, for some reason, different. The treatment communities in all reactors remained relatively distinct from the wastewater community, suggesting that, even after 180 days, the latter had not had a substantial effect on the former.
Generally, the bacterial families dominating the reactor samples were Rhodocyclaceae, Comamonadaceae, Anaerolinaceae, Xanthomonadaceae, and unassigned Bacteroidales (Fig. 8a; further details on Fig. S4† (top 20)). Most of these families are, as mentioned, common families in anaerobic digesters. Rhodocyclaceae is a common family able to produce H2 with main presence in the biofilm.62 This indirectly highlights that syntrophic interactions may be promoted in the biofilm63 considering that typical hydrogenotrophs (i.e. Methanomicrobiales, Methanosarcina) were abundant mainly in the biofilm. Anaerolinaceae on the other hand is a typical acetate producer cell, intermediate that can be utilized by both acetotrophic methanogens (i.e. Methanosaeta) that were abundant in both mixed liquor and biofilm but also sulphate reducers (i.e. Costridiales and Desulfovibrionaceae; Longlinea at a genus level) (Fig. 8a). Xanthomonadaceae were abundant in the mixed liquor, heterotrophs able to produce EPS (xanthan) involved in biofilm formation;64 however it is a surprise they were in low abundance at the biofilm. Interesting is the predominance of Bacteroidales in the biofilm, a family with reputable hydrolytic activity, especially for substrates like lignin and lipids;56 lipids is a common bottleneck in such temperatures16 with some technological breakthroughs appearing only recently.65 Interesting is the presence of the sulfuric genus at the MBR reactor, especially on the biofilm, this may be the cause of the increased sulphate reduction at the AnMBR setup; this genus was not present at the wastewater. From the top 20 families/genus, nothing unique was observed in the wastewater, however, communities present in the reactors were not in high abundance in the substrate. Interestingly, the presence of the Comamonadaceae, a typical VFA-oxidizer66 in anaerobic digesters was observed predominating at the AnMBR setup, as also observed by Vincent et al., (2018).67
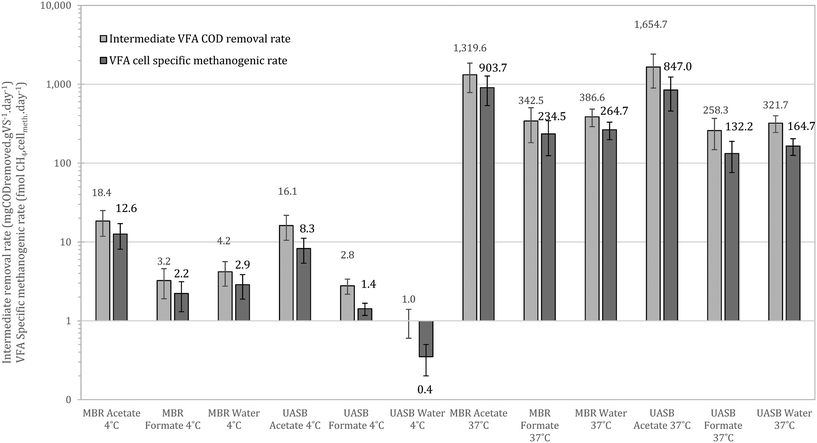
At 37 °C the pattern did not change, with acetotrophy the predominant pathway and hydrogenotrophy mainly achieved from the cells originated from the UASB but not at a net rate (removing the activity from the unamended) (Fig. 9). Interestingly, hydrogenotrophic methanogenesis is mainly feasible at 4 °C whilst at 37 °C the activity is ‘covered’. This signifies that cold-adapted methanogens can be developed in more dynamic setups, like the UASB, where sludge washout of less acclimated species is feasible (observation aligned with qPCR data in this study as well as with Petropoulos et al., 2019).17
Comparing the results with those of Petropoulos et al., (2019),17 we see that the two systems, as expected, operate slower at 4 °C compared at 15 °C. When at 37 °C though the activity from the inoculum acclimated at 4 °C is up to 8 times higher than at 15 °C (reference as above). This supports the hypothesis that acclimation at low temperatures forms a robust methanogenic community that can operate as well or better than biomass originally acclimated at higher temperatures. Similar behaviour has been observed for lipid hydrolysers enriched at low temperatures.16
4. Conclusions
Continuous anaerobic treatment of domestic wastewater is feasible at temperatures as low as 4 °C. Under these harsh conditions, treatment efficiency and rate of methanogenesis were not affected by the introduction of a membrane in a UASB setup and treatment is dependent on the biomass. Microbial community analysis in the UASB with and without a membrane confirmed the congruence of the two set-ups. The only, and striking, difference between the two was the microbial community on the membrane itself, which was markedly different from the communities in the mixed liquor. Conspicuous presence of Methanosaeta and Methanosarcinales suggests that acetoclastic methanogenesis was more prevalent on the membrane and by inference suggests that the acetate oxidizing pathway was prominent in the mixed liquor of the two systems. The presence of a distinctly different microbial community on the membrane is expected to make the system more efficient and resilient, but this seems irrelevant to cold conditions.Conflicts of interest
The authors declare that there is no conflict of interest.Acknowledgements
This work was funded by the BBSRC (BB/K003240/1; Engineering synthetic microbial communities for biomethane production). Sequencing was performed at Earlham Institute, Norwich, UK by the Prof. Swarbreck team.References
- V. Srinivasan, E. F. Lambin, S. M. Gorelick, B. H. Thompson and S. Rozelle, The nature and causes of the global water crisis: Syndromes from a meta-analysis of coupled human-water studies, Water Resour. Res., 2012, 48, W10516, DOI:10.1029/2011WR011087.
- M. Henze and Y. Comeau, Wastewater Characterization, in Biological Wastewater Treatment: Principles Modelling and Design, ed. M. Henze, M.C.M. van Loosdrecht, G.A. Ekama and D. Brdjanovic, IWA Publishing, London, UK, 2008 Search PubMed.
- Z. Dai, E. S. Heidrich, J. Dolfing and A. P. Jarvis, Determination of the relationship between the energy content of municipal wastewater and its chemical oxygen demand, Environ. Sci. Technol. Lett., 2019, 6, 396–400 CrossRef CAS.
- E. S. Heidrich, T. P. Curtis and J. Dolfing, Determination of the internal chemical energy of wastewater, Environ. Sci. Technol., 2011, 45(2), 827–832 CrossRef CAS.
- N. Voulvoulis, Curr. Opin. Environ. Sci. Health, 2018, 2, 32–45 CrossRef.
- UWWTD (Urban Waste Water Treatment Directive) 91/271/EC, 1991 European Council, Article 130S, L 135 , 30 May 1991, pp. 40–52.
- T. K. L. Nguyen, H. H. Ngo, W. Go, S. W. Chang, D. C. Nguyen, L. D. Nghiem, Y. Liu, B. Ni and F. I. Hai, Insight into greenhouse gases emissions from the two popular treatment technologies in municipal wastewater treatment processes, Sci. Total Environ., 2019, 671, 1302–1313 CrossRef CAS.
- A. C. van Haandel and G. Lettinga, Anaerobic sewage treatment: a practical guide for regions with hot climat, John Wiley and Sons Ltd., Chichester, UK, 1st edn, 1994 Search PubMed.
- I. Angelidaki, L. Ellegaard and B. K. Ahring, A comprehensive model of anaerobic bioconversion of complex substrates to biogas, Biotechnol. Bioeng., 1999, 63, 363–372 CrossRef CAS.
- T. Bressani-Ribeiro, L. A. Chamhum-Silva and C. A. L. Chernicharo, Constraints, performance and perspectives of anaerobic sewage treatment: lessons from full-scale sewage treatment plants in Brazil, Water Sci. Technol., 2019, 80, 418–425 CrossRef CAS.
- E. J. Bowen, J. Dolfing, R. J. Davenport, F. L. Read and T. P. Curtis, Low-temperature limitation of bioreactor sludge in anaerobic treatment of domestic wastewater, Water Sci. Technol., 2014, 69, 1004–1013 CrossRef CAS.
- C. Keating, D. Hughes, T. Mahony, D. Cysneiros, U. Z. Ijaz, C. J. Smith and V. O'Flaherty, Cold adaptation and replicable microbial community development during long-term low-temperature anaerobic digestion treatment of synthetic sewage, FEMS Microbiol. Ecol., 2018, 94, fiy095 CrossRef CAS.
- R. M. McKeown, C. Scully, T. Mahony, G. Collins and V. O'Flaherty, Long-term (1243 days), low-temperature (4-15 °C), anaerobic biotreatment of acidified wastewaters: Bioprocess performance and physiological characteristics, Water Res., 2009, 43, 1611–1620 CrossRef CAS.
- Y. Miron, G. Zeeman, J. B. van Lier and G. Lettinga, The role of sludge retention time in the hydrolysis and acidification of lipids, carbohydrates and proteins during digestion of primary sludge in CSTR systems, Water Res., 2000, 34, 1705–1713 CrossRef CAS.
- R. R. Dague, G. C. Banik and T. G. Ellis, Anaerobic sequencing batch reactor treatment of dilute wastewater at psychrophilic temperatures, Water Environ. Res., 1998,(70), 155–160 CrossRef CAS.
- E. Petropoulos, J. Dolfing, Y. Yu, M. J. Wade, E. Bowen, R. J. Davenport and T. P. Curtis, Lipolysis of domestic wastewater in anaerobic reactors operating at low temperatures, Environ. Sci.: Water Res. Technol., 2018, 7, 1002–1013 RSC.
- E. Petropoulos, Y. Yu, S. Tabraiz, A. Yakubu, T. P. Curtis and J. Dolfing, High rate domestic wastewater treatment at 15 °C using anaerobic reactors inoculated with cold-adapted sediments/soils – shaping robust methanogenic communities, Environ. Sci.: Water Res. Technol., 2019, 5, 70–82 RSC.
- A. L. Smith, S. J. Skerlos and L. Raskin, Psychrophilic anaerobic membrane bioreactor treatment of domestic wastewater, Water Res., 2013, 47, 1655–1665 CrossRef CAS.
- A. L. Smith, S. J. Skerlos and L. Raskin, Anaerobic membrane bioreactor treatment of domestic wastewater at psychrophilic temperatures ranging from 15 to 3°C, Environ. Sci.: Water Res. Technol., 2014, 1, 56–64 RSC.
- S. Judd, The MBR book: Principles and applications of membrane bioreactors for water and wastewater treatment, Elsevier, Amsterdam, 2010 Search PubMed.
- A. L. Smith, L. B. Stadler, L. Cao, N. G. Love, L. Raskin and S. J. Skerlos, Navigating wastewater energy recovery strategies: A life cycle comparison of anaerobic membrane bioreactor and conventional treatment systems with anaerobic digestion, Environ. Sci. Technol., 2014, 48, 5972–5981 CrossRef CAS.
- P. Hu. X. Xu and L. Yu, Effect of fatty acid chain length on the crystallization behaviour of trans-free margarine basestocks during Storage, J. Oleo Sci., 2017, 66, 353–362 CrossRef.
- J. B. Brown, Low-temperature crystallization of the fatty acids and glycerides, Chem. Rev., 1941, 29, 333–354 CrossRef CAS.
- E. Petropoulos, J. Dolfing, R. J. Davenport, E. J. Bowen and T. P. Curtis, Developing cold-adapted biomass for the anaerobic treatment of domestic wastewater at low temperatures, Water Res., 2017, 112, 100–109 CrossRef CAS.
- A. Donoso-Bravo, C. Retamal, M. Carballa, G. Ruiz-Filippi and R. Chamy, Influence of temperature on the hydrolysis, acidogenesis and methanogenesis in mesophilic anaerobic digestion: parameter identification and modelling application, Water Sci. Technol., 2009, 60, 9–17 CrossRef CAS.
- E. Petropoulos, Investigating the true limits of anaerobic treatment of wastewater at low temperature using a cold adapted inoculum, Ph.D. Thesis, Newcastle University, (UK), 2015 Search PubMed.
- E. Petropoulos, B. Shamurad, K. Acharya and S. Tabraiz, 2020 Domestic wastewater hydrolysis and lipolysis during start-up in anaerobic digesters and microbial fuel cells at moderate temperatures, Int. J. Environ. Sci. Technol., 2020, 17, 27–38 CrossRef.
- APHA, Standard methods for the examination of water and wastewater, APHA, 1986 Search PubMed.
- B. Shamurad, N. Gray, E. Petropoulos, S. Tabraiz, K. Acharya, M. Quintela-Baluja and P. Sallis, Co-digestion of organic and mineral wastes for enhanced biogas production: Reactor performance and evolution of microbial community and function, Waste Manage., 2019, 87, 313–325 CrossRef CAS.
- B. Shamurad, N. Gray, E. Petropoulos, S. Tabraiz, K. Acharya, M. Quintela-Baluja and P. Sallis, Data of metal and microbial analyses from anaerobic co-digestion of organic and mineral wastes, Data Brief, 2019, 103934 CrossRef.
- B. Shamurad, P. Sallis, E. Petropoulos, S. Tabraiz, C. Ospina, P. Leary, J. Dolfing and N. Gray, Stable biogas production from single-stage anaerobic digestion of food waste, Appl. Energy, 2020, 263 Search PubMed.
- J. J. Kozich, S. L. Westcott, N. T. Baxter, S. K. Highlander and P. D. Schloss, Development of a dual index sequencing strategy and curation pipeline for analyzing amplicon sequence data on the MiSeq Illumina sequencing platform, Appl. Environ. Microbiol., 2013, 79, 5112–5120 CrossRef CAS.
- J. G. Caporaso, C. L. Lauber, W. A. Walters, D. Berg-Lyons, C. A. Lozupone and P. J. Turnbaugh, et al., Global patterns of 16S rRNA diversity at a depth of millions of sequences per sample, Proc. Natl. Acad. Sci. U. S. A., 2011, 108, 4516–4522 CrossRef CAS.
- A. Klindworth, E. Pruesse, T. Schweer, J. Peplies, C. Quast, M. Horn and F. O. Glöckner, Evaluation of general 16S ribosomal RNA gene PCR primers for classical and next-generation sequencing-based diversity studies, Nucleic Acids Res., 2013, 41, 1 CrossRef.
- B. Wintsche, N. Jehmlich, D. Popp, H. Harms and S. Kleinsteuber, Metabolic adaptation of methanogens in anaerobic digesters upon trace element limitation, Front. Microbiol., 2018, 9, 405 CrossRef.
- P. N. Evans, J. A. Boyd, A. O. Leu, B. J. Woodcroft, D. H. Parks and P. Hugenholtz, et al., An evolving view of methane metabolism in the Archaea, Nat. Rev. Microbiol., 2019, 17, 219 CrossRef CAS.
- J. G. Caporaso, J. Kuczynski, J. Stombaugh, K. Bittinger, F. D. Bushman, E. K. Costello, N. Fierer, A. G. Pena, J. K. Goodrich and J. I. Gordon, QIIME allows analysis of high throughput community sequencing data, Nat. Methods, 2010, 7, 335 CrossRef CAS.
- C. Quince, T. P. Curtis and W. T. Sloan, The rational exploration of microbial diversity, ISME J., 2008, 2, 997 CrossRef CAS.
- P. J. McMurdie and S. Holmes, Phyloseq: an R package for reproducible interactive analysis and graphics of microbiome census data, PLoS One, 2013, 8(4), 61217 CrossRef.
- A. Ssekagiri, W. Sloan and U. Ijaz, MicrobiomeSeq: An R package for analysis of microbial communities in an environmental context ISCB Africa ASBCB conference, 2017, DOI:10.13140/RG.2.2.17108.71047.
- R, C.T. (2013): A language and environment for statistical computing. R Foundation for Statistical Computing. Available at: http://www.r-project.org/.
- L. M. Steinberg and J. M. Regan, Phylogenetic comparison of the methanogenic communities from an acidic, oligotrophic fen and an anaerobic digester treating municipal wastewater sludge, Appl. Environ. Microbiol., 2008, 74, 6663–6671 CrossRef CAS.
- M. V. Simankova, O. R. Kotsyurbenko, T. Lueders, A. N. Nozhevnikova, B. Wagner, R. Conrad and M. W. Friedrich, Isolation and characterization of new strains of methanogens from cold terrestrial habitats, Syst. Appl. Microbiol., 2003, 26, 312–318 CrossRef.
- H. Virpiranta, S. Taskila, T. Leiviskä, J. Rämö and J. Tanskanen, Development of a process for microbial sulfate reduction in cold mining waters – Cold acclimation of bacterial consortia from an Arctic mining district, Environ. Pollut., 2019, 252, 281–288 CrossRef CAS.
- P. Madden, A. M. Al-Raei, A. M. Enright, F. A. Chinalia, D. de Beer, V. O'Flaherty and G. Collins, Effect of sulfate on low-temperature anaerobic digestion, Front. Microbiol., 2014, 5, 376 Search PubMed.
- T. van den Brand, L. Snip, L. Palmen, P. Weij, J. Sipma and M. van Loosdrecht, Sulfate reducing bacteria applied to domestic wastewater, Water Pract Tech, 2018, 13(3), 542–554 CrossRef.
- M. Takahashi, T. Yamaguchi, Y. Kuramoto, A. Nagano, S. Shimozaki, H. Sumino, N. Araki, Y. Yamazaki, S. Kawakami and H. Harada, Performance of a pilot-scale sewage treatment: An up-flow anaerobic sludge blanket (UASB) and a down-flow hanging sponge (DHS) reactors combined system by sulfur-redox reaction process under low-temperature conditions, Bioresour. Technol., 2011, 102(2), 753–757 CrossRef CAS.
- B. E. Rittman and P. L. McCarty, Environmental Biotechnology, McGraw-Hill, Singapore, 2001 Search PubMed.
- G. Tchobanoglous, F. Burton and H. D. Stensel, Wastewater Engineering: Treatment and Reuse, McGraw-Hill, Metcalf & Eddy, Inc., Boston, 2003 Search PubMed.
- J. Dolfing, Granulation in UASB reactors, Water Sci. Technol., 1986, 18, 15–25 CrossRef CAS.
- B. Lew, M. Belavski, S. Admon, S. Tarre and M. Green, Temperature effect on UASB reactor operation for domestic wastewater treatment in temperate climate regions, Water Sci. Technol., 2003, 48, 25–33 CrossRef CAS.
- W. Zhou, T. Imai, M. Ukita, M. Sekine and T. Higuchi, Triggering forces for anaerobic granulation in UASB reactors, Process Biochem., 2006, 41, 36–43 CrossRef CAS.
- J. O'Reilly, F. A. Chinalia, T. Mahony, G. Collins, J. Wu and V. O'Flaherty, Cultivation of low-temperature (15C), anaerobic, wastewater treatment granules, Lett. Appl. Microbiol., 2009, 49, 4, DOI:10.1111/j.1472-765X.2009.02682.x.
- J. Dolfing and D. B. Janssen, Estimates of Gibbs free energies of formation of chlorinated aliphatic compounds, Biodegradation, 1993, 5, 21e28 Search PubMed.
- T. P. H. van den Brand, K. Roest, G. H. Chen, D. Brdjanovic and M. C. M. van Loosdrecht, Potential for beneficial application of sulfate reducing bacteria in sulfate containing domestic wastewater treatment, World J. Microbiol. Biotechnol., 2015, 31, 1675–1681 CrossRef CAS.
- M. Westerholm and A. Schnürer, Microbial responses to different operating practices for biogas production systems, IntechOpen, 2018, DOI:10.5772/intechopen.82815.
- B. Lew, I. Lustig, M. Beliavski, T. Sheldon and M. Green, An integrated UASB-sludge digester system for raw domestic wastewater treatment in temperate climates, Bioresour. Technol., 2011, 102, 4921–4924 CrossRef CAS.
- N. Mahmoud, G. Zeeman, H. Gijzen and G. Lettinga, Anaerobic sewage treatment in a one-stage UASB reactor and a combined UASB-Digester system, Water Res., 2004, 38, 2348–2358 CrossRef CAS.
- T. May, M. Koch-Singenstreu, J. Ebing, R. Stantscheff, L. Muller, F. Jacobi, D. Polag, F. Keppler and H. Konig, Design and application of a synthetic DNA standard for real-time PCR analysis of microbial communities in a biogas digester, Appl. Microbiol. Biotechnol., 2015, 99, 6855–6863, DOI:10.1007/s00253-015-6721-z.
- K. Bialek, J. Kim, C. Lee, G. Collins, T. Mahony and V. O'Flaherty, Quantitative and qualitative analyses of methanogenic community development in high-rate anaerobic bioreactors, Water Res., 2011, 45, 1298e1308, DOI:10.1016/ j.watres.2010.10.010.
- D. Cui, A. Li, T. Qiu, R. Cai, C. Pang, J. Wang, J. Yang, F. Ma and N. Ren, Improvement of nitrification efficiency by bioaugmentation in sequencing batch reactors at low temperature, Front. Environ. Sci. Eng., 2014, 8, 937 CrossRef CAS.
- E. J. Martínez, A. Sotres, C. B. Arenas, D. Blanco and O. Martínez, Improving anaerobic digestion of sewage sludge by hydrogen addition: Analysis of microbial populations and process performance, Energies, 2019, 12, 1228 CrossRef.
- M. McInerney, J. Sieber and R. Gunsalus, Genomic sequences reveal systems required to produce hydrogen and formate, plus other hallmarks of the syntrophic lifestyle, Microbe Mag., 2011, vol. 6, pp. 479–485 Search PubMed.
- E. M. Galván, M. V. Ielmini, Y. N. Patel, M. I. Bianco and E. A. Franceschini, Xanthan chain length is modulated by increasing the availability of the polysaccharide copolymerase protein GumC and the outer membrane polysaccharide export protein GumB, Glycobiology, 2013, 23, 259–272 CrossRef.
- S. Singh, B. C. Holohan, S. Mills, J. Castilla-Archilla, M. E. Kokko, J. Rintala, P. N. L. Lens, G. Collins and V. O'Flacherty, Enhanced Methanization of Long-Chain Fatty Acid Wastewater at 20°C in the Novel Dynamic Sludge Chamber–Fixed Film Bioreactor, Front. Microbiol., 2020, 8, 166 Search PubMed.
- H. D. Ariesyady, T. Ito and S. Okabe, Functional bacterial and archaeal community structures of major trophic groups in a full-scale anaerobic sludge digester, Water Res., 2007, 41, 1554–1568, DOI:10.1016/j.watres.2006.12.036.
- N. M. Vincent, Y. Wei, J. Zhang, D. Yu and J. Tong, Characterization and Dynamic Shift of Microbial Communities during Start-Up, Overloading and Steady-State in an Anaerobic Membrane Bioreactor, Int. J. Environ. Res. Public Health, 2018, 15, 1399 CrossRef.
- D. Rivière, V. Desvignes, E. Pelletier, S. Chaussonnerie, S. Guermazi, J. Weissenbach, T. Li, P. Camacho and A. Sghir, Towards the definition of a core of microorganisms involved in anaerobic digestion of sludge, ISME J., 2009, 3, 700–714, DOI:10.1038/ismej.2009.2.
- B. K. Harrison, H. Zhang, W. Berelson and V. J. Orphan, Variations in Archaeal and Bacterial Diversity Associated with the Sulfate-Methane Transition Zone in Continental Margin Sediments (Santa Barbara Basin, California), Appl. Environ. Microbiol., 2009, 1487–1499 CrossRef CAS.
- K. B. Sorensen and A. Teske, Stratified Communities of Active Archaea in Deep Marine Subsurface Sediments, Appl. Environ. Microbiol., 2006, 72, 4596–4603 CrossRef CAS.
- A. Vigneron, P. Cruaud, E. G. Roussel, P. Pignet, J. C. Caprais, N. Callac, M. C. Ciobanu, A. Godfroy, B. A. Cragg, J. R. Parkes, J. D. Van Nostrand, Z. He, J. Zhou and L. Toffin, Phylogenetic and Functional Diversity of Microbial Communities Associated with Subsurface Sediments of the Sonora Margin, Guaymas Basin, PLoS One, 2014, 9 DOI:10.1371/journal.pone.0104427.
- B. Young, R. Delatolla, K. Kennedy, E. Laflamme and A. Stintzi, Low temperature MBBR nitrification: Microbiome analysis, Water Res., 2017, 224–233 CrossRef CAS.
- G. Park, M. Takekawa, S. Soda, M. Ike and K. Furukawa, Temperature dependence of nitrogen removal activity by anammox bacteria enriched at low temperatures, J. Biosci. Bioeng., 2017, 123, 505–511 CrossRef CAS.
- S. He, L. Ding, Y. Pao, H. Hu, L. Ye and H. Ren, Nitrogen loading effects on nitrification and denitrification with functional gene quantity/transcription analysis in biochar packed reactors at 5
![[thin space (1/6-em)]](https://www.rsc.org/images/entities/char_2009.gif) °C, Sci. Rep., 2018, 8, 9844 CrossRef.
°C, Sci. Rep., 2018, 8, 9844 CrossRef.
Footnote |
| † Electronic supplementary information (ESI) available. See DOI: 10.1039/d0ew00753f |
| This journal is © The Royal Society of Chemistry 2021 |

