
 Open Access Article
 This Open Access Article is licensed under a
 Creative Commons Attribution 3.0 Unported Licence
Application of liquid-infused membranes to mitigate biofouling†
Hanieh
Bazyar
 ab,
Linya
Xu
b,
Hendrik Jan
de Vries
b,
Slawomir
Porada
ab and
Rob G. H.
Lammertink
*a
ab,
Linya
Xu
b,
Hendrik Jan
de Vries
b,
Slawomir
Porada
ab and
Rob G. H.
Lammertink
*a
aSoft Matter, Fluidics and Interfaces, MESA+ Institute for Nanotechnology, University of Twente, P. O. Box 217, 7500 AE Enschede, the Netherlands. E-mail: r.g.h.lammertink@utwente.nl; Tel: +31 53489 2063
bWetsus, European Centre of Excellence for Sustainable Water Technology, P. O. Box 1113, 8900 CC Leeuwarden, the Netherlands
First published on 17th September 2020
Abstract
Among different types of membrane fouling, biofouling is a critical issue which can significantly reduce the process productivity. If the initial phase of the microorganism attachment to the pore wall is prevented, a remarkable reduction in biofilm formation can be obtained. A novel approach to achieve this goal is the infusion of the porous membrane with an infusion liquid (oil) forming liquid-infused membranes (LIMs). It has been shown that the pore wall during permeation is still covered with the infusion liquid forming so-called liquid-lined pores. The liquid-lining can enhance anti-biofouling performance by preventing direct contact between the microorganisms and pore wall. Here, we investigate the capability of LIMs in mitigation of biofouling by conducting long-term cross-flow filtration experiments at constant flow rate for approximately 10–20 days. The results show significantly lower increase in transmembrane pressure (TMP) values for LIMs compared to non-infused counterparts (dry membranes). The bacterial growth curves are further investigated by fitting a sigmoidal function (logistic model). Approximately 4 times increase in the lag period λ and 7 times decrease in the bacterial growth rate μm are observed for LIMs compared to dry membranes revealing improved anti-biofouling performance of LIMs.
Water impactMembrane water treatment processes provide a versatile platform for selective solute separation and permeate water recycling, but are prone to fouling. This work presents a detailed analysis of the application of next-generation membranes with adaptive pores against biofouling. Our results show a lower transmembrane pressure increase, and bacterial population density in liquid-infused membrane compared to the unmodified commercial microfiltration membrane. |
Membrane fouling is a major problem in membrane filtration processes which curtails long-term operation. Biofouling, i.e. the accumulation of living material (or remnants of the decomposition thereof) on the membrane surface, has been known as a contributing factor to more than 45% of all membrane fouling.1,2 Controlling and monitoring biofouling are of great importance due to its adverse effects such as membrane flux decline, increased feed and transmembrane pressure (TMP), membrane biodegradation, and increased energy consumption.3 Membrane biofouling is related to the interaction of biosolids with the membrane. This interaction mainly consists of formation of biofilms or the accumulation of bioorganic materials including extracellular polymeric substances (EPS) on the membrane surface.4,5 So far, three fouling mechanisms are recognized for membrane biofouling. These mechanisms include adsorption of EPS to the membrane surface, pore clogging by cells, and sludge cake or film formation arising from the deposition of cells or aggregates. The relative importance of each mechanism is site-specific and depends on a number of factors.6 The attachment of microbial cells to the membrane surface is the first step of membrane biofouling leading to the formation of the biofilm layer.7
Passive and active strategies have been developed to mitigate biofilm formation by minimizing the deposition and growth of microorganisms on membrane surfaces.8–10 The passive strategies generally involve membrane surface modification by grafting,11,12 using polymer brushes,13 zwitterions14 and hydrophilic or superhydrophilic materials.15,16 The passive strategy performs well against fouling under low or mild fouling conditions. Under severe conditions this strategy may lose its efficiency due to the quick coverage of the membrane surface by the foulant layer.17 An active strategy could be to incorporate biocides on the membrane surface to deactivate bacteria and prevent biofilm formation.15,18 Long-term efficiency of active strategies is limited due to the eventual depletion of biocides or accumulation of dead cells on the membrane surface which will shield the antimicrobial material.19 An ideal anti-biofouling membrane should have both passive and active functions to minimize bacterial absorption and deactivate bacterial growth on the membrane surface.20 Recently, combination of both active and passive strategies have been used to improve anti-biofouling properties of thin-film composite forward osmosis (TFC-FO) membranes. Polydopamine coatings and silver nanoparticles (Ag NPs) were used as the passive and active antibacterial moieties respectively. Ag NPs were stable and active on membrane surfaces after 24 h of cross-flow operation.21
Combining antifouling and antimicrobial strategies has been highlighted as the most effective approach to mitigate membrane biofouling.15 Requirement of special chemicals, use of sophisticated techniques, a more complex and multi-step membrane functionalization are the main drawbacks of this method to mitigate membrane biofouling. Additionally, the passive methods fail in dynamic cross flow conditions due to their inability to inactivate the attached bacterial growth.21 Recently an approach has been introduced for bacterial inactivation without addition of specific or harsh chemicals. In these techniques, UV is generated internally inside the membrane module by using embedded radioluminescent particles which are excited by an external X-ray source. However, application of this method is limited to reactors and open areas that can accommodate lamps/LEDs and wiring.22 Therefore, the necessity for a new and simple method to mitigate biofouling during membrane processes still exists.
Here we report on the application of a novel type of membrane, i.e. a liquid-infused membrane (LIM), for mitigation of bacterial accumulation and growth. These membranes are inspired by a new class of functional surfaces, known as slippery liquid-infused porous surfaces (SLIPS).23 The capillary-stabilized liquid in the nano/microstructured surface forms a smooth lubrication layer on the surface responsible for its low water contact angle hysteresis and low-fouling properties.24–26 Other important features of these surfaces include self-healing by capillary wicking, repelling a variety of liquids, and anti-biofouling.23,24 Fabrication procedure of liquid-infused membrane includes infusion of the membrane with a low surface tension liquid that has a high affinity to the membrane material.23 Porous polymeric membranes with low surface energies, which are typically prepared from fluorinated polymers such as polyvinylidene fluoride (PVDF) and polytetrafluoroethylene (PTFE), can be used.26–28 The liquid-infused pore acts like a gate which can open and close in response to the immiscible feed fluid pressure.26 In the open state, the pore wall is still covered with the infusion liquid forming liquid-lined pores.26,28,29 The gating mechanism was previously explored by pushing nitrogen gas through liquid-infused pores.28 The liquid film thickness on the pore wall (liquid-lining) was estimated experimentally and theoretically. The presence of liquid-lining was further studied when water was pushed through via liquid–liquid displacement porometry (LLDP).29 In a broader extent, this dynamic liquid interface can lead to a tunable micro scale porous system. Such system can provide new opportunities for resolving fouling and recyclability issues of solid porous materials in applications ranging from energy source transportation, to wastewater treatments and phase separations such as gas/liquid transport.30,31 The concept of “smart gating membranes” achieved by controllable gating of porous membranes with nano- and micrometer-sized pores, is deeply investigated by Hou.32 The application of liquid-infused membranes was further investigated for separation of oil from oil-in-water (O/W) emulsions.33 The dispersed phase, oil from O/W emulsion, was successfully permeated through the membrane while the continuous phase, water, was being retained. A nice overview on the diverse applications of liquid-infused surface in the field of membrane technology was recently published.34 Liquid-infused surfaces show promising performance in the field of membrane technology, but also in other fields such as improving corrosion resistance of metals35 and bistable gas transport for serving as smart piston and valve.36
The anti-biofouling performance of SLIPS was first investigated by Epstein et al.24 It was shown that SLIPS are capable of preventing 99.6% of Pseudomonas aeruginosa growth over a period of 7 days as well as Staphylococcus aureus (97.2%) and Escherichia coli (96%). Both static and dynamic experiments were performed where liquid was flowing over the surface. In contrast to SLIPS, nanostructured superhydrophobic surfaces accumulate biofilm within hours. SLIPS showed approximately 35 times reduction of the attached biofilm compared to the best case scenario for improvement of anti-biofouling performance, i.e. PEGylated surfaces, over a far longer time frame. The inability of biofilms to firmly attach to SLIPS is a result of the non-adhesive “slippery” character of the smooth liquid interface. The growth of P. aeruginosa in the presence of 1% concentration of different infusion liquids, confirmed that inhibition of bacterial attachment on SLIPS was not a result of cytotoxicity of the infusion liquid. Overton et al. demonstrated the ability of the liquid-gated PTFE membranes to recover flux after both protein and bacterial fouling without the use of harsh chemicals or antibiotics.37 Flux recovery of liquid-gated membranes (LGMs, that are similar to LIMs) was observed during a 15- or 30 min cessation of flow or rest. A maximum of 60% recovery of the clean-membrane flux was observed compared to only 10% in membranes with no lubricant layer. The refilling of the pores with the lubricant forces the foulants from the pore wall. The flux recovery process was repeated for at least 12 consecutive cycles although it decreases with each subsequent cycle. This was mainly due to the accumulation of the cake layer combined with the loss of lubricant during filtration. The flux recovery of LGMs was also investigated after fouling with S. epidermidis biofilms. Since bacteria are able to grow on lubricated surfaces,38 LGMs demonstrated neither reduced surface biofilm formation nor recovered flux after a similar resting step. However, preformed S. epidermidis biofilms could be removed by exposure of the LGM to an air–water interface, resulting in a significant recovery of flux when compared to non-lubricated controls. Recently, the formation of Pseudomonas aeruginosa biofilms on Fluoropor-SLIPS has been investigated.39 Fluoropor is a highly fluorinated polymer foam with adjustable porosity which is made via radical emulsion polymerization. It has been shown that Fluoropor-SLIPS can significantly reduce the formation of a biofilm on the substrates over a time period of seven days in a flow chamber experiment. It was also demonstrated that lower surface roughness resulted in a more effective reduction of bacterial attachment. This was attributed to the attachment of bacteria on topographical features penetrating the lubricant layer which form preferred locations for bacterial adhesion.
In all the mentioned works, the biofouling properties of liquid-infused surfaces were investigated via flowing the liquid over the surface, without an actual permeate flow. The anti-biofouling performance was in these cases related to the slipperiness of the surface. In our previous work, we have shown that after filtration using liquid-infused membranes, the coverage of the liquid on the membrane surface is reduced confirmed by a larger contact angle hysteresis.33 The loss of lubricant during filtration was also observed by Overton et al.37 This can lead to less or no slippery behaviour on the membrane surface during filtration which can cause penetration of bacteria through the membrane pores. These effects are of great importance especially in long-term filtration processes which have not yet been studied. Additionally, most of the industrial membrane systems are operated in cross flow filtration mode. Thus, the anti-biofouling performance of liquid-infused membranes in cross flow mode needs to be studied in order to assess the widespread applicability of these membranes in industrial scale.
In this work, we investigate the long-term performance of liquid-infused membranes (LIMs) in cross flow filtration in which bacteria are capable of penetrating through the liquid-filled pores. The performance of LIMs are compared to that of non-infused counterparts (dry membranes). The feed solution is tap water which permeates through and flows across the membranes together with the nutrient solution over a period of 10–20 days. The development of biofouling is monitored by measuring the increase in transmembrane pressure (TMP) over time. The change in TMP is utilized for the first time as an indication of bacterial population on the liquid-infused membrane surface to obtain bacterial growth curve during filtration. The obtained growth curves for both liquid-infused and dry membranes are modelled using a sigmoidal logistic model and a linear regression. Three individual biological phases, i.e. lag phase, exponential phase and stationary phase, are determined to illustrate the anti-biofouling performance of the corresponding membranes. The results show an increase in lag period and substantial decrease in bacterial growth rate for liquid-infused compared to dry membranes. These results together with those of flow cytometry, further confirm the capability of liquid-infused membranes to mitigate bacterial growth.
1 Experimental
1.1 Materials
Sodium acetate (CH3COONa) and sodium phosphate monobasic dihydrate (NaH2PO4·2H2O) were purchased from VWR international. Sodium nitrate (NaNO3) was supplied from Sigma Aldrich, the Netherlands. Disinfectant tablets (Suma tab D4) were purchased from Sealed air Diversey Care, the Netherlands. Dulbecco's powder was purchased from Panreac Applichem ITW Reagents, Germany. Krytox GPL oil 101 (K101) was purchased from MAVOM chemical industry, the Netherlands. Commercial polyvinylidene fluoride (PVDF) membrane (HVHP00010) was supplied from Merck, the Netherlands. Propidium iodide, SYBR green, and LIVE/DEAD BacLight kit were purchased from Invitrogen, USA.1.2 Membranes and spacers
A commercial PVDF microfiltration membrane (HVHP00010) was used in this study. The average pore radius of the membrane is 0.51 μm with size distribution of 0.043 μm (full width at half max/2) (see ESI† Fig. S2). The feed and permeate spacers were obtained from the commercial spiral wound membrane module (DOW FILMTEC, NF270-400/34i, the Netherlands). The feed spacer had a thickness of 787 μm and consisted of polypropylene strings. These strings were arranged in a diamond-shaped structure with porosity of about 0.85.40,41 The pictures of the feed and permeate spacers are shown in ESI† Fig. S4.1.3 Fabrication of liquid-infused membranes
The proper size of the membrane (22.5 × 11 cm) was cut from the membrane roll. Liquid-infused membrane was then prepared by adding an over coat layer (15.5 μL cm−2) of perfluoropolyether (PFPE) oil, i.e. Krytox GPL 101 oil (K101), on the membranes using a micropipette. In order to have a high affinity between the infusion liquid and the PVDF membrane, a fluorinated oil, i.e. K101, was used as the infusion liquid. This is an important criterium for design and fabrication of liquid-infused surfaces.23 The infusion liquid spontaneously infiltrated the pores via capillary wicking. The liquid-infused membranes were used approximately 1 h after preparation.1.4 Membrane characterization
The pore size distribution of the membrane was characterized using capillary flow porometer (Porolux-1000) (see ESI,† Fig. S2). The morphology of the top, bottom, and the cross section of the membranes were observed using scanning electron microscope (SEM) (JEOL 5600 LV) (see ESI,† Fig. S1). The surface wetting properties of both dry and liquid-infused membranes were investigated using contact angle Goniometer (Dataphysics OCA20) (see ESI† Table S1). The water permeability of the membranes was measured using liquid–liquid displacement experiments (LLD) (see ESI† section “LLD analysis” and Table S2†). In LLD experiments, pure water (MQ-grade) was pushed through the membrane at increasing flux while measuring the pressure. The permeability was measured according to Darcy's law (eqn (S2)†) based on the corresponding linear relation between water flux and pressure.1.5 Bacteria nutrient preparation
A solution of CH3COONa, NaNO3 and NaH2PO4·2H2O was prepared as the nutrient solution. In total four bottles of nutrient solutions, each with a volume of 10 L, were required. The nutrient solutions were prepared by dissolving 3.6 g of CH3COONa, 0.55 g of NaH2PO4·2H2O and 1.3 g of NaNO3 in pure water (MQ-grade). All solutions were autoclaved at 121 °C for 1.5 h. The effect of higher concentration of nutrients, namely 7.2 g CH3COONa, 1.1 g NaH2PO4·2H2O, and 2.6 g NaNO3 on bacterial growth were also investigated (see ESI† section “Effect of nutrient concentration”).1.6 Biofouling experiments
Biofouling experiments were performed in a cross flow cell called transparent membrane biofouling monitor (tMBM). The schematic of the set-up is shown in Fig. 1. The membrane module is made of transparent polymethylmethacrylate (PMMA). The module includes one feed, one concentrate and one permeate connection. The external dimensions of the module are 300 × 170 × 0.787 mm. The total area of the permeate spacer is 185 cm2. The feed channel dimension is 200 × 100 × 0.787 mm. The module can withstand pressures up to 5 bars. The pressure development over the feed channel and the membrane was measured via external connections at the feed, concentrate, and permeate sides. During the fouling experiments, the tMBMs were covered in non-transparent boxes to prevent growth of phototrophic organisms. The height of the feed channel was equivalent to the height of the feed spacer (787 μm) which enabled operating the system in two configurations, i.e. with or without the presence of the feed spacer. The expanded view of the cross flow cell showing the position of the permeate and feed spacers is shown in the insert of Fig. 1. The membrane was fixed in place by a frame on the edge of the feed channel and was sealed by an O-ring. This construction prevents shifting of the membrane even without the presence of the feed spacer. The experiments without the presence of the feed spacer were conducted for more than 20 days. Due to the fast biofouling formation on the feed spacer (see section Membrane biofouling results), the experiments with the presence of the feed spacer were stopped after around 10 days. The membrane area allows harvesting of a sufficient amount of biomass for analyses. More information on setup configuration for operation of the membrane module can be found elsewhere.41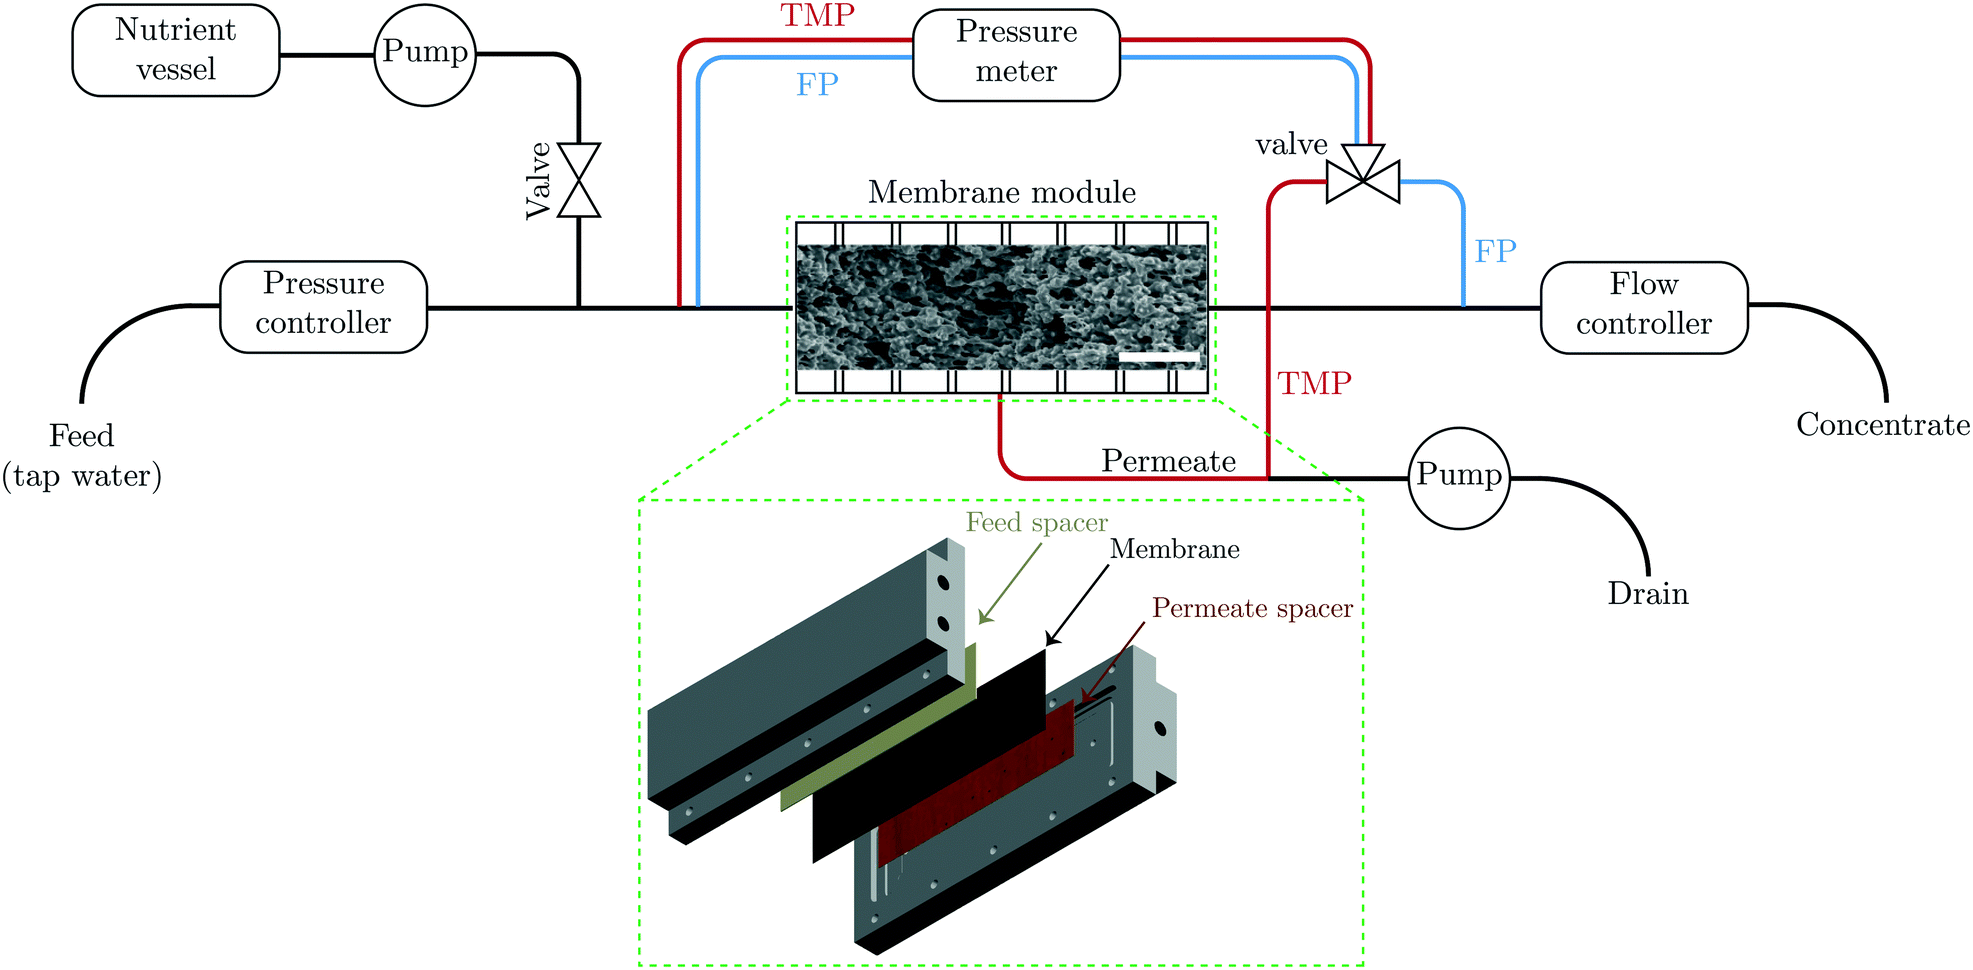 | ||
| Fig. 1 Schematic illustration of the cross flow filtration set-up and SEM image of the membrane cross section (scale bar is 10 μm). TMP and FP respectively show transmembrane pressure and feed pressure lines. The insert illustrates the expanded view of the cross flow cell. | ||
1.7 Process description of biofouling experiment
All biofouling growth experiments were carried out using an experimental system described in ref. 41 and schematically shown in Fig. 1. The feed water was first filtered through two 10 μm pore size cartridge filters and its pressure was adjusted to 1.7 bar using a pressure reducer (V782, Vink Kunststoffen B.V., Didam, the Netherlands). Before feed water entered the tMBM, nutrients were added using a peristaltic pump (Masterflex L/S pumps, Cole-Parmer Instrument Company, Vernon Hills, Illinois, USA) at a constant flow rate of 0.5 mL min−1. The flow rate was monitored and controlled by a flow controller for each tMBM which was installed at the outlet of each monitor. The concentrate flow rate was fixed at 320 mL min−1. The permeate rate was maintained by a peristaltic pump (Masterflex L/S pumps, Cole-Parmer Instrument Company, Vernon Hills, Illinois, USA) at 250 mL h−1. The fouling development was monitored by measuring the pressure drop over the feed channel and over the membrane, using a differential pressure transmitter (Deltabar S PMD70, Endress+Hauser, Maulburg, Germany). The concentrate and permeate flow rate, TMP, feed channel pressure drop (FCP), were logged twice a day.1.8 Membrane autopsy
Membrane autopsy was performed on membranes obtained from the transparent membrane biofouling monitors (size of each membrane was 2 × 5 cm2). Samples of the membrane and spacer were collected from different locations over the length of the membrane. The structure of the biofilm was visualized using a confocal laser scanning microscope, CLSM, (Zeiss LSM, Oberkochen, Germany). The vitality of the bacterial community of the membrane biofilm was quantified by flow cytometry (easyCyte flow cytometer systems, EMD Millipore) after the cells were stained with a mixture of propidium iodide and SYBR green to a final concentration of 4 μM and 1×, respectively. Counting was performed using a benchtop flow cytometer (Guava easyCyte; Merck Millipore). Data were recorded for 5000 events gated in the bivariate side scatter (SSC-H log) versus green-H log dot plot with a flow rate of 0.24 mL s−1. The biofilm was observed with CLSM using an oil immersed 40× 1.3 NA objective lens. The samples were stained using LIVE/DEAD BacLight kit with mixture of green-fluorescent nucleic acid stain (SYTO 9) and the red-fluorescent nucleic acid stain (propidium iodide) in 1![[thin space (1/6-em)]](https://www.rsc.org/images/entities/char_2009.gif) :1 proportion. 15 μL of the dye mixture was added to the biofilm and incubated at room temperature in the dark for 15 minutes. Finally, the biofilm was mounted with Vectashield H-1000 media, and coverslip.
:1 proportion. 15 μL of the dye mixture was added to the biofilm and incubated at room temperature in the dark for 15 minutes. Finally, the biofilm was mounted with Vectashield H-1000 media, and coverslip.
2 Results and discussion
2.1 Membrane biofouling results
Biofouling in two commercial and widely used membrane filtration systems, i.e. spiral wound nanofiltration and reverse osmosis, is dominantly a feed spacer problem.40 In these membrane systems, biofilm structures developed in the feed spacer channel, causing a significant increase in the feed channel pressure drop. Two cross flow configurations, with and without the presence of a feed spacer, were tested. The initial transmembrane pressure (TMP) values are shown in Table 1. The initial pressure values for permeating water through the membrane was also measured in liquid–liquid displacement (LLD) experiments while pushing MQ water through the membranes (see ESI,† section “LLD analysis”). According to Table 1, the initial TMP values are quite similar for these two methods. The initial TMP value for the dry membrane is lower in the biofouling experiment compared to that measured in LLD experiment. This is because in the biofouling experimental set-up (see Fig. 1) the membrane pores have been already opened and filled with water leading to lower TMP values. It is important to note that a dead-end filtration module is used in LLD experiment (see Fig. S3(a)†) without a spacer and only the TMP is measured.| Membrane and cell configuration | Initial TMP (bar) | |
|---|---|---|
| Biofouling | LLDa | |
| a Accuracy of the measured pressure is 5.5 mbar. | ||
| Dry-without spacer | 2.2 × 10⁻² ± 0.1 × 10⁻² | 6.4 × 10⁻¹ |
| Dry-with spacer | 4.7 × 10⁻² ± 0.1 × 10⁻² | 6.4 × 10⁻¹ |
| LIM-without spacer | 1.26 ± 5.5 × 10⁻² | 8.4 × 10⁻¹ |
| LIM-with spacer | 1.21 ± 5.5 × 10⁻¹ | 8.4 × 10⁻¹ |
The TMP increase over time was measured twice a day. The TMP development in time for both membranes with and without the feed spacer are shown in Fig. 2. It is evident that the presence of the feed spacer leads to earlier bacterial growth for both dry and liquid-infused membranes. Vrouwenvelder et al. also observed a much faster feed channel pressure drop increase in the presence of a feed spacer.40,42 For both cell configurations, we observe steeper TMP growth and a higher TMP plateau for dry membranes compared to liquid-infused counterparts. The final TMP increase for LIM is approximately 2 times lower than that of dry membrane. A similar ratio is observed between the population density of bacteria on both membranes without the presence of the feed spacer (see section Membrane autopsy results). Thus, we have used the TMP values as an indication of the number of bacteria on the membrane surface for further modeling and comparison of the anti-biofouling performance of both membranes.
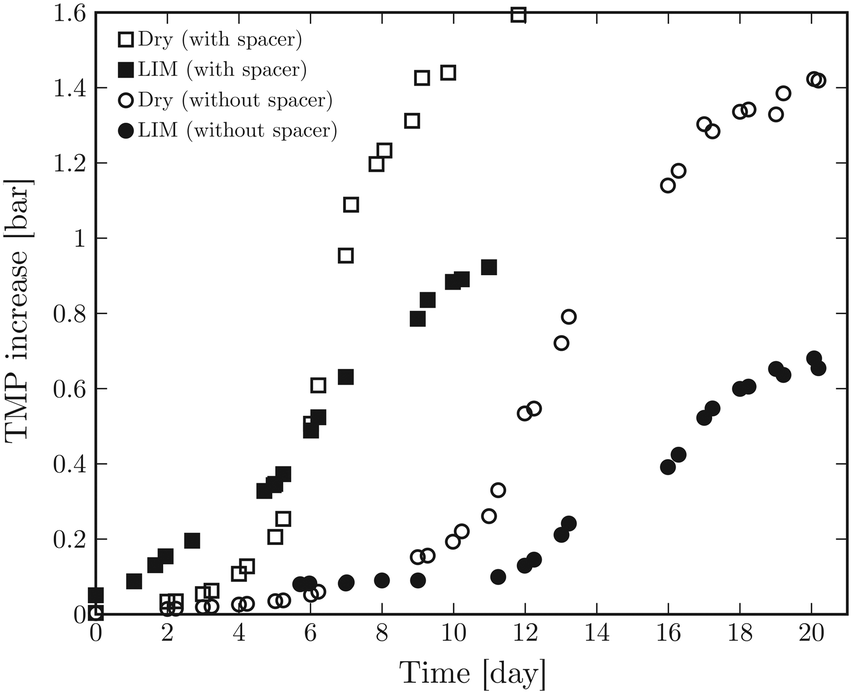 | ||
| Fig. 2 Transmembrane pressure (TMP) increase as a function of time for dry and liquid-infused membrane with and without spacer in the cross flow membrane module (tMBM). | ||
2.2 Modeling of bacterial growth
Normally, a bacterial growth curve is presented by the logarithm of the number of organisms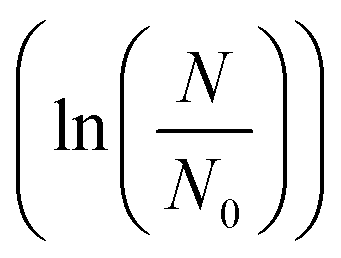 as a function of time. The changes in growth rate results in a sigmoidal curve with a lag phase, an exponential phase and a stationary phase. By determining these three phases, one can define the lag period (λ), the specific growth rate (μm), and the asymptotic value (A) respectively.43 There are two methods that can be used to define the three phases of a growth curve, i.e. via linear regression and via a growth model. In linear regression, μm is estimated by defining the most linear part of the growth curve and calculating the slope using linear regression. A better method is to describe the entire set of data with a growth model and estimating μm, λ, and A from the model. Examples of growth models are the Gompertz, logistic, Richards, Stannard, and Schunte models.43
To obtain the bacterial growth curves, we used the values of TMP increase over time. Gaveau et al. proposed a strong correlation between membrane efficiency (ratio between bacterial concentration in the feed to that in the permeate) and the driving force, as the ratio between the applied force by TMP and the tension force, based on numerical models.44 They showed that for Gram-negative bacteria strains, such as E. coli and P. aeruginosa, the higher the driving force, the lower the separation efficiency due to the increased transmission of bacteria through membrane pores via deformation of bacterial cell (stretching mechanism). Based on their results, the TMP can be directly related to the ratio between bacterial concentration in the feed and that in the permeate. As a relevant and accessible parameter, we have fitted the TMP value as a function of time with growth curve models. We present the fit parameters in terms of biological parameters, i.e. λ, μm and A. Although the pressure response is not necessarily correlated linearly to the bacterial growth, this type of modeling does quantify the biofouling behaviour of membranes.
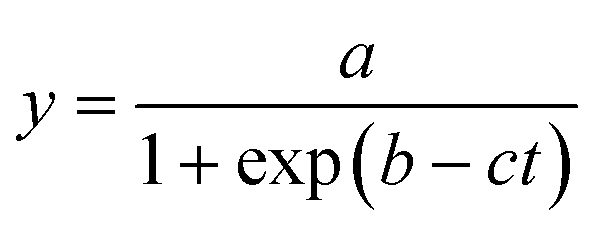
The growth curve is plotted as logarithm of the ratio between TMP values (P) and initial pressure (P0) 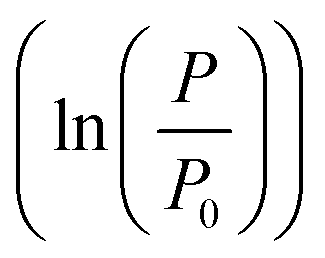 as a function of time. P0 corresponds to the initial TMP values (see Table 1). Both linear regression and the logistic growth model have been used to further analyze the growth curves. The logistic model is represented by
 | (1) |
 | (2) |
 and
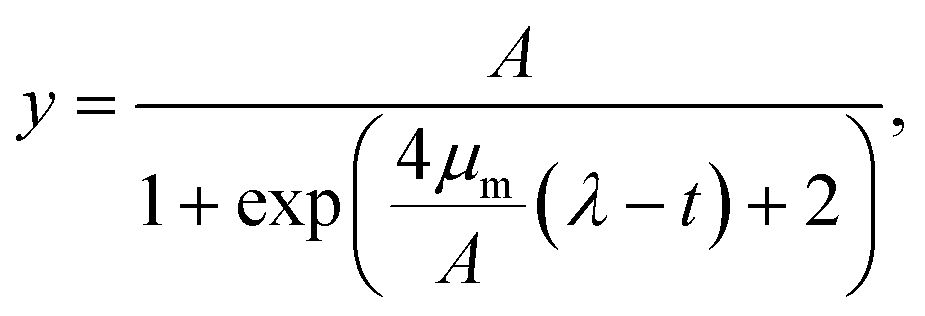
and  (see ESI† section “Modification of logistic model” for the corresponding mathematical analysis).
The fitting results of  as a function of time to the logistic model (eqn (1)) for dry and liquid-infused membranes without the presence of the feed spacer are shown in Fig. 3a and b. The same results for both membranes in the presence of the spacer are shown in Fig. 3c and d.
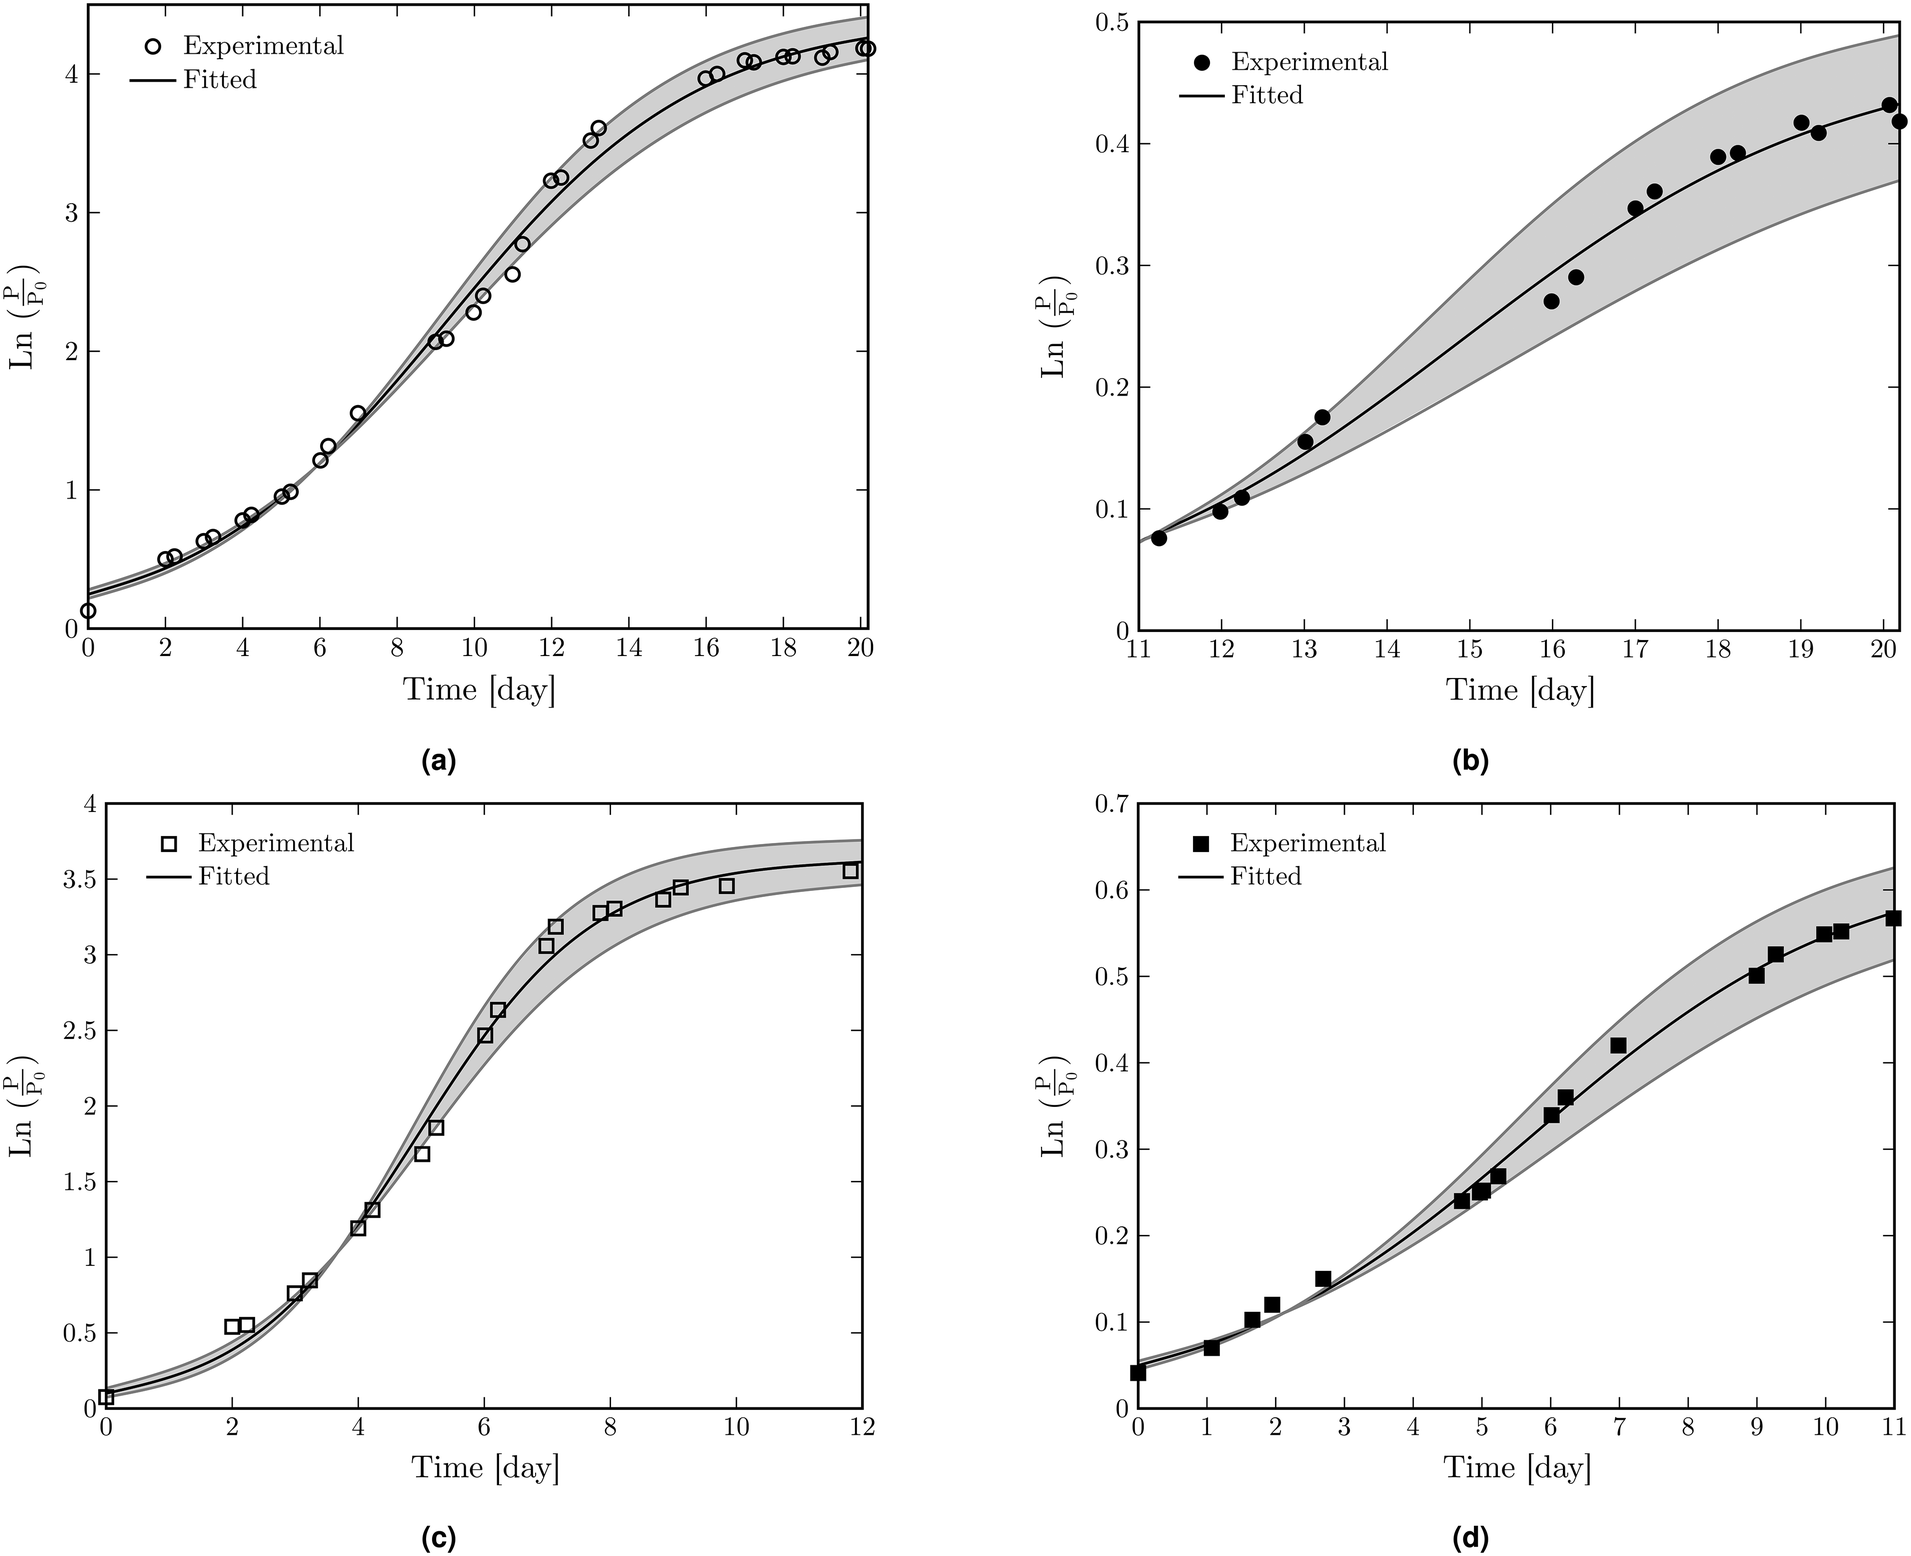 | ||
Fig. 3 The fitting results of  as a function of time to the logistic model for (a) dry membrane and (b) liquid-infused membrane without the feed spacer. The same fitting results to the logistic model with the feed spacer for (c) dry membrane and (d) liquid-infused membrane. as a function of time to the logistic model for (a) dry membrane and (b) liquid-infused membrane without the feed spacer. The same fitting results to the logistic model with the feed spacer for (c) dry membrane and (d) liquid-infused membrane. | ||
The fitting parameters (a, b, and c) for all configurations are shown in ESI† Table S3. The biological parameters A, μm and λ are calculated based on the fitting parameters using the corresponding equations (see ESI† section “Modification of logistic model”) and the results are shown in Table 2.
 as a function of time to logistic model (eqn (1)) (all the values after ± are half of the 95% confidence interval limits ((upper CI − lower CI)/2))
| Membrane and cell configuration | Biological parameters | ||
|---|---|---|---|
| λ (day) | μ m (1 per day) | A (−) | |
| Dry-without spacer | 2.70 ± 0.35 | 0.34 ± 0.03 | 4.41 ± 0.12 |
| Dry-with spacer | 2.17 ± 0.24 | 0.65 ± 0.10 | 3.64 ± 0.13 |
| LIM-without spacer | 10.29 ± 0.37 | 0.05 ± 0.01 | 0.48 ± 0.04 |
| LIM-with spacer | 1.08 ± 0.29 | 0.07 ± 0.01 | 0.64 ± 0.04 |
The biological parameters were also calculated based on linear regression. In linear regression, the most linear part of the curve is determined which defines the exponential phase. The t-axis intercept of the linear fit to the exponential phase defines the duration of the lag phase. The stationary phase is characterized by an asymptotic (horizontal) line which starts near the end of the exponential phase. The results of linear regression of  as a function of time for dry and liquid-infused membranes without and with the presence of the feed spacer are shown in Fig. 4. By defining these three phases, the biological parameters λ, μm and A can be calculated based on the duration of the lag phase, slope of the exponential phase and average asymptotic value respectively.
 | ||
Fig. 4 Linear regression results of  as a function of time for (a) dry membrane and (b) liquid-infused membrane without the feed spacer in the cross flow module. The same fitting results with the presence of the feed spacer for (c) dry membrane and (d) liquid-infused membrane. as a function of time for (a) dry membrane and (b) liquid-infused membrane without the feed spacer in the cross flow module. The same fitting results with the presence of the feed spacer for (c) dry membrane and (d) liquid-infused membrane. | ||
The calculated biological values based on the linear regression are shown in Table 3. It is worth mentioning that λ can be also calculated directly from the graph based on the beginning time of the exponential phase. The obtained values are shown in Table S5† which are in good agreement within the confidence interval limits of the values shown in Table 3. For LIM-with spacer, a nearly zero λ is found. This is because there is no lag phase as the bacteria directly starts growing on the feed spacer.
 as a function of time (the indicated errors for λ and μm represent half of the 95% confidence interval limits of the linear fit ((upper CI − lower CI)/2) and those for A are the standard deviations)
| Membrane and cell configuration | Biological parameters | ||
|---|---|---|---|
| λ (day) | μ m (1 per day) | A (−) | |
| Dry-without spacer | 1.33 ± 0.73 | 0.29 ± 0.02 | 4.10 ± 0.07 |
| Dry-with spacer | 1.90 ± 0.74 | 0.59 ± 0.06 | 3.37 ± 0.13 |
| LIM-without spacer | 9.74 ± 2.40 | 0.05 ± 4.56 × 10⁻³ | 0.41 ± 0.02 |
| LIM-with spacer | −(0.04 ± 0.63) | 0.06 ± 7.35 × 10⁻³ | 0.54 ± 0.03 |
The obtained biological parameters based on the linear regression and logistic models (see Tables 2 and 3) show a good agreement between these two methods. Based on both methods, larger λ and smaller μm values for liquid-infused membranes compared to dry membranes clearly demonstrate the ability of liquid-infused membranes to mitigate bacterial adhesion and growth respectively. This difference is more pronounced in the cell configuration without the feed spacer. Once the liquid-filled pores are opened, a thin layer of the infusion liquid will remain on the pore wall leading to the formation of so-called liquid-lined pores.28,29 The presence of liquid-lining prevents the direct contact between the permeating fluid and solid material of the pore wall.33 The mobility of the liquid molecules on the pore wall can inhibit the permanent interaction with the microorganism in the permeating fluid, thus reducing the biological adhesion.24 This will subsequently lead to mitigation of bacterial adhesion and growth in the liquid-infused membranes. The lower water permeability values of LIMs compared to dry membranes in LLD experiments confirmed incomplete removal of the infusion liquid. The analysis showed that around 39% of the infusion liquid retained in the membrane which was also in the form of liquid-lining on the pore wall of LIMs during filtration (see ESI† section “LLD analysis” for more detailed information).
Larger μm (faster bacterial growth) and smaller λ (shorter lag phase) are observed for both dry and liquid-infused membranes in the cell configuration in the presence of the feed spacer compared to the configuration without spacer. As the spacer material is conventional and thus not liquid-infused, bacteria will more easily adhere to these and form biofilms that obstruct the flow.
2.3 Membrane autopsy results
The results of flow cytometry for dry and liquid-infused membranes are shown in Table 4. The results reveal smaller population density of bacteria for liquid-infused membranes compared to dry membranes in both configurations. A smaller population density of bacteria is also observed in the absence of the feed spacer in the cross flow cell for both membranes despite the longer experimental duration. These observations further confirm the capability of liquid-infused membranes to mitigate bacterial growth. Additionally, the population density of bacteria on the dry membrane without spacer is approximately 2 times larger than that on the liquid-infused membrane. This is the same ratio as the one observed between the final TMP increase values of both membranes without the presence of feed spacer (see Fig. 2). The observed ratios further support the relation between TMP increase and population of bacteria on the membrane surface.| Membrane and cell configuration | Flow cytometry results | |
|---|---|---|
| Bacterial population density (count per cm2) | Experimental duration (h) | |
| Dry-without spacer | 4.75 × 10⁸ | 503.7 |
| Dry-with spacer | 1.59 × 10⁹ | 282.7 |
| LIM-without spacer | 2.55 × 10⁸ | 503.7 |
| LIM-with spacer | 1.04 × 10⁹ | 282.7 |
Confocal laser scanning microscope (CLSM) imaging results demonstrate that the cells deposited on the membrane surface lead to the formation of a layer composed of dead cells. On top of this layer, live bacterial cells were observed (see ESI† Fig. S7 for snapshots of 3D pictures at different depths of the biofilm structure).
3 Conclusions
In this work we have reported on the potential of liquid-infused membranes to mitigate biofouling during permeation. The performance of these membranes were compared to that of the non-infused counterparts (dry membranes). For the first time, four cross flow membrane filtration experiments with permeate flux were performed using a transparent membrane biofouling monitor (tMBM). In some cases the experiments lasted for more than 20 days. The increase in transmembrane pressure (TMP) was monitored during the experiments as an indirect effect of the presence of bacteria. The results of the TMP increase as a function of time showed smaller TMP increase for liquid-infused membranes compared to dry membranes. In order to better understand this difference, modelling was performed on the bacterial growth curve. The sigmoidal bacterial growth curves were fitted to the logistic model. Linear regression was also performed in order to determine three phases, namely the lag phase, the growth phase and the stationary phase. Three corresponding parameters, i.e. lag period (λ), specific growth rate (μm), and asymptotic value of (A) were extracted from both models. The results showed an increase in λ from approximately 3 days in dry membranes to 10 days in LIMs. A substantial decrease in the growth rate from 0.34 1 per day for dry membranes to 0.05 1 per day for LIMs was also observed confirming the mitigation of bacterial adhesion and growth for liquid-infused membranes. For both membranes, smaller λ (shorter lag period) and larger μm (faster bacterial growth rate) values were observed in the presence of the feed spacer in the membrane module. This confirms the role of feed spacers in accelerating the bacterial adhesion and growth. After the experiments, membrane autopsy and flow cytometry experiments were performed. The results showed a smaller population density of bacteria on liquid-infused membranes compared to dry membranes. These results further confirmed the applicability of liquid-infused membranes for mitigation of biofouling. The improved performance of LIMs is attributed to the presence of a thin liquid layer on the pore wall during filtration which prevents direct contact of the foulant with the solid membrane material.
Conflicts of interest
There are no conflicts to declare.Acknowledgements
This work is part of the Vici project STW 016.160.312 which is financed by the Netherlands Organisation for Scientific Research (NWO). This work was performed in the cooperation framework of Wetsus, European Centre of Excellence for Sustainable Water Technology (http://www.wetsus.nl). Wetsus is co-funded by the Dutch Ministry of Economic Affairs and Ministry of Infrastructure and Environment, the European Union Regional Development Fund, the Province of Fryslân and the Northern Netherlands Provinces.References
- M. Stoller, D. Baiocco, A. Cicci and M. Bravi, Chem. Eng. Trans., 2016, 49, 589–594 Search PubMed.
- R. Komlenic, Filtr. Sep., 2010, 47, 26–28 CrossRef.
- T. Nguyen, F. A. Roddick and L. Fan, Membranes, 2012, 2, 804–840 CrossRef CAS PubMed.
- B. Liao, D. Allen, I. Droppo, G. Leppard and S. Liss, Water Res., 2001, 35, 339–350 CrossRef CAS PubMed.
- S. N. Liss, I. G. Droppo, D. T. Flannigan and G. G. Leppard, Environ. Sci. Technol., 1996, 30, 680–686 CrossRef CAS.
- B. Q. Liao, D. M. Bagley, H. E. Kraemer, G. G. Leppard and S. N. Liss, Water Environ. Res., 2004, 76, 425–436 CrossRef CAS PubMed.
- H.-C. Flemming and G. Schaule, Desalination, 1988, 70, 95–119 CrossRef CAS.
- R. Zhang, Y. Liu, M. He, Y. Su, X. Zhao, M. Elimelech and Z. Jiang, Chem. Soc. Rev., 2016, 45, 5888–5924 RSC.
- J. Mansouri, S. Harrisson and V. Chen, J. Mater. Chem., 2010, 20, 4567–4586 RSC.
- I. Banerjee, R. C. Pangule and R. S. Kane, Adv. Mater., 2011, 23, 690–718 CrossRef CAS PubMed.
- X. Li, T. Cai and T.-S. Chung, Environ. Sci. Technol., 2014, 48, 9898–9907 CrossRef CAS PubMed.
- L.-J. Zhu, L.-P. Zhu, Y.-F. Zhao, B.-K. Zhu and Y.-Y. Xu, J. Mater. Chem. A, 2014, 2, 15566–15574 RSC.
- M. S. Rahaman, H. Thérien-Aubin, M. Ben-Sasson, C. K. Ober, M. Nielsen and M. Elimelech, J. Mater. Chem. B, 2014, 2, 1724–1732 RSC.
- H.-Y. Yu, Y. Kang, Y. Liu and B. Mi, J. Membr. Sci., 2014, 449, 50–57 CrossRef CAS.
- V. Kochkodan and N. Hilal, Desalination, 2015, 356, 187–207 CrossRef CAS.
- A. Tiraferri, Y. Kang, E. P. Giannelis and M. Elimelech, Environ. Sci. Technol., 2012, 46, 11135–11144 CrossRef CAS PubMed.
- Q. She, R. Wang, A. G. Fane and C. Y. Tang, J. Membr. Sci., 2016, 499, 201–233 CrossRef CAS.
- M. Ben-Sasson, K. R. Zodrow, Q. Genggeng, Y. Kang, E. P. Giannelis and M. Elimelech, Environ. Sci. Technol., 2014, 48, 384–393 CrossRef CAS PubMed.
- F. Perreault, H. Jaramillo, M. Xie, M. Ude, L. D. Nghiem and M. Elimelech, Environ. Sci. Technol., 2016, 50, 5840–5848 CrossRef CAS PubMed.
- C. Liu, D. Zhang, Y. He, X. Zhao and R. Bai, J. Membr. Sci., 2010, 346, 121–130 CrossRef CAS.
- L. Qi, Y. Hu, Z. Liu, X. An and E. Bar-Zeev, Environ. Sci. Technol., 2018, 52, 9684–9693 CrossRef CAS PubMed.
- T. A. Johnson, E. A. Rehak, S. P. Sahu, D. A. Ladner and E. L. Cates, Environ. Sci. Technol., 2016, 50, 11912–11921 CrossRef CAS PubMed.
- T.-S. Wong, S. H. Kang, S. K. Tang, E. J. Smythe, B. D. Hatton, A. Grinthal and J. Aizenberg, Nature, 2011, 477, 443–447 CrossRef CAS PubMed.
- A. K. Epstein, T.-S. Wong, R. A. Belisle, E. M. Boggs and J. Aizenberg, Proc. Natl. Acad. Sci. U. S. A., 2012, 109, 13182–13187 CrossRef CAS PubMed.
- P. Kim, T.-S. Wong, J. Alvarenga, M. J. Kreder, W. E. Adorno-Martinez and J. Aizenberg, ACS Nano, 2012, 6, 6569–6577 CrossRef CAS PubMed.
- X. Hou, Y. Hu, A. Grinthal, M. Khan and J. Aizenberg, Nature, 2015, 519, 70–73 CrossRef CAS PubMed.
- I. Okada and S. Shiratori, ACS Appl. Mater. Interfaces, 2014, 6, 1502–1508 CrossRef CAS PubMed.
- H. Bazyar, S. Javadpour and R. G. H. Lammertink, Adv. Mater. Interfaces, 2016, 3, 1600025 CrossRef.
- H. Bazyar, P. Lv, J. A. Wood, S. Porada, D. Lohse and R. G. H. Lammertink, Soft Matter, 2018, 14, 1780–1788 RSC.
- K. Zhan and X. Hou, Small, 2018, 14, 1703283 CrossRef PubMed.
- Z. Sheng, H. Wang, Y. Tang, M. Wang, L. Huang, L. Min, H. Meng, S. Chen, L. Jiang and X. Hou, Sci. Adv., 2018, 4, eaao6724 CrossRef PubMed.
- X. Hou, Adv. Mater., 2016, 28, 7049–7064 CrossRef CAS PubMed.
- H. Bazyar, N. van de Beek and R. G. H. Lammertink, Langmuir, 2019, 35, 9513–9520 CrossRef CAS PubMed.
- X. Hou, Natl. Sci. Rev., 2019, 7, 9–11 CrossRef.
- T. Xiang, M. Zhang, H. R. Sadig, Z. Li, M. Zhang, C. Dong, L. Yang, W. Chan and C. Li, Chem. Eng. J., 2018, 345, 147–155 CrossRef CAS.
- W. Liu, M. Wang, Z. Sheng, Y. Zhang, S. Wang, L. Qiao, Y. Hou, M. Zhang, X. Chen and X. Hou, Ind. Eng. Chem. Res., 2019, 58, 11976–11984 CrossRef CAS.
- J. C. Overton, A. Weigang and C. Howell, J. Membr. Sci., 2017, 539, 257–262 CrossRef CAS.
- Y. Kovalenko, I. Sotiri, J. V. I. Timonen, J. C. Overton, G. Holmes, J. Aizenberg and C. Howell, Adv. Healthcare Mater., 2017, 6, 1600948 CrossRef PubMed.
- N. Keller, J. Bruchmann, T. Sollich, C. Richter, R. Thelen, F. Kotz, T. Schwartz, D. Helmer and B. E. Rapp, ACS Appl. Mater. Interfaces, 2019, 11, 4480–4487 CrossRef CAS.
- J. Vrouwenvelder, M. Van Loosdrecht and J. Kruithof, Water Res., 2011, 45, 3890–3898 CrossRef CAS PubMed.
- C. Dreszer, H.-C. Flemming, A. Wexler, A. Zwijnenburg, J. Kruithof and J. Vrouwenvelder, Desalin. Water Treat., 2014, 52, 1807–1819 CrossRef CAS.
- J. Vrouwenvelder, C. Picioreanu, J. Kruithof and M. van Loosdrecht, J. Membr. Sci., 2010, 346, 71–85 CrossRef CAS.
- M. H. Zwietering, I. Jongenburger, F. M. Rombouts and K. van't Riet, Appl. Environ. Microbiol., 1990, 56, 1875–1881 CrossRef CAS PubMed.
- A. Gaveau, C. Coetsier, C. Roques, P. Bacchin, E. Dague and C. Causserand, J. Membr. Sci., 2017, 523, 446–455 CrossRef CAS.
- W. E. Ricker, Growth rates and models, in Fish physiology: Bioenergetics and growth, ed. J. R. Brett, W. S. Hoar and D. J. Randall, Academic press Inc., New York, London, 1979, vol. 8, pp. 677–743 Search PubMed.
- P. F. Verhulst, Corresp. Math. Phys., 1838, vol. 10, pp. 113–121 Search PubMed.
Footnote |
| † Electronic supplementary information (ESI) available. See DOI: 10.1039/d0ew00203h |
| This journal is © The Royal Society of Chemistry 2021 |