
 Open Access Article
 This Open Access Article is licensed under a
 Creative Commons Attribution 3.0 Unported Licence
Cellular repair mechanisms triggered by exposure to silver nanoparticles and ionic silver in embryonic zebrafish cells†
Ana C.
Quevedo
 ,
Iseult
Lynch
* and
Eugenia
Valsami-Jones
,
Iseult
Lynch
* and
Eugenia
Valsami-Jones
School of Geography, Earth and Environmental Sciences, University of Birmingham, Edgbaston, Birmingham, B15 2TT, UK. E-mail: i.lynch@bham.ac.uk
First published on 24th July 2021
Abstract
The potential environmental risks of silver nanoparticles (AgNPs) require advanced toxicological studies that elucidate the intrinsic and extrinsic cellular responses in organisms, triggered by nanoparticle (NP) exposure. As part of our ongoing efforts to confirm the utility of continuously cultured embryonic zebrafish cells (ZF4) as an in vitro aquatic model for nanotoxicology, we evaluated the molecular mechanisms of cytotoxicity and the cellular repair mechanisms triggered after exposure to three AgNP sizes (10 nm, 30 nm and 100 nm) and ionic Ag (as AgNO3) under serum conditions. The results demonstrated the crucial role of the adsorbed protein corona in reducing AgNP cytotoxicity and the time dependent AgNP internalisation. At 2 hours, the NPs were likely to be attached to the cell membranes as part of the first NP-cell encounter, whereas after 24 hours AgNPs were found in lysosomes and in close proximity to the nucleus. The cytotoxicity of PVP-coated AgNPs was size-related, as smaller (10 nm) AgNPs and ionic silver displayed major induction of all evaluated responses compared to the 30 nm and 100 nm AgNPs. All treatments demonstrated overgeneration of reactive oxygen species (ROS) and disruption of the intracellular Ca2+ balance. Cells were able to activate defence mechanisms in response to the induced damage, such as cell cycle arrest which prevented cells reaching the S phase, thereby providing time to repair DNA damage. The smaller AgNPs and the ionic control triggered massive cell cycle arrest, high percentages of DNA breaks and cell death, while exposure to the 100 nm AgNPs led to activation of G1 and G2 phases suggesting that ZF4 cells can overcome the damage. In addition, we evaluated the sequence of molecular events that lead to the toxic mode of action of the AgNPs in cells, supporting the establishment of adverse outcome pathways (AOP) and the 3Rs framework for the reduction of animal experimentation.
Environmental significanceThere is a growing interest in the development and use of alternative in vitro toxicological models. In this study, we present and demonstrate the utility of the immortalised embryonic zebrafish cell line (ZF4 cells) to assess the cellular repair mechanisms induced following exposure to silver nanoparticles (AgNPs) at different sizes and doses. Furthermore, we elucidate the dynamic interplay between toxicity pathways and molecular responses activated to deal with the generation of oxidative stress, calcium disturbances, genetic damage, inhibition of cell division, and induction of cell death in ZF4 cells. Additionally, the lack of ethical concerns and ease maintenance of ZF4 cells make them a very attractive alternative cell model that may provide a valuable alternative to the well-established fish gill cell lines for a novel in vitro 21st century toxicological assessment. |
1. Introduction
Silver nanoparticles (AgNPs) are one of the most commonly used nanomaterials in consumer products, primarily due to their antimicrobial properties that have been widely exploited in a diverse range of consumer products, such as soaps, pastes, textiles, and other health sector goods.1 As the AgNPs market increased so too have environmental concerns about the potential risks linked to the release of AgNPs into ecosystems. Silver-based products are likely to result in the release of dissolved silver, along with other forms of particulate silver (e.g. transformation products), becoming highly toxic to prokaryotes and many marine and freshwater organisms.1At the cellular level, the physicochemical characteristics (e.g., size, surface area and charge) of nanoparticles (NPs) influence their internalisation by cells and determine their cytotoxicity as the internalized NPs interact with organelles, potentially disrupting the cellular equilibrium and triggering stress-related responses.2 This redox imbalance within cells often results in increased intracellular reactive oxygen species (ROS), which can be generated in multiple organelles, as a result of an imbalance between ROS production and their scavenging and a decrease in the phase II antioxidant defence enzymes, such as superoxide dismutase (SOD), catalase (CAT), and glutathione reductase (GR).2,3 Intracellular ROS can act as messengers or mediators in many cellular signalling processes, having an essential role in cell life and death decisions. In addition, the ROS signalling pathway is closely linked to intracellular calcium (Ca2+) levels, which also regulate several physiological processes acting as a second intracellular messenger.4,5 For example, disruption of Ca2+ homeostasis has been linked to mitochondria-mediated caspase activation due to an increase of the intracellular Ca2+ concentrations, leading to cytotoxicity via apoptosis and necrotic cell death.6 ROS overload and the associated disruption of biological process may also induce disruption of deoxyribonucleic acid (DNA), proteins, lipids, and other macromolecules.7
The DNA molecule plays an essential role in the cell cycle as it carries the genetic information for the development, functioning, growth and reproduction of biological entities.8 Hence, DNA interaction with NPs may result in DNA strand breaks, which exacerbate ROS production and induce a crucial downstream of defence biological response to maintain the genomic stability.9 In response to DNA disruption, the cell triggers repair mechanisms such as cell cycle checkpoints, DNA repair regulators, and cell death mechanisms to reduce the probability of mutation.9,10 The cell cycle is an essential part of the cell's repair mechanisms, involving a series of checkpoints and controls to ensure DNA replication and cellular division, providing time to cells to overcome any disruption by inducing arrest at different cellular phases.11,12 The cell cycle includes two main periods known as interphase, which can be further divided into three phases: G1, where the cell grows and produces enzymes and nutrients that are necessary for cell division, S phase, wherein the cell synthesizes a copy of the DNA for replication, and G2 phase, where the cell continues to grow and carry out mitosis, which is the second period.13 Uptake of NPs has been shown to be influenced by the cell cycle phase, with the concentration of 40 nm yellow-green carboxyl-modified polystyrene NPs in the cells after 24 hours being G2/M > S > G0/G1.14
The use of in vitro models has significantly contributed to improved understanding of the molecular and cellular responses activated after exposure to AgNPs.15 Use of fish cells represents a versatile aquatic model to support existing alternatives to live fish studies by adhering to the 3Rs principles of refinement, reduction and replacement of animals in experimentation.16 Fish cells, as with other mammalian cells, can be cultured with optimised cell culture medium, which is normally supplemented with a certain serum percentage (heat-inactivated or not) that will depend on the cell line requirements as well as the type of assessment planed.17 Serum contains a complex mixture of salts, peptides, proteins, polysaccharides and other nutrients required to maintain good cell growth and healthy cells. The supplemented cell medium can strongly interact with AgNPs during biological exposures, providing further insights into the behaviour of the AgNPs in relevant fluids.18,19 For example, the addition of serum results in binding of proteins and other biomolecules onto the surface of the NPs (corona formation), inducing changes in their stability (e.g., dissolution, agglomeration). The acquired biomolecule corona provides a new identity to the NPs enabling them to engage with cellular receptors, influencing adhesion, uptake, transport and cytotoxicity.20,21
To explore the utility of commercial embryonic zebrafish cells (ZF4) as an emerging in vitro aquatic model for nanotoxicity, we present a set of cellular assays exploring the induction of cellular defence mechanisms and cytotoxic outcomes in response to PVP-capped AgNPs of different sizes (10, 30 and 100 mm) and concentrations in comparison to an ionic silver (Ag+) control. Furthermore, we aim to determine the effectiveness of this fibroblast adherent cell line as an alternative early-stage toxicological screening tool. The mechanistic insights generated from the analysis of the molecular and cellular events activated in the presence of NPs will contribute to the establishment of a nanomaterials' adverse outcome pathway (AOP) and support the development of safer nanomaterials.
2. Materials and methods
2.1 AgNPs characterisation
Polyvinylpyrrolidone (PVP) coated silver nanoparticles (AgNPs) with sizes 10, 30, and 100 nm were purchased from Nanocomposix, USA, (BioPure, Silver Nanospheres PVP, 1 mg mL−1). The characterisation of the three representative sizes was performed in either serum free medium (SFM) DMEM/F12 (Gibco 11330) or complete culture medium (CCM). The CCM was prepared by supplementing DMEM/F12 with 10% foetal bovine serum (FBS) (Gibco, 10270).A sample (1 mL) containing one of the AgNPs at a final concentration of 10 μg mL−1 was placed in a disposable polystyrene cuvette (Sarstedt, 67.742), then the hydrodynamic size, zeta potential, and polydispersity were immediately assessed by dynamic light scattering (DLS) (Zetasizer Nano series, Malvern). For zeta potential analysis, 700 μL was prepared freshly and placed in a folded capillary cell (Malvern, DTS1070) for analysis. All samples were prepared freshly and measured directly followed by incubation for 24 hours at 28 °C after which the size and zeta potential were reevaluated to assess the stability of the NPs in the exposure medium.
2.2 Silver nitrate (AgNO3) stock
To understand the toxicity of the ionic Ag in ZF4 cells, a stock suspension of 1 mg mL−1 of Ag (with equivalent mass of silver in ionic form) was prepared. First, silver nitrate (AgNO3 salt, VWR chemicals, USA) was weighed calculating the total amount of Ag+, then, the salt was dissolved in UPW in a laminar flow cabinet to maintain the suspension sterile.2.3 Culturing of embryonic zebrafish cells (ZF4)
ZF4 cells established from 1 day old zebrafish embryo were purchased from ATTC (https://www.atcc.org/products/all/CRL-2050.aspx) and cultured as described on the manufacturer's website and in ref. 22. Briefly, ZF4 cells were cultured in vented cap T75 flasks (Corning, CLS430641) in a total volume of 10 mL of CCM and incubated in a humidified atmosphere of 5% CO2 at 28 °C. The CCM was prepared using DMEM/F12 supplemented with 10% foetal bovine serum (FBS) (Gibco, 10270) and 1% penicillin and streptomycin (Gibco, 15070). Once the cells reached 80% confluence (passage 28), the cell medium was discarded, and the cells were washed with 5 mL warm (28 °C) phosphate-buffered saline (PBS) (Thermofisher, D5837); then, cells were detached using 1.5 mL 0.25% trypsin (Gibco, 15090) for 3 minutes at 28 °C. After the cells were fully detached, 1.5 mL of the suspension was diluted in 8.5 mL of CCM and placed in T25 flasks. The cells were maintained in T75 flasks by splitting once a week. For experiments that required a larger number of cells, ZF4 cells were transferred to T175 vented cap flasks (Corning, 431080). For this, cells were detached as previously mentioned (see above); then, 3 mL of the cell suspension was resuspended in T175 flasks containing 17 mL of CCM and left to grow for one week. To maintain the cell line in T175 flasks, the cells were washed with 10 mL of warm PBS, detached using 3 mL of trypsin and then diluted with 18 mL of CCM. Cells were sub-cultured once a week.2.4 Toxicity of AgNPs and AgNO3
To select exposure concentrations for the AgNPs and AgNO3 treatments, the effective concentration at which 50% of the cell viability is reduced (EC50) was evaluated by lactate dehydrogenase activity (LDH) assay. First, ZF4 cells were treated with increasing concentrations of either AgNPs (5, 10, 20, 30, 40 and 60 μg mL−1) or AgNO3 (Sigma, 209139) (0.5, 1, 2, 3, 5, and 8 μg mL−1) and incubated for 3, 24, 48, and 72 hours in CCM. To understand the role of the proteins adsorbed to the AgNPs (the NP-corona) in modulating the toxicity of AgNPs and silver ions, serum-free treatments (DMEM/F12) were tested in parallel. Both CCM and serum-free medium (SFM) treatments were prepared freshly on the day the assay was performed, using equal concentrations (0.25, 0.5, 1, 1.5, 2 and 2.5 μg mL−1) of the three AgNP sizes and AgNO3 concentrations of 0.5, 1, 2, 3, 5, and 8 μg mL−1; however, due to the higher toxicity of the NPs in the absence of serum recorded by other authors,17,23 the treatments were incubated for shorter periods of time, i.e., for 3, 6, 12, and 24 hours. After the incubation times for treatments in CCM and SFM, the cell viability was analysed using the LDH assay (CytoTox 96, Promega Corporation, USA) using a modified protocol (Ali-Boucetta et al. 2011) to measure the LDH content of the live cells instead of LDH released into the medium from dying cells after AgNPs exposure.24 This modified protocol was selected due to recorded interferences from the absorbance properties of the AgNPs when applying the manufacturer's protocol.24–26 The methodology is described on cancer cells in the original publication by Ali-Boucetta et al. (2011),24 and in a previous ZF4 cell publication by Quevedo et al. (2021).22 Briefly, ZF4 cells were seeded in 96-well plates at a density of 8000 cells in a total volume of 200 μL per well in CCM or SFM and incubated at 28 °C and 5% CO2. The next day, cells were treated with AgNPs or AgNO3 in either CCM (10% FBS) for 3, 24, 48 and 72 hours or SFM for 3, 6, 12, and 24 hours. After each incubation period, the cell medium was removed and replaced with 110 μL of 0.9% lysis solution and incubated for 45 minutes at 28 °C. Lysates were collected and transferred into 1.5 mL polystyrene tubes and centrifuged at 20![[thin space (1/6-em)]](https://www.rsc.org/images/entities/char_2009.gif) 073 × g (Eppendorf, 5430R) for 5 minutes; 50 μL of the cell lysate was transferred into 96 well plates, followed by addition of 50 μL of reconstituted substrate mix (LDH kit, Promega). Plates were covered with foil and incubated at room temperature for 15 minutes. Finally, 50 μL of stop solution (LDH kit, Promega) was added per well; the absorbance was immediately recorded using a plate reader at 492 nm (Tecan, Spark). All experiments were performed in triplicate, for the three AgNPs sizes (10, 30 and 100 nm) and AgNO3 in CCM and SFM. Results were calculated based on the percentage of cell survival using the following formula:
073 × g (Eppendorf, 5430R) for 5 minutes; 50 μL of the cell lysate was transferred into 96 well plates, followed by addition of 50 μL of reconstituted substrate mix (LDH kit, Promega). Plates were covered with foil and incubated at room temperature for 15 minutes. Finally, 50 μL of stop solution (LDH kit, Promega) was added per well; the absorbance was immediately recorded using a plate reader at 492 nm (Tecan, Spark). All experiments were performed in triplicate, for the three AgNPs sizes (10, 30 and 100 nm) and AgNO3 in CCM and SFM. Results were calculated based on the percentage of cell survival using the following formula:| Percentage (%) survival = [sample absorbance/mean control] × 100 |
2.5 Nanoparticle internalisation by ZF4 cells
In order to assess the uptake of AgNPs, cells were seeded in uncoated 24 well plates (13 mm) glass bottom dishes (MatTek, P24G013F) at a density of 100000 cells in a total volume of 1 mL of CCM and incubated at 28 °C and 5% CO2. Twenty-four hours post-seeding, cell medium was replaced with treatments prepared in CCM with final concentrations of 2.5, 5 and 10 μg mL−1 of 10, 30 or 100 nm AgNPs for either 2 or 24 hours. After the desired incubation period, cells were carefully washed thrice with warm PBS, then the nucleus and lysosomes were marked with 500 μL of a staining solution consisting of warm CCM mixed with 1 μL mL−1 Hoechst 33342 (Thermofisher, 62249) and 1 μL mL−1 LysoTracker™ Deep Red (Thermofisher, L12492) for 45 minutes at 28 °C. The staining solution was removed, and cells were washed twice with warm PBS. Then, cells were fixed for 20 minutes with 500 μL of 4% paraformaldehyde (Thermofisher, 43368) diluted in PBS. Finally, the cell membrane was stained with 500 μL of Alexa 488 wheat germ agglutinin (WGA) conjugate solution (Thermofisher, W11261) at a final concentration of 5 μg mL−1 and incubated for 15 minutes in the dark at room temperature. After the staining period, cells were carefully washed with PBS and then examined by confocal microscopy using a NIKON A1R 808 series microscope. Hoechst staining (excitation/emission 350/461 nm) was used for nucleus identification and was visualised using the blue laser; for lysosomes (647/668 nm) the red filter was used, and for the cell membrane (495/519 nm) the green filter was used. Images were recorded with a 60× objective lens for all channels, including a reflectance filter (488 nm) for the AgNPs (reflectance mode). The NP reflectance intensity of each cell was isolated by manually drawing a region of interest (ROI) in the acquired image using FIJI open-source image processing tool (V.2.00-RC69) and following the outline of the cells based on the cell membrane staining with Alexa 488 (green). Then the intracellular background fluorescence of the selected area (determined from an adjacent area without cells) was recorded and subtracted from the initial NP reflectance intensity. A similar method was followed to calculate the total intensity of fluorescence per NP (visible intracellular accumulations of NPs) as described in the literature.27–29 A full description of the methodology used for this analysis can be found in the ESI.†
2.6 Intracellular calcium flux
Calcium (Ca2+) plays a key role in diverse cellular signalling functions, providing information about cellular activity and disturbances. To evaluate the intracellular calcium flux a Screen Quest™ Fluo-8 Calcium Assay kit was used (AAT Bioquest, 36307). Once inside the cell, the fluorescent dye results in enhanced fluorescent intensity when activated upon binding to calcium.30 First, cells were seeded in 96-well flat bottom plates (Corning, 3917) at a density of 8000 cells in 200 μL of CCM at 28 °C with 5% CO2. Twenty-four hours post-seeding, cells were treated with 2.5, 5 or 10 μg mL−1 of 10, 30 or 100 nm AgNPs or 1, 1.5 and 2 μg mL−1 of AgNO3 prepared in CCM for 24 h at 28 °C. A positive control of 20% dimethyl sulfoxide (Sigma, D4540), prepared in SFM, was also included for 30 minutes. After the incubation time, the cell medium was carefully removed and cells were stained with 100 μL of the Fluo-8 NW dye working solution, which was prepared by following the manufacturer's protocol. Briefly, 10 μL of Fluo-8 NW DMSO working stock was added into 10 mL of 1× assay buffer. The 1× buffer was prepared by mixing 9 mL of Hanks' buffer with 20 mM Hepes buffer into 10× Pluronic® F127 Plus (1 mL). After the working solution was loaded into the plate, the cells were placed in the dark and incubated for 30 minutes at 28 °C, then for 30 minutes at room temperature. Immediately, the calcium flux was assessed using a multimode microplate reader (Tecan Spark) in time resolved fluorescence mode. The plate reader was set to monitor the excitation/emission at 490/525 nm. The intensities were corrected by subtracting the average of the untreated control to obtain base-line corrected values according to the supplier's protocol. Three individual replicates per treatment were performed.2.7 Oxidative stress
Many cellular and biochemical alterations are associated with excessive ROS production, especially in cellular organs where the oxygen consumption is high. Hence, to further understand the cytotoxicity of AgNPs and ionic Ag, the total intracellular ROS production was analysed via flow cytometry using a total ROS Assay kit (Thermofisher, 88593074) following the manufacturer protocol. Briefly, cells were seeded in six-well flat bottom plates (Corning, CLS3736) at a density of 5 × 10⁵ cells in a total volume of 2 mL per well in CCM and incubated at 28 °C and 5% CO2. After 24 h, the medium was replaced with 2.5, 5 and 10 μg mL−1 of 10, 30 and 100 nm AgNPs and 1, 1.5 and 2 μg mL−1 AgNO3, treatments prepared in CCM and incubated for 24 h at 28 °C. 100 μM menadione and 5 mM of N-acetyl-L-cysteine (NAC) were prepared in CCM and included as positive controls to induce and inhibit ROS production, respectively. Controls were added one hour before the end of the incubation period. After the incubation period the cell medium was removed, cells were washed with warm PBS and detached using 0.25% trypsin for 3 minutes at 28 °C. The medium and cells were centrifuged for 10 minutes at 270 × g at 4 °C. The supernatant was removed, and the pellet was labelled using CellROX® Deep Red (Thermofisher, C10422). For this, the cell pellet was resuspended (500 μL) and incubated in CellROX® Reagent for 30 minutes at 28 °C; after the incubation, the stained cells were centrifuged at 270 × g at 28 °C and finally the pellet was diluted with 500 μL of warm PBS. Afterwards, cells were analysed by fluorescence-activated cell sorting (FACS) (BD LSRFortessa™) using the allophycocyanin (APC) filter with excitation of 644 nm and emission of 665 nm. The flow cytometer electronic compensation was set up based on unstained cells (control) and cells labelled with the single stain, then, cell doublets were excluded from the analysis. At least 10000 counts were analysed per sample and three individual replicates were performed per treatment. Results were analysed using FlowJo V10 software (V.10.0.8, FlowJo, LLC, Ashland, OR, USA).
2.8 Cell cycle analysis
The cell cycle involves a signalling cascade to divide a cell into two daughter cells; to explore potential disruptions of the cell cycle from exposure to AgNPs and ionic Ag, FxCycle™ PI/RNase Staining Solution (Thermofisher, F10797) flow cytometry was used. Briefly, cells were seeded in six-well flat bottom plates (Corning, CLS3736) at a density of 5 × 10⁵ cells per well in CCM in a final volume of 2 mL, incubated at 28 °C with 5% CO2. After 24 h, treatments prepared in CCM were added at 2.5, 5 or 10 μg mL−1 of AgNPs (10, 30 and 100 nm) or 1, 1.5 and 2 μg mL−1 of AgNO3, and incubated for 24 h at 28 °C. 3 μM topotecan (Sigma, T2706) and 10 μM etoposide (Sigma, E1383) were also incubated for 24 hours as positive controls to induce cell cycle arrest in phases S and G2, respectively. After 24 hours, the cell medium of all treatments was removed, cells were washed with PBS and detached using 0.25% trypsin for 3 minutes at 28 °C. The cell medium and cells were centrifuged for 10 minutes at 270 × g at 4 °C. Then, the supernatant was discarded, and the cell pellet was carefully fixed with 3 mL of cold ethanol absolute (Sigma, 34852). After fixation, the cells were centrifuged, and the supernatant fixation was carefully removed. Finally, the cell pellet was stained using 500 μL of red fluorescent propidium iodide (PI) stain (FxCycle™ PI/RNase staining) and incubated at room temperature for 30 minutes. Stained cells were analysed by FACS using the PI (Texas red) filter, with an excitation/emission of 535/617 nm. The flow cytometer electronic compensation was set as previously described (see above), based on healthy stained and unstained cells and cell doublets were eliminated from the analysis for better results. At least 10000 counts were analysed per sample and three replicates were included for all the samples. Flow cytometry results were analysed by FlowJo V10 software using the cell cycle tool.
2.9 DNA damage determined by comet assay
Cells were seeded in 12-well flat bottom plates (Costar, 3737) at a density of 200000 cells in 1 mL of CCM and incubated at 28 °C and 5% CO2. After 24 h, cells were treated with 2.5, 5 and 10 μg mL−1 of 10, 30 and 100 nm AgNPs and 1, 1.5 and 2 μg mL−1 of AgNO3 for 24 h at 28 °C. A concentration of 200 μM hydrogen peroxide (H2O2) as positive control prepared in CCM was also included for 30 minutes to induce DNA damage. After the incubation period, the cell medium was removed; cells were washed with PBS and detached using 0.25% trypsin for 3 minutes at 28 °C. Then, the medium and cells were centrifuged for 3 minutes at 956 × g at 22 °C. After centrifugation, the supernatant was carefully removed, and the cell pellet was resuspended in 100 μL of PBS. Then 20 μL of the diluted cell suspension was diluted with warm (28 °C) 0.7% low melting point agarose (LMA) (Gibco, V384A), then 100 μL of the suspension were added onto a slide precoated with 1% normal melting point agarose (NMA) (Promega, V384A) and covered immediately with a glass coverslip (24 × 60 mm); slides were set to cool over ice for 20 minutes at 4 °C (see section 1 of the ESI† for detailed description of the preparation of the buffers and slides). The coverslip was gently removed and another layer of 90 μL LMA was added, another coverslip was added, and the slide was set to cool for 20 minutes at 4 °C. After the cold incubation, the coverslips were carefully removed, and the slides were placed into a lysis solution at 4 °C overnight. Afterwards, the slides were placed onto an electrophoresis chamber with cold electrophoretic buffer for 20 minutes; after the unwinding step, electrophoresis was conducted for 20 minutes at 20 V cm−1–300 mA at 4 °C. Then, the slides were transferred onto a rack and covered with 2 mL of neutralizing buffer for 5 minutes. The slides were fixed in −20 °C ethanol for 5 minutes and set to dry on a flat surface for 24 hours. Finally, the slides were stained with SYBR™ Gold nucleic acid (Thermofisher, S11494) using a 1:1000 dilution of stock solution prepared in UPW. Samples were incubated in the dark for 24 hours at 4 °C and then visualised using a fluorescent microscope with the blue laser. Tail intensity (% TI) of 50 comets was recorded using Comet Assay IV digital software (Perceptive Instruments, Wiltshire, UK). Three replicates were performed for each treatment, equating to 150 comets per sample to calculate the mean and standard deviation. Images were also taken when recording the TI of the comets. Results were analysed using Comet Assay IV macro https://www.instem.com/solutions/genetic-toxicology/comet-assay.php. A full description of the buffers used can be found in section 1 in the ESI.†
2.10 Statistical analysis
All the results were plotted and analysed using GraphPad prism 8 software (V.8.4.3). Statistical analyses were performed in GraphPad using a two-way ANOVA followed by a Bonferroni post hoc comparison for all AgNPs and AgNO3 treatments against the untreated control (naïve).3. Results
3.1 Characterisation of the NPs
The AgNPs were characterised in CCM and SFM, displaying noticeable differences in the hydrodynamic sizes after 0 and 24 hours. The sizes of the 10, 30 and 100 nm AgNPs in SFM at 0 hours were recorded as 47.86 ± 0.01 nm, 94.82 ± 0.01 nm and 135.9 ± 0.05 nm; however, after 24 hours, substantial differences were displayed, with 617.21 ± 0.690 ± 0.1, and 540.93 ± 0.03 for the 10, 30 and 100 nm AgNPs, respectively (Fig. 1). The increase in size after 24 hours in SFM can be linked with the PDI results, as after 24 hours the PDIs recorded were around 1, suggesting high agglomeration and/or sedimentation of the NPs, compared to the fresh samples (0 hours) which showed PDIs between 0.03 and 0.23 for the three AgNPs sizes. On the contrary, the AgNPs sizes in CCM were broadly constant, with only small differences between 0 and 24 hours, which suggests rapid formation of a protein corona as well as some level of agglomeration upon dispersion. Interestingly, the 10 and 30 nm particles displayed similar sizes in CCM at 94.49 ± 0.03 and 95.20 ± 2.85 nm respectively at 0 hours, and 105.66 ± 0.3 and 102.65 ± 0.02 respectively at 24 hours, whereas the 100 nm AgNPs increased from 160.63 ± 0.52 nm (T0) to 175.06 ± 0.5 nm (24 hours). The zeta potential data suggests that the NPs had limited interaction with the medium compounds in SFM as both time points displayed similar results (−6 to −7 mV). On the other hand, the zeta potentials in CCM became slightly more negative (−10 to −12), displaying similar results at 0 and 24 hours (Fig. 1D). These results suggest that the small and medium sized AgNPs were more likely to increase in size upon dispersion compared to the larger NPs. Moreover, the addition of serum had a strong effect on the physiochemical characteristics of the NPs, which can be related to the absorption of proteins onto the NPs, as well as enhancing the colloidal stability through steric mechanisms. Full characterisation results can be found in section 2 in the ESI† as Table S1. Further characterisation of the NPs using different concentrations and testing media is broadly described in a previous publication.22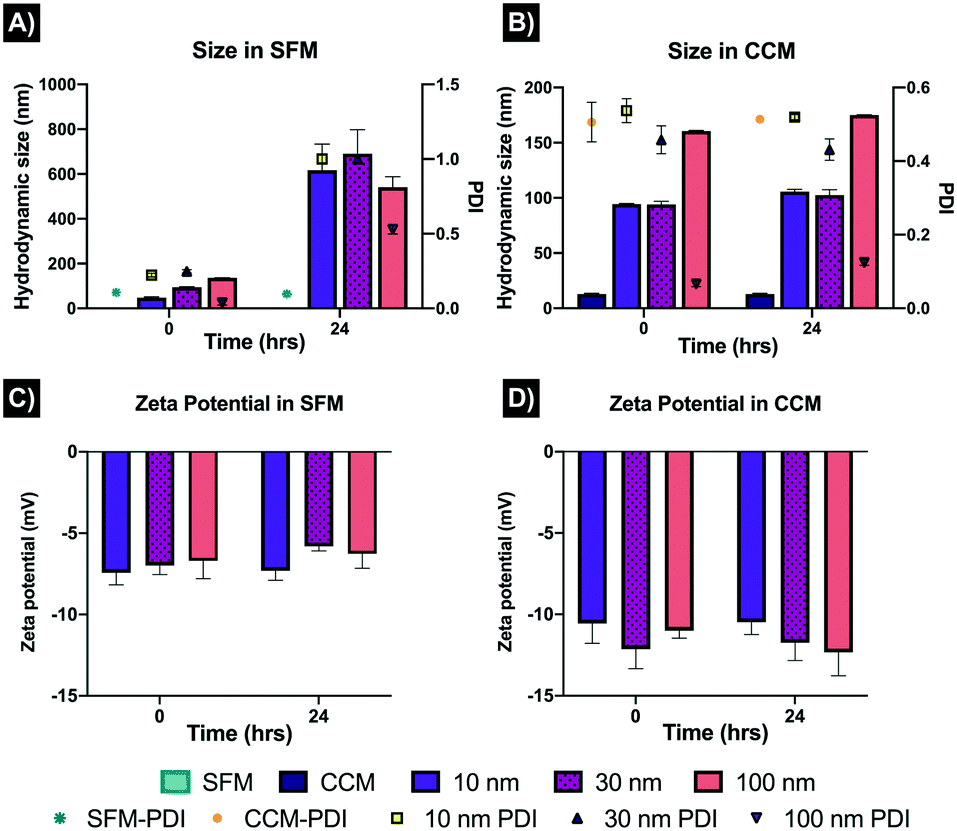 | ||
| Fig. 1 Characterisation of the AgNPs by dynamic light scattering (DLS) in serum free media (SFM) and complete culture media (CCM) at different time points. Three representative AgNP sizes (10, 30 and 100 nm) were prepared in CCM and SFM at a concentration of 10 μg mL−1 and incubated for 0 and 24 hours at 28 °C. Figures A and B show the hydrodynamic size (nm) and polydispersity index (PDI) of the AgNPs in SFM and CCM respectively. C and D show the zeta potential in SFM and CCM after 0 hours and 24 hours incubation. Results represent the average of three replicates and their standard deviation. The SFM and CCM were characterised also to determine the size of the salt or protein clusters. | ||
3.2 LDH assay
To evaluate direct NP-cell interactions and the role of the acquired protein corona in mitigating the toxicity of AgNPs and silver ions, treatments prepared in SFM and CCM were compared. Representative low, medium, and high concentrations were selected based on the exposure concentration that decreased the cell viability to 50% (EC50) after 24 hours in treatments prepared in CCM. The recorded EC50 for the AgNPs was around 10 μg mL−1, whereas for AgNO3 it was 2 μg mL−1. Hence, concentrations of 2.5, 5 and 10 μg mL−1 for the AgNPs and 1, 1.5 and 2 μg mL−1 of ionic Ag were used for all subsequent experiments, to further understand the role of AgNP dose and size on the induction of cellular repair pathways in ZF4 cells under normal cell culture conditions (10% FBS). A summary of the recorded cell viabilities (%) after 24 hours in CCM can be found as Table S2 in the ESI.† For more information about other tested concentrations, exposure time points and the full methodology used for treatments prepared in CCM, see Quevedo et al., (2021).22To understand the cytotoxic effects of the AgNPs and its ionic counterpart under serum free conditions, the EC50 in ZF4 cells was also determined. The AgNP concentrations in SFM were equal to those in the CCM treatments; however, due to the high toxicity recorded (reduction in cell viability %) after 24 hours (<10% viability) results are displayed only up to 24 hours of incubation (Fig. 2). The SFM treatments thus demonstrated higher toxicity compared to the treatments prepared in CCM, as expected due to the mediating effects of the corona formed in CCM. The DMEM/F12 medium (SFM) registered a low protein content (17 ± 0.22 μg mL−1) compared to the CCM which was supplemented with 10% FBS leading to a protein content of 244 ± 03.98 μg mL−1. Hence, lower concentrations were selected for the toxicity experiments in SFM due to the massive membrane damage induced by the bare AgNPs.
 | ||
| Fig. 2 Cytotoxicity of AgNPs and AgNO3 to ZF4 cells in serum free medium (SFM). Cells were treated with AgNPs and AgNO3 prepared in SFM for 3, 6, 12 and 48 h. The graphs show the percentage viability of ZF4 cells treated with 0.25, 0.5, 1, 1.5, 2 and 2.5 μg mL−1 of AgNPs for 10 nm A), 30 nm B), and C) 100 nm. D) Viability of cells treated with 0.5, 1, 2, 3, 5, and 8 μg mL−1 of AgNO3. Graphs represent the average of three individual replicates and their standard deviation. Data with asterisks (*) indicate statistically differences between AgNPs treatments compared with the naïve control at each time point (*p < 0.05, **p < 0.01, and ***p < 0.001). All bars under the lines are included within the asterisk above. | ||
The 10 nm AgNPs in SFM showed a 50% decrease in the cell viability at 2 μg mL−1 after just 6 hours (Fig. 2A). After 24 hours exposure to the 10 nm AgNPs cell death reached 49.24 ± 1.52% at 1 μg mL−1, indicating that as expected the AgNPs in SFM exhibit higher toxicity compared to the treatments in CCM where cell viability was about 50% even with exposure to 10 μg mL−1. For the 30 nm and 100 nm (Fig. 2B and C), the toxicity was lower, decreasing the cell population to around 60–70% from 3 to 12 hours at the highest concentration (2.5 μg mL−1) in SFM. However, after 24 hours, the EC50 was 1.5 μg mL−1 for both sizes, with 51.19 ± 5.80 and 53.87 ± 0.42% cell viability respectively in SFM. On the other hand, the results for the ionic control in SFM (Fig. 2D) showed a noticeable decrease (40–50%) in the cell viability after 3 hours at 2 μg mL−1 which by 24 hours had decreased below 70%, with viability percentages ranging from 11–38% for the remaining AgNO3 concentrations. Thus, the silver ions also displayed higher toxicity in SFM treatments compared to the AgNO3 treatments in 10% FBS, further demonstrating the important role of proteins in reducing the cytotoxicity of both AgNPs and their ionic counterpart. Therefore, all subsequent treatments were prepared in CCM to avoid cell distress due to the lack of nutrients as well as to mimic the in vivo environment. Full SFM results are presented in Table S2 in the ESI.†
3.3 Nanoparticle internalisation
Confocal microscopy results were calculated as reflectance per NP (total intensity of fluorescence per NP spot), and to further understand the entry of the NPs into the cells, an estimation of the number of intracellular NPs accumulated per unit area was calculated (NPs per cell). After 2 hours all the NPs followed an inverse concentration-intensity response, with higher intensity values at the lowest AgNPs concentration (2.5 μg mL−1) and lower intensity values (corresponding to lower concentrations of internalised AgNPs) at the highest AgNPs concentration (10 μg mL−1) (Fig. 3A and Table S3 in the ESI†). The smallest AgNP size (10 nm) presented the highest levels of fluorescent intensity (A.U.) of the three AgNP, likely as a result of the higher particle number at constant mass. The 30 nm AgNPs displayed a similar concentration-intensity response, with intensity values below those of the 10 nm AgNPs but higher than the 100 nm particles which presented the lowest intensity values for the three AgNP sizes. These results might be related to the NP attachment to the cell surface as well as the NPs internalisation, as smaller NPs are likely to be internalised faster than larger ones.Similarly, the number of particles per mL may also influence the uptake of the NPs, as smaller AgNP sizes present a much higher number of NPs mL−1 compared to the larger sizes, at the same mass concentration (calculations can be found in Table S3 in the ESI†). The highest AgNP concentrations showed lower fluorescence intensity values, which may suggest that cells reduced the turnover of their uptake machinery by activating other cellular processes. After 24 hours a reduction in the fluorescence intensity for all the NPs and sizes was evident compared to the initial 2 hours exposure (Fig. 3B). This is likely a result of AgNP transformation processes inside the cells, such as dissolution which would reduce the reflectance and thus appear as loss of NPs, and would be more pronounced for the 10 nm AgNPs due to their large surface area and confirmed higher dissolution rates compared to the larger particles;22 which is consistent with the data in Fig. 4A and B where the reflectance decrease between 2 and 24 hours was greatest for the 10 nm particles. Cell division has been also shown to result in a halving of the NP fluorescence intensity as the NPs are split between daughter cells,31,32 but the doubling time for ZF4 cells have been reported to be around 72 hours so this was unlikely to explain the decrease in fluorescence in this case.
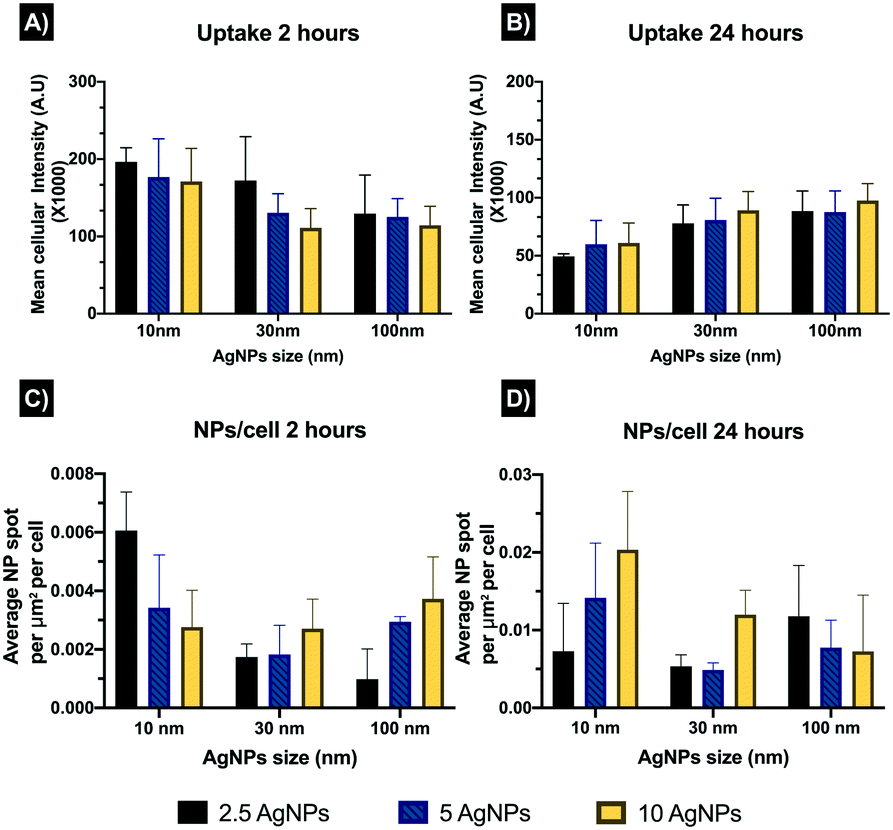 | ||
| Fig. 3 Internalisation of AgNPs by ZF4 cells in CCM determined by confocal microscopy. Data is presented as the mean intensity (A.U.) × 1000 measured after 2 and 24 hours. Samples were treated with 2.5, 5 and 10 μg mL−1 of 10, 30 and 100 nm AgNPs. A and B) Uptake of AgNPs of different sizes and concentrations after 2 or 24 hours. Results represent the mean cellular intensities of three individual samples, for a total of 12 cells per AgNP concentration and size. C and D) Number of intracellular NPs accumulated per unit area (of cells) at 2 or 24 hours. Results represent the average of three individual samples per AgNP concentration and size. | ||
 | ||
| Fig. 4 Representative confocal images of ZF4 cells treated with AgNPs. Cells were treated with 10 μg mL−1 of 10 nm AgNPs for 2 and 24 hours, then stained with Hoechst (blue) for the nucleus, LysoTracker deep red (red) for lysosomes, and Alexa 488 (green) for the cell membrane. Figures A and D show the untreated control (naïve) composite of the three dyes. Due to visual interference between the NP reflectance and the dye used to stain the cell membrane (B and E), the green channel was removed to visualize the NPs for images C and F. Figures B and C show cells treated with 10 μg mL−1 of 10 nm AgNPs for 2 hours. B) Overlay of the nucleus, lysosomes and cell membrane staining. C) Blue and red staining overlaid with the NPs (reflectance) channel. The yellow arrows show AgNPs attached to the cell membrane with no noticeable NP internalisation. Figures D–F show cells treated with 5 μg mL−1 of 10 nm AgNPs for 24 hours with a close-up (zoom in) of a few cells for better visualisation (yellow box). E) Overlay of blue, red and green dyes. F) Overlay of the red and blue staining and the NPs (reflectance) channel. Yellow arrows pointing to the white dots (NPs) show the internalisation of the NPs and their proximity to the nucleus and their localisation in lysosomes. The scale bar for all the images is 22 μm. Images were taken with a NIKON A1R 808 series microscope using a 60× objective. | ||
Estimation of the number of NPs per cells revealed the lowest number of NPs at 2 hours, with an overall mean of 0.003 NPs per cell, whereas after 24 hours there was an increase in the number of NPs per cells to 0.01 NPs per cell (Fig. 3C and D and Table S4 in the ESI†). The 10 nm size displayed the highest values for both exposure times, which is related to the larger number of NPs mL−1 with smaller sized particles at a constant mass concentration. The 100 nm AgNPs showed higher numbers of NPs per cell compared to the 30 nm particles, which showed the lowest intracellular NP accumulation values. The results may suggest that after 2 hours most of the NPs were attached to the cell membrane making their visualisation complex, whereas after 24 hours, the NPs may have undergone agglomeration in the cell lysosomes facilitating their visualisation, but also influencing their intensity by reflecting more (for larger apparent sizes) as shown in the uptake after 24 hours (Fig. 3B). Confocal images support the fact that AgNPs might be interacting with the cell membranes at shorter exposure times, as the images for 24 hours showed internalisation of the NPs and their accumulation in lysosomes which cluster in close proximity to the blue-stained nuclei (Fig. 4). Confocal microscopy was only performed on samples containing NPs, as it is necessary to have particle mass to reflect the light and thus the ionic control could not be analysed by this method. Tables summarising the NP intensities, NPs per cell values, and the remaining confocal images can be found in the ESI† as Tables S3–S5 and additional images are shown in Fig. S2 and S3.†
3.4 Intracellular calcium flux
Intracellular calcium (Ca2+) contributes to the maintenance of cellular homeostasis and leads to the transport of Ca2+ across cell membranes; thus, in order to understand the impact of AgNPs on this regulated cellular function, the intracellular calcium mobilization was assessed through a negatively charged fluorescent dye (Fluo-8 NW) that stays inside healthy cells, and whose fluorescence is greatly enhanced upon binding to cytosolic Ca2+. Thus, the positive control, DMSO, results in a 200% increase in intracellular Ca2+ relative to the control cells (Fig. 5). However, where there is significant membrane damage, the cells' intracellular Ca2+ levels may be recorded as less than the control cells due to leakage from the cell. The fluorescence intensity results were corrected by subtracting the blank from the treatment values, then, the corrected intensity was normalised to an equal number of cells for all treatments (1000 cells) based on the lowest cell count numbers, as the intensity could decrease as a result of lower numbers of viable cells at the higher AgNP/ionic Ag concentrations, and finally for easier interpretation, transformed to percentage (%) against the naïve. Results, for the 10 nm AgNPs displayed an inverse dose–response trend, with highest calcium percentages (%) at the 2.5 and 5 μg mL−1 concentrations (219.99 ± 80.12 and 178.53 ± 43.17%, respectively), whereas the 10 μg mL−1 showed a decrease in the percentage of calcium (164.19 ± 18.75%) although still much higher than that of the naïve cells (100 ± 0.0%) (Fig. 5). Interestingly, the ionic control displayed the lowest calcium percentages at all concentrations (77.81 ± 4.31, 14.16 ± 3.14, and 14.74 ± 0.88% for 1, 1.5 and 2 μg mL−1, respectively) compared to the AgNPs treatments and naïve (Fig. 5). This decrease in the intensity of the fluorescent dye below the levels present in the naive cells was not due to differences in the number of viable cells (which was corrected for by normalising the values to 1000 cells) and instead is suggestive of leakage of Ca2+ from the cells as a result of membrane damage by the Ag+ ions, and is consistent with induction of lipid peroxidation as shown in our previous work.22 These results suggest that the calcium response can be disrupted by interaction with AgNPs and Ag+ ions, although more work is needed to understand the nature of the disruption and whether it results in overstimulation of blockage of the permeable channels at the plasma membrane, leading to the disruption of the signalling cascade and the interplay between NP and ionic silver.33,34 The 30 nm AgNPs had no effect on the cellular Ca2+ content (98.34 ± 29.67) at 2.5 μg mL−1, compared to the naïve cells, while there was a noticeable increase of Ca2+ at the medium (116.40 ± 53.92) and high (255.68 ± 26.63) 30 nm AgNP concentrations (5 and 10 μg mL−1, respectively). Similarly, the 100 nm AgNPs showed a very slight increase in intracellular calcium content (101.03 ± 3.01) at the lowest AgNP concentration (2.5 μg mL−1), with increasing percentages at 5 and 10 μg mL−1 AgNP concentrations (109.04 ± 6.37 and 164.34 ± 23.21, respectively), suggesting that the larger AgNPs induce less noticeable changes in the intracellular calcium content compared to the smaller particle sizes. Normalised results can be found in Table S6 in the ESI.†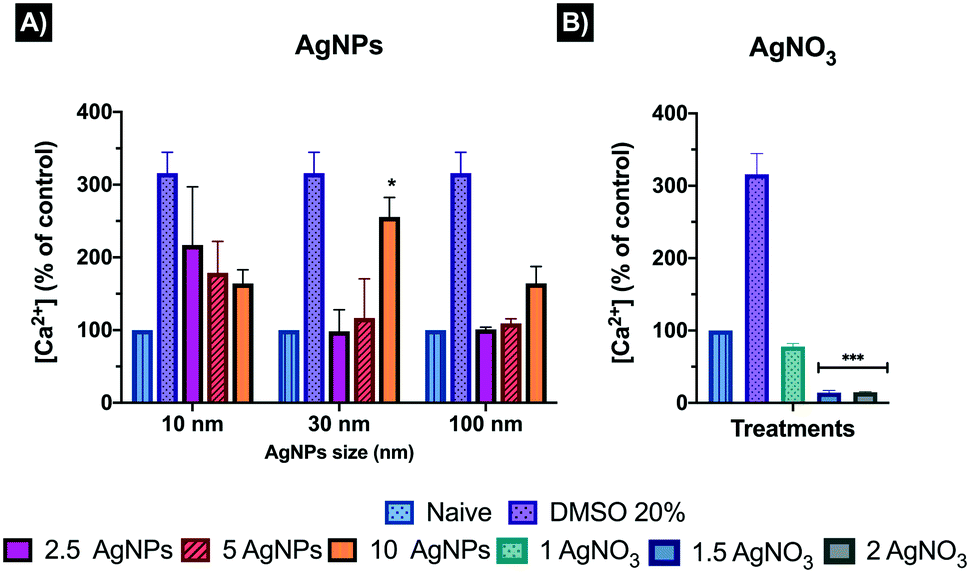 | ||
| Fig. 5 Intracellular calcium induced by (A) AgNPs and (B) AgNO3 in ZF4 cells at 24 hours in CCM. Cells were treated with 2.5, 5 and 10 μg mL−1 of 10, 30 and 100 nm AgNP and 1, 1.5 and 2 μg mL−1 of AgNO3 as ionic control for 24 hours. A positive control of 20% DMSO was also included for 30 minutes to ensure the reliability of the assay. The obtained intensities were corrected by subtracting the mean of the naïve cells from all treatments, then the corrected intensities were normalized to an equal number of 1000 cells per treatment and finally transformed to percentage (%) against naïve. Results represent the mean and standard deviation of three individual replicates. Data with asterisks (*) indicate a statistically significant difference of AgNPs treatments (*p < 0.05, and ***p < 0.001) compared to the naïve cells. | ||
3.5 Oxidative stress
Reactive oxygen species (ROS) are highly chemically reactive oxygen-containing molecules that can be generated at low levels as a natural product of oxygen metabolism; however, overload of ROS occurs as response a to cellular disruption and stress. All the NP concentrations tested induced an increase in ROS. The 10 nm AgNPs exhibited a dose-dependent increase in ROS-induction, from 106.2 ± 32.11% at 2.5 μg mL−1 to 217.2 ± 16.85% at 10 μg mL−1 compared to the naïve control (100 ± 18.95%) (Fig. 6).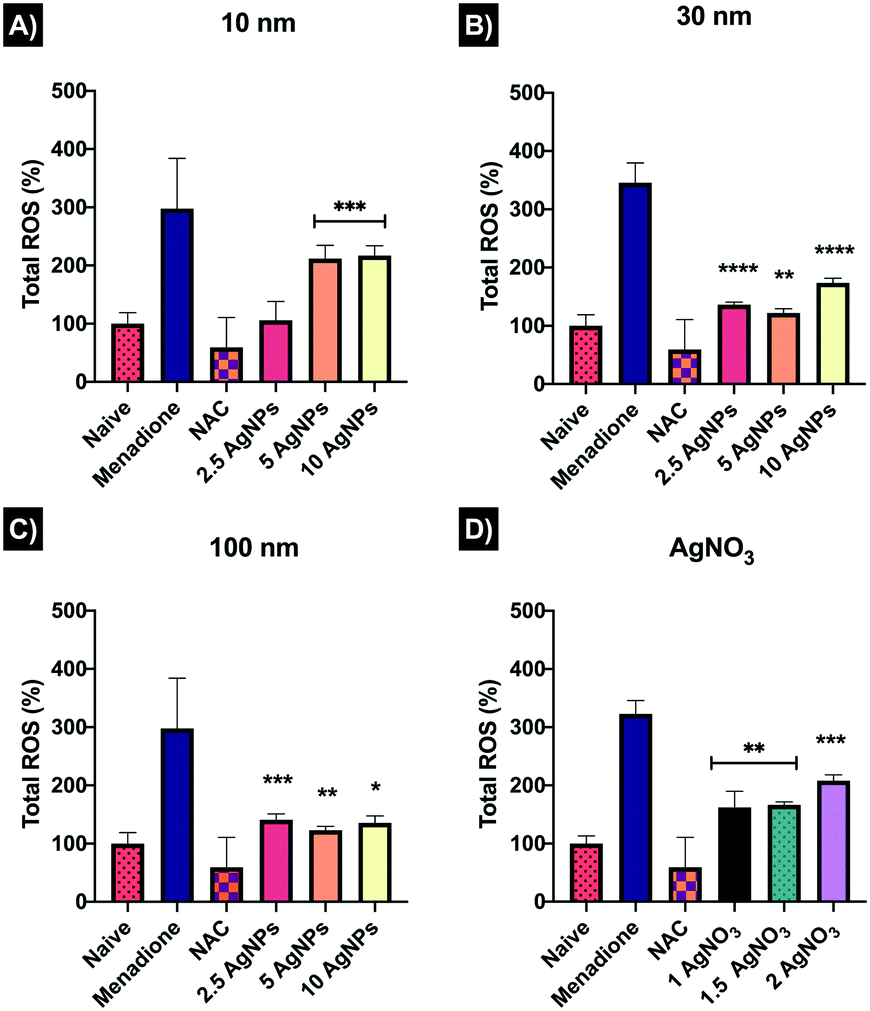 | ||
| Fig. 6 Total oxidative stress in ZF4 cells treated with AgNPs and AgNO3. Graphs show the normalised values of the recorded allophycocyanin (APC) filter mean intensities. Results were normalised against the naïve cells. A–C) Oxidative stress induced by AgNPs of different sizes after 24 hours. D) ROS production following AgNO3 exposure for 24 hours. Menadione (100 μM) and N-acetyl-L-cysteine (NAC) 5 mM were included for 1 hour as controls to induce and reduce ROS production, respectively. Data with asterisks (*) indicate statistically significant differences between AgNPs treatments (*p < 0.05, **p < 0.01, and ***p < 0.001) and the naïve cells. All bars under the line are included within the asterisk above. | ||
The 30 nm AgNPs showed major ROS production at 2.5 μg mL−1 (136.1 ± 4.77%) and 10 μg mL−1 (173.7 ± 8.0%) with a decrease at 5 μg mL−1 (121.9 ± 7.9%), suggesting that cells may have tried (unsuccessfully) to overcome the damage. The 100 nm AgNPs also presented major ROS induction, however, the lowest concentration displayed the highest ROS production as shown in Fig. 6. On the other hand, the AgNO3 showed a concentration-dependent ROS response, with values similar to those of the 10 nm AgNPs, suggesting a close link between the small NPs, which likely have the highest dissolution, and the ionic complexes. Overall, the results showed that 10 nm AgNPs induced major ROS production at high concentrations, whereas the 30 and 100 nm AgNPs induced ROS at low (2.5 μg mL−1) and high concentrations (10 μg mL−1), while the medium concentration (5 μg mL−1) seemed to be slightly better assimilated by the cells, perhaps as a result of activation of cellular repair mechanisms in an attempt to overcome the damage. The FlowJo extracted histograms and a table containing a summary of the normalised results can be found in Table S7 and Fig. S4 in the ESI.†
3.6 Cell cycle
The cell cycle involves a series of events that lead to cell division and replication. An arrest in the cell cycle implies a stopping point in the cycle, where duplication and division are no longer available, since arrest is a process used to facilitate DNA repair before cell proliferation. This is represented by an accumulation (increase in the percentages) of cells in a specific cell cycle phase, indicating that cells were arrested/delayed in that phase.14 Results for the 10 nm AgNPs showed complete disruption of the cell cycle, as all concentrations displayed reduced % cells in each of the G1, S and G2 phases, except the lowest AgNP concentration (2.5 μg mL−1) which showed a slight increase in the % cells in G2 (11.30 ± 0.3% compared to 10.03 ± 1.6% of the naïve cells) (Fig. 7). The noticeable decrease in all the cell cycle phases for the 10 nm AgNPs, may suggest that cell death has a key role in cell cycle regulation, as cells may not be able to overcome the irreparable damage, inducing cell cycle dysregulation by inhibiting normal controls on the system, and finally turning to cell death.35,36 The 30 nm AgNPs showed a clear cell cycle arrest at phase G2 with 12.36 ± 3.15, 13.18 ± 1.37, and 12.53 ± 0.37% of the cells in this phase for the 2.5, 5 and 10 μg mL−1 concentrations, respectively, compared to 10.03 ± 1.6% of the naïve cells. At phase G1, the 5 μg mL−1 was the only concentration that induced statistically significant (*p < 0.05) cell cycle arrest with 67.70 ± 2.78%, compared to naïve with 65.46 ± 2.2%. The 100 nm AgNPs displayed a slight increase in the % cells at phase G1 with 65.73 ± 2.45% suggesting a small percentage of delayed cells in this phase. On the contrary, all the concentrations showed cell cycle arrest at phase G2 with 11.02 ± 4.18, 12.46 ± 2.15 and 10.95 ± 1.97% for 2.5, 5 and 10 μg mL−1, respectively. Interestingly, all the AgNP concentrations for all three sizes (10, 30 and 100 nm) showed a decrease in phase S of the cell cycle, suggesting that cells are not entering this phase (of DNA synthesis), remaining in the other phases of the cell cycle to attempt to repair the damage induced by the AgNPs or Ag+ ions.14 On the other hand, the 1.5 and 2 μg mL−1 concentrations of the ionic control (AgNO3) showed the highest percentages of cell cycle arrest in phase G1 with 68.35 ± 1.06 and 71.0 ± 2.40% respectively, compared to the naïve and AgNPs treatments. As was the case with the 10 nm AgNPs, the ionic treatments displayed a reduction in the percentage of cells entering phase G2 at the medium (7.87 ± 0.92) and high concentrations (6.75 ± 0.78), whereas the lowest concentrations (1 μg mL−1) showed cell cycle arrest (increase of % cells at this phase) with 11.76 ± 0.94%. A summary of the results, including the percentages obtained for each phase and histograms, can be found in ESI† as section 6, Fig. S5 and Table S8.† | ||
| Fig. 7 Impact of AgNPs on cell cycle progression of ZF4 cells. Cells were treated with either 2.5, 5, and 10 μg mL−1 of three different AgNPs sizes (10, 30 and 100 nm) or 1, 1.5 and 2 μg mL−1 of AgNO3 for 24 hours in CCM. A–D) Percentage (%) of cells in each of the cell cycle phases after the exposure to AgNPs or AgNO3. Figures represent the mean intensity of propidium iodide versus the number of cells counted (10000). Concentrations of topotecan (3 μM) and etoposide (10 μM) were included as positive controls for S phase and G2/S phases, respectively. Data with asterisks (*) indicate statistically significant differences between AgNPs treatments and naïve cells for each phase (*p < 0.05). | ||
3.7 DNA damage assessed by comet assay
Single-cell gel electrophoresis or alkaline comet assay was used to detect single DNA strand breaks in ZF4 cells exposed to AgNPs and its ionic counterpart (AgNO3). The results showed increased DNA strand breaks for all AgNP concentrations and sizes. DNA strands breaks increased in a concentration-dependent manner as well as showing a NP size-dependent effect compared to the naïve cells (1.88 ± 1.45%). The registered tail percentages following exposure to 2.5, 5, 10 μg mL−1 were 7.5 ± 2.61, 8.70 ± 4.52, and 11.45 ± 3.53% for 10 nm AgNPs and 8.32 ± 6.03, 8.88 ± 9.69, and 10.45 ± 5.02% for 30 nm AgNPs (Fig. 8). Both sizes showed a statistically significant difference at the highest concentration (10 μg mL−1). The 100 nm AgNPs displayed the lowest percentages of DNA breaks of the three AgNP concentrations, which suggests that the smaller NPs may get internalised more easily, strongly interacting with the DNA; whereas for the 100 nm AgNPs internalisation and contact with DNA may be less likely. The positive control showed the highest percentage of DNA strand breaks compared to the AgNPs treatments and naïve, displaying almost identical values for the medium and high concentrations, with 79.48 ± 2.67% for 1 μg mL−1, 82.67 ± 1.46% for 1.5 μg mL−1 and 82.90 ± 0.91% 2 μg mL−1. Besides, the ionic control displayed above 50% DNA in the Comet tails higher than the positive control (H2O2 46.81 ± 6.02). The AgNO3 treatments also showed a significant difference at all concentrations compared to the naïve cells (*p < 0.001). Overall, all the comets in the acquired images reveal tail differences between the AgNP treatments versus its ionic counterpart (AgNO3), which showed massive percentages of DNA breaks compared the nanoparticulate form. A full summary of the results can be found in the Table S9 in the ESI† as well as in the images of the comets in Fig. S6.†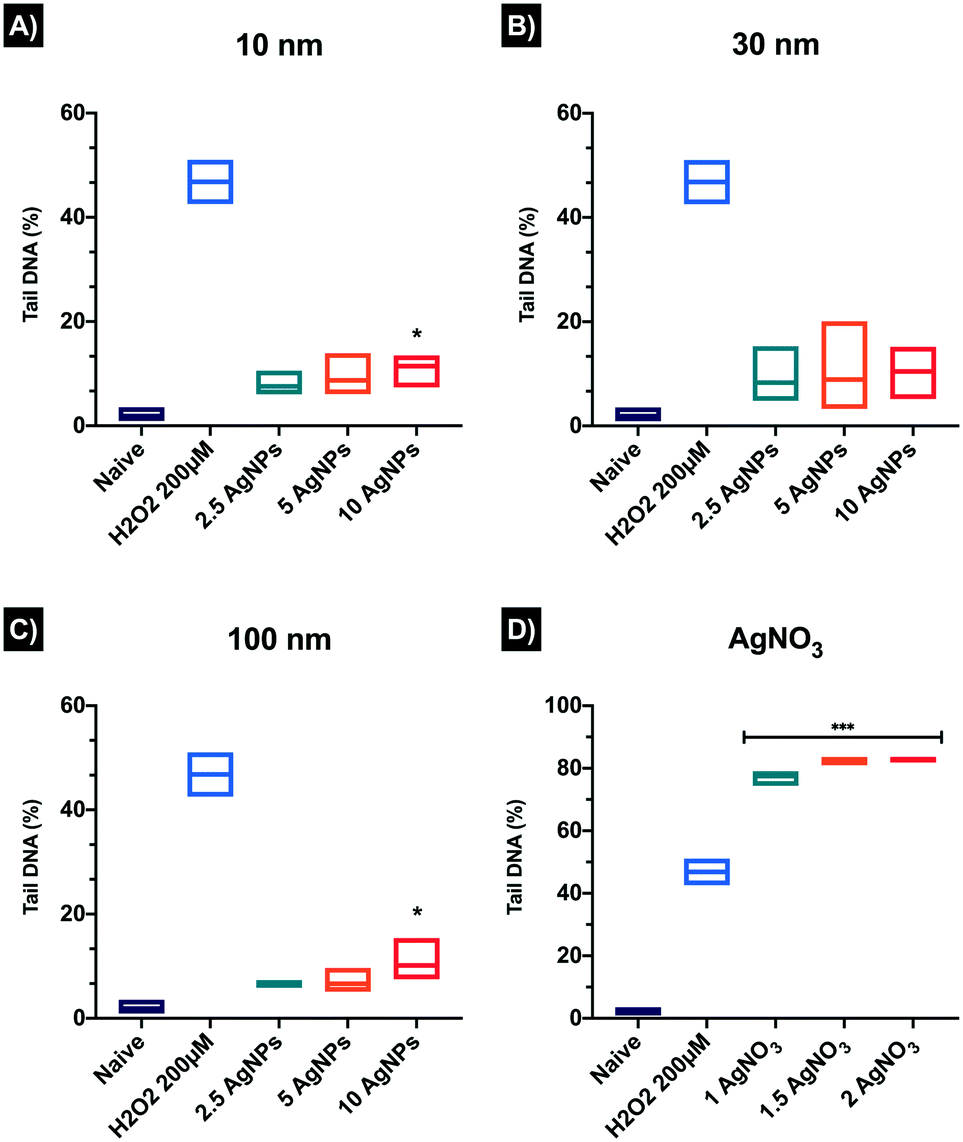 | ||
| Fig. 8 DNA damage in ZF4 cells treated with AgNPs of (A) 10 nm, (B) 30 nm, (C) 100 nm and (D) AgNO3. The mean DNA strand break percentages (%) obtained by analysing the DNA tail intensity (%) were determined using the comet assay. Three individual replicates were prepared and 150 comets in total were scored per treatment. Comets were analysed using IV comet macro software. Data with asterisks (*) indicate a statistically significant difference of AgNPs treatments (*p < 0.05 and ***p < 0.001) compared with the naïve cells. All bars under the line are included within the asterisk above. | ||
4. Discussion
Understanding the interactions of NPs within cells and how the NP size and biological exposure influence the cellular uptake, cell stress mechanisms, and cytotoxicity outcomes are key for the development of safer NMs.37 Cellular models provide a fast and reliable tool to further understand the molecular responses triggered after exposure to NPs. In this regard, the use of fish cells (e.g., topminnow fish and rainbow trout) has been widely exploited in terms of aquatic toxicology, being an excellent representative model with easy maintenance and consistent correlation with in vivo responses.19,38–41 However, as the production of NP-based products increases, the assessment of the possible negative outcomes in the aquatic environment and biological systems also increases, highlighting the continuous need for new alternative models.42,43 Towards this goal, and as part of our efforts to elucidate the interactions of AgNPs with fish cellular models, we evaluated the potential use of commercial embryonic zebrafish cells (ZF4) as an emerging in vitro toxicological model. These adherent fibroblast ZF4 cells were established from a 1 day old embryo,44 and provide an additional endpoint for early-stage assessment, compared to other fish cells lines, that are established from adult fish tissues.45 Furthermore, ZF4 cells can be maintained under regular cell culture conditions, which includes serum supplemented medium, preservation of the cell line in liquid nitrogen, and continuous growth and culture, features that make this cell line a potential screening tool for NPs toxicity as well as other types of xenobiotics (e.g., microplastics and pharmaceutical compounds).22,46–49AgNPs are strongly influenced by the surrounding environment. Hence, the interactions between NPs and constituents of the cell medium provide insights about the NPs' behaviour in relevant biological fluids or complex environments.50 It is known that the presence of proteins and salts and in cell medium can either reduce or enhance the toxicity of NPs as well as inducing alterations in the physiochemical characteristics of the NPs, such as changes in the size, shape, and surface area.18,51–53 In this regard, the characterisation in CCM and SFM by DLS demonstrated that the serum had a stabilizing effect on the NPs, as the hydrodynamic size did not change over 24 hours, compared to the AgNPs in SFM, which revealed major agglomeration after 24 hours. Moreover, the zeta potential in CCM treatments remained similar at both time points suggesting that corona formation around the PVP-capped AgNPs in CCM provided additional stability, with corona formation also evidenced by the slight increase in size as a result of the binding of serum proteins onto the NPs' surface.54–56 The hydrodynamic size in CCM was expected to increase most for the smaller particle size (10 nm) as the small particle size means that larger proteins may bind more than one particle leading to some agglomeration. Also, for the larger particles, a diameter increase of just a few nm as a result of protein binding is less discernible by DLS than the increase in size of the smaller NPs.57 On the other hand, AgNPs in SFM revealed strong agglomeration and/or sedimentation after 24 hours, with sizes between 500 to 600 nm, presumably due to the high concentration of ionic salts in the medium despite the PVP capping which should provide steric stabilisation.17 Similar NP behaviour in SFM has been previously demonstrated by other authors.17,19,23,58 For example, a study by Yue et al. (2014) determined that citrate AgNPs in SFM exposed to rainbow trout cells presented a noticeable increase in size, going from an initial size of 40–100 nm to 1000–1750 nm after 24 hours (ref. 19) although of course the particles here were electrostatically stabilised only.
The dynamic interplay between the intrinsic properties of the NPs and the components of the physiological environment is closely related to the activation of the cells' molecular responses (Fig. 9).50 In this study all the experiments were performed in CCM; however, to further understand the effect of serum on the toxicity the NPs, an additional cytotoxic assay in SFM was included. Results demonstrated that AgNPs treatments in CCM (10% FBS) produced a minor cytotoxic effect on cells compared to the serum-free treatments, which revealed higher toxicity at earlier exposure times, as suggested by other authors in mammalian and fish cell models.17,53,58–60 Similarly, the ionic control revealed lower toxicity in serum-containing treatments. Additionally, all the Ag+ concentrations displayed higher toxicity compared to the NPs in serum-free treatments, with Ag+ inducing a 50% reduction of the cell population at 2 μg mL−1 in the first 6 hours of exposure and under SFM conditions. The reduction of AgNP cytotoxicity in CCM compared to SFM treatments may be influenced by the binding between NPs, and ionic silver and the proteins present in the medium, having a mitigating effect on the toxicity. This can be related to fact that there is less direct interaction between the NPs with the cells due to the protein corona in the NPs, which is mainly formed of serum proteins as well as due to the binding or proteins with Ag+.17,58,59,61 On the other hand, the absence of biomolecules (from serum) in the SFM treatments as well as the high surface reactivity of NMs, may result in higher cellular damage due to the strong adhesion of the bare NPs to the cell membrane, potentially forming a corona from biomolecules pulled out from the cell membrane, such as cytosolic proteins (from the cytoskeleton) and other cell membrane proteins.62,63
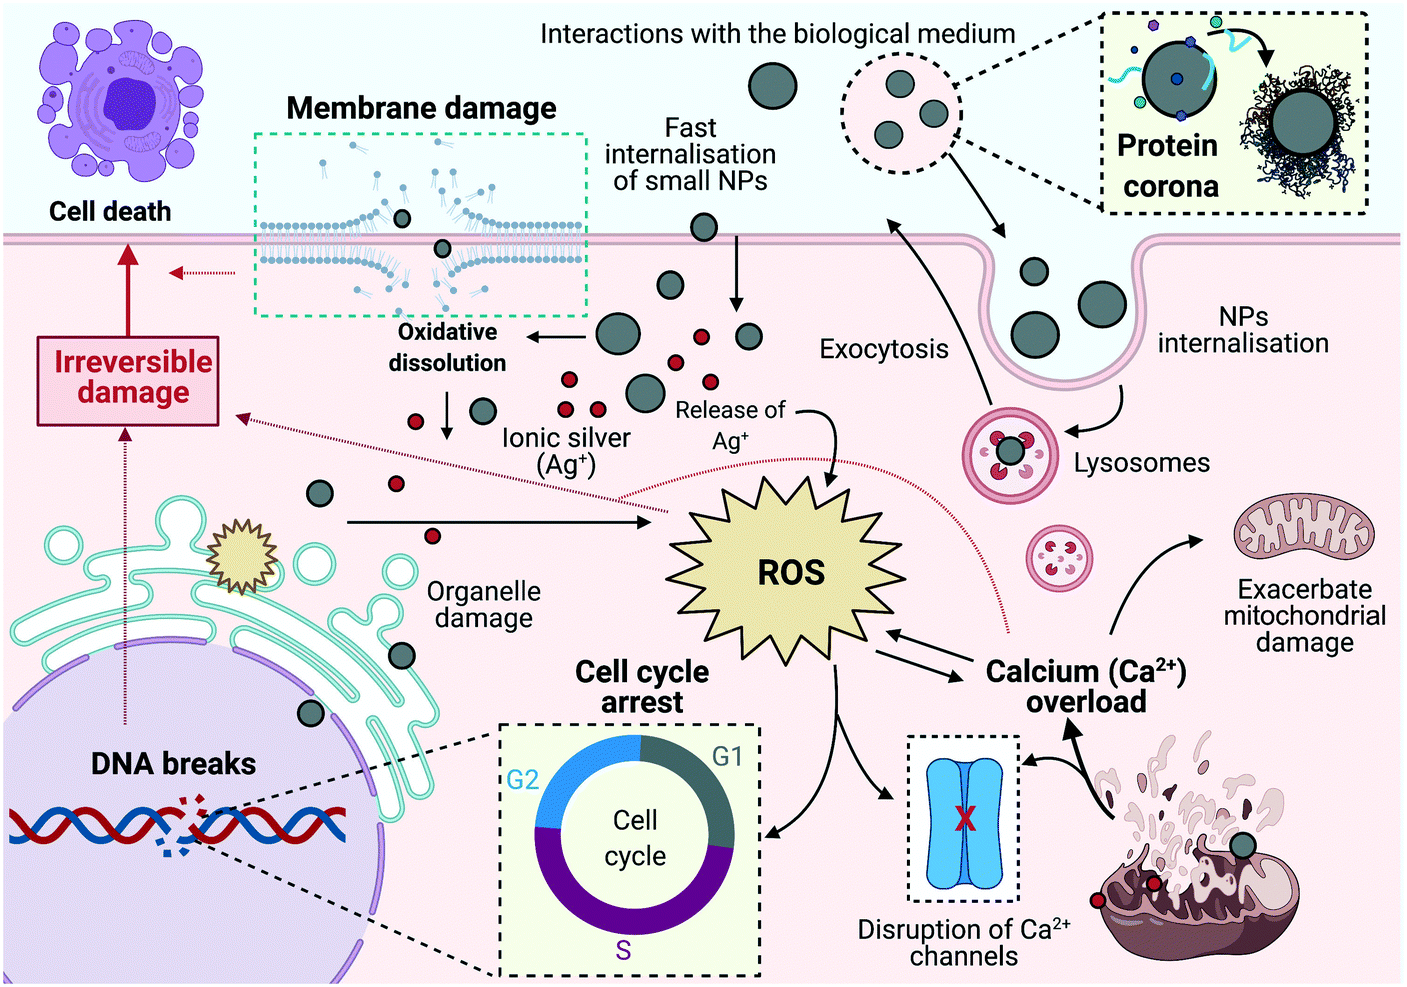 | ||
| Fig. 9 Hypothetical cellular mechanisms induced in ZF4 cells by AgNP exposure. The figure illustrates the dynamic interplay of the evaluated mechanisms after exposure to AgNPs and ionic Ag+, including NP internalisation, membrane damage, ROS formation, DNA strand breaks, calcium flux mobilization, and cell cycle arrest. Image created with BioRender software. | ||
The cellular uptake and biodistribution of NPs are strongly influenced by proteins in the biological suspension, which also affect their fate, bioavailability, and potential toxicity.18,64–66 Results for NP internalisation by confocal microscopy showed a major NP intensity during the first 2 hours, however, this might be due to NP adhesion to the cell membrane and not cellular uptake. It has been previously reported by Abdelkhaliq et al. (2018) that the cellular adhesion of polystyrene NPs occurred after 10 minutes of exposure, whereas internalisation was confirmed after 24 hours at a much slower rate.67 The confocal images confirmed these findings; after 2 hours, the AgNPs were mainly associated with the cell membranes, while after 24 hours of exposure, the AgNPs were found located centrally in the lysosomes of the cells (Fig. 4). In addition, NPs per cell calculations demonstrated a high number of visible intracellular NPs after 24 hours, especially for the 10 nm particles, which can be related to the larger number of NPs mL−1 at constant mass (Table S4 ESI†). In addition to the number of NPs per cell, the estimation of the total SA of the NPs' in our previous study at the different mass concentrations (2.5, 5 and 10 μg mL−1) confirms that the smaller NPs have the largest SA (6.22 × 10−05 m2 g−1 at 10 μg mL−1) followed by the 30 nm (5.78 × 10−05 m2 g−1 at 10 μg mL−1) and lastly the 100 nm NPs (3.67 × 10−05 m2 g−1 at 10 μg mL−1).22
Interestingly, results for the reflectance intensity (uptake) at both exposure times (2 and 24 hours) showed inverse tendencies, with the highest intensity values at 2 hours (10 nm > 30 nm > 100 nm), whereas after 24 hours, there was a notable decrease in the reflectance intensity of NPs, and the overall reflectance intensity was in the order 100 nm > 30 nm > 10 nm. These results may suggest that cells might be able to cope with NPs at short exposure times, as most of the NPs were located in the cell membrane (Fig. 4); after 24 hours, other factors may be influencing the reflectance intensity of the NPs such as dissolution (mainly for smaller NPs as 10 nm), which would decrease reflectance intensity levels, agglomeration (higher intensity for larger NP sizes), and possible exocytosis. Although NP exocytotic mechanisms are not widely understood (it might differ depending on the NP characteristics), it is known that cells might be able to excrete NPs by lysosomal exocytosis, as a mechanism to reduce intracellular NP concentrations,68 although experimental evidence for exocytosis of NPs is needed. Furthermore, cells may deactivate preexisting uptake routes due to saturation of the uptake pathways (after long exposure periods), related to the massive energy input needed to activate other cellular processes, such as stress mechanisms.69 The internalisation of the NPs can be achieved by different membrane interactions and uptake processes, such as receptor–ligand mediated active process, as well as non-specific routes such as passive fluid encapsulation. A series of calculations were used to quantitatively estimate the likelihood of AgNPs (10, 30 and 100 nm) entering cells through either direct membrane–bound interactions and/or fluid phase encapsulation (through clathrin-coated pits), based upon the properties of the vesicles and the NPs (e.g., size), as described previously.27,28 Results for the highest AgNP concentrations (10 μg mL−1) suggest that the 10 and 100 nm sizes were more likely to enter the cells via fluid phase (clathrin-coated) uptake, whereas for the 30 nm AgNPs, the calculations showed a clear likelihood for the NPs to enter the cell via membrane proteins/receptors, showing a larger number of NPs at the cell surface and in the lumen which may enter the cells by binding to the inner membrane vesicle rather than through the fluid phase (see results in ESI† section 8 as Table S10). However, further studies are necessary to confirm this hypothesis.
Interestingly, the exposure concentrations, size and form (particulate or dissolved) of the AgNPs were linked to the induction of different biological outcomes. It has been suggested that smaller particle sizes may present a higher biological effect compared to larger particles at constant mass concentration due to the higher number of smaller particles.70,71 ZF4 cellular exposure to AgNPs and AgNO3 resulted in an overgeneration of ROS, especially with the smaller sized AgNPs at all concentrations, supporting the likelihood of higher toxicity of the smaller size, which can be more easily internalised, inducing major intracellular disruption as well as producing a higher release of ionic Ag inside the cells. The release of ions from NPs has been linked to a number of cytotoxic responses, becoming a threat to aquatic organisms as suggested in other fish cell studies.18,23,53,72–74 The overgeneration of ROS by NPs exposure has been strongly related to disruption of other signalling related process, such as intracellular Ca2+ disruption, leading to adenosine triphosphate (ATP) depletion, DNA damage, and eventually cell death.75–77 Interestingly, results for the intracellular Ca2+ mobilisation demonstrated that the flux was altered by exposure to AgNPs and its ionic counterpart. Data showed a size and concentration dependent intracellular Ca2+ release for all the concentrations and AgNP sizes, suggesting the active role of the AgNPs in inducing mitochondrial membrane permeability, leading to the release of Ca2+ into the cytosol.75,78,79 This agrees with a study by Bermejo-Nogales et al., (2016) in hepatoma fish (Poeciliopsis lucida) cells, who demonstrated that AgNPs were able to induce oxidative stress via mitochondrial membrane potential disruption, eventually leading to cell death.77 On the other hand, the ionic counterpart showed the lowest values for Ca2+ release; this reduction in the intracellular Ca2+ content might be due to massive amounts of membrane damage (analysed by LDH) leading to leakage of the Ca2+ and the dye from the cells such that it is no longer detected.33,34 For example, a study fish (Pimephales promelas) demonstrated that PVP–AgNPs and AgNO3 induced oxidative stress and high levels of neurotoxicity, and disruption of sodium (Na+), potassium and (K+), and hydrogen (H+) channel homeostasis.80 Further work is needed to be able to draw conclusions regarding the mode of action of the AgNPs here in terms of their impacts on Ca2+ transport and mobilisation.
High levels of ROS and prolonged elevation of Ca2+ in the cytosol may lead to DNA damage.6,78,81 In addition, the type and extent of DNA impairment vary depending on the NP characteristics, such as size, surface modification, and concentration.82 Interestingly, our results demonstrated a strong correlation of the % DNA strand breaks with the AgNPs size and concentration; here again the smaller AgNPs (10 nm) and the ionic control at all concentrations induced the highest % DNA strand breaks. These results are related to the fact that all AgNPs sizes and concentrations tested induced disruption in the cell cycle, preventing cells from reaching the S phase in which DNA replication occurs, as suggested by other authors.14,35 The cell cycle results for the 10 nm AgNPs may suggest that the cells were not able to proliferate and continue with mitosis, instead relying on cell death as a means to overcome the DNA damage.83 On the other hand, the 30 and 100 nm AgNP sizes clearly displayed an increase in the % cells accumulating in the G1 and G2 phases, which relates to cell proliferation, suggesting the induction of cell cycle arrest at these phases, providing time for the cell to repair the DNA damage and carry on with the processes for cell division.9,10 The results can be related perhaps to the activation of the pro-apoptotic proteins (e.g., Bax family), which regulate cell cycle checkpoints, DNA repair, and cell death to maintain genomic stability.10 In the presence of DNA damage, the cell activates cell cycle arrest in G1 and G2, regulating cell death mechanisms and triggering apoptosis by the activation of pro-apoptotic proteins and transcriptional induction of genes to remove damaged cells.84 However, further studies are necessary to explore the role of these pro-apoptotic proteins in the activation of apoptosis in ZF4 cells.
The cellular mechanisms triggered in response to AgNP-mediated toxicity elucidate the dynamic interplay between toxicity pathways including generation of oxidative stress and calcium disturbances, genetic damage, inhibition of cell division and induction of cell death, and the molecular responses activated to deal with these, as shown in the schematic illustration in Fig. 9. The use of embryonic ZF4 cells, compared to other fish cells (e.g., rainbow trout gill cells) which are established from adult models, may provide an additional early-stage toxicity model, contributing with new biological data in different fish species. In addition, this information will help to confirm the applicability of ZF4 cells as a potential tool to screen NP toxicity, providing valuable mechanistic data to build an adverse outcome pathway (AOP) for NPs, as well as encouraging the reduction of animals in experimentation through the application of the 3Rs framework.16,85
5. Conclusions
This study demonstrates the potential use of ZF4 cells as an emerging aquatic model to assess toxicity and molecular mechanisms related to exposure to NPs. The interactions between AgNPs and biological fluids revealed that NPs' physicochemical changes, colloidal stability, and cytotoxicity are closely related to the surrounding environment. Moreover, our findings suggest that 10 nm AgNPs can be taken up easily into the ZF4 cells, due to their small size and enormous specific surface area, which enables fast dissolution of the NPs and release of ions in the lysosomes, leading to loss of reflectance signal (in the confocal assays), as well as enhancing their Ag+ related toxicity and triggering cell death. Results for the uptake of the NPs, by confocal microscopy, showed that internalisation of the NPs occurred at longer exposure times (24 hours), while at shorter exposure periods (2 hours) the NPs were mainly associated with the cellular membrane.The internalisation of the NPs triggered the activation of defence mechanisms to deal with induced NP-toxicity. These responses were strongly linked to the concentration and size of the AgNPs and included overgeneration of ROS and disturbances of calcium flux as these processes are closely interconnected. Moreover, AgNP exposure led to DNA breaks (genotoxicity), which also was strongly related to the size and ionic form the AgNPs, leading to some evidence of the activation cell cycle arrest in the G2 phase and a reduction of the % of cells reaching the S phase, to provide time to overcome the induced DNA damage as part of the cells' defence mechanisms.
These data, while confirming much of what is already known about AgNP toxicity, are an important addition to the literature as they indicate that ZF4 cells, a continuous adherent zebrafish embryo cell line, behave similarly to other fish and mammalian cells. As such, ZF4 cells can be utilised in high throughput screening as a lower tier model to assess nano-ecotoxicity, and represent an important alternative to zebrafish embryo testing, which requires culturing of adult fish and associated ethical permissions and animal handling licences.
Author contributions
ACQ designed and performed the experiments, analysed the data, and drafted the manuscript; IL and EVJ conceived the experiments, analysed the data, revised and approved the manuscript.Conflicts of interest
There are no conflicts to declare.Acknowledgements
ACQ would like to thank The National Council for Science and Technology (CONACyT) in Mexico for funding her PhD studies. ACQ, IL and EVJ acknowledge support from the European Union Horizon 2020 Programme (H2020) project ACEnano (grant agreement No 720952). Consumables costs for the project were supported by the H2020 project RiskGone (814425).References
- B. Reidy, A. Haase, A. Luch, K. A. Dawson and I. Lynch, Materials, 2013, 6, 2295–2350 CrossRef CAS PubMed.
- N. A. Lewinski, in Encyclopedia of Nanotechnology, ed. B. Bhushan, Springer Netherlands, Dordrecht, 2012, pp. 1644–1651 Search PubMed.
- G. Pizzino, N. Irrera, M. Cucinotta, G. Pallio, F. Mannino, V. Arcoraci, F. Squadrito, D. Altavilla and A. Bitto, Oxid. Med. Cell. Longevity, 2017, 2017, 8416763 Search PubMed.
- A. Görlach, K. Bertram, S. Hudecova and O. Krizanova, Redox Biol., 2015, 6, 260–271 CrossRef PubMed.
- X. Cheng, X. Zhang, L. Yu and H. Xu, Semin. Cell Dev. Biol., 2015, 45, 24–31 CrossRef CAS PubMed.
- S. Orrenius, B. Zhivotovsky and P. Nicotera, Nat. Rev. Mol. Cell Biol., 2003, 4, 552–565 CrossRef CAS PubMed.
- M. S. Cooke, M. D. Evans, M. Dizdaroglu and J. Lunec, FASEB J., 2003, 17, 1195–1214 CrossRef CAS PubMed.
- J. H. Houtgraaf, J. Versmissen and W. J. van der Giessen, Cardiovasc. Revasc. Med., 2006, 7, 165–172 CrossRef PubMed.
- N. Singh, B. C. Nelson, L. D. Scanlan, E. Coskun, P. Jaruga and S. H. Doak, Int. J. Mol. Sci., 2017, 18, 1515 CrossRef PubMed.
- R. Wan, Y. Mo, L. Feng, S. Chien, D. J. Tollerud and Q. Zhang, Chem. Res. Toxicol., 2012, 25, 1402–1411 Search PubMed.
- N. Chatterjee and G. C. Walker, Environ. Mol. Mutagen., 2017, 58, 235–263 CrossRef CAS PubMed.
- A. Sancar, L. A. Lindsey-Boltz, K. Unsal-Kaçmaz and S. Linn, Annu. Rev. Biochem., 2004, 73, 39–85 CrossRef CAS PubMed.
- M. Mahmoudi, K. Azadmanesh, M. A. Shokrgozar, W. S. Journeay and S. Laurent, Chem. Rev., 2011, 111, 3407–3432 CrossRef CAS PubMed.
- J. A. Kim, C. Åberg, A. Salvati and K. A. Dawson, Nat. Nanotechnol., 2012, 7, 62–68 CrossRef CAS PubMed.
- D. Mukherjee, S. G. Royce, S. Sarkar, A. Thorley, S. Schwander, M. P. Ryan, A. E. Porter, K. F. Chung, T. D. Tetley, J. Zhang and P. G. Georgopoulos, J. Toxicol., 2014, 2014, 852890 Search PubMed.
- M. Schaeck, W. Van den Broeck, K. Hermans and A. Decostere, ATLA, Altern. Lab. Anim., 2013, 41, 219–229 CrossRef CAS PubMed.
- I. L. Hsiao and Y.-J. Huang, J. Nanopart. Res., 2013, 15, 1829 CrossRef PubMed.
- M. Minghetti and K. Schirmer, Nanotoxicology, 2016, 10, 1526–1534 CrossRef CAS PubMed.
- Y. Yue, R. Behra, L. Sigg, P. Fernández Freire, S. Pillai and K. Schirmer, Nanotoxicology, 2014, 9, 54–63 CrossRef PubMed.
- A. E. Nel, L. Mädler, D. Velegol, T. Xia, E. M. Hoek, P. Somasundaran, F. Klaessig, V. Castranova and M. Thompson, Nat. Mater., 2009, 8, 543–557 CrossRef CAS PubMed.
- M. P. Monopoli, C. Aberg, A. Salvati and K. A. Dawson, Nat. Nanotechnol., 2012, 7, 779–786 CrossRef CAS PubMed.
- A. C. Quevedo, I. Lynch and E. Valsami-Jones, Nanoscale, 2021, 13, 6142–6161 RSC.
- Y. Yue, R. Behra, L. Sigg and K. Schirmer, Nanotoxicology, 2016, 10, 1075–1083 CrossRef CAS PubMed.
- H. Ali-Boucetta, K. T. Al-Jamal, K. H. Muller, S. Li, A. E. Porter, A. Eddaoudi, M. Prato, A. Bianco and K. Kostarelos, Small, 2011, 7, 3230–3238 CrossRef CAS PubMed.
- A. L. Holder, R. Goth-Goldstein, D. Lucas and C. P. Koshland, Chem. Res. Toxicol., 2012, 25, 1885–1892 Search PubMed.
- G. Kumar, H. Degheidy, B. J. Casey and P. L. Goering, Food Chem. Toxicol., 2015, 85, 45–51 CrossRef CAS PubMed.
- P. J. Smith, M. Giroud, H. L. Wiggins, F. Gower, J. A. Thorley, B. Stolpe, J. Mazzolini, R. J. Dyson and J. Z. Rappoport, Int. J. Nanomed., 2012, 7, 2045–2055 CAS.
- E. J. Guggenheim, J. Z. Rappoport and I. Lynch, Nanotoxicology, 2020, 14, 504–532 CrossRef CAS PubMed.
- C. Labno, Basic Intensity Quantification with ImageJ, https://www.unige.ch/medecine/bioimaging/files/1914/1208/6000/Quantification.pdf Search PubMed.
- AAT Bioquest, Screen QuestTM Fluo-8 Medium Removal Calcium Assay Kit, https://www.aatbio.com/products/screen-quest-fluo-8-medium-removal-calcium-assay-kit-optimized-for-difficult-cell-lines Search PubMed.
- A. Salvati, C. Åberg, T. dos Santos, J. Varela, P. Pinto, I. Lynch and K. A. Dawson, Nanomed.: Nanotechnol., Biol. Med., 2011, 7, 818–826 CrossRef CAS PubMed.
- S. He, Cancer and inflammation studies using zebrafish cell lines, Doctoral thesis, Leiden University, 2010, https://hdl.handle.net/1887/15555 Search PubMed.
- A. Onodera, K. Yayama, H. Morosawa, Y. Ishii, Y. Tsutsumi and Y. Kawai, Biochem. Biophys. Rep., 2017, 9, 330–334 Search PubMed.
- A. Menegon, S. Pitassi, N. Mazzocchi, L. Redaelli, R. Rizzetto, J. F. Rolland, C. Poli, M. Imberti, A. Lanati and F. Grohovaz, Sci. Rep., 2017, 7, 44843 CrossRef CAS PubMed.
- V. Bastos, I. F. Duarte, C. Santos and H. Oliveira, J. Nanopart. Res., 2017, 19, 163 CrossRef.
- K. Kansara, P. Patel, D. Shah, R. Shukla, S. Singh, A. Kumar and A. Dhawan, Environ. Mol. Mutagen., 2015, 56, 204–217 CrossRef CAS PubMed.
- I. M. Adjei, B. Sharma and V. Labhasetwar, Adv. Exp. Med. Biol., 2014, 811, 73–91 CrossRef PubMed.
- N. R. Bury, S. Schnell and C. Hogstrand, J. Exp. Biol., 2014, 217, 639 CrossRef CAS PubMed.
- K. Fent, Toxicol. In Vitro, 2001, 15, 477–488 CrossRef CAS PubMed.
- K. Tanneberger, M. Knöbel, F. J. Busser, T. L. Sinnige, J. L. Hermens and K. Schirmer, Environ. Sci. Technol., 2013, 47, 1110–1119 CrossRef CAS PubMed.
- S. George, H. Gardner, E. K. Seng, H. Chang, C. Wang, C. H. Yu Fang, M. Richards, S. Valiyaveettil and W. K. Chan, Environ. Sci. Technol., 2014, 48, 6374–6382 CrossRef CAS PubMed.
- N. C. Bols, V. R. Dayeh, L. E. J. Lee and K. Schirmer, in Biochemistry and Molecular Biology of Fishes, ed. T. P. Mommsen and T. W. Moon, Elsevier, 2005, vol. 6, pp. 43–84 Search PubMed.
- J. Kniewald, I. Kmetic, V. Gaurina-Srcek and Z. Kniewald, Arh. Hig. Rada Toksikol., 2005, 56, 195–204 CAS.
- W. Driever and Z. Rangini, In Vitro Cell. Dev. Biol.: Anim., 1993, 29, 749–754 CrossRef PubMed.
- H. Segner, Exs, 1998, 86, 1–38 CAS.
- S. Lungu-Mitea, A. Oskarsson and J. Lundqvist, Sci. Rep., 2018, 8, 12380 CrossRef PubMed.
- Z. Li, Y. Long, L. Zhong, G. Song, X. Zhang, L. Yuan, Z. Cui and H. Dai, J. Appl. Toxicol., 2015, 36, 94–104 CrossRef PubMed.
- M. Sendra, P. Pereiro, M. P. Yeste, L. Mercado, A. Figueras and B. Novoa, Environ. Pollut., 2021, 268, 115769 CrossRef CAS PubMed.
- N. Yan, B. Z. Tang and W.-X. Wang, Environ. Sci.: Nano, 2021, 8, 1364–1375 RSC.
- T. L. Moore, L. Rodriguez-Lorenzo, V. Hirsch, S. Balog, D. Urban, C. Jud, B. Rothen-Rutishauser, M. Lattuada and A. Petri-Fink, Chem. Soc. Rev., 2015, 44, 6287–6305 RSC.
- K. J. Groh, T. Dalkvist, F. Piccapietra, R. Behra, M. J. Suter and K. Schirmer, Nanotoxicology, 2015, 9, 81–91 CrossRef CAS PubMed.
- L. Qiang, Z. H. Arabeyyat, Q. Xin, V. N. Paunov, I. J. F. Dale, R. I. Lloyd Mills, J. M. Rotchell and J. Cheng, Int. J. Mol. Sci., 2020, 21, 1876 CrossRef CAS PubMed.
- Y. Yue, R. Behra, L. Sigg, P. Fernández Freire, S. Pillai and K. Schirmer, Nanotoxicology, 2015, 9, 54–63 CrossRef CAS PubMed.
- M. Suvarna, S. Dyawanapelly, B. Kansara, P. Dandekar and R. Jain, ACS Appl. Nano Mater., 2018, 1, 5524–5535 CrossRef CAS.
- R. C. Murdock, L. Braydich-Stolle, A. M. Schrand, J. J. Schlager and S. M. Hussain, Toxicol. Sci., 2007, 101, 239–253 CrossRef PubMed.
- J. H. Shannahan, X. Lai, P. C. Ke, R. Podila, J. M. Brown and F. A. Witzmann, PLoS One, 2013, 8, e74001 CrossRef CAS PubMed.
- G. Berrecoso, J. Crecente-Campo and M. J. Alonso, Drug Delivery Transl. Res., 2020, 10, 730–750 CrossRef CAS PubMed.
- B. Halamoda-Kenzaoui, M. Ceridono, P. Colpo, A. Valsesia, P. Urbán, I. Ojea-Jiménez, S. Gioria, D. Gilliland, F. Rossi and A. Kinsner-Ovaskainen, PLoS One, 2015, 10, e0141593 CrossRef PubMed.
- I. Montes-Burgos, D. Walczyk, P. Hole, J. Smith, I. Lynch and K. Dawson, J. Nanopart. Res., 2010, 12, 47–53 CrossRef.
- T. L. Moore, D. A. Urban, L. Rodriguez-Lorenzo, A. Milosevic, F. Crippa, M. Spuch-Calvar, S. Balog, B. Rothen-Rutishauser, M. Lattuada and A. Petri-Fink, Sci. Rep., 2019, 9, 900 CrossRef PubMed.
- N. Durán, C. P. Silveira, M. Durán and D. S. T. Martinez, J. Nanobiotechnol., 2015, 13, 55 CrossRef PubMed.
- A. Lesniak, F. Fenaroli, M. P. Monopoli, C. Åberg, K. A. Dawson and A. Salvati, ACS Nano, 2012, 6, 5845–5857 CrossRef CAS PubMed.
- E. J. Guggenheim, S. Milani, P. J. F. Röttgermann, M. Dusinska, C. Saout, A. Salvati, J. O. Rädler and I. Lynch, NanoImpact, 2018, 10, 121–142 CrossRef.
- A. Hartland, J. R. Lead, V. I. Slaveykova, D. O’Carroll and E. Valsami-Jones, Nat. Educ. Knowl., 2013, 4, 7 Search PubMed.
- M. Li, F. Dang, Q.-L. Fu, D.-M. Zhou and B. Yin, Environ. Sci.: Nano, 2018, 5, 969–979 RSC.
- F. S. M. Tekie, M. Hajiramezanali, P. Geramifar, M. Raoufi, R. Dinarvand, M. Soleimani and F. Atyabi, Sci. Rep., 2020, 10, 9664 CrossRef PubMed.
- A. Abdelkhaliq, M. van der Zande, A. Punt, R. Helsdingen, S. Boeren, J. J. M. Vervoort, I. M. C. M. Rietjens and H. Bouwmeester, J. Nanobiotechnol., 2018, 16, 70 CrossRef PubMed.
- E. Fröhlich, Environ. Toxicol. Pharmacol., 2016, 46, 90–94 CrossRef PubMed.
- A. Panariti, G. Miserocchi and I. Rivolta, Nanotechnol., Sci. Appl., 2012, 5, 87–100 CAS.
- Y. Yang, X. Du, Q. Wang, J. Liu, E. Zhang, L. Sai, C. Peng, M. F. Lavin, A. J. Yeo, X. Yang, H. Shao and Z. Du, Int. J. Mol. Med., 2019, 44, 903–912 CAS.
- F. Book, M. T. Ekvall, M. Persson, S. Lönnerud, T. Lammel, J. Sturve and T. Backhaus, NanoImpact, 2019, 13, 100–111 CrossRef.
- S. George, S. Lin, Z. Ji, C. R. Thomas, L. Li, M. Mecklenburg, H. Meng, X. Wang, H. Zhang, T. Xia, J. N. Hohman, S. Lin, J. I. Zink, P. S. Weiss and A. E. Nel, ACS Nano, 2012, 6, 3745–3759 CrossRef CAS PubMed.
- N. Degger, A. C. K. Tse and R. S. S. Wu, Aquat. Toxicol., 2015, 169, 143–151 CrossRef CAS PubMed.
- M. Connolly, M.-L. Fernandez-Cruz, A. Quesada-Garcia, L. Alte, H. Segner and J. Navas, Int. J. Environ. Res. Public Health, 2015, 12, 5386–5405 CrossRef CAS PubMed.
- C.-C. Huang, R. S. Aronstam, D.-R. Chen and Y.-W. Huang, Toxicol. In Vitro, 2010, 24, 45–55 CrossRef CAS PubMed.
- A. Manke, L. Wang and Y. Rojanasakul, BioMed Res. Int., 2013, 2013, 942916 Search PubMed.
- A. Bermejo-Nogales, M. Fernández, M. L. Fernández-Cruz and J. M. Navas, Comp. Biochem. Physiol., Part C: Toxicol. Pharmacol., 2016, 190, 54–65 CAS.
- L. Li, Z. Bi, Y. Hu, L. Sun, Y. Song, S. Chen, F. Mo, J. Yang, Y. Wei and X. Wei, Cell Biol. Toxicol., 2020, 37(2), 177–191 CrossRef PubMed.
- C. Guo, J. Wang, L. Jing, R. Ma, X. Liu, L. Gao, L. Cao, J. Duan, X. Zhou, Y. Li and Z. Sun, Environ. Pollut., 2018, 236, 926–936 CrossRef CAS PubMed.
- N. Garcia-Reyero, A. J. Kennedy, B. L. Escalon, T. Habib, J. G. Laird, A. Rawat, S. Wiseman, M. Hecker, N. Denslow, J. A. Steevens and E. J. Perkins, Environ. Sci. Technol., 2014, 48, 4546–4555 CrossRef CAS PubMed.
- P. Wyrsch, C. Blenn, T. Pesch, S. Beneke and F. R. Althaus, Cell Commun. Signaling, 2013, 11, 11 CrossRef CAS PubMed.
- Q. Li, C. Huang, L. Liu, R. Hu and J. Qu, Nanomaterials, 2018, 8, 1063 CrossRef PubMed.
- H.-J. Eom and J. Choi, Environ. Sci. Technol., 2010, 44, 8337–8342 CrossRef CAS PubMed.
- H. K. Lim, P. V. AshaRani and M. P. Hande, Front. Genet., 2012, 3, 104 Search PubMed.
- S. Lungu-Mitea and J. Lundqvist, Arch. Toxicol., 2020, 94, 2769–2784 CrossRef CAS PubMed.
Footnote |
| † Electronic supplementary information (ESI) available. See DOI: 10.1039/d1en00422k |
| This journal is © The Royal Society of Chemistry 2021 |