
 Open Access Article
 This Open Access Article is licensed under a Creative Commons Attribution-Non Commercial 3.0 Unported Licence
Nanoplastic sizes and numbers: quantification by single particle tracking†
Robert
Molenaar
 a,
Swarupa
Chatterjee
ab,
Bjorn
Kamphuis
a,
Ine M. J.
Segers-Nolten
a,
Mireille M. A. E.
Claessens
*a and
Christian
Blum
*a
a,
Swarupa
Chatterjee
ab,
Bjorn
Kamphuis
a,
Ine M. J.
Segers-Nolten
a,
Mireille M. A. E.
Claessens
*a and
Christian
Blum
*a
aNanobiophysics (NBP), MESA+ Institute for Nanotechnology and Technical Medical Centre, Faculty of Science and Technology, University of Twente, PO Box 217, 7500 AE Enschede, The Netherlands. E-mail: m.m.a.e.claessens@utwente.nl; c.blum@utwente.nl
bWetsus, European Centre of Excellence for Sustainable Water Technology, Oostergoweg 9, 8911MA, Leeuwarden, The Netherlands
First published on 17th February 2021
Abstract
Plastic particles have been found almost everywhere in the environment, in oceans, terrestrial water bodies, sediments and air. The extent of this unwanted contamination is difficult to fully capture. Existing quantification methods focus on the detection of millimeter to micrometer sized plastic particles, while plastic breakdown processes continue to smaller, nanometer sized, particles. For these nanoplastics, methods that are inexpensive and can be (semi-) automated for high throughput analysis of dilute nanoplastic particle suspensions, are lacking. Here we combine sensitive fluorescence video microscopy, NileRed staining of plastic particles, and single particle tracking (SPT) to count and size nanoplastics. With this approach we show that particle diameters as low as 45 nm can be quantified, mixing ratios of differently sized particles can be recovered, and number concentrations as low as 2 × 10⁶ particles per ml can be determined. These results indicate that this approach is promising for quantifying the sizes and concentrations of nanoplastics released from consumer and medical plastics and potentially in environmental samples.
Environmental significanceThe worlds' ecosystems are polluted with plastic particles. The extent of this plastic contamination is still not fully captured. Little is known about the prevalence of very small plastic particles, with diameters smaller than 1 μm (nanoplastics), because these particles evade detection with commonly used techniques. Quantification of both the size and concentration of nanoplastics in water is required for risk assessment since decrease in size is suspected to increase nanoplastic toxicity. We present an experimental strategy of low complexity to directly determine sizes and concentrations of nanoplastics in water samples without, or with limited, additional concentration steps. The sizes and concentrations that can be directly quantified using our strategy are in, or close to, the range expected in environmental samples. |
Introduction
The pollution of water with plastic particles is recognized as a major environmental problem. The sources of plastic particles are manifold; plastic particles are e.g. used as additives in products like cosmetics and result from the breakdown of plastic waste. These particles pose a potential danger to the environment and to human health.1 For small organisms, specifically algae and crustaceans, ingestion of plastic particles has been shown to decrease the consumption of carbon biomass.2 In larger organisms toxicity due to the leakage of plasticizers, plastic additives, and hazardous sequestered compounds has been extensively discussed.3–6Currently investigations into the abundance of plastic particles in the environment and in the food chain focus on microplastics, rather large particles in the size range from millimeters to some tens of micrometers. These particles are easy to detect and quantify using visual inspection and simple microscopy and spectroscopy techniques. However, the plastic breakdown process does not stop at particles of tens of micrometers, plastics are broken down into ever smaller particles down to nanometer sizes. Such very small plastic particles are called nanoplastics. However, the exact definition of a nanoplastic is still under debate. Here we will follow the definition by Gigault et al., who define nanoplastics as unintentionally produced particles in the size range from 1 to 1000 nm that show colloidal behaviour.7 Considering the increase in the number of particles upon break down, the even larger total surface area of nanoplastics, and their proven ability to enter cells,8–10 nanoplastics may bear an even larger risk to the environment than microplastics. Risk assessment of exposure to nanoplastics is a major challenge. It has been put forward that not the mass concentration but the number concentration is the ecologically relevant metric to quantify exposure and assess risk.3 However, reliably detecting and quantifying particle number concentrations of plastics less than a micrometer in size is still difficult. Currently there is no method available that is inexpensive, builds on existing techniques and can be (semi-) automated for high throughput analysis of dilute nanoplastic particle suspensions.
Dynamic light scattering (DLS) is a widely available and commonly used technique to determine the size of nanoparticles, it however requires high concentrations or particles with high scattering cross-sections. Since DLS relies on scattering it is unspecific and cannot discriminate between plastics and (in)organic material. Additionally the ability of DLS to resolve sizes in mixtures of particles with different diameters is limited. Single particle tracking (SPT) is a well-established method to quantify (nano)particle concentrations and size distributions.11 SPT experiments that rely on scattering, e.g. nanoparticle tracking analysis (NTA) by NanoSight, can access lower particle concentrations and give better results for polydisperse samples, however particle detection remains unspecific.12
To unequivocally chemically identify plastic particles XPS, FTIR, nano-IR and Raman spectroscopy have been proven invaluable.13 These techniques are very effective in identifying plastics but require high end instrumentation and expertise. Although less specific, plastic staining with the fluorophore NileRed is an established method to detect microplastics using fluorescence microscopy.14,15 In aqueous solution NileRed shows little fluorescence, but after adsorbance to hydrophobic surfaces, including plastics, it becomes strongly fluorescent.16 After staining the number of NileRed stained plastic particles can be counted in fluorescence microscopy images.17,18 The particle size can be directly determined from the fluorescent area the particles cover in these images. For small particles, approaching the optical diffraction limit, contrast can still be created by fluorescence staining, but due to the diffraction limit the particle sizes can no longer be directly determined from images. For samples containing other, non-plastic, hydrophobic surfaces NileRed staining may give rise to false positive counts. For such samples, pre-analytical steps including separation techniques and removal strategies are necessary. Some of these are already available,14,17–19 but further developments may be necessary.
Here we show that the reported staining of plastics with NileRed can be combined with sensitive fluorescence video microscopy and SPT to determine particle diameters as low as 45 nm, to recover mixing ratios of differently sized particles, and to quantify concentrations as low as 2 × 10⁶ particles per ml. These results indicate that the presented strategy is promising for the quantification of sizes and concentrations of nanoplastics in environmental samples.
Materials and methods
Plastic particles
Polystyrene (PS) beads with a nominal diameter of 400 nm, 200 nm, 100 nm and 40 nm were obtained from Duke Scientific (particles 3400A, 3200A, 3100A, and 3040A). The purchased particle suspensions contained 1% solids. Additionally plastic particles were obtained by grinding a commercially available disposable PS plastic cup into a powder using a commercial kitchen mixer (Kenwood Chef). This powder was suspended in water, the suspension was filtered over a polycarbonate filter with a cut-off of 0.45 μm (Pall Life Science). The filtrate was used in the experiments described.Fluorescence staining of plastic particles
In aqueous solution NileRed shows little fluorescence but after adsorbance to hydrophobic surfaces, including plastics, it becomes strongly fluorescent.16 To stain the plastic particles we made use of this property. We prepared a NileRed stock solution of 0.7 mg NileRed per ml methanol (Uvasol, Merck). Both the filtrate from the plastic powder suspension and the purchased PS beads were incubated with the methanolic NileRed solution; 10 μL of nanoplastics stock solution was added in 140 μl the NileRed stock solution and incubated for a at least 2 hours. The obtained suspensions of NileRed stained plastic particles were diluted with milliQ water to obtain the desired concentrations. For imaging, all samples were transferred to a chamber consisting of two coverslips (Marienfeld, #1.5H 22 × 22 mm) separated by an O-ring. Control samples, containing no plastic particles but the same amount of NileRed were prepared and analysed in parallel. For these control samples we did not observe any signal that could result in false positives in the particle samples.Release of nanoparticles from disposable polystyrene cup
We filled a disposable PS plastic cup with 150 ml demineralized water of 95 °C and left it standing for 5 minutes. We filtered out larger particles and limited the investigations to particles <1 μm using a filter (Whatman, PTFE membrane 1 μm pore size). 5 μl of 3.1 mM methanolic NileRed solution was added to 1 ml of the filtered particle solution. A control sample was prepared in the same way in a glass vial.Fluorescence microscopy setup
Particle counting and tracking experiments were performed on a custom built setup.20 In short: an inverted microscope (Nikon TE-2000U) was equipped with a custom in-coupling for a multimode 520 nm 1.2 W laser diode (Laserland, A-G1000F-C). Through the microscope backport excitation light was focused on the objective's back focal plane (Nikon, CFI PlanApo 60× NA1.2 Wi). The microscope filter cube contained an excitation filter to remove any wavelength above 520 nm from the laser source (Semrock, FF01-513/13-25). A dichroic mirror (Semrock FF538-FDi01) was used to spectrally separate the excitation from the emitted light. The emission was additionally filtered by a long-pass filter that blocks light below 561 nm (Semrock, BLP02-561R-25). The fluorescence was registered by a camera (Basler, acA2440-75um) fitted with a 0.52× camera adapter to match the diffraction limited spot size with the 2 × 2 binned pixel size. The illuminated area was determined to be approximately 40 × 100 μm with a maximum power density of 4.5 kW cm−2. The excitation illumination was synchronized to a 5 ms exposure time at framerates of 35 or 100 frames per s. Videos were recorded with a custom written LabView program.Data analysis
There are several tools available to locate, count and follow objects in videos. These tools are mostly based on the widely-used Crocker–Grier algorithm.21 Here we selected Trackpy22 a well-documented Python implementation of the Crocker–Grier particle tracking algorithm, to count and locate the fluorescently labelled plastic particles in time. To exclude false positives, e.g. from noise or (far) out of focus signal, an intensity threshold was used and the identified particles were required to be present for a least 3 consecutive frames for counting and 5 or more frames for tracking.Dynamic light scattering measurements
Dynamic light scattering (DLS) experiments were performed on a custom built instrument. In this instrument a coherent light beam of λ = 660 nm with a power of 50 mW (Cobolt Flamenco) was expanded 3× and focused by a 400 mm lens into a measuring cuvette (Hellma 101-QS) containing the particle suspension. Scattered light was detected at a θ = 90° angle. The scattered light was directed in to a pinhole via a lens and detected on a single photon detector (Perkin Elmer, SPCM-AQR-13). Photon counts were processed by a multi-tau hardware correlator (correlator.com, FLEX02-08D). A custom written LabView program was used to control the experiment and to determine the decay rate of the correlation function and hence the diffusion coefficient. The particle diameter was subsequently calculated via the Stokes–Einstein equation.Raman spectroscopy
Samples for Raman analysis were concentrated approximately 1000 times using a SpeedVac system. A small volume of the concentrated sample was deposited on a glass slide and allowed to dry. Demineralized water was used as a control and underwent the same concentration and drying procedure. Raman spectra were measured on a confocal Raman microscope using a UHTS300 spectrometer with 600 lines per mm grating (WITec Alpha300R, Germany) and a cooled CCD detector (DU970P-BV, Andor Technology, Northern Ireland). A 532 nm laser beam (WITec, Germany) at 27 mW power was focused on the sample using a 100×/NA 0.9 objective and spectra were recorded with 30 seconds integration time.Results
We aim at the detection and quantification of nanoplastics that appear in the environment as they are released from consumer products, from plastic breakdown processes and through commercially used particle additives. To produce a test sample of nanoplastic particles derived from a much used commercial plastic product we mechanically ground a disposable PS cup. The obtained plastic dust was subsequently suspended in water and filtered through a membrane with a pore size of 0.45 μm to obtain a suspension of plastic particles in the desired size range. The suspension of NileRed stained plastic particles obtained from the plastic cup is shown in Fig. 1a. The plastic particles are visible as fluorescent spots with different intensities. As expected no large differences in particle size are visible since, after filtering, the size approaches the optical diffraction limit. We thus confirm that NileRed staining combined with sensitive fluorescence microscopy methods allows for imaging particles with diameters equal or smaller than 0.45 μm.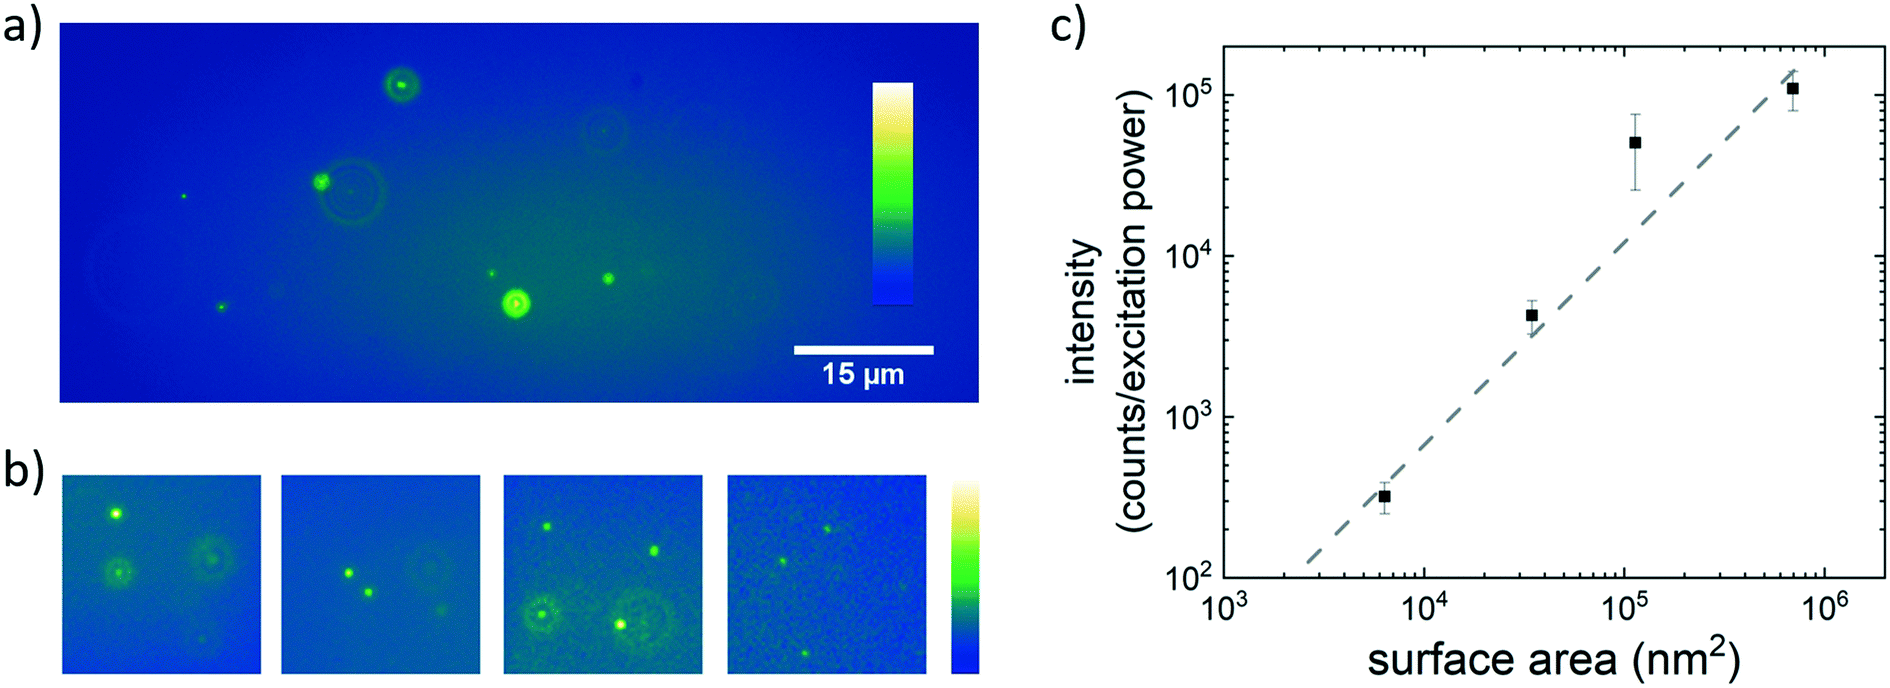 | ||
| Fig. 1 a) Wide field image of NileRed stained nanoplastics obtained from grinding a disposable PS cup. Plastic particles are visible as fluorescent spots of varying intensity. Both bright fluorescent spots originating from particles in the focal plane and contributions from out of plane fluorescence are visible. b) Images of NileRed stained spherical PS model particles with nominal diameters of 400 nm, 200 nm, 100 nm and 40 nm (left to right), field of view is 14 × 14 μm. Note: the experimental settings were adjusted to account for the difference in brightness of the particles. c) Mean fluorescence intensity as a function of particle surface area. The NileRed emission intensity per excitation power of the particles scales approximately linear with the particle surface area (dashed grey line represents a linear relation and serves as guide to the eye). | ||
To determine the limit of detection in terms of size and concentration we systematically studied commercially available PS beads. We obtained PS beads with nominal diameters of 400 nm, 200 nm, 100 nm, and 40 nm. Concentrated suspensions of these beads in water were characterized with dynamic light scattering (ESI† Fig. S1). The bead diameters based on hydrodynamic radii were determined to be 470 nm, 190 nm, 105 nm, and 45 nm (rounded to the nearest 5). Considering that we also measure the hydrodynamic particle radius in SPT experiments we will refer to the PS particles as PS470, PS190, PS105 and PS45 beads. All bead suspensions were subsequently incubated with NileRed, diluted to approximately 107 particles per ml, and visualized using fluorescence microscopy (Fig. 1b). In fluorescence microscopy images beads of all sizes are visible as bright spots. The width of the spots approaches the diffraction limit with decreasing bead size. The mean brightness of the spots was found to decrease with decreasing bead size. The mean fluorescence intensity per excitation power was observed to scale approximately linear with the bead surface area (Fig. 1c). The linear relation shown in Fig. 1c confirms that NileRed adsorbs to the surface and does not accumulate inside the particle.
A more robust characterization of particle size is offered by SPT experiments. For all particle sizes the observed brightness is high enough to allow for video microscopy at frame rates up to a 100 frames per second. In the recorded videos the PS beads are observed to undergo Brownian motion. The individual bead trajectories during this Brownian motion can be used to estimate the hydrodynamic radius from the mean square displacement (MSD) using the Stokes–Einstein equation. The obtained diameters of individual beads were accumulated in histograms (Fig. 2).
 | ||
| Fig. 2 a) Size distributions of NileRed stained PS beads determined using SPT. The cumulative probability histograms are colour coded PS470 (red), PS190 (green), PS105 (blue) and PS45 (orange) and represent individual experiments. b) Counted number of PS105 beads per detection volume as a function of the particle concentration. As expected, a linear relation between these two parameters can be observed. Inset: linear representation of the data. | ||
The peak positions in these histograms are found at 470 nm, 215 nm, 110 nm, and 45 nm. These peak positions agree well with the hydrodynamic diameters obtained with DLS. For the larger particles (diameter ≥100 nm) the distributions approximate a normal distribution. For the smallest particle size of 45 nm the distribution approximates a log-normal distribution. The distribution of diameters obtained from the MSD was wide for all samples and the relative full width half maximum value increases with decreasing bead size from 28% (PS470), 41% (PS190), 51% (PS105), to 82% (PS45). The width of the distribution cannot be assigned to bead properties; according to the specifications of the supplier the size distribution of the beads is narrow. The accuracy with which we can determine the hydrodynamic radius is mainly limited by the length of the single particle trajectories. In our experiments the number of data points per single particle trajectory is set by the time the particle stays in the observation volume. Smaller particles diffuse out faster, the obtained diameters are therefore less accurate and the relative size distribution is wider. This is confirmed by simulations which show that narrower size distributions can be obtained by increasing the number of data points per trajectory (ESI† Fig. S2). The simulations also recover the change from a log-normal distribution for short trajectories to a normal distribution for longer trajectories.23 In our experiments obtaining longer trajectories would translate to video microscopy at higher frame rates. However, the increase in frame rate is limited by the photon yield per particle.
To determine the limit of detection in this experimental setting we quantified the number of PS particles in the detection volume. For this quantification we made a dilution series of NileRed stained PS105 beads. These particles are small but still reasonably bright. The detection volume for counting particles is defined by the lateral field of view and the depth in which we can detect and identify a particle. When the occupation of the volume is small, particles do not need to be in focus to reliably quantify particle numbers; even out of focus particles can be included. The detection of single PS beads was tested in a series of decreasing particle concentrations. In Fig. 2b we plotted the average number of PS beads in the detection volume as a function of the particle concentration. The number of fluorescently labelled PS beads decreased linearly with the concentration. We were able to quantify the average number of beads in the detection volume down to number concentrations as low as 2 × 10⁶ particles per ml. The observed linearity between the added and counted number of particles/volume evidences that the quantification of the concentration is reliable and precise. From the slope of the graph (of 2.9 × 10⁻¹¹) presented in Fig. 2b we determine that the detection volume is approximately 29 pl. With the lateral field of view of 4000 μm2 this gives a depth of particle detection of approximately 7.3 μm. The depth of particle detection is in good agreement with expectations for the used instrumentation.
Water samples with plastic contamination are expected to contain plastics of various sizes and therefore different brightness (Fig. 1b and c). To verify that dimmer, small particles can be detected and accurately counted in the presence of the much brighter large particles we prepared a 1![[thin space (1/6-em)]](https://www.rsc.org/images/entities/char_2009.gif) :1 mixture of NileRed stained PS105 and PS470 beads in water. In video microscopy experiments on the mixture, both the PS105 and PS470 can be observed and discriminated based on their fluorescence intensity. The diffusion of both particles can also be followed in time, the size distribution obtained from the MSD of the individual particles is shown in Fig. 3a. In this distribution two peaks, representing the PS470 and PS105 particles, are visible and the correct particle sizes are recovered. The cumulative probability density histogram has an inflection point around 50%. The position of this inflection point evidences that the 1:1 mixing ratio between the S470 and PS105 particles is also recovered. These results confirm that in a wide range, the presence of large, bright particles does not bias the detection and counting of small, less bright particles.
:1 mixture of NileRed stained PS105 and PS470 beads in water. In video microscopy experiments on the mixture, both the PS105 and PS470 can be observed and discriminated based on their fluorescence intensity. The diffusion of both particles can also be followed in time, the size distribution obtained from the MSD of the individual particles is shown in Fig. 3a. In this distribution two peaks, representing the PS470 and PS105 particles, are visible and the correct particle sizes are recovered. The cumulative probability density histogram has an inflection point around 50%. The position of this inflection point evidences that the 1:1 mixing ratio between the S470 and PS105 particles is also recovered. These results confirm that in a wide range, the presence of large, bright particles does not bias the detection and counting of small, less bright particles.
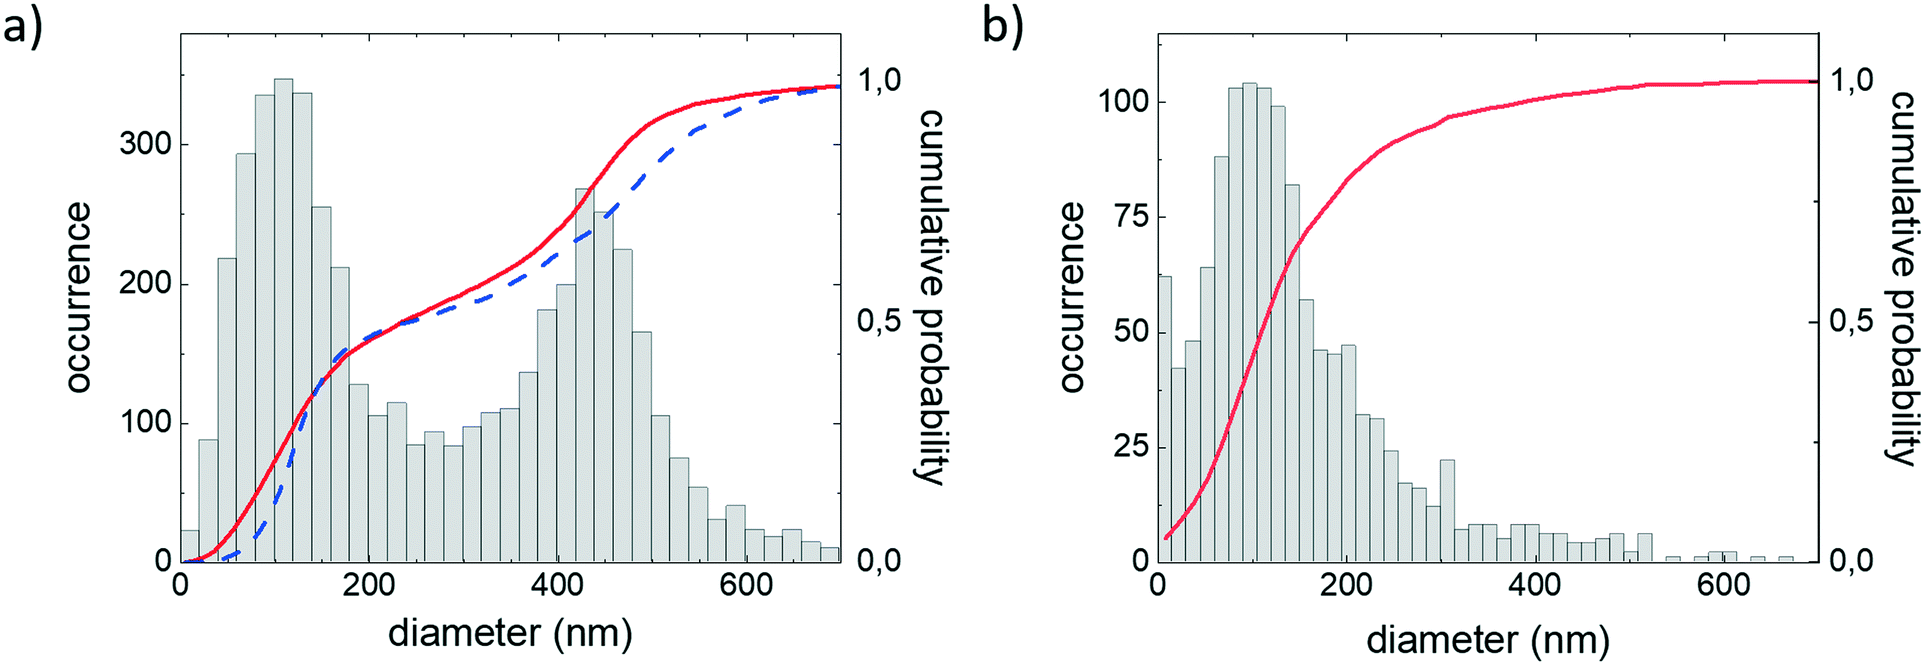 | ||
| Fig. 3 a) Size distribution of a mixture of PS105 and PS470 beads derived from single particle tracking experiments using sensitive video microscopy. Both the 1:1 mixing ratio and the hydrodynamic diameter of the beads of 105 nm and 470 nm are recovered. In the cumulative probability histogram the red line represents the distribution of the particles in the mixture. The blue dashed line is the expected distribution based on the size distribution measured for the individual particles. b) Size distribution of a PS particle suspension obtained by filtering material obtained from grinding a disposable PS cup. Characterization of the PS particle size distribution based on SPT experiments, the cumulative probability is given in red. | ||
After confirming that we can recover the size distribution of mixtures of PS beads we analysed a sample with an unknown size distribution, the suspension of particles derived from grinding a PS cup and filtering using a 0.45 μm cut off filter. The obtained size distribution peaks around a diameter of 110 nm and has a distinct tail toward larger sizes. To confirm that larger particles are really present in the sample and that the observed tail in the size distribution is not an artifact, the selection criteria for data were narrowed by only taking into account long particle trajectories. Using only longer trajectories did not remove the tail in the size distribution (ESI† Fig. S3), which shows that larger particles are indeed present in the sample. To confirm the SPT data obtained on the dilute PS suspension we performed DLS and SEM experiments on a concentrated sample (ESI† Fig. S4). SEM images confirm that the population is dominated by particles with a diameter of approximately 100 nm. The DLS data can be fitted to a single species, with a diameter of approximately 200 nm. Taking into account that scattering is very sensitive to the presence of larger particles, a bias towards larger sizes compared to SPT is not surprising. Both DLS and SEM data confirm the presence of a small population of larger particles.
Recently it was reported that polypropylene baby bottles, when used as advised, leak a large number of micro and nanoplastics into their fluid content.24 The nanoplastic concentrations estimated from AFM images are in the concentration regime accessible with our all optical method. To test if PS plastic cups leak similar concentrations of nanoparticles when used as intended, we filled a plastic cup with demineralized water of 95 °C and left it standing for 5 minutes. We limited the investigations to particles <1 μm using a filter. The sample was stained with NileRed as described in the material and methods. We observe a large number of NileRed stained particles (ESI† Fig. S5a), these particles are not observed for the control samples. Using the particle counting and tracking algorithms we find a concentration of approximately 109 particles per ml. The obtained size distribution peaks around a diameter of 160 nm and has a distinct tail toward larger sizes (ESI† Fig. S5b). Raman spectroscopy experiments on concentrated samples show resemblance to spectra obtained for the cup itself (ESI† Fig. S5c).
Discussion
For the chemically identical spherical model PS particles studied here, the total fluorescence intensity per particle is a good readout for the particle size since the fluorescence intensity of the NileRed stained particles scales with their surface area. However, it is known that the adsorbance of NileRed to less hydrophobic polymers results in weaker fluorescence.17 For unknown mixtures of chemically different plastics, fluorescence intensity is therefore not a suitable readout. Instead of quantifying fluorescence intensity as a measure for size we determined the hydrodynamic radius of the particles from their diffusion in SPT experiments. We demonstrated that SPT of NileRed stained PS beads accurately recovers particle diameters down to 45 nm. Even smaller particles diffuse faster and give lower fluorescence signal. For these small particles the residence time in the detection volume and the amount of photons detected limit the accuracy of this method.The single particle detection method is not only suitable to determine the size of individual plastic particles, but the presented method can also be used to directly determine particle concentrations. In the current setup we determined particle concentrations as low as 2 × 10⁶ particles per ml by single particle counting. The accessible range of particle concentrations is in good agreement with our earlier work on counting labelled viruses.20 It is possible to access lower concentrations with the outlined single particle tracking and counting strategies. Note that at the lowest concentrations the average number of particles in the detection volume is <1 (Fig. 3). This implies that to accurately determine the concentration a large number of frames, of which most do not contain particles, needs to be taken into account. Lower concentrations can be determined by including more frames in the analysis. A more practical solution to sample more volume per time is to actively refresh the detection volume by introducing flow.
To determine particle number concentrations and the distribution of particle sizes the obtained SPT data may need to be analysed using different criteria. The accuracy with which the size of individual particles can be determined depends on the recorded trajectory length. Longer trajectories result in better statistics in the MSD of the particle and therefore in a more accurate size determination. By excluding very short trajectories the accuracy of the size determination increases but not all particles in the volume are included in the size distribution. Since diffusion is slower for larger particles the presence of larger particles can be verified by only including longer trajectories in the analysis. Small particles diffuse faster and the recorded trajectory lengths are therefore typically shorter. As a result smaller particle sizes may become underrepresented in size distributions if only long trajectories are taken into account. However, we show that using our experimental settings and selection criteria, mixing ratios can be accurately determined for suspensions containing particles as small as 105 nm.
To determine the number concentration all particles in the detection volume need to be counted. To reliably identify particles they have to be bright. For less bright particles discrimination from the background can be problematic, in that case the presence of particles in more than one consecutive frame can serve as an additional particle identifier. To maximize the volume in which particles can be identified, and thus gain access to lower concentrations, both in, and to a certain extend out of focus fluorescence signal, is taken into account. To correctly identify particles by their dimmer out of focus fluorescence, their presence in three consecutive frames is therefore required as an additional particle identifier. Summarizing, recovering both the particles size distribution and the particle number concentration is possible but not trivial and may, depending on the sample, require separate optimization steps in data recording and analysis.
Ideally, a nanoplastic quantification method is directly applicable to contaminated water samples, without further concentration or purification steps. For direct determination of the nanoplastic concentration using our approach the absence of hydrophobic non-plastic contaminants is desirable. Samples of interest in which nanoplastic concentrations can be directly determined include tap water, bottled water and particles released from plastic containers for liquids. Note that the presented method does not provide information on the chemical nature of the particles. It will most likely be necessary to concentrate the samples before chemical identification by e.g. Raman spectroscopy.
Research aimed at the quantification of plastic particles so far mainly focussed on counting microplastics. For untreated drinking water and bottled water larger, micron sized plastics concentrations in the order of 2000 particles per l in the size range 1–10 μm have been reported.25 A mass-conserving breakdown of the microplastics into 80 nm particles would thus result a concentration of 106 particles per ml. We have shown that this upper limit to the concentration and this particle size can be detected in our experiments. However, in the environment, instead of the power 3 relation between particle size and abundance expected for mass conserving breakdown empirical studies report power law dependencies between 1.6 and 2.7.26,27 The deviation from the power 3 dependence may be a result of size dependent removal processes, lower dimensional breakdown, new particle input of larger sizes27 or the absence of robust micro and nanoplastic counting strategies. Recently, plastic baby bottles were observed to release nano and microplastics in high concentrations using a laborious optical microscopy and atomic force microscopy based counting strategy.24 The estimated concentrations of nanoparticles were in the range that is easily accessible with our fast all optical method. We demonstrated that similar concentrations of PS nanoparticles are released into hot water containing single use plastic cups. This example demonstrates that our method can be readily applied to investigate release of plastic particles.
In summary, we demonstrated that we can quantify the number concentration and sizes of nanosized plastic particles based on sensitive fluorescence video microscopy. The nanoplastics were fluorescently stained using NileRed, a method established for detecting microplastics. We sampled nanoplastic concentrations as low as 2 × 10⁶ particles per ml, and outline that detecting even lower concentrations is possible with moderate increase of experimental complexity. Based on tracking the diffusion of single particles we determined particle sizes down to 45 nm and were able to recover the mixing ratios of differently sized nanoplastics. We foresee that the presented strategy will open new possibilities to monitor the size and concentration of nanoplastics released from consumer and medical plastics and of nanoplastics in environmental samples.
Conflicts of interest
There are no conflicts of interest to declare.Acknowledgements
This work was performed in the cooperation framework of Wetsus, European Centre of Excellence for Sustainable Water Technology (www.wetsus.eu). Wetsus is co-funded by the Dutch Ministry of Economic Affairs and Ministry of Infrastructure and Environment, the European Union Regional Development Fund, the province of Fryslân, and the Northern Netherlands Provinces. This research has received funding from the European Union's Horizon 2020 research and innovation program under the Marie Skłodowska-Curie grant agreement no 665874. The authors like to thank the participants of the research theme “Virus control” for the fruitful discussions and their financial support. The authors thank Sybren Worm and Wouter van Dijk for their help with initial proof of principle experiments.References
- R. Lehner, C. Weder, A. Petri-Fink and B. Rothen-Rutishauser, Emergence of Nanoplastic in the Environment and Possible Impact on Human Health, Environ. Sci. Technol., 2019, 53, 1748–1765 CrossRef CAS.
- E. Besseling, B. Wang, M. Lurling and A. A. Koelmans, Nanoplastic Affects Growth of S. obliquus and Reproduction of D. magna, Environ. Sci. Technol., 2014, 48, 12336–12343 CrossRef CAS.
- A. A. Koelmans, E. Besseling, E. Foekema, M. Kooi, S. Mintenig, B. C. Ossendorp, P. E. Redondo-Hasselerharm, A. Verschoor, A. P. van Wezel and M. Scheffer, Risks of Plastic Debris: Unravelling Fact, Opinion, Perception, and Belief, Environ. Sci. Technol., 2017, 51, 11513–11519 CrossRef CAS.
- A. Bakir, I. A. O'Connor, S. J. Rowland, A. J. Hendriks and R. C. Thompson, Relative importance of microplastics as a pathway for the transfer of hydrophobic organic chemicals to marine life, Environ. Pollut., 2016, 219, 56–65 CrossRef CAS.
- R. Lohmann, Microplastics are not important for the cycling and bioaccumulation of organic pollutants in the oceans but should microplastics be considered POPs themselves?, Integr. Environ. Assess. Manage., 2017, 13, 460–465 CrossRef CAS.
- L. Bradney, H. Wijesekara, K. N. Palansooriya, N. Obadamudalige, N. S. Bolan, Y. S. Ok, J. Rinklebe, K. H. Kim and M. B. Kirkham, Particulate plastics as a vector for toxic trace-element uptake by aquatic and terrestrial organisms and human health risk, Environ. Int., 2019, 131, 18 CrossRef.
- J. Gigault, A. ter Halle, M. Baudrimont, P. Y. Pascal, F. Gauffre, T. L. Phi, H. El Hadri, B. Grassl and S. Reynaud, Current opinion: What is a nanoplastic?, Environ. Pollut., 2018, 235, 1030–1034 CrossRef CAS.
- D. Bochicchio, E. Panizon, L. Monticelli and G. Rossi, Interaction of hydrophobic polymers with model lipid bilayers, Sci. Rep., 2017, 7, 9 CrossRef.
- M. Forte, G. Iachetta, M. Tussellino, R. Carotenuto, M. Prisco, M. De Falco, V. Laforgia and S. Valiante, Polystyrene nanoparticles internalization in human gastric adenocarcinoma cells, Toxicol. In Vitro, 2016, 31, 126–136 CrossRef CAS.
- A. P. Walczak, E. Kramer, P. J. M. Hendriksen, P. Tromp, J. Helsper, M. van der Zande, I. Rietjens and H. Bouwmeester, Translocation of differently sized and charged polystyrene nanoparticles in in vitro intestinal cell models of increasing complexity, Nanotoxicology, 2015, 9, 453–461 CrossRef CAS.
- I. Gonzalez-Dominguez, E. Puente-Massaguer, L. Cervera and F. Godia, Quality Assessment of Virus-Like Particles at Single Particle Level: A Comparative Study, Viruses, 2020, 12, 24 CrossRef.
- V. Filipe, A. Hawe and W. Jiskoot, Critical Evaluation of Nanoparticle Tracking Analysis (NTA) by NanoSight for the Measurement of Nanoparticles and Protein Aggregates, Pharm. Res., 2010, 27, 796–810 CrossRef CAS.
- W. Fu, J. Min, W. Jiang, Y. Li and W. Zhang, Separation, characterization and identification of microplastics and nanoplastics in the environment, Sci. Total Environ., 2020, 721, 137561 CrossRef CAS.
- G. Erni-Cassola, M. I. Gibson, R. C. Thompson and J. A. Christie-Oleza, Lost, but Found with Nile Red: A Novel Method for Detecting and Quantifying Small Microplastics (1 mm to 20 mu m) in Environmental Samples, Environ. Sci. Technol., 2017, 51, 13641–13648 CrossRef CAS.
- T. Stanton, M. Johnson, P. Nathanail, R. L. Gomes, T. Needham and A. Burson, Exploring the Efficacy of Nile Red in Microplastic Quantification: A Costaining Approach, Environ. Sci. Technol. Lett., 2019, 6, 606–611 CrossRef CAS.
- A. Y. Freidzon, A. A. Safonov, A. A. Bagaturyants and M. V. Alfimov, Solvatofluorochromism and twisted intramolecular charge-transfer state of the nile red dye, Int. J. Quantum Chem., 2012, 112, 3059–3067 CrossRef CAS.
- T. Maes, R. Jessop, N. Wellner, K. Haupt and A. G. Mayes, A rapid-screening approach to detect and quantify microplastics based on fluorescent tagging with Nile Red, Sci. Rep., 2017, 7, 44501 CrossRef CAS.
- M. Tamminga, E. Hengstmann and E. K. Fischer, Nile Red Staining as a Subsidiary Method for Microplastic Quantification: A Comparison of Three Solvents and Factors Influencing Application Reliability, SDRP Journal of Earth Sciences & Environmental Studies., 2016, 2, 165–172 Search PubMed.
- V. C. Shruti, F. Pérez-Guevara, I. Elizalde-Martínez and G. Kutralam-Muniasamy, Toward a unified framework for investigating micro(nano)plastics in packaged beverages intended for human consumption, Environ. Pollut., 2021, 268, 115811 CrossRef CAS.
- S. Chatterjee, R. Molenaar, L. Tromp, R. M. Wagterveld, H. D. W. Roeskink, J. J. L. M. Cornelissen, M. M. A. E. Claessens and C. Blum, Optimizing fluorophore density for single virus counting: a photophysical approach, Methods Appl. Fluoresc., 2021, 9, 025001 CrossRef.
- J. C. Crocker and D. G. Grier, Methods of digital video microscopy for colloidal studies, J. Colloid Interface Sci., 1996, 179, 298–310 CrossRef CAS.
- Trackpy v0.4.1, DOI:10.5281/zenodo.1226458.
- H. Saveyn, B. De Baets, O. Thas, P. Hole, J. Smith and P. Van der Meeren, Accurate particle size distribution determination by nanoparticle tracking analysis based on 2-D Brownian dynamics simulation, J. Colloid Interface Sci., 2010, 352, 593–600 CrossRef CAS.
- D. Li, Y. Shi, L. Yang, L. Xiao, D. K. Kehoe, Y. K. Gun'ko, J. J. Boland and J. J. Wang, Microplastic release from the degradation of polypropylene feeding bottles during infant formula preparation, Nat. Food, 2020, 1, 746–754 CrossRef.
- M. Pivokonsky, L. Cermakova, K. Novotna, P. Peer, T. Cajthaml and V. Janda, Occurrence of microplastics in raw and treated drinking water, Sci. Total Environ., 2018, 643, 1644–1651 CrossRef CAS.
- M. Kooi and A. A. Koelmans, Simplifying Microplastic via Continuous Probability Distributions for Size, Shape, and Density, Environ. Sci. Technol. Lett., 2019, 6, 551–557 CrossRef CAS.
- R. Lenz, K. Enders and T. G. Nielsen, Microplastic exposure studies should be environmentally realistic, Proc. Natl. Acad. Sci. U. S. A., 2016, 113, E4121–E4122 CrossRef CAS.
Footnote |
| † Electronic supplementary information (ESI) available. See DOI: 10.1039/d0en00951b |
| This journal is © The Royal Society of Chemistry 2021 |