
The sinking behavior of micro–nano particulate matter for bisphenol analogues in the surface water of an ecological demonstration zone, China†
Yuanfei
Cai
ab,
Jinghua
Ren
c,
Zijian
You
a,
Jianchao
Liu
 *a,
Guanghua
Lu
a,
Yiping
Li
a and
Junfeng
Li
d
*a,
Guanghua
Lu
a,
Yiping
Li
a and
Junfeng
Li
d
aKey Laboratory of Integrated Regulation and Resources Development, College of Environment, Hohai University, Nanjing 210098, China. E-mail: jianchao-liu@hhu.edu.cn
bWanjiang University of Technology, Ma'anshan 243031, China
cTechnology Innovation Center of Ecological Monitoring & Restoration Project on Land (arable), MNR Geological Survey of Jiangsu Province, China
dCollege of Water Conservancy and Architecture Engineering, Shihezi University, Shihezi 832000, Xinjiang, China
First published on 2nd November 2020
Abstract
Bisphenol analogues (BPs) have been widely used in industrial production as substitutes of bisphenol A (BPA). The demand and production of BPs are growing rapidly in China. In this study, the pollution levels and distribution characteristics of five BPs were investigated in surface water from rivers located in different land-use types of an ecological demonstration zone. All BPs were detected at least once in the traditionally dissolved phase, colloidal phase and suspended particulate matter (SPM) with the mean total concentrations of 465.1 ng L−1, 114.4 ng L−1 and 11.3 μg g−1 dry weight, respectively. BPA is the dominant BP in the traditionally dissolved phase and colloidal phase, with the mean contribution rates of 77.6% and 70.7%, respectively, followed by bisphenol F (BPF) and/or bisphenol S (BPS). The colloids as the important sinks of contaminants contributed 42.3% of bisphenol Z, 37.3% of BPF, 24.9% of BPA, 22.3% of BPAF and 18.4% of BPS in the traditionally dissolved phase. However, BPA alternatives are found primarily in the SPM, in which the contribution rate of BPA ranges from 0.6% to 48.1%, with the mean contribution of 12.4%. Based on BP concentrations in the traditionally dissolved phase, moderate ecological risk levels of BPA and BPF towards aquatic organisms were posed. Fish and/or algae are the most sensitive aquatic organisms, and hence chronic toxicological effects should not be ignored especially in fish.
Environmental significanceRecently, there is an increasing concern over bisphenol analogues (BPs) as an endocrine-disrupting chemical and their possible effects on human health. In this study, the sinking behavior of micro–nano particulate matter including colloids and suspended particulate matter (SPM) for bisphenol analogues in the surface water of an ecological demonstration zone, China, were investigated. Colloids and SPM showed significant binding capacity for BPs, which could regulate and control the environmental behaviors of BPs, including migration, transformation, degradation and bioavailability. Based on the current levels of BPs, low to moderate risk was existing in the ecological demonstration area. |
1. Introduction
Bisphenol A [2,2-bis(4-hydroxyphenyl)propane; BPA] is one of the most widely used synthetic compounds. Numerous ecotoxicological studies reported that BPA induced adverse effects on aquatic organisms and revealed weak estrogenic activity by binding to the estrogen receptors.1 At present, stricter regulations on the production and application of BPA have been accepted in the European Union, USA, China etc.2 As concerns about BPA security continue to grow, other bisphenol analogues (BPs) such as bisphenol F (4,4′-dihydroxydiphenylmethane; BPF), bisphenol S (4,4′-sulfonyldiphenol; BPS) and bisphenol AF (4,4′-(hexafluoroisopropylidene)diphenol; BPAF) are gradually replacing BPA in the manufacture of epoxy resins and coatings for various applications, such as lacquers, varnishes, liners, adhesives, plastics, water pipes, industrial floors, road and bridge deck toppings, dental sealants, and food packaging materials.3 In recent years, the production and consumption of BPF and BPS has been growing in numerous countries.4 Due to similar structural and physicochemical properties, it can be hypothesized that BPs might exhibit similar toxicological profile as BPA.5Elevated detection frequencies and concentrations of BPF, BPS and BPAF have been reported in aquatic environment. For example, elevated detection frequencies and concentrations of various BPs have been found in Taihu Lake, where the mean concentration was from 16.28 to 389 ng L−1 from September of 2013 to November of 2016.6–8 BPF, BPS and BPAF are the most abundant BPs in surface water from Japan, Korea and China.9 The concentrations of BPF in the Tamagawa River of Japan and the Han River of Korea were 2.85 μg L−1 and 1.30 μg L−1, respectively, while the concentrations of BPS in the Adyar River in India9 and BPAF in the Xitang River in Jiaxing, China10 were as high as 7.20 μg L−1 and 1.53 μg L−1, respectively. A number of researches showed that BPs were detected in water, sediment, soil, biomass and air.11,12
In aquatic environment, micro–nano particles could significantly affect the behaviors and fates of BPs via interface mechanisms involving adsorption, complexation and precipitation. A previous study found that BPA in suspended particulate matter (SPM) of influent ranged from <LOQ to 4730 ng g−1 dw.13 BPF adsorbed by SPM in the tail water accounted for 76.8% of total BPF emissions, which was much higher than BPA (0.4%), BPS (15.3%) and BPAF (41.0%).14 Due to small sizes and large specific surface area, colloids were important carriers for a variety of contaminants of which the adsorption capacity was 2–4 orders of magnitude higher than that of suspended particulate matter.15–17 Its contribution rate to various environmental hormones such as BPA was between 0% and 72% in traditionally dissolved phase.15,17,18 Seven BPs were investigated in the colloidal phases with mean concentrations in the range of 5.84–76.6 ng L−1, contributing to 9.5–50.4% of BPs in the traditionally dissolved phase.15 Such strong chemical–colloid interactions may provide a long-term storage of chemicals, increase their persistence in the environment, control their occurrence, environmental behavior and bioavailability.12,19,20 Therefore, systematically studying the distribution characteristics of BPs in surface water is of great significance for understanding the state of water pollution and its behavior in aquatic environment.
A National Ecological Demonstration Area of Jiangsu Province located between the Yangtze River Delta and Lixiahe Plain was selected. The rivers and lakes in this territory belong to the two major river–lake systems of the Yangtze River and the Huaihe River. We aimed at investigating the occurrence and spatial distribution of five BPs in the colloidal phase, the truly dissolved phase and SPM of the surface water, with a view to assess the environmental risks of BPs.
2. Materials and methods
2.1. Standards and reagents
Pure standards of the target compounds, namely BPA, BPF, BPS, bisphenol Z (BPZ) and BPAF, were purchased from J&K Chemical Ltd. (Shanghai, China). Methanol, acetone and formic acid were obtained from Merck (Darmstadt, Germany).2.2. Sample collection and pretreatment
According to the land-use type, a total of 33 sampling sites were selected in seven regions, including aquiculture area (S1 and S2 sites), wetland park (S3–S5 sites), agricultural area (S6–S10 sites), mixed agricultural and residential area (S11–S19), residential area (S20–S24), industrial area (S25–S29) and urban area (S30–S33) (Fig. 1 and Table S1†). According to the technical specifications of surface water monitoring,21 water samples (2 L) were collected from all sampling sites in triplicate in August 2018. Once transported to the laboratory in a cooler with dry ice, water samples were filtered through pre-baked (4 h, 450 °C) glass fibre filters (1.0 μm), and then the SPM were collected on glass fiber filters. Colloids defined as particles between 1 kDa and 1 μm were isolated from filtrates (<1 μm) via the cross-flow ultrafiltration technique using a Millipore 1 kDa of polyether sulfone ultrafiltration membrane. Moreover, the two phases were prepared for extraction after the isolation. | ||
| Fig. 1 Study area and sampling sites of surface water from the Jiangyan District. | ||
2.3. Sample treatment and analyses
With a solid-phase extraction (SPE) system using HLB cartridges (500 mg, 6 mL, Waters) preconditioned with 6 mL methanol and 6 mL formic acid solution with pH = 3, the extraction of BPs from the truly dissolved phase and colloidal phase was performed. The two phases were pre-acidified with 1 mol L−1 formic acid to pH = 5; subsequently, samples were passed through the HLB cartridges at a flow rate of 5 mL min−1. Then, HLB cartridges were rinsed with 6 mL of methanol/water (30![[thin space (1/6-em)]](https://www.rsc.org/images/entities/char_2009.gif) :70, v/v) and 6 mL of water to eliminate interferences. The analytes were eluted using 9 mL of methanol with 2% ammonia. After evaporating to dryness under a mild nitrogen airstream, the extracts were reconstituted with 1 mL methanol.
:70, v/v) and 6 mL of water to eliminate interferences. The analytes were eluted using 9 mL of methanol with 2% ammonia. After evaporating to dryness under a mild nitrogen airstream, the extracts were reconstituted with 1 mL methanol.
The SPM samples were extracted with a 10 mL methanol/acetone mixture (1:1, v/v) by ultrasonication for 30 min, and then centrifuged at 4000 g for 10 min. The supernatant was transferred into a flask. The extraction was repeated twice, and the combined supernatants were concentrated to 1 mL, and then diluted to 100 mL using ultrapure water for further cleanup by SPE. The procedures were same as water samples.
The BPs were analyzed by a Waters Acquity UPLC-MS/MS system with an electrospray ionization source (ESI) in negative ionization modes. An Acquity UPLC BEH-C18 column (100 mm × 1.7 μm × 2.1 mm; Waters, USA) was employed and maintained at 40 °C. The flow rate was 0.3 mL min−1, and the injection volume was 5 μL. Multiple response monitoring (MRM) mode was used to identify and quantify BPs. Detailed analytical procedures are provided in the ESI, Tables S2, S3 and Fig. S1.†
2.4. Quality assurance and quality control
Concentrations of BPs were quantified via the matrix-matching external standard method. Moreover, the sensitivity of this method was evaluated via the limit of detection (LOD) and limit of quantitation (LOQ). The LODs and LOQs of the BPs in the traditionally dissolved phase were 0.50–6.63 ng L−1 and 1.70–20.74 ng L−1, respectively (Table S4†). The calibration curves showed good linearity in a concentration range of 1–200 ng mL−1 (R2 > 0.998). The recoveries of BPs were determined by spiking 10 and 100 ng mixed standard into 1 L water samples (or 1 g sediment). The recoveries were in the range of 70.5–122.7% and 79.3–108.0% for the water samples and SPM samples, respectively, and the relative standard deviations were <20%. Detailed information is given in the ESI.† All target compounds in the solvent blank, membrane blank and procedure blank were below the LODs.2.5. Parameter measurement and statistical analysis
According to the technical guidance of EU on the environmental risk assessment, the risk quotient (RQ) method is used to assess the environmental risk of Jiangyan District.22 We calculated the estrogen equivalent (EEQ) concentrations based on detected concentrations of BPs and a known estrogen equivalency factor (EEF).23 Detailed information is given in the ESI.†3. Results and discussion
3.1. Occurrence of BPs in the traditionally dissolved phase
The BP concentration in the traditionally dissolved phase of surface water, including mean, median and min–max values are presented in Table 1. Five BPs were all detected in the study area, with detection frequencies of 9.1–100%. As shown in Fig. 2, total concentrations of BPs in the traditionally dissolved phase were from 53.0 ng L−1 to 947.8 ng L−1 (mean concentration 465.1 ng L−1). BPA is the predominant BP, with the mean concentration of 371.5 ng L−1, followed by BPF (42.9 ng L−1), BPS (37.1 ng L−1), BPAF (13.2 ng L−1) and BPZ (0.4 ng L−1).| Compounds | Traditionally dissolved phase (ng L−1) | Colloidal phase (ng L−1) | ||||||
|---|---|---|---|---|---|---|---|---|
| Mean | Median | Range | DFa (%) | Mean | Median | Range | DF (%) | |
| a DF: detection frequency. | ||||||||
| BPA | 371.5 ± 217.7 | 379.0 | 19.0–702.0 | 100 | 93.2 ± 106.7 | 47.0 | 1.3–459.3 | 100 |
| BPF | 42.9 ± 62.9 | 14.0 | 0.0–270.6 | 78.8 | 17.1 ± 32.9 | 4.6 | 0.0–163.4 | 78.8 |
| BPS | 37.1 ± 20.3 | 34.8 | 3.4–83.5 | 100 | 6.1 ± 6.1 | 3.6 | 0.1–25.0 | 100 |
| BPZ | 0.4 ± 1.5 | 0.0 | 0.0–3.4 | 9.1 | 0.2 ± 0.9 | 0.0 | 0.0–5.4 | 9.1 |
| BPAF | 13.2 ± 9.2 | 12.3 | 2.1–48.0 | 100 | 2.7 ± 3.3 | 1.9 | 0.1–16.0 | 100 |
 | ||
| Fig. 2 Concentrations and composition of BPs in the traditionally phase of surface water. | ||
Spatially, the highest concentration of BPs was found in the residential area, with the mean total concentration of 657.5 ng L−1, followed by urban area (627.0 ng L−1), mixed agricultural and residential area (524.8 ng L−1), industrial area (517.5 ng L−1), aquiculture area (463.3 ng L−1), wetland park (290.3 ng L−1) and agricultural area (88.7 ng L−1). The compositional profiles of BPs in the traditionally dissolved phase of all sampling sites were similar, where BPA was the predominant BP, with the mean contribution of 77.6%, followed by BPS (10.3%), BPF (7.6%) and BPAF (4.4%). Similar results were also found in an ecological demonstration of China, where BPA, BPS and BPF are the predominant BPs, with contribution rates of 81.8%, 12.5% and 4.7%, respectively.19
Hitherto, scores of papers have reported the information on the environmental occurrence of BPs in the traditionally dissolved phase. The pollution investigations are mainly in China, India, Japan and Korea. Among them, six papers investigated the pollution levels of BPs in Taihu Lake basin, China (Table 2), and the results showed that the total concentrations of BPs (except BPA) are increasing year by year. The composition of BPs in our study was similar to that from Taihu Lake basin investigated in 2018. In the Yangtze River Basin, BPA was also the predominant BP, with the mean concentrations of 217–372 ng L−1, while BPF was the main monomer composition in the Pearl River basin (China), the Han River (Korea), and the Tamagawa River (Japan), with the mean concentrations of 733, 633 and 1740 ng L−1, respectively. The total concentration of primary BPs, including BPA, BPS and BPF in the study area (mean concentration: 451.5 ng L−1) is similar to that in Taihu Lake investigated in 2016 (mean concentration: 357 ng L−1), but clearly higher than those from the Taihu Lake (mean concentration: 15.3 ng L−1) and Liaohe River (mean concentration: 61 ng L−1) investigated in 2013, and clearly lower than those from the Pearl River (981 ng L−1), Tokyo Bay (706.5 ng L−1) and Cooum River (1191 ng L−1) investigated in 2013.
| Sampling locations | Time | Concentrations | References | ||||
|---|---|---|---|---|---|---|---|
| BPA | BPS | BPF | BPAF | BPZ | |||
| a Year (month). b ND: not detected. | |||||||
| Taihu Lake | 2013(09)a | 8.5(7.9) | 6.0(2.0) | 0.83(0.5) | 0.28(0.2) | ND | 7 |
| 4.2–14 | 0.28–67 | ND–5.6 | 0.13–1.1 | ||||
| Taihu Lake | 2015(11) | 92.6 (53.2) | — | — | — | — | 24 |
| 28–565 | |||||||
| Taihu Lake | 2015(11) | 86(45) | 101(17) | 114(15) | 7.8(7.7) | 4.0(3.4) | 25 |
| 27–565 | 4.5–1569 | ND–1634 | 0.71–23 | ND–17 | |||
| Taihu Lake | 2016(04) | 97(40) | 120(16) | 140(18) | 8.2(7.7) | 3.9(3.5) | 8 |
| 28–560 | 4.5–1600 | ND–1600 | 0.7–23 | ND–17 | |||
| Taihu Lake | 2016(11) | 25.7(23.8) | 15.9(6.6) | 78(30) | 114(111) | — | 26 |
| 19.4–68.5 | 4.1–157 | 25.6–723 | 110–140 | ||||
| Taihu Lake | 2018(08) | 217(157) | 61(32) | 7.1(4.6) | 2.7(2.1) | — | 19 |
| 73–678 | 8–319 | 1.1–40 | 0.3–17.7 | ||||
| Luoma Lake | 2016(04) | 86(77) | 21(18) | 6.8(6) | 17(13) | 7.7(3.65) | 8 |
| 49–110 | ND–94 | 3.5–14 | 12–84 | 2.7–45 | |||
| Liaohe River | 2013(09) | 47(29) | 14(8.9) | NDb | 1.9(1.0) | 0.054(ND) | 7 |
| 5.9–141 | 0.22–52 | 0.5–9.6 | ND–0.70 | ||||
| Hunhe River | 2013(09) | 40(42) | 11(8.4) | ND | 2.4(0.94) | ND | 7 |
| 4.4–107 | 0.61–46 | 0.61–11 | |||||
| Pearl River | 2017(12) | 31.45(24.6) | 16.62(10.3) | 55.03(35.0) | 0.83(0.70) | — | 27 |
| 9.48–173 | 1.6–59.8 | 2.37–282 | 0.40–3.59 | ||||
| Pearl River | 2013(07)–2014(03) | 73(73) | 135(135) | 773(757) | ND | — | 9 |
| ND–98 | ND–135 | 448–1110 | |||||
| West River | 43(43) | ND | 64(64) | ND | — | ||
| ND–43 | ND–105 | ||||||
| Yangtze River | 2015(03) | — | 1.39(0.98) | — | — | — | 28 |
| 0.18–14.9 | |||||||
| 20 source water China | 2017(11) | 12.8(10.5) | 1.1(0.4) | 2.2(ND) | 3.0(0.1) | — | 29 |
| ND–34.9 | ND–5.2 | ND–12.6 | ND–10.8 | ||||
| Edogawa River (Japan) | 2013(07)–2014(03) | 14(15) | 3.4(2.8) | 340(316) | — | — | 9 |
| 6.5–21 | 2.7–47 | 259–445 | |||||
| Tamagawa River (Japan) | 48(13) | 4.7(3.9) | 1740(2290) | — | — | ||
| 11–120 | 1.5–8.7 | 90–2850 | |||||
| Tokyo Bay (Japan) | 325(325) | 8.5(7.8) | 373(171) | — | — | ||
| ND–431 | ND–15 | ND–1470 | |||||
| Han River (Korea) | 141(144) | 41(41) | 633(555) | — | — | ||
| 4.6–272 | ND–42 | 121–1300 | |||||
| Nakdong River (Korea) | 40(39) | ND | ND | — | — | ||
| 1.0–80 | |||||||
| Cooum River (India) | 423(391) | 768(30) | ND | — | — | ||
| 264–628 | 15–3640 | ||||||
3.2. Role of the colloids in the colloidal phase
Colloids, as an important adsorption carrier, can affect the bioavailability, distribution, and fate of BPs in aquatic environment. As shown in Table 1, BPA, BPS and BPAF in the colloids were widely detected with the detection frequencies of 100%, followed by BPF (78.8%) and BPZ (9.1%). The total concentrations of BPs in study area were from 4.0 ng L−1 to 483.0 ng L−1. Among the five BPs, BPA was still the primary BP, which ranged from 1.3 ng L−1 to 459.3 ng L−1, followed by BPF (0.0–163.4 ng L−1) and BPS (0.1–25.0 ng L−1), with the mean contribution of 70.7%, 12.6% and 8.0% in the total concentrations of BPs (Fig. 3). | ||
| Fig. 3 Concentrations and composition of BPs in the colloidal phase of surface water. | ||
Spatially, the highest concentration of BPs was found in the urban area, with the mean total concentration of 244.9 ng L−1, followed by industrial area (163.6 ng L−1), mixed agricultural and residential area (136.8 ng L−1), residential area (103.8 ng L−1), wetland park (60.8 ng L−1), aquiculture area (31.3 ng L−1) and agricultural area (28.9 ng L−1). The pollution characteristic is similar to those in the soluble phase, and the pollution levels were higher in the densely populated area than those in the agricultural area. In the traditionally dissolved phase, the binding ability of BPs to colloids showed obvious differences. Overall, the adsorption proportions of colloids to each BP ranged from 0.8% to 89.4% in the traditionally dissolved phase (Fig. 4). BPZ showed the highest adsorption potential, with the mean adsorption proportions of 42.3%, followed by BPF (37.3%), BPA (24.9%), BPAF (22.3%) and BPS (18.4%). Similar results were also found in previous study, where it was found that colloids act as a clear sink for BPF and BPAF (BPZ was non-detected), and it showed lower adsorption potential for BPS.19 The high adsorption proportion of BP has clear positive correlation with its hydrophobic property. In addition, colloids play an important role for some emerging contaminants in aquatic environment, such as pharmaceuticals and oestrogenic chemicals,15,16 and could further alter and control their environmental behavior.15
 | ||
| Fig. 4 Contribution rates of the colloidal phase to the total BPs in the traditionally phase of surface water. | ||
3.3. Occurrence of BPs in the suspended particulate matter
SPM is ubiquitous and distributed in all aquatic environments, and is important in terms of its effect on the sorption of organic pollutants.30 BPA, BPF, BPS and BPAF were found in the SPM from all sampling sites (Fig. 5), and BPZ was detected in more than a third of the sampling sites. The mean total concentrations of BPs ranged from 1.8 μg g−1 to 32.1 μg g−1. However, the monomer distribution of BPs in the SPM was different from that in the soluble phase and colloids, and the BPA substitutes were the predominant BPs, with the mean contribution rate of 87.6%. Among them, BPS showed the highest concentration, ranging from 1.0 μg g−1 to 28.9 μg g−1 (mean concentration: 7.1 μg g−1), followed by BPAF (1.45 μg g−1), BPZ (1.35 μg g−1) and BPF (1.14 μg g−1), which were clearly higher than those in urban river of Nanjing (47.5–353 ng g−1)31 and Pearl River estuary (3.30–343 ng g−1),27 China. In the SPM samples of Yangtze River, BPA was detected with the concentration of 51.8 μg g−1,26 which was obviously higher than that in our study (mean: 1.05 μg g−1). | ||
| Fig. 5 Concentrations and composition of BPs in the SPM of surface water. | ||
Spatially, in contrast to the soluble and colloidal phases, the agriculture area showed higher pollution levels, where the mean total concentrations of BPs (27.2 μg g−1) were 2.5–4.5 times higher than that in other study area, and the lowest pollution levels of BPs were found in the urban area (mean: 6.0 μg g−1). Meanwhile, the mean contribution of BPA to the total BPs (2.0%) in the agriculture area was much lower than that in other study area, and the contribution rates of BPS, BPF and BPAF reached 73.4%, 13.0% and 11.4%, respectively. The higher pollution levels of BPs may be related to the SPM characteristic in the aquiculture area. Similar results were also found in the Taihu Lake basin, where the total concentrations of alkylphenols, BPA, and tetrabromobisphenol A (TBBPA) in SPM samples ranged from not detected to 129.13 μg g−1 dw, with the TBBPA being the predominant contaminant owing to the moderately high octanol/water partitioning (logKow = 7.20).24
3.4. Distribution characteristics of BPs among different compartments
To assess the adsorption potential of the particulate matter in surface water, the proportion adsorption contribution of SPM and colloids of BPs were calculated, as shown in Fig. 6. Spatially, the adsorption contribution of SPM in the surface water of agriculture-related area was much higher than that in other study areas when the mean contribution rate of SPM in the surface water reached more than 80%. On average, 97% of BPZ, 89.6% of BPS, 84.0% of BPAF, 55.4% of BPF and 2.1% of BPA were found in the SPM. The sum of the adsorption of SPM and colloids to BPZ, BPS, BPAF and BPF ranged from 73.2% to 98.5%, which were clearly higher than BPA (26.7%), suggesting that these particulate matters were potential sinks for BPA substitutes, which could change and control the environmental behavior of these compounds as a result of their surface structure and migration characteristics in an aquatic environment. In a previous study, correlations between the sorption and soil properties of BPA, BPS and BPAF were evaluated, suggesting that the soil organic carbon (OC) content and pH were sufficient to describe sorption reasonably with the sorption of BPA and BPAF increased with increasing %OC, while the pH-dependent partitioning of BPs was exemplified for BPS.32 The reduced sorption of BPA and BPS has been observed at a high pH value on sediment and soil. However, for some BPs, additional sorption mechanisms other than just simple hydrophobic-type partitioning appears evidently, such as pH-dependent speciation, further mechanistic sorption studies are needed to improve environmental fate predictions of BPs.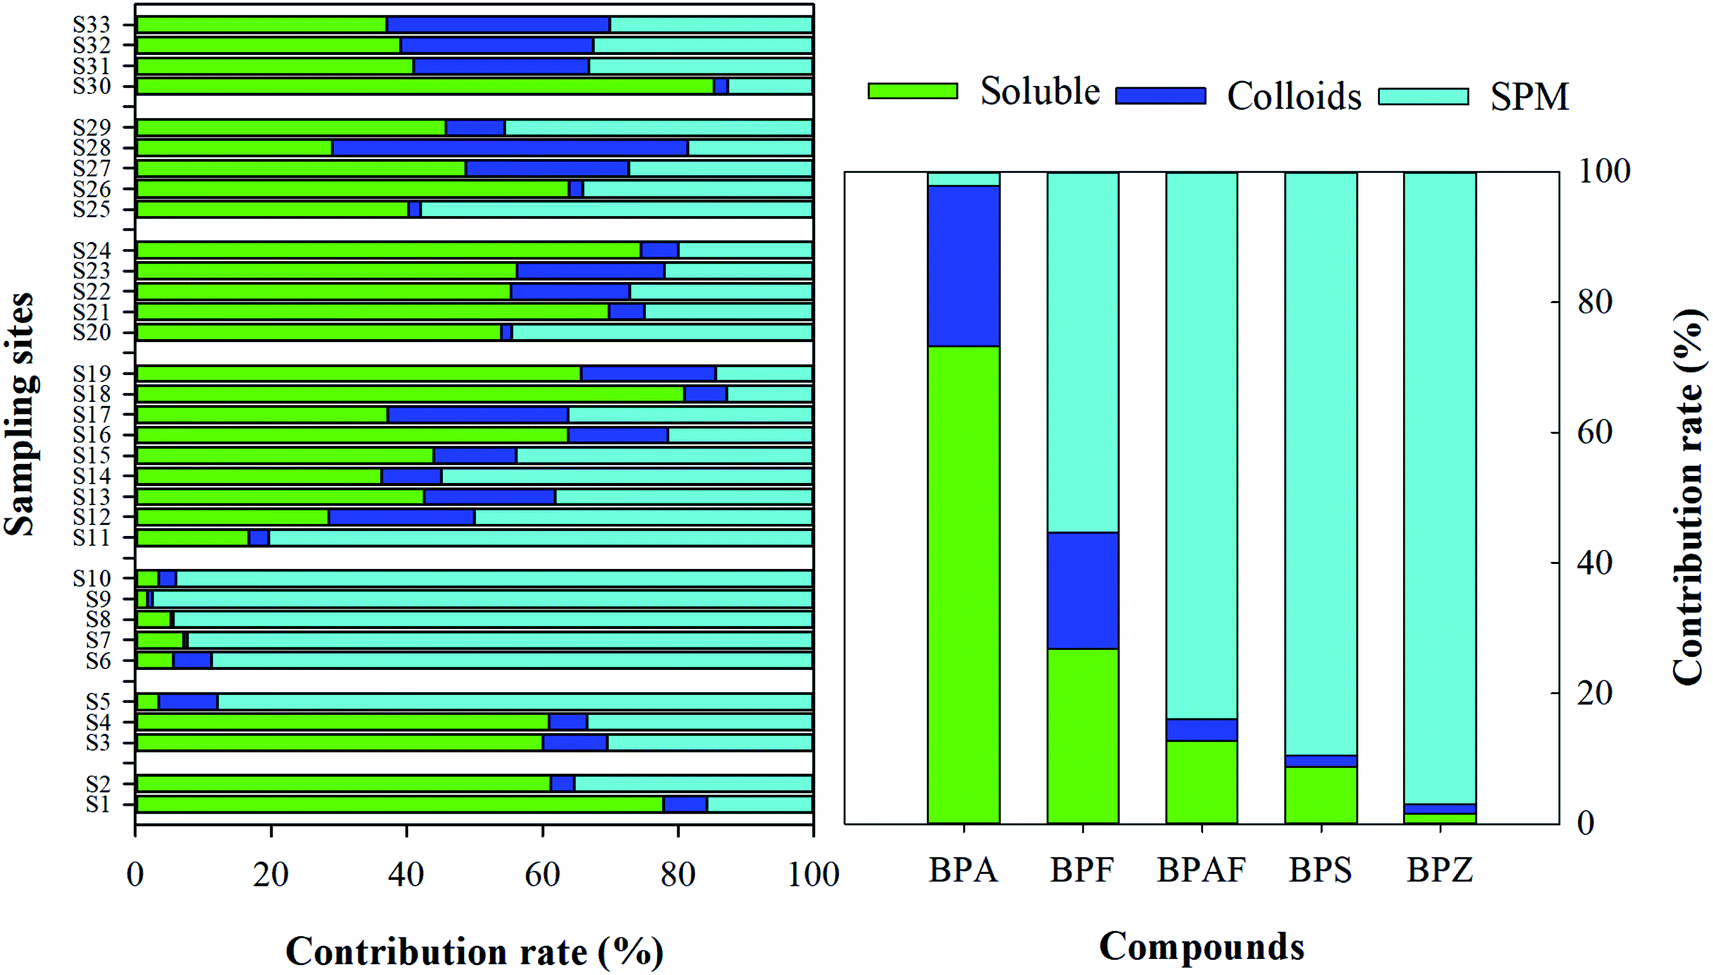 | ||
| Fig. 6 The phase distribution of BPs in the soluble phase, colloidal phase and SPM of surface water. | ||
3.5. Evaluation of ecological risks
Due to the similar molecular structure and action patterns of BPs, their co-existence in the aquatic environment may cause the effect of combined toxicity. To understand the worst-case scenario, the total RQ of BPs was calculated, as shown in Fig. 6. The total RQ of mixture (RQTotal) ranged from 0.02 to 0.33 for algae, from 0.01 to 0.19 for daphnids, and from 0.02 to 0.43 for fish, indicating that fish/algae are the most sensitive aquatic organism, followed by daphnids, which were similar with results in urban rivers of Nanjing city, where the RQTotal of BPs to fish as the most sensitive species ranged from 0.03 to 0.41.31 The contribution rate of each BP for RQTotal follows the order: BPA (65.8–93.5%) > BPF (1.1–24.9%) > BPAF (2.4–9.2%) > BPS (0.2–3.0%), which is not consistent with the contribution rate of each BP, indicating that BPAF can cause higher biotoxicity.
 | ||
| Fig. 7 RQTotal for aquatic organisms (A) and E2EQ (B) of BPs in the surface water. | ||
4. Conclusions
In this study, the existence and distribution of five BPs in the traditionally dissolved phase, colloidal phase and SPM phase of surface water were investigated in an ecological demonstration area of Jiangsu Province, China. In the study area, BPA, BPF, BPS and BPAF were widely detected, with the detection rates of >78.8%. Spatially, the residential area showed higher pollution levels of BPs in the traditionally dissolved phase, reaching to 657.5 ng L−1 of mean total concentration, followed by urban area and mixed agricultural and residential area, on the contrary the agricultural area showed the higher pollution levels in the SPM phase, which was 4.5 times higher than that in the urban area. In the surface water, the key contaminant BPA were mainly in the traditionally dissolved phase, followed by colloids and SPM; however, its alternatives mainly existed in the SPM phase, and the adsorption contribution rate of SPM to each BP reached more than 55.4%. In the traditionally dissolved phase, the adsorption proportions of colloids to each BP ranged from 0.8% to 89.4%, and BPZ showed higher adsorption potential (42.3%), followed by BPF (37.3%), indicating that particulate matter was the vital carrier of BPs in the aquatic environment. As the main pollution, BPA posed a medium risk towards aquatic organisms, while as BPA alternative BPF also posed a medium risk towards fish. In view of a shift from BPA to BPA alternatives in the application process and increasing detection frequencies and pollution levels, the regulation and ecological risk assessment of BPs should be given constant attention.Author contributions
Conceptualization, J. L., Y. L., Y. C., and G. L., investigation, Y. C., and Z. Y., writing—original draft preparation, Z. Y., Y. C., and J. L., writing—review & editing, all authors.Conflicts of interest
There are no conflicts to declare.Acknowledgements
This study was supported by the Fundamental Research Funds for the Central Universities (Grant B200202106), China Postdoctoral Science Foundation (Grant 2018M630507 and 2019T120389), the key program of National Natural Science Foundation of China (Grant 52039003).References
- T. Tišler, A. Krel, U. Gerželj, B. Erjavec, M. S. Dolenc and A. Pintar, Hazard identification and risk characterization of bisphenols A, F and AF to aquatic organisms, Environ. Pollut., 2016, 212, 472–479 CrossRef.
- European Commission, Commission Regulation (EU), No 10/2011 of 14 January 2011 on plastic materials and articles intended to come into contact with food, 2011 Search PubMed.
- S. Zheng, J. C. Shi, J. Y. Hu, W. X. Hu, J. Zhang and B. Shao, Chlorination of bisphenol F and the estrogenic and peroxisome proliferator-activated receptor gamma effects of its disinfection byproducts, Water Res., 2016, 107, 1–10 CrossRef CAS.
- S. Lee, C. Liao, G. J. Song, K. Ra, K. Kannan and H. B. Moon, Emission of bisphenol analogues including bisphenol A and bisphenol F from wastewater treatment plants in Korea, Chemosphere, 2015, 119, 1000–1006 CrossRef CAS.
- K. Hercog, S. Maisanaba, M. Filipič, M. S. Dolenc, L. Kač and B. Žegura, Genotoxic activity of bisphenol A and its analogues bisphenol S, bisphenol F and bisphenol AF and their mixtures in human hepatocellular carcinoma (HepG2) cells, Sci. Total Environ., 2019, 687, 267–276 CrossRef CAS.
- Q. Wang, M. Chen, G. Shan, P. Chen, S. Cui, S. Yi and L. Zhu, Bioaccumulation and biomagnification of emerging bisphenol analogues in aquatic organisms from Taihu Lake, China, Sci. Total Environ., 2017, 598, 814–820 CrossRef CAS.
- H. Jin and L. Zhu, Occurrence and partitioning of bisphenol analogues in water and sediment from Liaohe River Basin and Taihu Lake, China, Water Res., 2016, 103, 343–351 CrossRef CAS.
- Z. Yan, Y. Liu, K. Yan, S. Wu, Z. Han, R. Guo, M. Chen, Q. Yang, S. Zhang and J. Chen, Bisphenol analogues in surface water and sediment from the shallow Chinese freshwater lakes: occurrence, distribution, source apportionment, and ecological and human health risk, Chemosphere, 2017, 184, 318–328 CrossRef CAS.
- E. Yamazaki, N. Yamashita, S. Taniyasu, J. Lam, P. K. Lam, H. B. Moon, Y. Jeong, P. Kannan, H. Achyuthan, N. Munuswamy and K. Kannan, Bisphenol A and other bisphenol analogues including BPS and BPF in surface water samples from Japan, China, Korea and India, Ecotoxicol. Environ. Saf., 2015, 122, 565–572 CrossRef CAS.
- L. Wang, Z. Wang, J. N. Liu, G. X. Ji, L. L. Shi, J. Xu and J. X. Yang, Deriving the freshwater quality criteria of BPA, BPF and BPAF for protecting aquatic life, Ecotoxicol. Environ. Saf., 2018, 164, 713–721 CrossRef CAS.
- A. F. Liu, G. B. Qu, M. Yu, Y. W. Liu, J. B. Shi and G. B. Jiang, Tetrabromobisphenol-A/S and Nine Novel Analogs in Biological Samples from the Chinese Bohai Sea: Implications for Trophic Transfer, Environ. Sci. Technol., 2016, 50, 4203–4211 CrossRef CAS.
- S. J. Song, T. Ruan, T. Wang, R. Z. Liu and G. B. Jiang, Distribution and preliminary exposure assessment of bisphenol AF (BPAF) in various environmental matrices around a manufacturing plant in China, Environ. Sci. Technol., 2012, 46, 13136–13143 CrossRef CAS.
- J. Xue and K. Kannan, Mass flows and removal of eight bisphenol analogs, bisphenol A diglycidyl ether and its derivatives in two wastewater treatment plants in New York State, USA, Sci. Total Environ., 2019, 648, 442–449 CrossRef CAS.
- Q. Sun, Y. Wang, Y. Li, M. Ashfaq, L. Dai, X. Xie and C. P. Yu, Fate and mass balance of bisphenol analogues in wastewater treatment plants in Xiamen City, China, Environ. Pollut., 2017, 225, 542–549 CrossRef CAS.
- C. X. Yan, Y. Yang, J. L. Zhou, M. H. Nie, M. Liu and M. F. Hochella Jr, Selected emerging organic contaminants in the Yangtze Estuary, China: a comprehensive treatment of their association with aquatic colloids, J. Hazard. Mater., 2015, 283, 14–23 CrossRef CAS.
- J. C. Liu, X. X. Dan, G. H. Lu, J. Shen, D. H. Wu and Z. H. Yan, Investigation of pharmaceutically active compounds in an urban receiving water: occurrence, fate and environmental risk assessment, Ecotoxicol. Environ. Saf., 2018, 154, 214–220 CrossRef CAS.
- M. Nie, Y. Yang, M. Liu, C. Yan, H. Shi, W. Dong and J. L. Zhou, Environmental estrogens in a drinking water reservoir area in Shanghai: occurrence, colloidal contribution and risk assessment, Sci. Total Environ., 2014, 487, 785–791 CrossRef CAS.
- J. R. Lead and K. J. Wilkinson, Aquatic colloids and nanoparticles: current knowledge and future trends, Environ. Chem., 2007, 3, 159–171 CrossRef.
- W. Si, Y. F. Cai, J. C. Liu, J. Shen, Q. Chen, C. Chen and L. K. Ning, Investigating the role of colloids on the distribution of bisphenol analogues in surface water from an ecological demonstration area, China, Sci. Total Environ., 2019, 673, 699–707 CrossRef CAS.
- K. Maskaoui and J. L. Zhou, Colloids as a sink for certain pharmaceuticals in the aquatic environment, Environ. Sci. Pollut. Res., 2010, 17, 898–907 CrossRef CAS.
- SEPAC (State Environmental Protection Administration of China), Technical specifications requirements for monitoring of surface water and waste water, 2003 Search PubMed.
- European Commission, Technical Guidance Document on Risk Assessment in support of Commission Directive 93/67/EEC on Risk Assessment for new notified substances, Commission Regulation (EC) No 1488/94 on Risk Assessment for existing substances, and Directive 98/8/EC of the European Parliament and of the Council concerning the placing of biocidal products on the market, 2003 Search PubMed.
- Y. Y. Liu, Y. S. Lin, C. H. Yen, C. L. Miaw, T. C. Chen, M. C. Wu and C. Y. Hsieh, Identification, contribution, and estrogenic activity of potential EDCs in a river receiving concentrated livestock effluent in Southern Taiwan, Sci. Total Environ., 2018, 636, 464–476 CrossRef CAS.
- D. Liu, J. N. Liu, M. Guo, H. Z. Xu, S. H. Zhang, L. L. Shi and C. Yao, Occurrence, distribution, and risk assessment of alkylphenols, bisphenol A, and tetrabromobisphenol A in surface water, suspended particulate matter, and sediment in Taihu Lake and its tributaries, Mar. Pollut. Bull., 2016, 112, 142–150 CrossRef CAS.
- M. H. Chen, M. Guo, H. Z. Xu, D. Liu, J. Cheng, J. Li, S. H. Zhang and L. L. Shi, Distribution Characteristics and Potential Risk of Bisphenol Analogues in Surface Water and Sediments of Lake Taihu, Environ. Sci., 2017, 38, 2793 Search PubMed.
- Y. H. Liu, S. H. Zhang, G. X. Ji, S. M. Wu, R. X. Guo, J. Cheng, Z. Y. Yan and J. Q. Chen, Occurrence, distribution and risk assessment of suspected endocrine-disrupting chemicals in surface water and suspended particulate matter of Yangtze River (Nanjing section), Ecotoxicol. Environ. Saf., 2017, 135, 90–97 CrossRef CAS.
- X. Zhao, W. H. Qiu, Y. Zheng, J. Z. Xiong, C. Z. Gao and S. Y. Hu, Occurrence, distribution, bioaccumulation, and ecological risk of bisphenol analogues, parabens and their metabolites in the Pearl River Estuary, South China, Ecotoxicol. Environ. Saf., 2019, 180, 43–52 CrossRef CAS.
- Y. Wan, W. Xia, S. Yang, X. Pan, Z. He and K. Kannan, Spatial distribution of bisphenol S in surface water and human serum from Yangtze River watershed, China: implications for exposure through drinking water, Chemosphere, 2018, 199, 595–602 CrossRef CAS.
- H. F. Zhang, Y. P. Zhang, J. B. Li and M. Yang, Occurrence and exposure assessment of bisphenol analogues in source water and drinking water in China, Sci. Total Environ., 2019, 655, 607–613 CrossRef CAS.
- M. H. Nie, C. X. Yan, W. B. Dong, M. Liu, J. L. Zhou and Y. Yang, Occurrence, distribution and risk assessment of estrogens in surface water, suspended particulate matter, and sediments of the Yangtze Estuary, Chemosphere, 2015, 127, 109–116 CrossRef CAS.
- C. Y. Zheng, J. C. Liu, J. H. Ren, J. Shen, J. Fan, R. Y. Xi, W. Chen and Q. Chen, Occurrence, Distribution and Ecological Risk of Bisphenol Analogues in the Surface Water from a Water Diversion Project in Nanjing, China, Int. J. Environ. Res. Public Health, 2019, 16, 3296 CrossRef CAS.
- Y. J. Choi and L. S. Lee, Partitioning Behavior of Bisphenol Alternatives BPS and BPAF Compared to BPA, Environ. Sci. Technol., 2017, 51, 3725–3732 CrossRef CAS.
- J. C. Liu, G. H. Lu, Z. X. Xie, Z. H. Zhang, S. Li and Z. H. Yan, Occurrence, bioaccumulation and risk assessment of lipophilic pharmaceutically active compounds in the downstream rivers of sewage treatment plants, Sci. Total Environ., 2015, 511, 54–62 CrossRef CAS.
- M. Y. Song, D. Liang, Y. Liang, M. J. Chen, F. B. Wang, H. L. Wang and G. B. Jiang, Assessing developmental toxicity and estrogenic activity of halogenated bisphenol A on zebrafish (Danio rerio), Chemosphere, 2014, 112, 275–281 CrossRef CAS.
- S. Kitamura, T. Suzuki, S. Sanoh, R. Kohta, N. Jinno, K. Sugihara, S. I. Yoshihara, N. Fujimoto, H. Watanabe and S. Ohta, Comparative study of the endocrine-disrupting activity of bisphenol A and 19 related compounds, Toxicol. Sci., 2005, 84, 249–259 CrossRef CAS.
- Y. H. Liu, S. H. Zhang, N. H. Song, R. X. Guo, M. H. Chen, D. N. Mai, Z. Y. Yan, Z. H. Han and J. Q. Chen, Occurrence, distribution and sources of bisphenol analogues in a shallow Chinese freshwater lake (Taihu Lake): Implications for ecological and human health risk, Sci. Total Environ., 2017, 599, 1090–1098 CrossRef.
Footnote |
| † Electronic supplementary information (ESI) available: Fig. S1. Representative chromatogram of BPs at the concentration of 10 μg L−1. Table S1: geographic information of thirty-one sampling sites. Table S2: mobile phase compositions for the separation methods. Table S3: optimized MS/MS parameters for the five BPs. Table S4: recovery values obtained for the three independent concentrations of spiked quality control samples. Table S5: ecotoxicity data for BPs under study. Table S6: RQ of each BP for algae, daphnids and fish. See DOI: 10.1039/d0em00366b |
| This journal is © The Royal Society of Chemistry 2021 |