
Identifying high-performance and durable methylammonium-free lead halide perovskites via high-throughput synthesis and characterization†
Yu
An
 abc,
Carlo Andrea Riccardo
Perini
b,
Juanita
Hidalgo
b,
Andrés-Felipe
Castro-Méndez
b,
Jacob N.
Vagott
b,
Ruipeng
Li
d,
Wissam A.
Saidi
e,
Shirong
Wang
ac,
Xianggao
Li
*ac and
Juan-Pablo
Correa-Baena
*b
abc,
Carlo Andrea Riccardo
Perini
b,
Juanita
Hidalgo
b,
Andrés-Felipe
Castro-Méndez
b,
Jacob N.
Vagott
b,
Ruipeng
Li
d,
Wissam A.
Saidi
e,
Shirong
Wang
ac,
Xianggao
Li
*ac and
Juan-Pablo
Correa-Baena
*b
aSchool of Chemical Engineering and Technology, Tianjin University, Tianjin, 300072, China. E-mail: lixianggao@tju.edu.cn
bSchool of Materials Science and Engineering, Georgia Institute of Technology, Atlanta, Georgia 30332, USA. E-mail: jpcorrea@gatech.edu
cCollaborative Innovation Center of Chemical Science and Engineering (Tianjin), Tianjin, 300072, China
dNational Synchrotron Light Source II, Brookhaven National Lab, Upton, New York 11973, USA
eDepartment of Mechanical Engineering and Materials Science, University of Pittsburgh, Pittsburgh, PA 15261, USA
First published on 12th November 2021
Abstract
One of the organic components in the perovskite photo-absorber, the methylammonium cation, has been suggested to be a roadblock to the long-term operation of organic–inorganic hybrid perovskite-based solar cells. In this work we systematically explore the crystallographic and optical properties of the compositional space of mixed cation and mixed halide lead perovskites, where formamidinium (FA+) is gradually replaced by cesium (Cs+), and iodide (I−) is substituted by bromide (Br−), i.e., CsyFA1−yPb(BrxI1−x)3. Higher tolerance factors lead to more cubic structures, whereas lower tolerance factors lead to more orthorhombic structures. We find that while some correlation exists between the tolerance factor and structure, the tolerance factor does not provide a holistic understanding of whether or not a perovskite structure will fully form. By screening 26 solar cells with different compositions, our results show that Cs1/6FA5/6PbI3 delivers the highest efficiency and long-term stability among the I-rich compositions. This work sheds light on the fundamental structure–property relationships in the CsyFA1−yPb(BrxI1−x)3 compositional space, providing vital insight to the design of durable perovskite materials. Our approach provides a library of structural and optoelectronic information for this compositional space.
Broader contextMetal halide perovskite solar cells are currently attracting immense interest due to the rapid rise of their solar-to-electric power conversion efficiency, which has risen from 3.8% to 25.5% within the past decade. The latest improvements have been achieved via compositional engineering. Methylammonium iodide (MAI)-free perovskites are promising for their high stability compared with those containing MAI; however, there is very little understanding of the role of phases and structures on all the properties of the materials and devices. Here we present a systematic study on the compositional space of tunable formamidinium/cesium and iodide/bromide perovskites. Employing advanced X-ray scattering techniques with grazing incidence we elucidate the type of structures forming on the perovskites with 49 different compositions. Our findings give new insight into MAI-free materials towards an understanding of the mechanisms that make these perovskites efficient light harvesters and the optimized compositions in perovskite solar cells for long-term durability. |
Introduction
Since they were first reported in 2009 with a power conversion efficiency (PCE) of 3.8%,1 organic–inorganic hybrid perovskites have witnessed unprecedented progress in their efficiency over the decade since then, resulting in the most recent highest certified PCE of 25.5%,2 which is approaching the 33.7% Shockley–Queisser (SQ) limit of single-junction solar cells.3 The large number of constituents that can be fitted into the ABX3 crystal formula provides a relatively broad material space to be explored, where A is a monovalent cation (methylammonium (MA+), formamidinium (FA+), or cesium (Cs+)),4,5 B is a divalent metal cation (typically Pb2+ or Sn2+),6 and X is a halogen anion (Cl−, Br− or I−).7 Due to the tunability of its composition and bandgap, lead halide perovskites hold promise as the top wide-gap absorbers in silicon tandem solar cells or for assembly into pure perovskite tandem cells, enabling higher efficiencies and bypassing the theoretical efficiency limit of single-junction solar cells. In addition, these lead halide perovskite materials accommodate a range of versatile processing methods and a variety of cell structures,5 making halide perovskites a major competitor for low-cost solar energy conversion, whether as stand-alone cells or as top cells in tandem structure.7–10 Thus, understanding the relationship between the compositional variations and changes in the crystal structure and bandgap becomes paramount for the design of optimum materials for different applications.Despite the success of perovskite solar cells (PSCs) in laboratory research, the most pressing issue to be solved before commercialization is their long-term stability, which is limited by a variety of factors, including the chemical decomposition, phase transitions, or phase segregation. The extensively studied MAPbI3 undergoes a phase transition above 57 °C, and decomposes into PbI2 even in an inert atmosphere at 85 °C owing to degassing MA+.11 Mixed I/Br perovskites MAPb(BrxI1−x)3 that enable wider bandgaps suffer from phase segregation into iodide-rich and bromide-rich domains under illumination.12,13 In addition, mixed-halide perovskite compositions are prone to the formation of halide vacancies, which introduce sub-bandgap energy levels14 that act as trap states, fostering non-radiative recombination and limiting the open-circuit voltage (Voc) of the PSCs, thus affecting the device photostability.13,15,16
FAPbI3 and CsPbI3 have higher thermal-decomposition temperatures with respect to MAPbI3, and have emerged as compelling candidates for the commercialization of long-term-operating devices.17,18 FAPbI3 has an optical bandgap of 1.48 eV,19 closer to the theoretical optimal bandgap 1.34 eV3 for a single-junction solar cell than the 1.58 eV value of MAPbI3.19,20 CsPbI3 is promising for application in tandem solar cells and for its inorganic nature, which allows it to tolerate high temperatures without decomposition. Cs+ has a considerably smaller radius (1.67 Å) than MA+ (2.17 Å) and FA+ (2.53 Å),21,22 which results in a bandgap widened to 1.73 eV for CsPbI3.19,23 However, the black perovskite phases α-FAPbI3 or α-CsPbI3, which are suitable for efficient photon absorption and electron transport, are prone to structural instability, spontaneously converting into the undesirable non-photoactive yellow δ-phase in the ambient atmosphere.24–26 Therefore, the main challenge for FAPbI3- and CsPbI3-based solar cells is to stabilize the black α-phase at room temperature.
To boost the thermal and structural stabilities, as well as to inhibit halide segregation, it has been shown that mixing A-site cations in compositional engineering is essential.4,24,27 Introducing small amounts of MA+ in FA+-based compositions enables the formation of the yellow δ-FAPbI3 component to be suppressed due to a stronger interaction via H⋯I–H (hydrogen bonding) or Coulombic interaction between the more polar MA+ and the PbI6 octahedral cage,28 while enabling high PCEs.7,24,29 For mixed-cations with Cs+ and MA+, Niu et al. found that a small addition of Cs+ was responsible for inducing oriented polycrystalline films, leading to reduced series resistance and suppressing the formation of trap states, thus enhancing the PCE.30 Introducing the small inorganic cation Cs+ in FA-based compositions has been shown to adjust the strain in the structure to stabilize the α-FAPbI3.26 The mixed-cation Cs+/FA+ perovskite showed an α phase even at room temperature, which is in contrast to pure FAPbI3 (160 °C) and CsPbI3 (315 °C), as well as excellent phase stability under high temperature or high humidity conditions.8,25,26,31,32 The obtained perovskite α-phase with FA+ and Cs+ is entropically stabilized, stemming from the α-phase of CsPbI3 and FAPbI3, which have similar structural features (corner-sharing PbI6 octahedra) and volumes.33 Furthermore, mixed-cation Cs+/FA+ has been shown to lower the ionic mobility and suppress halide segregation, in contrast to MAPb(BrxI1−x)313 and FAPbIyBr3−y,19,34via enhanced crystallinity to restrain the regions of short-range crystalline order, thus improving the compositional photostability and Voc.7–9,27 Therefore, a mixed-cation Cs+/FA+, i.e., a MA-free composition, is highly desired for long-term operation.
Almost all high-efficiency and phase-stable PSCs are fabricated by simultaneously integrating mixed A-site cations with mixed X-site halogens.4,5,24,35,36 However, a fundamental understanding of the relationship between the composition variations and the structural and optoelectronic properties has not been fully revealed in the CsyFA1−yPb(BrxI1−x)3 compositional space. This work systematically explores the compositional space of CsyFA1−yPb(BrxI1−x)3 perovskites by simultaneously and independently changing the Cs+/FA+ and Br−/I− ratios. Our investigation highlights the structure–property relationships in the CsyFA1−yPb(BrxI1−x)3 compositional space by exploring the optical and crystallographic properties via high-throughput synthesis and characterization. An empirical equation for the CsyFA1−yPb(BrxI1−x)3 bandgap as a function of the composition is quantitatively determined, which contributes to tailoring bandgaps that are suitable for single-junction and tandem applications. The crystal structure and phases in the CsyFA1−yPb(BrxI1−x)3 compositional space are identified qualitatively based on the results from synchrotron-based grazing incidence wide-angle X-ray scattering (GIWAXS). We find that tetragonal, cubic, and unidentified structures can be synthesized with slight compositional changes in I-rich CsyFA1−yPb(BrxI1−x)3 perovskites, resulting in small effects on their electronic response in solar cells. The tetragonal structure, which is Cs1/6FA5/6PbI3, yielded the highest performance, regardless of the annealing temperature (65 °C and 150 °C). The work illustrates the importance of the precise composition of the perovskite for making devices with a high performance and durability, and will help to extend the compositional design of novel MA-free perovskites for various optoelectronic applications.
Results and discussion
A graphical illustration of the CsyFA1−yPb(BrxI1−x)3 composition space explored in this work is shown in Fig. 1A. A full set of 49 perovskite compositions with varying ratios of Cs+/FA+ and Br−/I− was deposited via solution processing. The 49 films were prepared by combining perovskite stock solutions in the appropriate molar ratio to obtain the desired CsyFA1−yPb(BrxI1−x)3 final composition. Four 0.4 M master solutions were prepared (i.e., CsPbI3, FAPbI3, CsPbBr3, and FAPbBr3) in dimethyl sulfoxide (DMSO). The perovskite solution stoichiometries are correlated with the respective sample numbers in Fig. 1A. A mild annealing temperature of 65 °C was selected to retain the perovskite phase of the Cs-rich films (Fig. S1, ESI†).9 Annealing at 65 °C is too low to crystallize the perovskite phase in FA-only films (especially No. 43–46), which, however, have been studied extensively in previous reports.19,29 The 49 perovskite films present markedly different colors across the matrix of variations, as illustrated in the photograph in Fig. 1B. I-rich films are generally dark brown and Br-rich films are progressively more orange, turning to yellow with increasing bromide content. The FAPbI3 film does not show the dark brown color expected for the α phase, as the annealing temperature selected is lower than the phase transition temperature of 160 °C.25 All films (except the pure Cs-based compositions, No. 1–7) annealed at 170 °C were also prepared and are presented in Fig. S1 (ESI†), and it is important to note that these samples degraded within minutes, and thus we excluded these samples from further characterization. Herein, all characterization of the films was performed on perovskites annealed at 65 °C, except when otherwise specified to ensure that all conditions are kept constant in the study.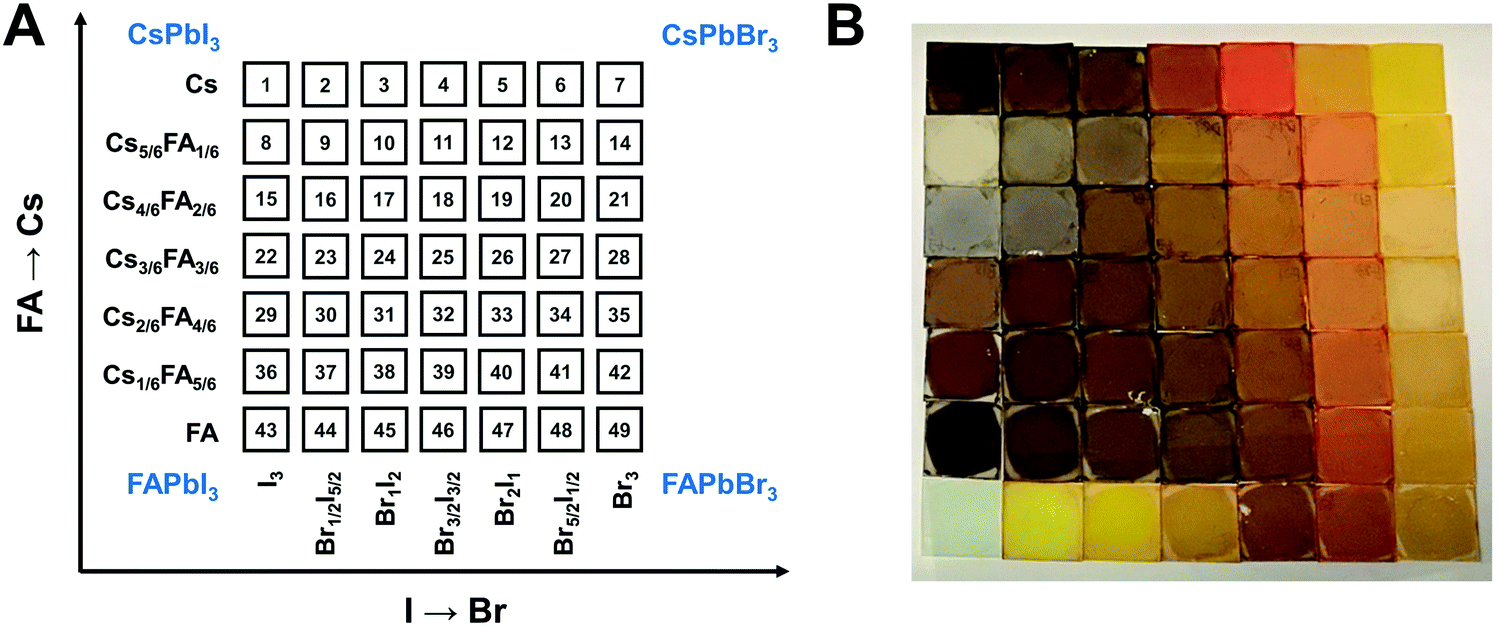 | ||
| Fig. 1 (A) Schematic illustration of the compositional matrix with notations for all the compositions explored. The numbers on the squares represent the key between the perovskite composition and the corresponding sample number. (B) Photograph of the full set of perovskite films arranged in the same order as in the composition matrix of (A). | ||
Crystallographic properties
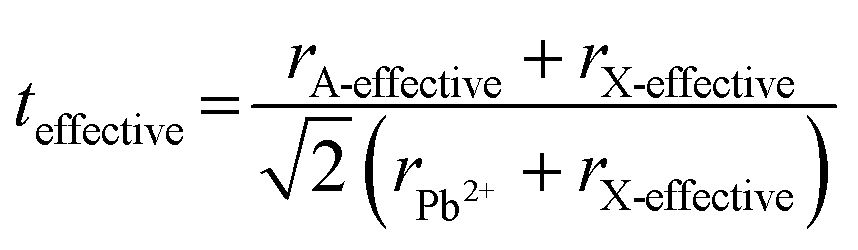
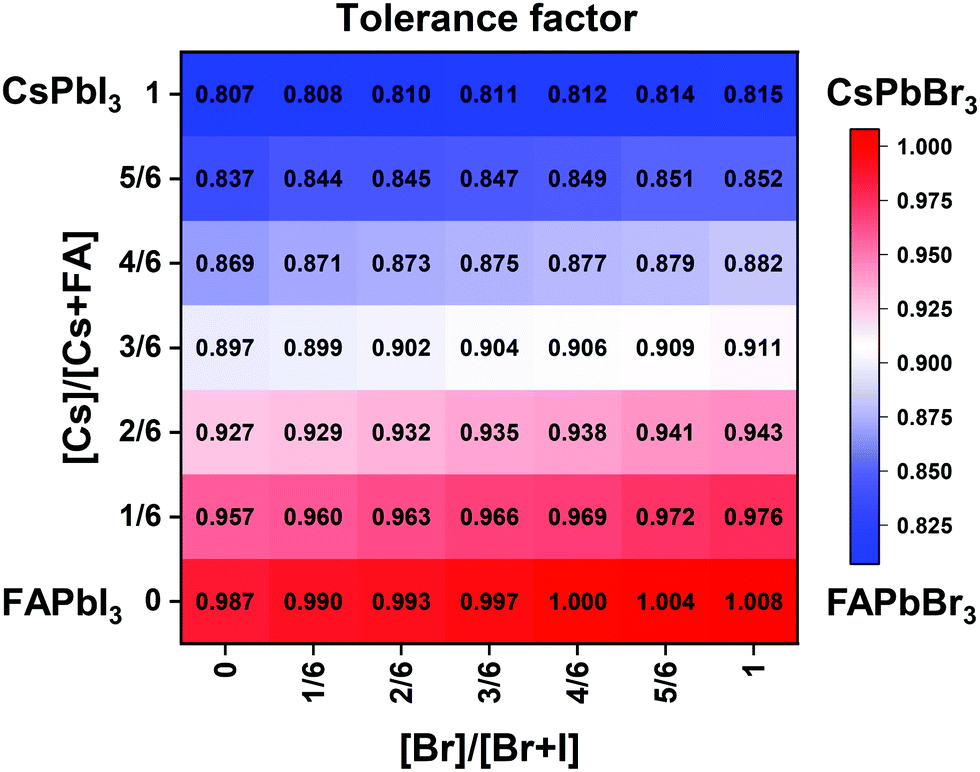
Tuning the Goldschmidt tolerance factor (t) through compositional engineering is a practical approach to tailoring the crystallographic properties and structural stability of perovskite materials.21,26,29 The t value is a reliable empirical index used to predict the structural phase of a perovskite by evaluating its ionic size mismatch. The expression is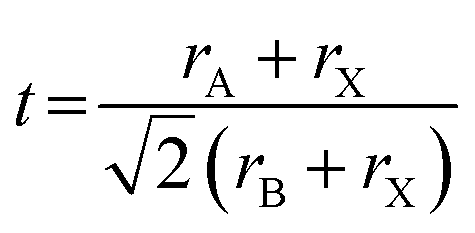 , where rA, rB and rX are the radii of the A cation, B cation, and X anion, respectively. Here, it is widely understood that t equals 1 for a perfect cubic perovskite. Values of t in the range 0.9–1.0 mostly result in cubic perovskites at room temperature. Values of t between 0.8 and 0.9 favor distorted corner-sharing octahedral configurations, which result in perovskite structures of lower symmetry than cubic, e.g., orthorhombic or tetragonal.21,26,29 The t values greater than 1.0, induce a hexagonal non-perovskite structure with face-sharing octahedra. While this is the general understanding in the field, in this study, we attempt to explore, experimentally, the relationship between t and different structures. For a composition such as CsyFA1−yPb(BrxI1−x)3, the weighted average at the A- and X-site of the two different ions is used to define an effective ionic radius26 for computing the tolerance factor.
| rX-effective = xrBr− + (1 − x)rI− |
| rA-effective = yrCs+ + (1 − y)rFA+ |
 | (1) |
 | ||
| Fig. 2 Effective tolerance factor map for the CsxFA1−xPb(BryI1−y)3 compositional space tuned via composition engineering. | ||
To reveal the correlation between the composition and the crystal phase, X-ray diffraction (XRD) and GIWAXS were performed. Perovskite crystals exhibit polymorphism, where different crystal phases can thus be formed depending on the free energy of formation, the preparation conditions, and the temperature. For instance, CsPbI3 has three black photoactive perovskite phases – namely, the α-(cubic), β-(tetragonal), and γ-phases (orthorhombic), and one yellow photoinactive non-perovskite δ-phase (orthorhombic) that is made of edge-sharing PbI6 octahedra, as illustrated in Fig. 3A–D. Similar to CsPbI3, FAPbI3 exhibits two main phases: a black cubic perovskite α-phase and a yellow hexagonal non-perovskite δ-phase with face-sharing 1D PbI6 octahedra (Fig. 3E).38 The α-, β-, and γ-phases are all composed of corner-sharing PbI6 octahedra, but have decreasing crystal symmetry as the distortion of the PbI6 octahedra increases (Fig. 3A–C). The decrease in symmetry is reflected in the peak splitting and the appearance of additional peaks in the XRD pattern (Fig. 3F). As an example, the (100)C reflection at around q = 1.0 Å−1 of the α-phase (Pm![[3 with combining macron]](https://www.rsc.org/images/entities/char_0033_0304.gif) m) in Fig. 3F splits into the (110)T, (001)T reflections and (110)O, (002)O reflections in the β-phase (P
m) in Fig. 3F splits into the (110)T, (001)T reflections and (110)O, (002)O reflections in the β-phase (P![[4 with combining macron]](https://www.rsc.org/images/entities/char_0034_0304.gif) mbm) and γ-phase (Pbnm), respectively.39 Here, the subscript of the crystal plane represents the corresponding crystal phase, i.e., C, T, and O represent cubic, tetragonal and orthorhombic, respectively. It is notable that there is still the same number of splitting peaks when moving from tetragonal to orthorhombic. In addition, the difference in d-spacing among cubic, tetragonal and orthorhombic is usually sufficiently small that the splitting can be difficult to resolve. Hence, it is challenging to identify the crystal phase by means of split peaks, especially for tetragonal and orthorhombic structures. In the β-phase, the (210)T and (211)T reflections appear at around q = 1.6 Å−1 and 1.9 Å−1, respectively, (shown in the red-shaded areas of Fig. 3F), compared with the α-phase that has undistorted PbI6 octahedra. In the γ-phase with a second distortion in the orthorhombic structure, the crystal symmetry is lower and new reflections appears around q = 1.7 Å−1 (shown in the blue-shaded area of Fig. 3F), corresponding to the (211)O, (121)O, (103)O planes. Hence, the characteristic peaks at around q = 1.6 Å−1 and 1.9 Å−1 could be used to distinguish whether the tetragonal phase exists, while the peak around q = 1.7 Å−1 could be used to identify if an orthorhombic phase is present.40–43
mbm) and γ-phase (Pbnm), respectively.39 Here, the subscript of the crystal plane represents the corresponding crystal phase, i.e., C, T, and O represent cubic, tetragonal and orthorhombic, respectively. It is notable that there is still the same number of splitting peaks when moving from tetragonal to orthorhombic. In addition, the difference in d-spacing among cubic, tetragonal and orthorhombic is usually sufficiently small that the splitting can be difficult to resolve. Hence, it is challenging to identify the crystal phase by means of split peaks, especially for tetragonal and orthorhombic structures. In the β-phase, the (210)T and (211)T reflections appear at around q = 1.6 Å−1 and 1.9 Å−1, respectively, (shown in the red-shaded areas of Fig. 3F), compared with the α-phase that has undistorted PbI6 octahedra. In the γ-phase with a second distortion in the orthorhombic structure, the crystal symmetry is lower and new reflections appears around q = 1.7 Å−1 (shown in the blue-shaded area of Fig. 3F), corresponding to the (211)O, (121)O, (103)O planes. Hence, the characteristic peaks at around q = 1.6 Å−1 and 1.9 Å−1 could be used to distinguish whether the tetragonal phase exists, while the peak around q = 1.7 Å−1 could be used to identify if an orthorhombic phase is present.40–43
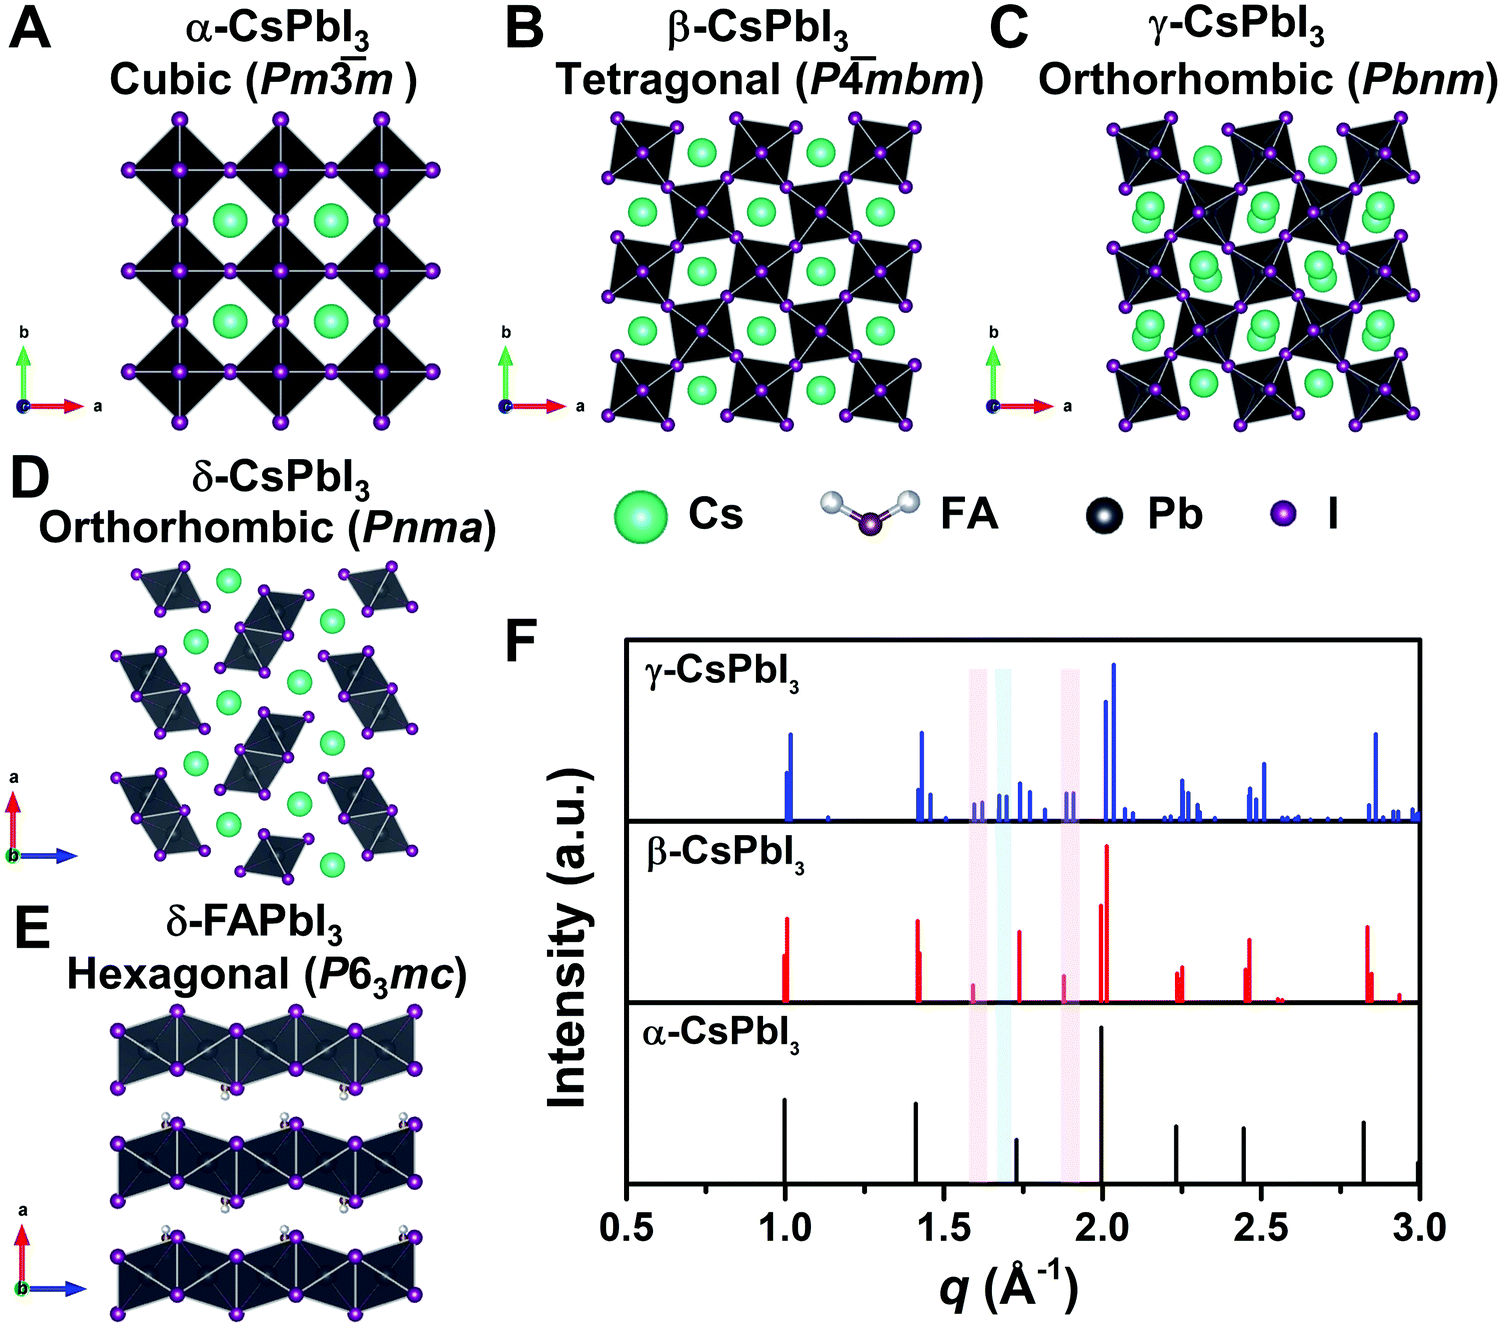 | ||
| Fig. 3 Crystal structure of three perovskite phases with corner-sharing octahedra for CsPbI3, which are cubic α-CsPbI3 (A), tetragonal β-CsPbI3 (B), and orthorhombic γ-CsPbI3 (C). (D) and (E) show the crystal structure of non-perovskite δ-CsPbI3 and δ-FAPbI3, respectively. All the crystal structures in A–E were plotted via Vesta using crystallographic information files extracting from ref. 25, 44 and 45. (F) Simulated powder XRD patterns for the α-, β-, and γ-phases of CsPbI3 plotted with vertical lines corresponding to the diffraction peaks. XRD patterns plotted with respect to the scattering vector q, which is equivalent to 2 × π/d where d is the d-spacing of the diffracting set of planes. The red-shaded areas show the positions of the extra XRD peaks discussed in the main text for tetragonal and orthorhombic structures compared with the cubic structure. The blue-shaded area exhibits the position of the additional XRD peak discussed in the main text for orthorhombic structures compared with the cubic and tetragonal structures. XRD patterns were simulated using Vesta. | ||
Since I− is larger than Br−, there should be a lattice contraction when Br− substitutes for I−, thus giving rise to a smaller d-spacing. Based on Bragg's law, a corresponding shift in XRD peaks towards a larger diffraction angle is expected upon increasing the bromine content. A shift towards a larger angle is likewise anticipated as smaller Cs+ substitutes for FA+. Such trends are indeed observed in the XRD diffraction patterns shown in Fig. 4. The XRD patterns for all compositions and peak-shifts for all subsets are available in Fig. S2 and S3 (ESI†). The XRD peak at 14.0° shifts to a higher angle with increasing Br− content, demonstrating the incorporation of Br− into the perovskite lattice (Fig. 4A and B). The XRD peak at 14.8° shifts to a higher angle with increasing Cs+ content as FA+ is replaced with Cs+ (Fig. 4C and D). The XRD peak at ∼14–15° for the compositions in the matrix usually exhibits a single peak, whereas some compositions show split peaks. For instance, Cs2/6FA4/6PbBr3 (No. 35) in Fig. 4D shows a split peak at around 15.0°, which may be associated with a decrease in crystal symmetry. In addition, CsPbBr1/2I5/2 (No. 2) and Cs4/6FA2/6Pb(BrxI1−x)3 (1/2 ≤ x ≤ 2, i.e., No. 16–19) also show apparent peak splitting (Fig. S2 and S3, ESI†) that is related to low crystal symmetry. The films with a high bromide content or high cesium content exhibit a high texture by having only a few dominant peaks (Fig. 4A and C).
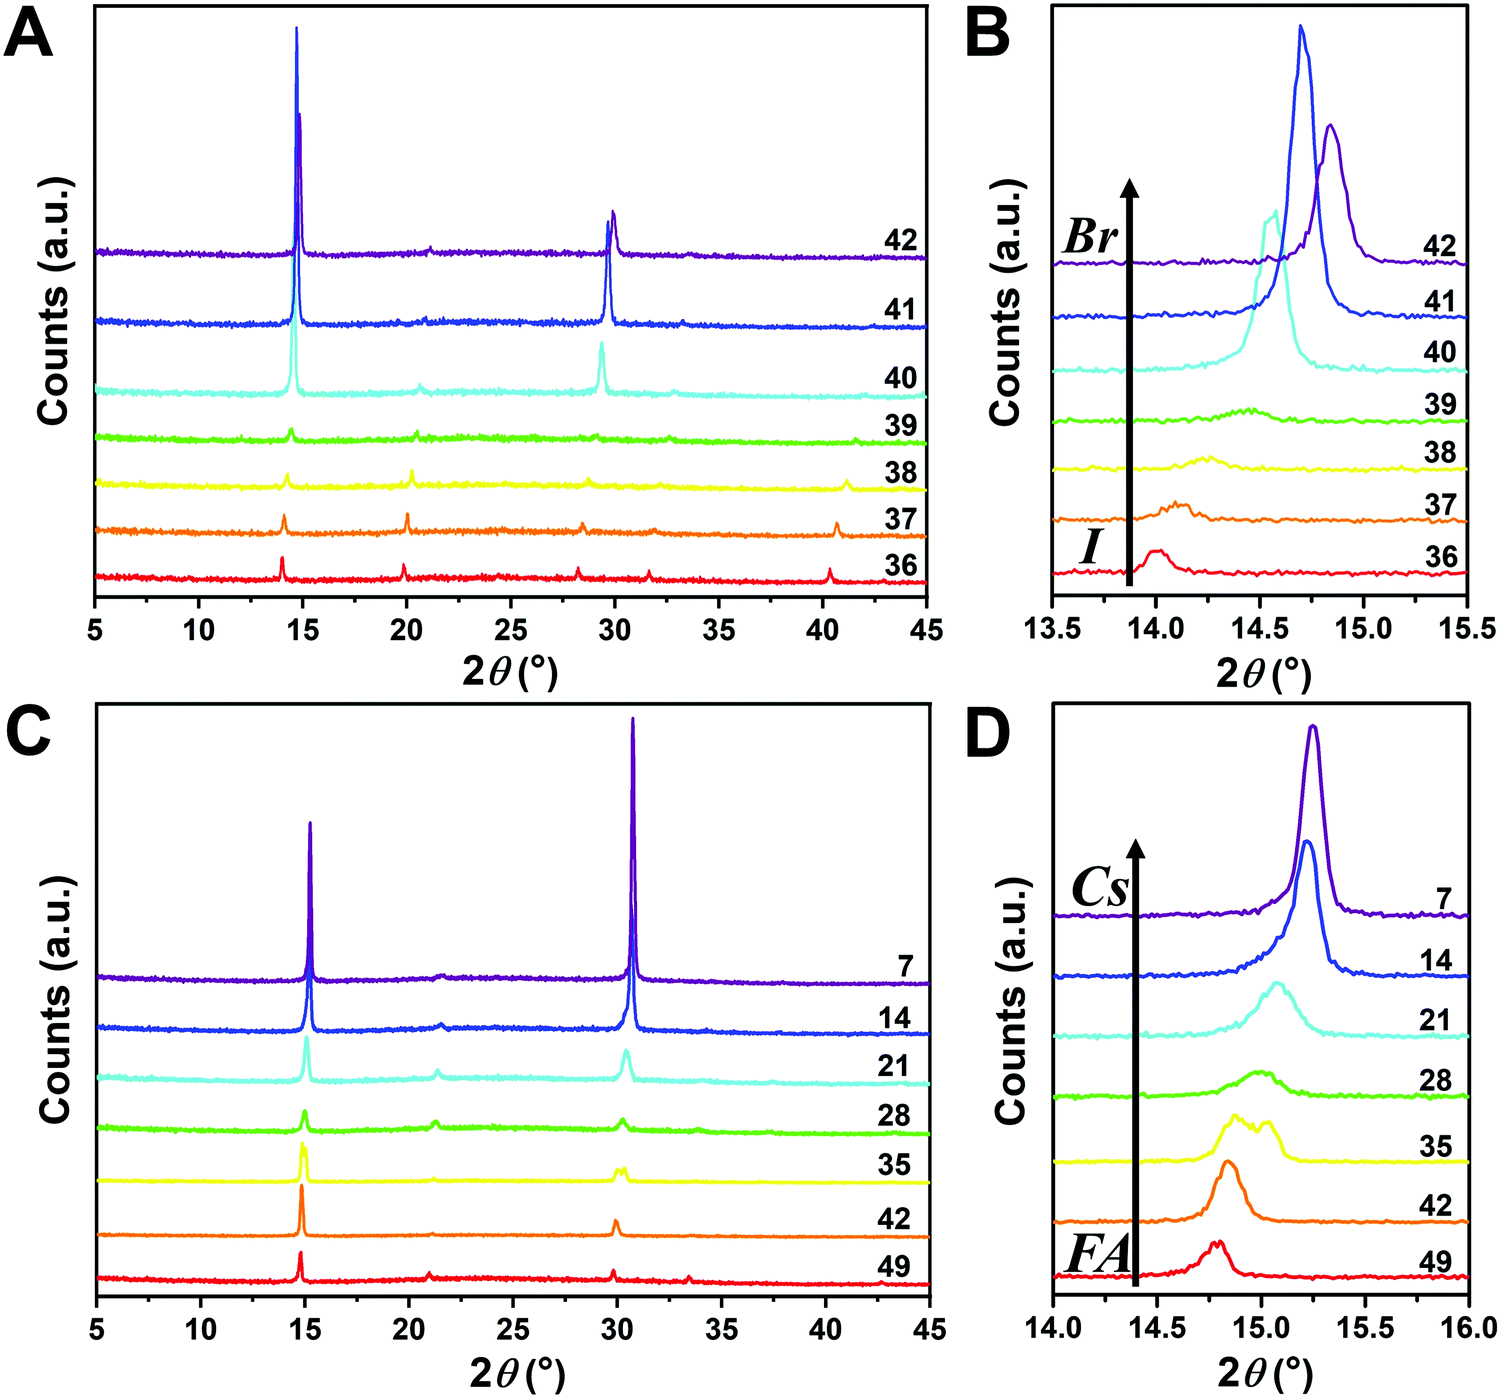 | ||
| Fig. 4 XRD patterns of Cs1/6FA5/6Pb(BrxI1−x)3 films as a function of the Br content (A and B) and CsyFA1−yPbBr3 as a function of the Cs content (C and D). (B) and (D) are expanded views of the peaks at ∼14–15° in (A) and (B). | ||
The crystal symmetries of the four corner compounds (i.e., CsPbI3, CsPbBr3, FAPbI3, and FAPbBr3) were then analyzed to further elucidate which crystal phases form depending on the compositions studied. The as-deposited CsPbI3 film in a nitrogen glovebox was dark brown (Fig. 1B), but converts to a clear yellow color in a few minutes once exposed to the ambient atmosphere. The XRD pattern of the CsPbI3 film in Fig. S4A (ESI†) indicates that CsPbI3 has a mixed γ-CsPbI3 perovskite phase and orthorhombic δ-CsPbI3 (Pnma) non-perovskite phase since it was measured under ambient conditions, in agreement with the reported structures and the metastability of γ-CsPbI3.25,44,46 The peaks located at 14.41°, 20.29°, and 28.90° are indexed as the (110), (112) and (220) planes in sequence for the orthorhombic Pbnm γ-CsPbI3 phase.44 The characteristic diffraction peaks at 9.86° and 13.06° correspond to the (101) and (102) planes of yellow orthorhombic Pbnm δ-CsPbI3.25 For the CsPbBr3 film, the two strong peaks at 15.25° and 30.74° in the XRD pattern (Fig. S4B, ESI†) matched well with the (110) and (220) planes of the standard orthorhombic perovskite structure.9,47,48 These two strong diffraction peaks dominate the XRD pattern of the CsPbBr3 film, underlining the presence of a high degree of texture. The XRD of the FAPbI3 film (Fig. S4C, ESI†) is in good agreement with the literature data for the hexagonal P63mc δ-FAPbI3 structure at room temperature and under ambient conditions.25 Likewise, FAPbBr3 (Fig. S4D, ESI†) exhibits a cubic Pmm structure at room temperature that is in line with previous reports.19,29,49
Although the presence of XRD peak splitting could indicate the decreased crystal symmetry for some compositions, e.g., No. 16–19 in Cs4/6FA2/6PbBrxI1−x, the films with a high texture only show a few predominant signals, possibly hiding some characteristic peaks and making it hard to distinguish which crystal phases are present in the film. Due to its measurement geometry of grazing-incidence, the GIWAXS technique provides a signal that is independent of the texture effects that can hide real peak signals, and thus it is perfectly suited for investigating the crystallographic information of thin films compared with conventional XRD. To better identify which crystal phases are present in the matrix, synchrotron-based GIWAXS was performed. The GIWAXS results for identification of the crystal phase of the four corner compounds (Fig. S5 and S6, ESI†) are consistent with the XRD data, except for CsPbI3, which only exhibits the δ-CsPbI3 phase due to the phase transition that was induced during the measurements under ambient conditions. The four characteristic peaks with a low signal around q = 1.7–2.0 Å−1 for CsPbBr3 shown in the GIWAXS data (Fig. S5, ESI†) show that the as-deposited CsPbBr3 is of the orthorhombic phase9,47,48 while those subtle signals are hidden in XRD (Fig. 4C) due to the high texture. Therefore, the GIWAXS data were used to qualitatively identify the phase variation in the matrix. As revealed in Fig. 5A, there are two extra peaks that appear for some compositions (i.e., No. 36 and No. 40–42) in Cs1/6FA5/6Pb(BrxI1−x)3 at around q = 1.6 Å−1 and 1.9 Å−1 corresponding to the (210)T and (211)T reflections. The data then suggest that composition No. 36 and No. 40–42 have a tetragonal symmetry, while composition No. 37–39 in Cs1/6FA5/6Pb(BrxI1−x)3 with a mixed halide and low bromide content are cubic since those two peaks are absent in their integrated GIWAXS patterns. Here, halide segregation could be excluded because pure-Br Cs1/6FA5/6PbBr3 (No. 42) also has the characteristic peaks for a tetragonal symmetry (Fig. 5A). Furthermore, octahedral tilting and the orthorhombic phase are present in Cs-rich compositions No. 2, 9, and 16 of CsyFA1−yPbBr1/2I5/2, as shown by an extra reflection at around q = 1.7 Å−1 (Fig. 5B), assigned to three reflections (211)O, (121)O, (103)O. This decreased symmetry is also in accordance with the split peaks observed in XRD and is in line with the calculated tolerance factors that predict low symmetry (Fig. 2). There are clear splitting peaks around 14.45° and 29.07° in the XRD pattern of composition No. 2 (Fig. S3, ESI†). Composition No. 9 shows the shoulder peaks closely near the high-intensity peaks at 20.45° and 45.51° (Fig. S3, ESI†). Composition No. 16 shows clear splitting peaks around 14.34°, 20.22°, 28.89° and 41.32° (Fig. S3, ESI†). The full set of GIWAXS patterns could be found in Fig. S5 and S6 (ESI†). In addition, the trends in GIWAXS are that the peaks will shift to higher q values, which indicate the decreased lattice d-spacing and lattice contraction upon increasing in the bromide content (Fig. 5A) or cesium content (Fig. 5B). This is in line with the observation in the XRD data, again corroborating the incorporation of halide and A-site cation into the crystal lattice.
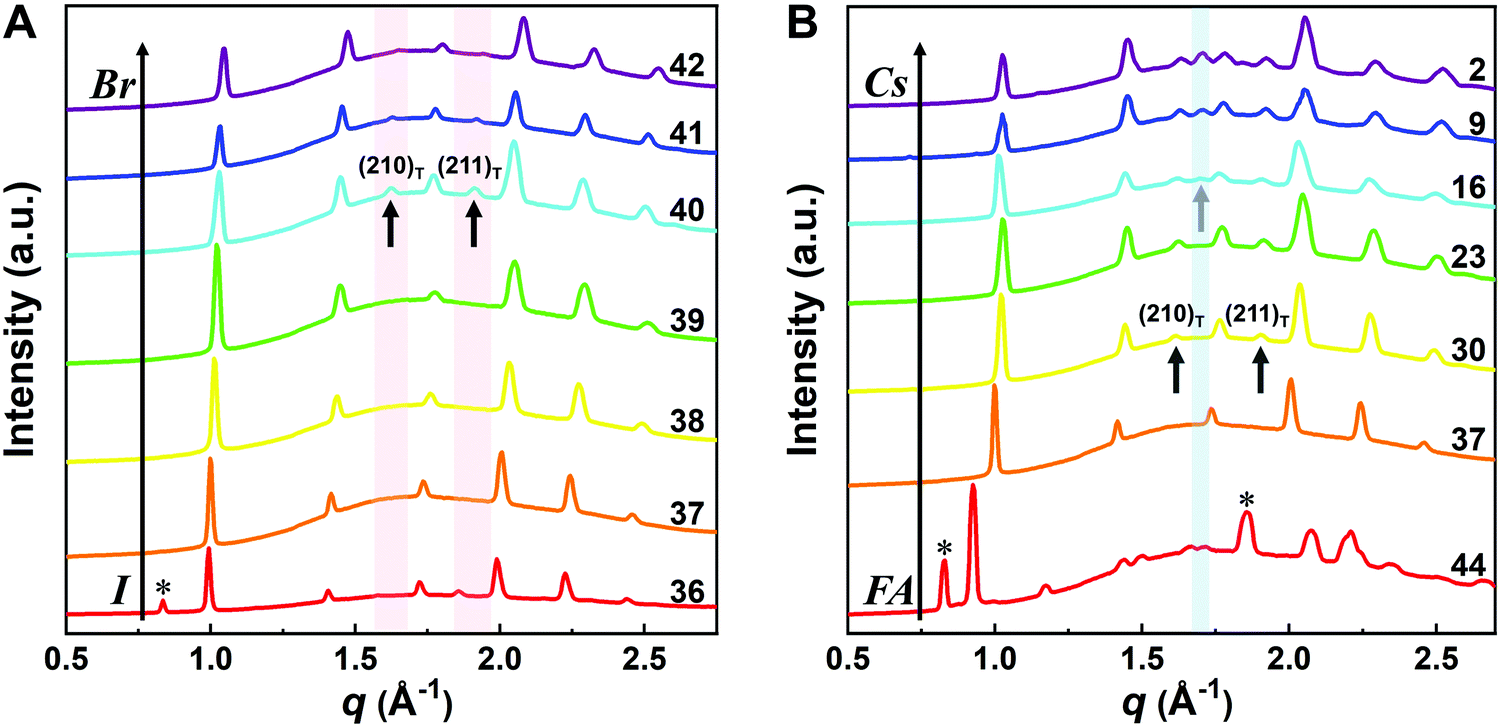 | ||
| Fig. 5 Integrated circular average of 2D GIWAXS patterns for Cs1/6FA5/6Pb(BrxI1−x)3 films as a function of the Br content (A) and CsyFA1−yPbBr1/2I5/2 as a function of the Cs content (B). δ-FAPbI3 is marked by *. The black arrows point to the characteristic peaks of the tetragonal phase and the grey arrow refers to the characteristic peaks of orthorhombic phase, i.e., (211)O, (121)O, (103)O. | ||
The clear evidence for the variation of crystal symmetry motivates us to qualitatively establish the relationship between the crystal symmetry and the perovskite composition. Combining the information retrieved from XRD and GIWAXS data, we identify the presence of perovskite and non-perovskite phases as a function of the composition in Fig. 6A. We observe that iodine-pure compositions are prone to the formation of secondary non-perovskite phases. The CsyFA1−yPbI3, FAPbI3 (No. 43) and Cs1/6FA5/6PbI3 (No. 36) perovskite thin films have the non-perovskite δ-FAPbI3 phase, and the other five compositions with the Cs ratio in the range of 2/6 ≤ y ≤ 1 show signatures of the presence of the non-perovskite δ-CsPbI3 phase (Fig. S6, ESI†). The ratio of the non-perovskite phase to the perovskite phase for the CsyFA1−yPbI3 compositions, which is estimated by calculating the intensity ratio of the characteristic peak at q = 0.70 Å−1 (δ-CsPbI3) or q = 0.83 Å−1 (δ-FAPbI3) for the non-perovskite phase over the characteristic peak at q around 1.00 Å−1 of the perovskite phase, was calculated based on the GIWAXS data for the CsyFA1−yPbI3 compositions, as shown in Fig. S7 (ESI†). The content of δ-FAPbI3 dramatically decreases when 1/6 of FA+ is replaced by Cs+, i.e., Cs1/6FA5/6PbI3 (No. 36). As the ratio of Cs increases, so does the content of δ-CsPbI3 in the range of 2/6 ≤ y ≤ 1. The presence of different non-perovskite phases as a function of the composition and the boundary at around 1/6 < y < 2/6 might be explained by changes in the formation energy between the corresponding perovskite phases and the two non-perovskite phases. It has been calculated that δ-CsPbI3 has a lower formation energy than that of δ-FAPbI3 and the corresponding perovskite phase when the Cs ratio goes higher than ∼30%, while δ-FAPbI3 has a lower formation energy than δ-CsPbI3 and the perovskite phase for a Cs ratio of below ∼30%.26,50 The phase transition energy from the alloyed perovskite phase to the two different non-perovskite phases reaches a minimum at a Cs ratio of ∼30%,26 which is in line with our experimental results in Fig. S7 (ESI†). The Cs2/6FA4/6PbI3 (No. 29) perovskite exhibits the lowest content of δ-CsPbI3. The low phase transition energy for the FA-rich composition in CsyFA1−yPbI3 is also associated with the availability of perovskite phases and gives rise to enhanced stability under our mild preparation conditions. However, Cs-rich (3/6 ≤ y ≤ 1) mixed perovskite phases are enthalpically significantly disfavored.50 The distortion of the lattice reduces the antibonding overlap of the I p-orbitals with the s-orbitals of Pb of the valence band maximum (VBM) for Cs-rich composition in CsyFA1−yPbI3, leading to a less stable structure.33,50 All of this is also in agreement with the high (FA-based) and low (Cs-based) tolerance factors (Fig. 2). Thus, in CsyFA1−yPbI3 (2/6 ≤ y ≤ 1) compositions the perovskite phase could be formed, but it is thermodynamically unstable at room temperature.26,31,50 All of this is also in agreement with their high (FA-based) and low (Cs-based) tolerance factors (Fig. 2). Thus, in the CsyFA1−yPbI3 (2/6 ≤ y ≤ 1) compositions the perovskite phase could be formed, but it is thermodynamically unstable at room temperature.26,50 Such a theoretical prediction is consistent with our experimental results. The crystallographic peaks of I-rich compositions No. 44–46 with FA+ as the exclusive A-site cation deviate from other compositions. These films exhibit the characteristic peaks of δ-FAPbI3. In addition, other crystal structures that are not well-defined can be formed (Fig. S2 and S5, ESI†), originating from the low annealing temperature and the formation of an amorphous phase.19,34 Composition No. 44–46 are therefore referred to as an unknown region in our subsequent analysis. With the exception of the seven CsyFA1−yPbI3 compositions in the first column, No. 44–46 and Cs5/6FA1/6PbBr1/2I5/2 (No. 9), all other perovskite compositions crystallize in the perovskite phase.
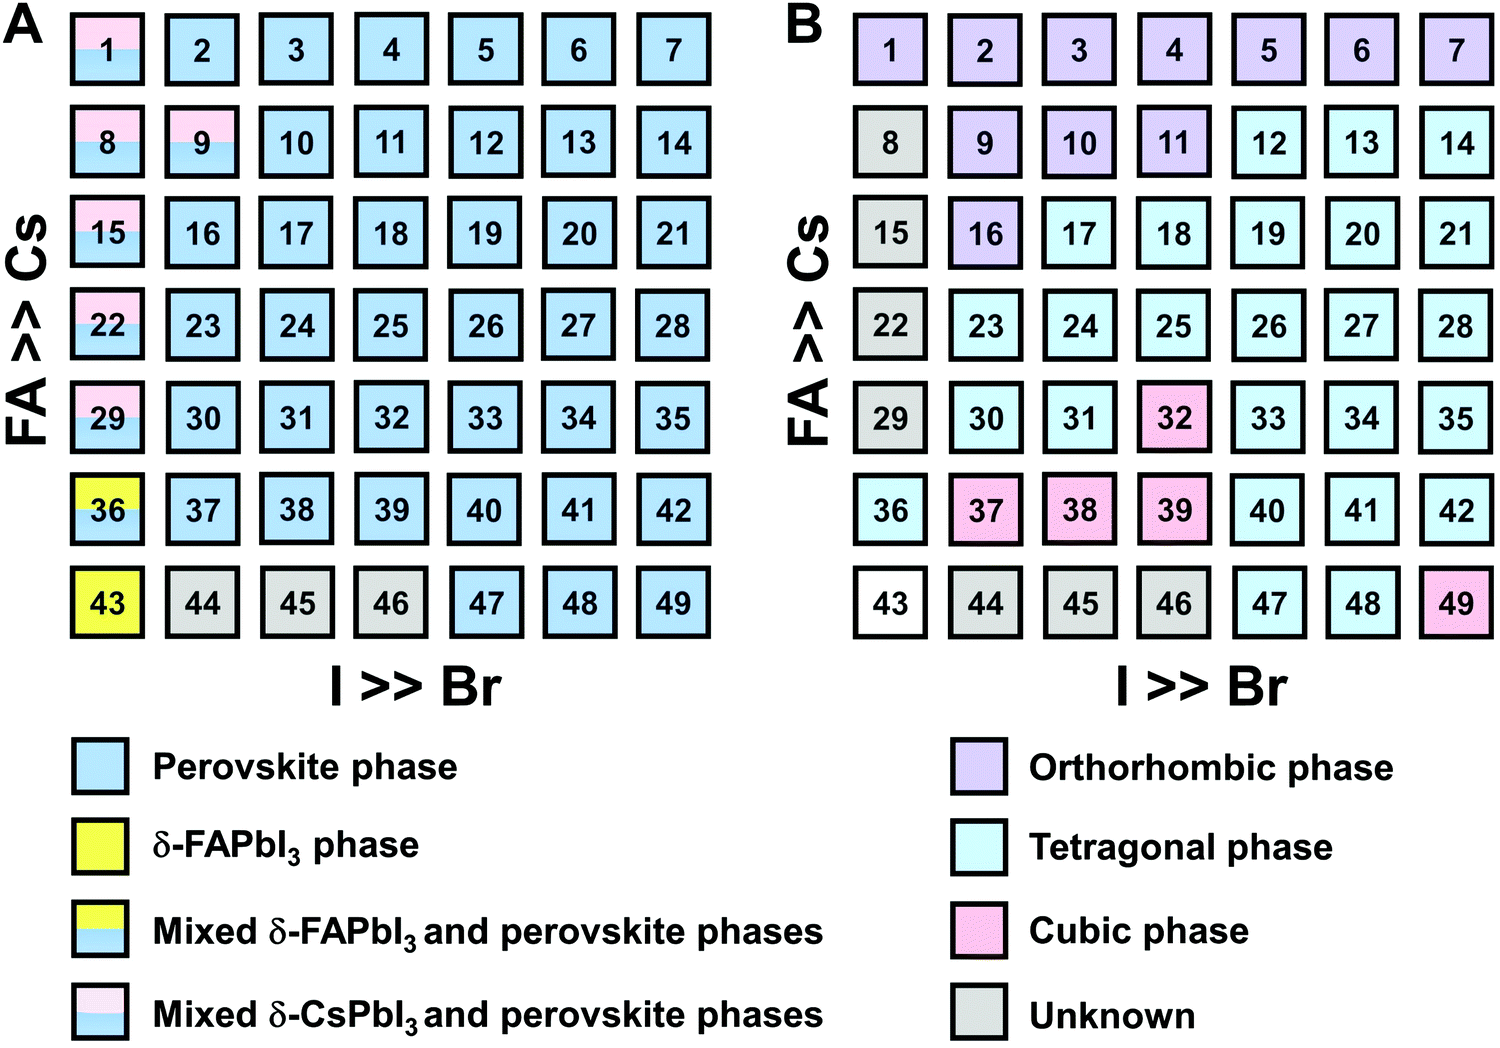 | ||
| Fig. 6 Color map of the presence of perovskite phases (A) and the presence of crystal symmetry for perovskite phases (B) in the CsxFA1−xPb(BryI1−y)3 compositional space based on the XRD and GIWAXS data. (B) only show the crystal symmetry for the perovskite phases in (A) and the empty square for FAPbI3 (No. 43) is non-perovskite phase. | ||
The existence of characteristic peaks at around q = 1.6 Å−1 and 1.9 Å−1 corresponding to the (210)T and (211)T reflections, respectively, are used to determine whether or not a tetragonal phase exists. Similarly, the presence of an additional characteristic peak at around q = 1.7 Å−1, indexed to the (211)O, (121)O, (103)O reflections, is utilized to distinguish whether or not an orthorhombic phase is present. The presence of different perovskite phases is summarized in Fig. 6B and the full set of GIWAXS patterns for all compositions showing the key peaks is given in Fig. S8 (ESI†). The low signal region for phase identification overlaps with the δ-CsPbI3, making it hard to assess the perovskite phase for compositions No. 8, 15, 22, and 29 in CsyFA1−yPbI3. The decreased symmetry stemming from the PbX6 octahedral tilting and distortion has been found in the CsyFA1−yPbI3 polycrystalline films for a cesium ratio above 2/6.33 The symmetry variation has been well-established in CsyFA1−yPbI3 nanocrystals, which could stabilize the perovskite phase at room temperature arising from the higher surface/volume ratio, and the crystal symmetry lowering from cubic to tetragonal to orthorhombic upon increasing the cesium content.43 This variation of the crystal structure conforms to the tendency of the tolerance factor which has been corroborated in the literature.26,33,43 The variation of crystal symmetry in the explored compositional space is consistent with the prediction from the tolerance factors we computed (Fig. 2). Cs-rich compositions with a lower tolerance factor (0.8–0.9) have a lower crystal symmetry, which is derived from the size mismatch between the A-site cations and the PbX6 octahedra, which are mainly orthorhombic and tetragonal; FA-rich compositions with a tolerance factor of ∼0.9–1.0 have an increased crystal symmetry, which is principally tetragonal and cubic. Notably, composition No. 36 is identified to have a tetragonal phase and a small amount of δ-FAPbI3 is detected, while composition No. 37 forms a cubic phase and there is no δ-phase found under our mild preparation conditions. This indicates that the incorporation of a small amount of bromine into the crystal lattice can dramatically decrease the phase transition temperature and contribute to the formation of the cubic phase. Hence the correlation between the crystal structure and the composition with varying the cesium ratio and bromine ratio is qualitatively established, and conducive to helping us understand the photophysical properties and photovoltaic performance in such materials.
To complement the experimental studies, we have also conducted first-principles density-functional theory calculations to assess the structure of the perovskites and their thermodynamic stability. The optimized lattice constants for all compositions and for the three phases – orthorhombic, tetragonal and cubic – are shown in Fig. S9 (ESI†). The calculated lattice constants also show the lattice contraction with the cesium ratio or bromine ratio increasing, as we observed in the XRD and GIWAXS results. Furthermore, using the optimized structures, we compared the phase stability for each composition based on the total electronic energy. The results are summarized in Fig. S10 (ESI†). Given the small energy differences between the three phases, we report the thermodynamic stability based on the Boltzmann distribution at T = 300 °C. As seen from Fig. S10A (ESI†), for most compositions, more than one phase is thermodynamically stable at room temperature. This suggests that neglected higher order effects, including harmonic and non-harmonic vibrational51 as well as entropic effects,52 which are computationally non-trivial, can have a noticeable effect in determining the most stable phase. Furthermore, kinetic effects can also be important in determining the most stable phase observed during synthesis.
Surface morphology
In addition to understanding the structural aspects of these materials, we need to understand the film morphology and coverage if we are to fabricate solar cells. Therefore, scanning electron microscopy (SEM) was carried out to image the morphology of the perovskite films in the CsyFA1−yPb(BrxI1−x)3 compositional space. The thickness of the as-deposited perovskite layer is approximately 150–200 nm based on the cross-sectional SEM image (Fig. S11A, ESI†). The full set of top-view SEM images for the 49 compositions is displayed in Fig. 7. SEM images at both higher and lower magnifications are available in Fig. S12–S14 (ESI†). The surface morphology of the films shows significant differences among the different compositions. Cs-rich compositions (e.g., No. 8–10) exhibit a rough surface with a large degree of pinholes, acting as shunt and moisture pathways, which are detrimental to the performance and stability of the devices.38 Notably, variations in the Cs+/FA+ ratio in CsyFA1−yPbI3 greatly impact the surface morphology. Cs-rich compositions in CsyFA1−yPbI3, No. 1, 8 and 15, show poorly defined domains and have a large number of pinholes. The δ-FAPbI3 (No. 43) presents a rod-like morphology and Cs1/6FA5/6PbI3 (No. 36) shows defined perovskite domains with an average size of 200–300 nm, while Cs3/6FA3/6PbI3 (No. 22) and Cs4/6FA2/6PbI3 (No. 29) present a combination of rod-shaped crystals that are embedded among flat domains. The remarkable difference in the surface morphology is likely to affect the device performance once these films are incorporated in complete solar cell stacks.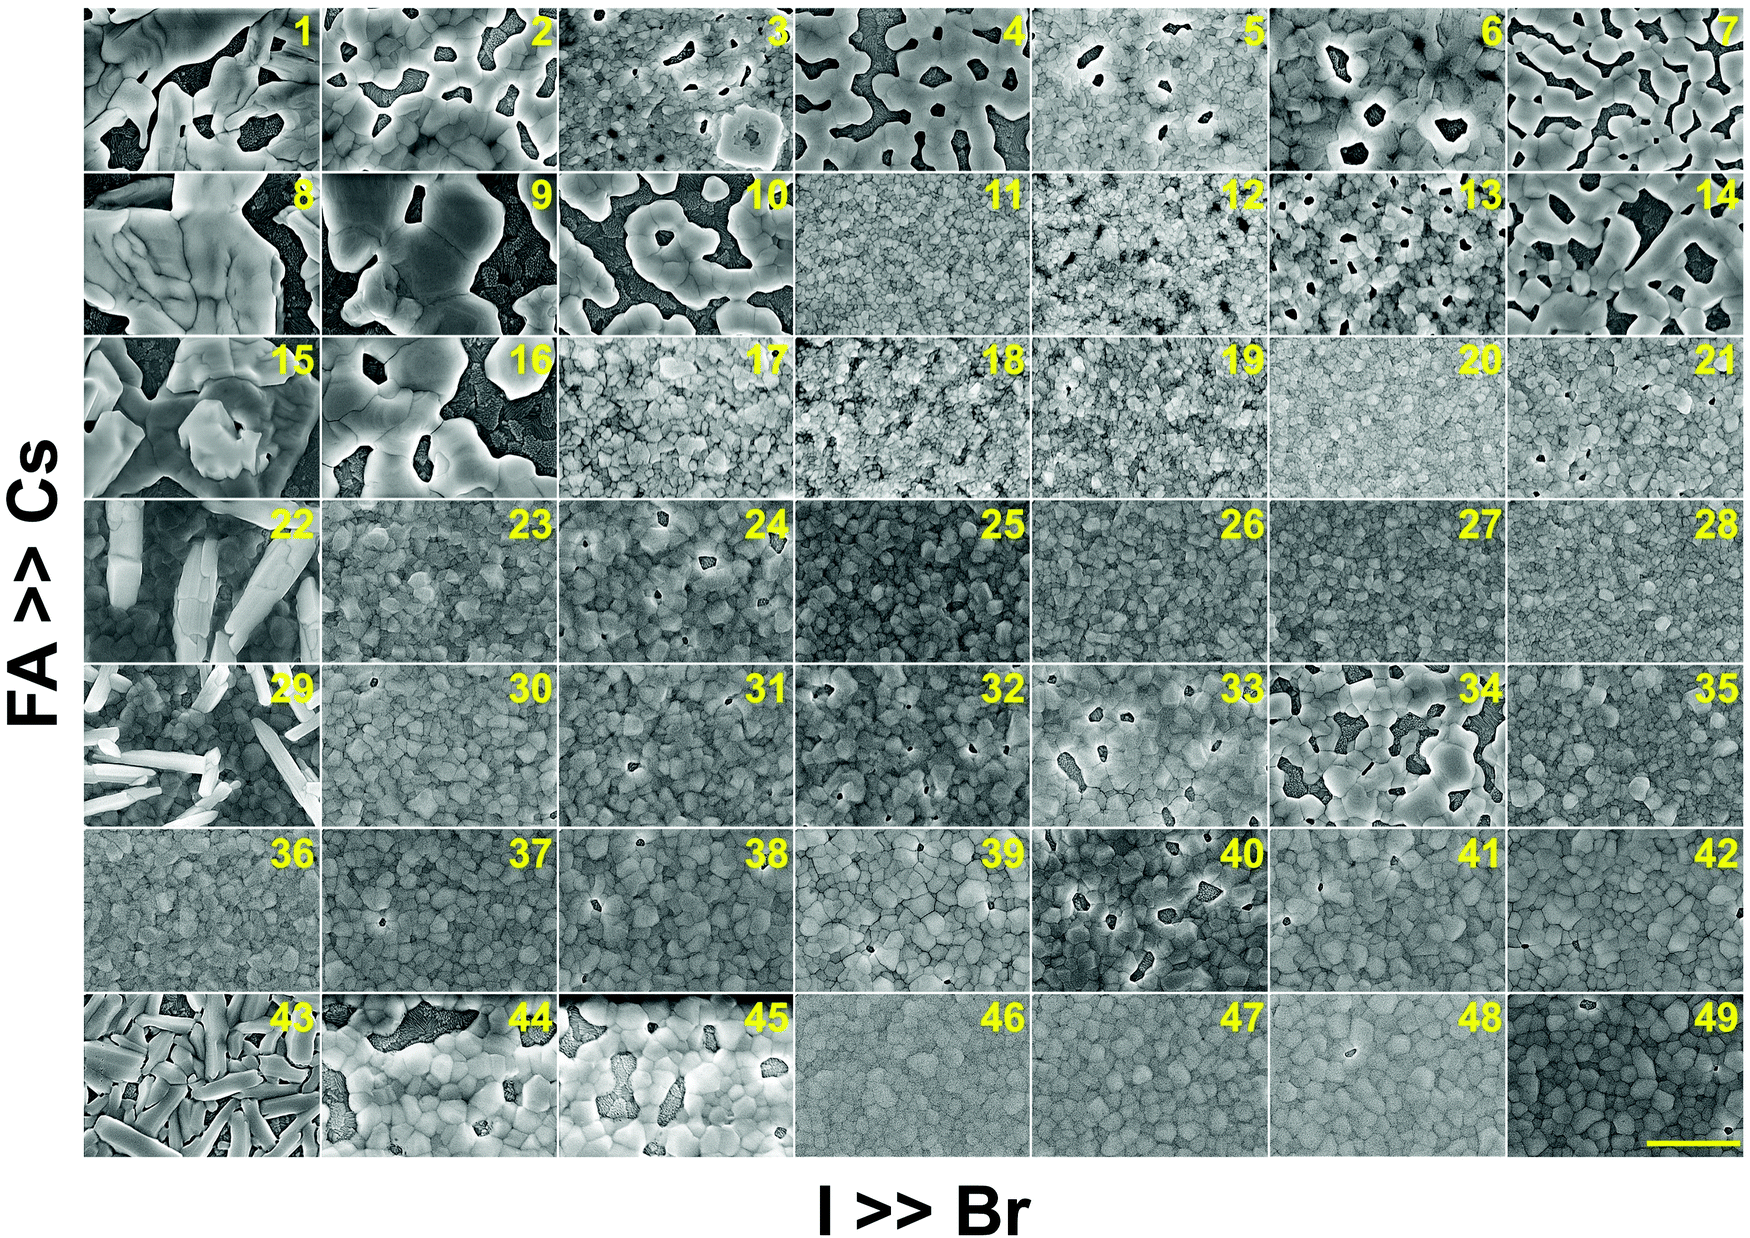 | ||
| Fig. 7 Top-view SEM images of the perovskite films in the CsyFA1−yPb(BrxI1−x)3 compositional space. The panels are arranged in the same order as in the composition matrix of Fig. 1A. The yellow scale bar on the right bottom is 1 μm. | ||
There are differences in the domain size between the explored compositions. However, there is no clear correlation with increasing bromine or cesium content in the films and domain size. The compositions with a high cesium content combined with a high bromine content, e.g., Cs5/6FA1/6PbBr3/2I3/2 (No. 11), Cs5/6FA1/6PbBr2I1 (No. 12), and Cs4/6FA2/6PbBr5/2I1/2 (No. 20), generally appear to have small domain sizes of ∼100 nm. A larger domain size can sometimes be associated with a reduction of the non-radiative recombination and improvement of the charge carrier transport, thus enhancing the device performance.53,54 The films deposited from compositions with a low cesium content combined with a low bromine content, e.g., Cs2/6FA4/6PbBr1/2I5/2 (No. 30), Cs1/6FA5/6PbI3 (No. 36), and Cs1/6FA5/6PbBr1/2I5/2 (No. 37), have fewer voids and present a relatively large domain size, which should lead to higher device efficiencies. The domain size of the film is in line with the reported perovskite films with a similar composition deposited via an analogous approach.27,41
Optical properties
To understand the variation in optical properties in the CsyFA1−yPb(BrxI1−x)3 films, ultraviolet-visible absorbance and steady-state photoluminescence (PL) measurements were performed. The absorption and normalized PL as a function of the wavelength are presented in Fig. 8 for a subset of the films. The full set of figures for the 49 perovskite films with varying ratios of Cs+/FA+ and Br−/I− are shown in Fig. S15–S18 (ESI†). The absorbance trends observed upon changing the Br−/I− ratio are indicated in Fig. 8A. All Cs1/6FA5/6Pb(BrxI1−x)3 films present sharp optical band edges that shift to a lower wavelength as the bromine content increases, resulting in bandgap tunability for solar cell applications. In addition, the shape of the absorption curve varies with the Br−/I− ratio. With a higher bromine content, the band edge of absorption becomes sharper and the excitonic absorption appears with the visual appearance of a peak, which is in good agreement with the higher exciton binding energy reported for the Br-rich perovskites.29,55,56 Changing the Cs+/FA+ ratio has a considerably smaller effect on the absorbance than changing the halide ratio, as illustrated in Fig. 8B. When the cesium content is increased, the optical band edges shift to slightly higher wavelengths. The markedly different impact on the absorbance of the CsyFA1−yPb(BrxI1−x)3 thin films when varying the Cs+/FA+ and Br−/I− ratios can be clarified by looking at the contribution of the energy levels of A and X to the electronic band structure of APbX3.56,57 As the halide is substituted from I (5p) to Br (4p), the energy of the halide p orbital decreases and the Pb–X bond lengths decrease, shifting the VBM toward a more negative energy and shifting the CBM toward a more positive energy, thus increasing the bandgap.56,57 Instead, the A-site cations introduce energy levels deep into the bands, and thus do not directly contribute to the VBM and CBM. The A-site cations, however, have an indirect impact on the bandgap by influencing the Pb–X orbital overlap through two competing effects, i.e., lattice contraction and PbX6 octahedral tilting.57 Previous work has shown octahedral tilting is the dominant effect in lead perovskites upon substitution of the larger FA+ with the smaller Cs+.57 Octahedral tilting and lowered symmetry reduce the Pb–X orbital overlap, moving the bands to deeper energies and increasing the bandgap for Cs-rich compositions.57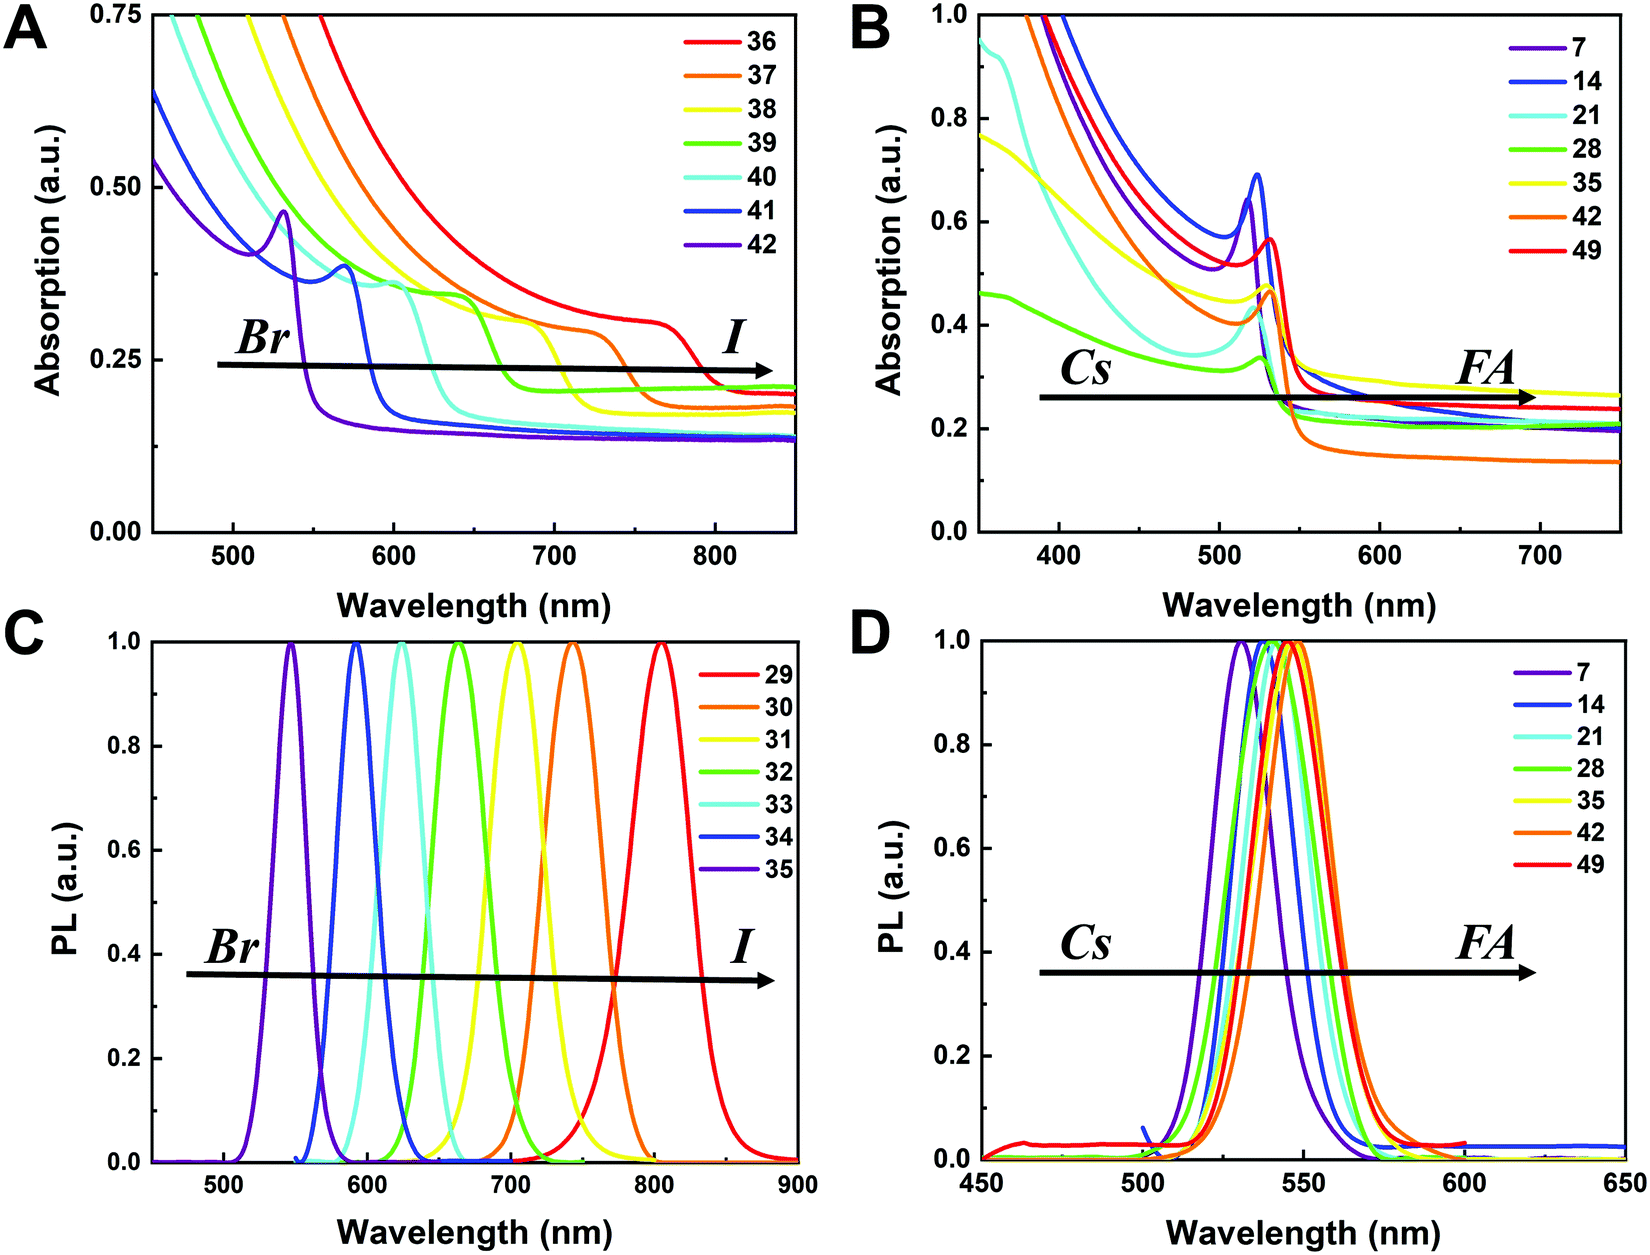 | ||
| Fig. 8 Ultraviolet-visible absorbance spectra of Cs1/6FA5/6Pb(BrxI1−x)3 (A) and CsyFA1−yPbBr3 (B) films. Normalized photoluminescence spectra of Cs2/6FA4/6Pb(BrxI1−x)3 (C) and CsyFA1−yPbBr3 (D) films. | ||
The trends in the PL are in good agreement with the shift of the absorption onset, and as displayed in Fig. 8C a clear blue shift of the PL peak is observed upon increasing the bromine content. The PL peaks of Br-rich samples are narrower than those of I-rich compositions, which can be due to a more defined bandgap without electronic defects. As the cesium content is increased, the PL peak is slightly blue shifted, as can be seen in Fig. 8D, and this is consistent with the slight shift in their bandgap. It is worth noting that two PL peaks appear in Br-rich films, e.g., CsPbBr2I1 (No. 5), Cs5/6FA1/6PbBr2I1 (No. 40), and Cs1/6FA5/6PbBr5/2I1/2 (No. 41) (Fig. S17 and S18, ESI†). From the two peaks, the one at the higher energy corresponds to the direct emission from the CBM to the VBM, but there is also another peak at a lower photon energy. This double peak behavior in the Br-rich perovskites is halide phase segregation, which has been reported in previous studies.9,13,29,34 It was proposed that Br-rich compositions can phase-segregate into majority Br-rich domains with PL peaks at a higher energy and minority I-rich domains with the PL peak at a lower energy upon illumination.9,13,29 The I-rich domains are derived from stochastic composition fluctuations and local lattice strain that is induced by localized polarons under illumination, which is detrimental to the device performance, especially the Voc.15 The Br-rich compositions with the sub-bandgap photoemission are potentially a problem for their practical application under illumination. From the absorbance spectra, the bandgap energy (Eg) for the CsyFA1−yPb(BrxI1−x)3 compositions, as extracted by the Tauc plots, are summarized in Fig. 9A. The fits used for the calculation are presented in Fig. S19 (ESI†) with the assumption that all compositions are direct bandgap semiconductors. The difference in Eg between a pure iodide perovskite and a pure bromide perovskite with a fixed Cs+/FA+ ratio is approximately 0.75 eV, whereas the difference in Eg between a pure Cs perovskite and a pure FA perovskite with a fixed Br−/I− ratio is only approximately 0.15 eV.
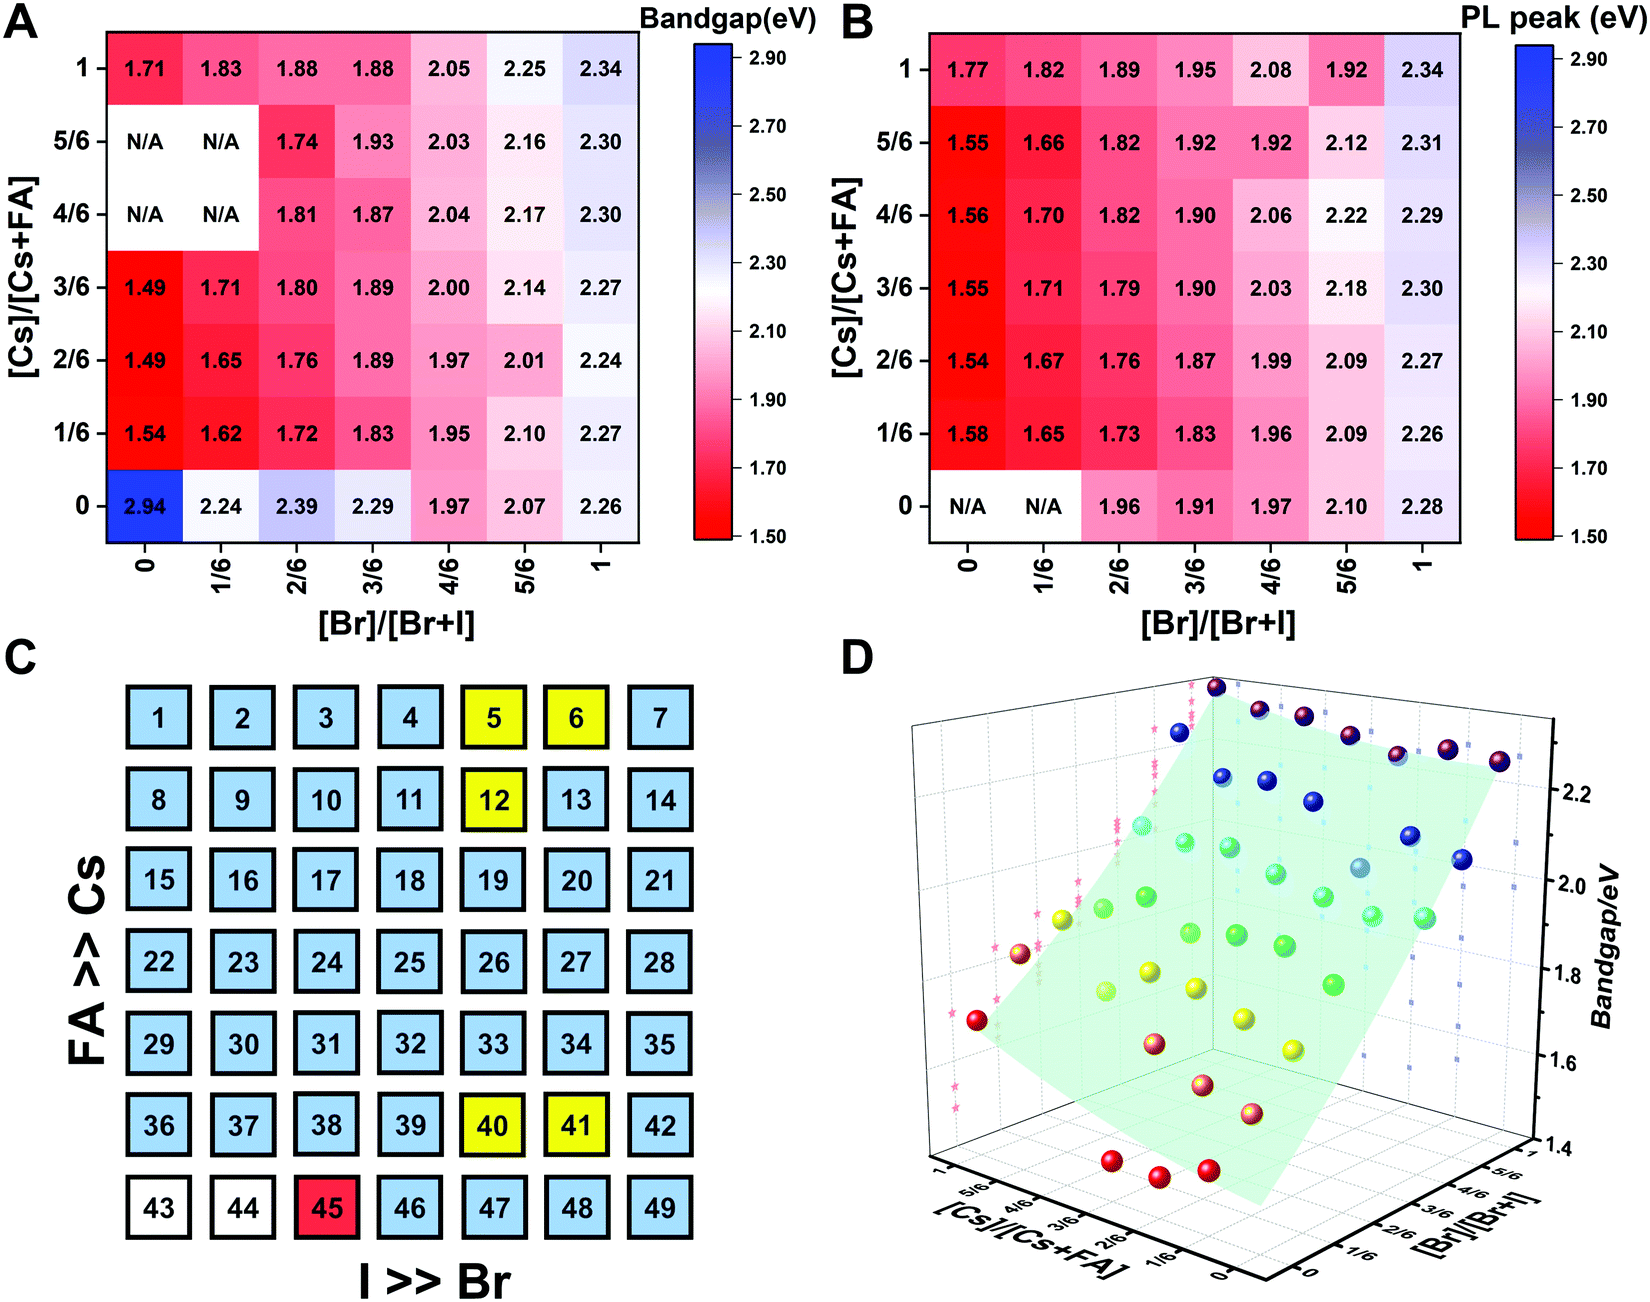 | ||
| Fig. 9 Heat maps of bandgaps extracted from Tauc plots based on the absorption (A) and the PL energy (B) extracted from the wavelength of the maximum emission. N/A means not available. Note: if the composition incurred phase segregation and had two peaks, the position of the PL peak at the lower wavelength was selected. (C) Color map of compositions with phase segregation summarized based on Fig. S16 and S17 (ESI†). A blue square means that only one peak was observed during the measurement. A yellow square means that a secondary PL peak co-exists. Although CsPbBr5/2I1/2 (No. 6) only has one peak, it is the result of evolving red-shifted PL at a low wavelength upon illumination.9 The red square represents a split PL peak and the white squares have no observable PL peaks. (D) Bandgaps as a function of the perovskite composition for the CsyFA1−yPb(BrxI1−x)3 compositional space. The colored dots are the experimental bandgaps calculated from Tauc plots based on absorption. The values predicted from the fitted empirical equation belong to the light green plane in the plot. | ||
The PL peak positions (EPL) are shown in Fig. 9B. If the composition showed two PL peaks, the one at the higher energy is the one shown. The compositions with the secondary peak at a low photon energy are illustrated in Fig. 9C. A majority of EPL values for MA-free CsyFA1−yPb(BrxI1−x)3 match well with the Eg extracted from the UV-vis measurements, revealing that the PL is predominantly from the direct recombination from the CBM to the VBM rather than trap or sub-band states. The energy loss from Eg to EPL for some compositions indicates that the emitted photon has less energy than the absorbed photon, and the energy loss is derived from vibrational relaxation as well as internal conversion, which is called the Stokes shift in PL.58 Two compositions (i.e., No. 6 and 12) have large energy differences since they exhibit phase segregation during a few minutes of beam exposure during PL measurements (Fig. 9C). There is no second PL peak at low energy in the Br-rich CsyFA1−yPbBr3/2I3/2 compositions, while the appearance of a second PL peak is documented to appear within a few minutes for MAyFA1−yPbBr3/2I3/2 in the literature.29 This observation possibly indicates the existence of a broader range of photostable compositions for MA-free CsyFA1−yPb(BrxI1−x)3 in comparison with MAyFA1−yPb(BrxI1−x)3, although a full understanding of phase segregation is beyond the scope of this initial study. The emitted photon has more energy than the absorbed photon for some compositions and the extra energy comes from the dissipation of thermal phonons in a crystal lattice, which is called up-conversion photoluminescence.58 PL-peaks centered on energies slightly higher than the bandgap energy from absorption were also observed in our previous research.29 In addition, it has been reported that the perovskite materials show up-conversion properties with a phonon-assisted energy gain and potential applications in hot carrier optoelectronic and energy-harvesting devices.59,60
To quantitatively describe the dependence of Eg on the composition in the CsyFA1−yPb(BrxI1−x)3 space, we fitted an empirical equation to the experimental data. Compositions No. 43–46 (I-rich in FAPb(BrxI1−x)3), 8 (Cs5/6FA1/6PbI3), 9 (Cs5/6FA1/6PbBr1/2I5/2), 15 (Cs4/6FA2/6PbI3), and 16 (Cs4/6FA2/6PbBr1/2I5/2) were excluded from the fit. The Eg values of compositions No. 43–46 follow a different trend from other compositions (Fig. S20A–C, ESI†), which can also be seen in their crystallographic data. Compositions No. 8–9 and 15–16 show a broad absorption without a clear onset (Fig. S15 and S16, ESI†). Under these assumptions, the non-linear variation of Eg with the changing halide ratio could be empirically described via a quadratic equation.12,29 A quadratic equation also describes the trend in Eg with changes in the ratio of Cs/FA. The Eg value across the whole compositional space can then be described using a second-order polynomial:
| Eg(x,y) = 1.50 + 0.56x + 0.08y + 0.19x2 + 0.11y2 − 0.10xy | (2) |
Device performance
The I-rich compositions usually yield the highest photovoltaic performance and stability due to the suitable bandgap as photoabsorbers in single-junction solar cells.18,27 Here, perovskite solar cells for all I-rich compositions CsyFA1−yPb(BrxI1−x)3 (0 ≤ x ≤ 3/6), i.e., the first four columns apart from CsPbI3 and FAPbI3, were fabricated in the n–i–p FTO/c-TiO2/m-TiO2/perovskite/Spiro-OMeTAD/Au architecture, where FTO is fluorine-tin-oxide-coated glass and Spiro-OMeTAD is 2,2′,7,7′-tetrakis[N,N-di(4-methoxyphenyl)amino]-9,9′-spirobifluorene as the hole-transport layer. The perovskite layer in the solar cell was deposited using the same method as for the characterized perovskite films. Fig. 10A–D shows the photovoltaic parameters of the short-circuit current (Jsc), Voc, the fill factor (FF), and the PCE for the reverse scan attained from best devices of each perovskite composition. The corresponding photovoltaic parameters for the forward scan and the stabilized power output at the maximum power point (MPP) are available in Fig. S21 (ESI†). The corresponding box plots, which depict the performance distribution of multiple devices, are given in Fig. S22–S25 (ESI†). The 26 I-rich compositions show a huge spread of device performances, with the reverse PCE varying from 1.30% to 12.25%. Of the 26 I-rich compositions, Cs1/6FA5/6PbI3 (No. 36) yielded the best devices, with a reverse PCE of 12.25% and a forward PCE of 12.55%. The best devices have compositions clustered around No. 36, involving No. 29 (Cs2/6FA4/6PbI3), No 30 (Cs2/6FA4/6PbBr1/2I5/2), and No. 37 (Cs1/6FA5/6PbBr1/2I5/2).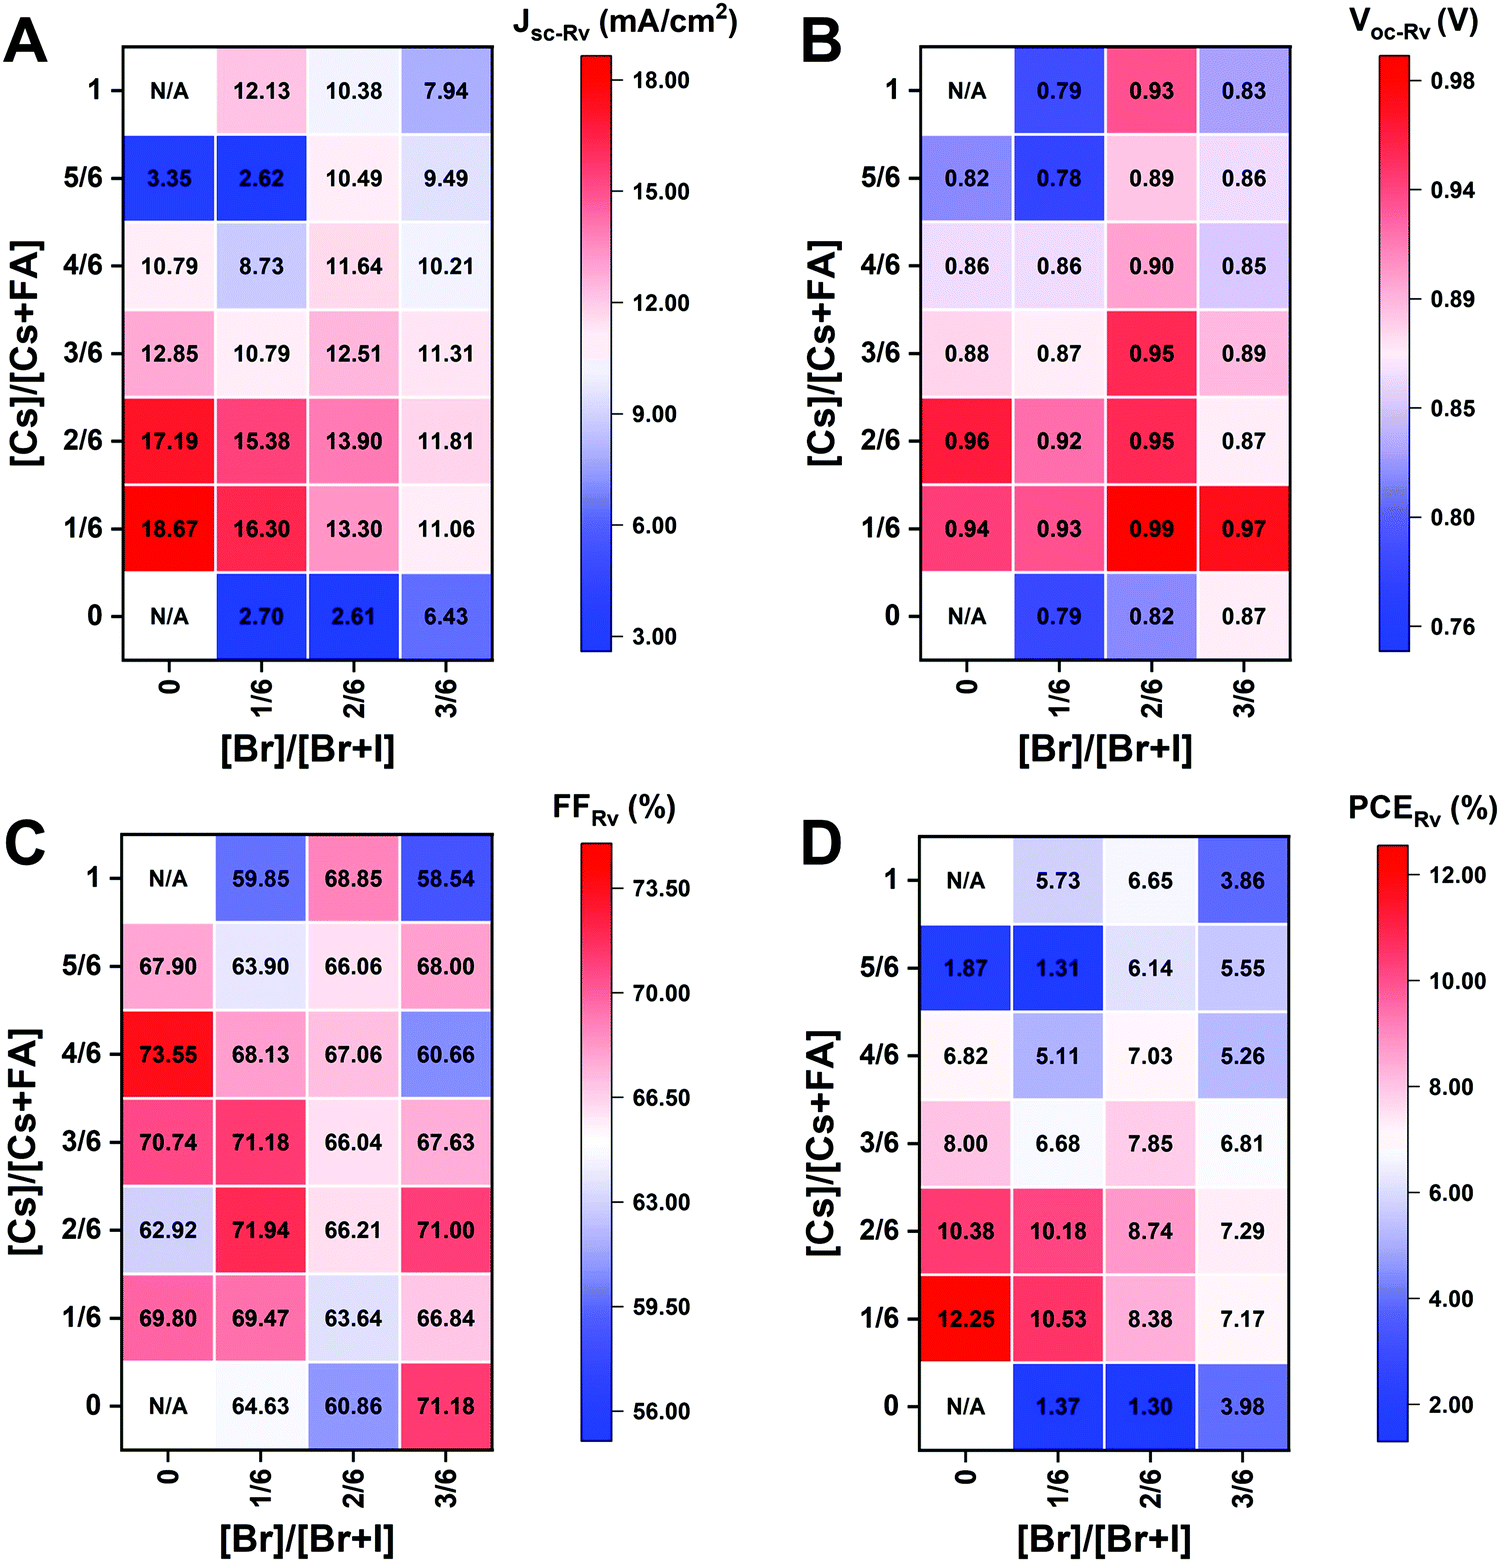 | ||
| Fig. 10 Photovoltaic parameters of Jsc (A), Voc (B), FF (C), and PCE (D) for the reverse scan obtained from the best devices of I-rich compositions using 0.4 M perovskite precursor solutions. | ||
As illustrated in Fig. 10A, when the amount of bromine is increased, there is a decrease in Jsc (barring the Cs-rich compositions), which is directly related to the blue-shift of the absorption onset. As cesium ratio increases, a reduction of Jsc is observed. This decline is remarkable for compositions with iodide as the exclusive halogen. When the cesium ratio is increased, Jsc is significantly decreased from 18.67 mA cm−2 at y = 1/6 (No. 36) to 3.35 mA cm−2 at y = 5/6 (No. 8) for the compositions of CsyFA1−yPbI3, while Jsc is slightly decreases from 13.30 mA cm−2 at y = 1/6 (No. 38) to 10.38 mA cm−2 at y = 1 (No. 3) for the compositions of CsyFA1−yPbBr1I2. The difference can be attributed to the poor surface morphology of No. 8 and 15 on the one hand, and to the presence of a large degree of non-perovskite δ-phase on the other. In light of our recent research work focusing on the preferred crystallographic orientation (texture)61 and its effect on Jsc, we analyzed the GIWAXS data, tracking the intensity variations of a specific plane with varying the azimuthal angle, as an indication of the texture. Our analysis, summarized in Note 1 and Fig. S26–S28 (ESI†), suggests that the impact of texture on the device performance is negligible in the face of the other factors, e.g., the bandgap, surface morphology, and the existence of lower symmetry phases.
The Voc increases as a result of the widening bandgap with increasing bromine ratio in the first three columns (Fig. 10B). Nevertheless, the Voc decreases as the cesium ratio increases, which is an opposite trend to the bandgap. This means that there are additional factors besides the bandgap that dominate the Voc. Besides the poor surface morphology and the presence of the δ-phase in Cs-rich compositions, the decreased symmetry of Cs-rich compositions is hypothesized to favor non-radiative recombination, inducing a decrease in Voc. The Cs-rich compositions have a small tolerance factor, which is representative of a large mismatch in ionic size between the A-site cation and the PbI6 octahedra. This mismatch leads to lowered symmetry and increased lattice strain, which in turn favors increased defect concentrations and non-radiative recombination, which is harmful to the Voc.16,62
The FF of a solar cell is often the most difficult parameter to study and optimize as it is sensitive to a wide range of loss mechanisms, including resistance losses. The FF does not show a clear trend across the compositional space (Fig. 10C). The PCE exhibits a similar functional dependence on the composition to the overall Jsc (Fig. 10D), despite the PCE being determined from the products of Jsc, Voc, and FF. Increasing the cesium or bromide content decreases the PCE of the devices. This suggests that the bandgap variations correlate with the trends in the PCE to some extent, which is also expected. Both FA-rich and I-rich compositions exhibit the highest device performance in our study, which can also be attributed to their long carrier lifetime. Rehman et al. extracted the carrier lifetime from the photoluminescence decay transients in compositions similar to those we report here.31 The authors found that the region of 0.1 < y < 0.3 Cs+ content yielded less non-radiative trap-assisted recombination as well as faster carrier mobility in CsyFA(1−y)Pb(Br0.4I0.6)3. The carrier lifetime varies from 191 ns for Cs1/6FA5/6PbI3 (No. 36) to 22 ns for the Cs1/6FA5/6PbBr3 (No. 42) perovskite thin films while the carrier diffusion lengths decreased from 4.4 μm for No. 36 to 0.8 μm for No. 42 in the row of compositions Cs1/6FA5/6Pb(BrxI1−x)3. The longer carrier lifetime in both FA-rich and I-rich compositions is beneficial to the performance of the solar cells, which is in line with our device results (Fig. 10).
However, a more insightful way to compare these materials is to normalize to the bandgap. We calculated the ratio of experimental Jsc, Voc, FF, and PCE from the best devices to the corresponding theoretical Shockley–Queisser limit (for each bandgap) of I-rich compositions (Fig. S29, ESI†).3 These ratios can be used to evaluate the loss of each photovoltaic parameter relative to their theoretical value as a function of the bandgap. The experimental vs. theoretical ratios for Jsc shown in Fig. S29 (ESI†) are lower than 70% due to reflection from the glass, parasitic absorption by the FTO/TiO2, and the relatively thin layers in these unoptimized devices.63 However, we plot these ratios for all devices measured to understand the trends in Jsc. Cs-rich samples, e.g., No. 8 and 9, show only ∼12% of the theoretical Jsc value, which is mainly derived from the large amounts of non-perovskite present in the films (Fig. S7, ESI†). The experimental vs. theoretical ratios for the Voc are also lower than 80%, primarily due to trap-assisted non-radiative recombination in the perovskite bulk and at interfaces as well as the mismatch in energy level between the perovskite and the charge transport layer.64 Looking at Fig. S29 (ESI†) we can see that moving away from I-rich compositions leads to lower normalized Voc values, which suggests that adding Br leads to increased recombination dynamics or a limit by the splitting of the quasi-Fermi levels of the transport layers. These large Voc deficits also occurred in other reported wide-bandgap perovskites.64 Chemical treatments could remarkably reduce this loss due to non-radiative recombination.63,65 The perovskite fabrication process needs to be optimized together with favorable energy alignment of the contact layers to overcome this loss. Similarly, going from FA- to Cs-rich compositions leads to a decrease in the Voc ratios, which can be attributed to more pinhole formation (Fig. 7). However, looking more closely at the compositions that have similar morphological features with a close bandgap and no non-perovskite phases (Fig. 9A), for compositions No. 37, 30, and 23, the Voc decreases with the decrease in symmetry, even though No. 23 (1.71 eV) has a wider bandgap than No. 37 (1.62 eV). The Voc goes from being cubic and 70% of the theoretical Voc to tetragonal and 61% of the theoretical Voc for compositions No. 37 and 23, respectively. This indicates that lower symmetries alone in I-rich perovskites may be one of the factors that lead to lower Voc values, which is indicative of increased recombination dynamics. The crystal structure of the perovskite phase seems to have an impact on the device performance, and the lower symmetries might lead to increased non-radiative recombination.
Given the promise of the FA-rich, I-rich compositions and the thin nature of our films due to the poor solubility of CsBr used when processing the films, we aimed to increase the thickness of the perovskite layer to maximize the photon harvesting. Hence, a 1.0 M precursor solution was prepared, and a higher annealing temperature of 150 °C was used to crystallize the deposited films, to suppress the formation of the yellow δ-phase. Fig. 11A shows the champion current–voltage (J–V) characteristic curves for the four compositions (No. 29, 30, 36 and 37). The detailed photovoltaic parameters are reported in Table 1. The corresponding box plots and MPP tracking are given in Fig. S30 (ESI†). From the collected data it can be observed that the stabilized power output at the MPP of composition No. 29 using the 1.0 M precursor solution (10.22%) is almost the same as the 0.4 M (10.21%) solution. The negligible change in photovoltaic parameters for this composition, despite the increased thickness and thus the increased GIWAXS signal from the perovskite phases, is ascribed to the presence of a δ-CsPbI3 secondary phase (Fig. S31A–C, ESI†), which limits the performance in spite of the increased thickness and annealing temperature used. The PSC based on composition No. 36 using the 1.0 M precursor solution delivers a champion stabilized PCE of 18.62%, benefiting from an improvement in each of the photovoltaic parameters, especially Jsc, which increases from 18.67 mA cm−2 to 24.04 mA cm−2. As illustrated in Fig. S32 (ESI†), the change in the onset of the external quantum efficiency (EQE) spectra for these four compositions match the bandgap extracted from the absorbance onset, Eg (Table S2, ESI†). We attribute this enhancement to the absence of the δ-phase (Fig. S31A and B, ESI†) for this composition. The stabilized PCE of composition No. 30 and 37 also increase to 15.13% and 17.13%, respectively. The increase in annealing temperature does not change the preferred crystallographic orientation and crystal symmetry of No. 30, 36, and 37, keeping the cubic, tetragonal and cubic structure, respectively (Fig. S31, ESI†). The long-term operational stability data obtained for the PSCs with composition No. 36 and 37 held at MPP under 1 Sun irradiation in a nitrogen atmosphere and at room temperature are shown in Fig. 11B. After 330 h, the solar cell with composition No. 36 retained 94% of its initial efficiency. The major contribution to the efficiency drop observed is attributed to a 5% decrease in Voc and FF compared with the initial values (Fig. S33, ESI†). The solar cell with composition No. 37 maintained 98% of its initial efficiency, exhibiting increased photostability, which is of promise to enable solar cells with long-term stability. No. 36 (1.54 eV) and No. 37 (1.62 eV) not only have suitable bandgaps to absorb the light illumination, but also exhibit a lower mismatch in the crystal structure that gives rise to suppression of the non-perovskite phase, thus leading to their high performance and durability among the compositions explored. It is the structure and the optoelectronic properties that determine the optimized composition for making high-performance devices.
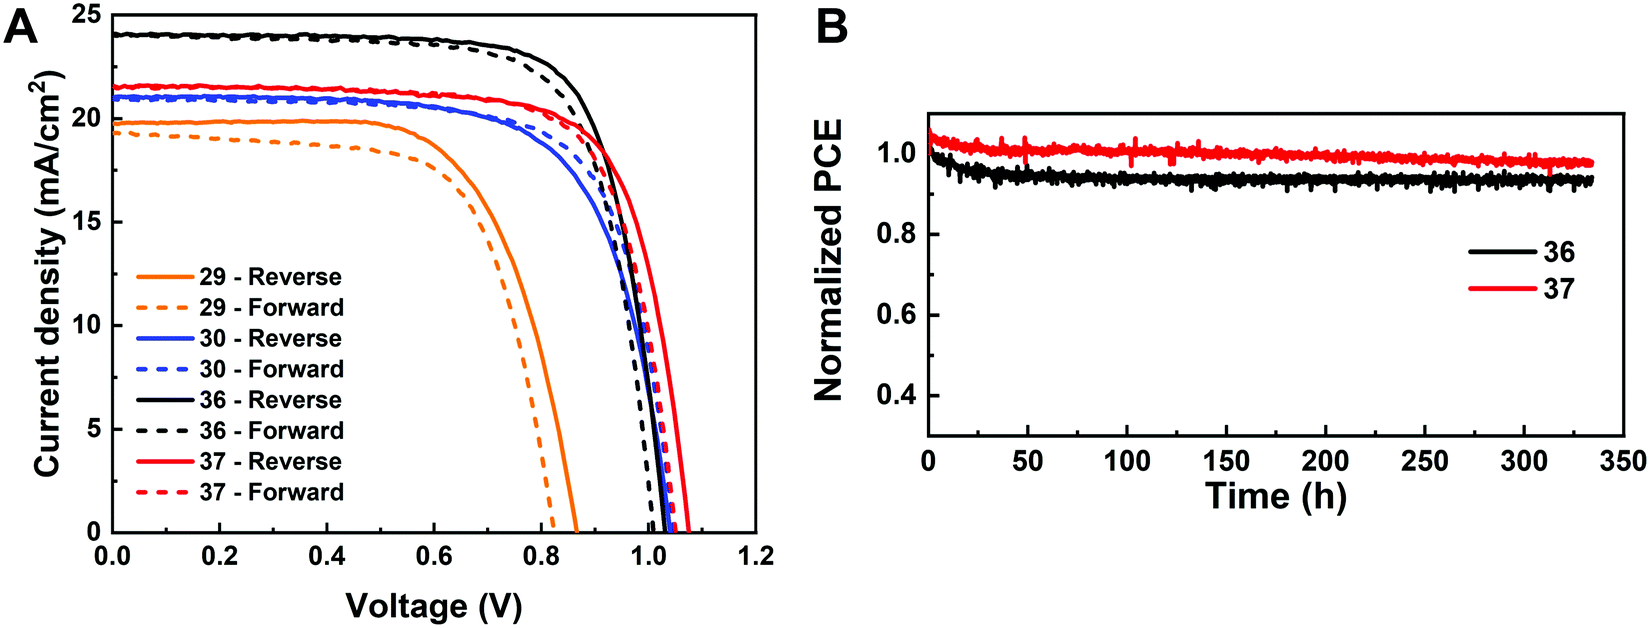 | ||
| Fig. 11 (A) Reverse J–V curves of the champion PSCs of composition No. 29, 30, 36, and 37 using 1.0 M perovskite precursor solutions with 5% excess Pb2+. (B) Continuous MPP tracking results under 1 Sun irradiation in a N2 atmosphere for devices of composition No. 36 and 37. | ||
| Composition no. | 29 | 30 | 36 | 37 |
|---|---|---|---|---|
| J sc-Rv (mA cm−2) | 19.76 | 21.03 | 24.04 | 21.57 |
| V oc-Rv (V) | 0.86 | 1.04 | 1.03 | 1.08 |
| FFRv (%) | 66.95 | 69.19 | 74.66 | 73.08 |
| PCERv (%) | 11.38 | 15.13 | 18.49 | 17.03 |
| J sc-Fw (mA cm−2) | 19.30 | 20.94 | 24.02 | 21.55 |
| V oc-Fw (V) | 0.83 | 1.05 | 1.01 | 1.05 |
| FFFw (%) | 66.79 | 71.62 | 73.03 | 73.52 |
| PCEFw (%) | 10.70 | 15.75 | 17.72 | 16.64 |
| Stabilized MPP (%) | 10.22 | 15.13 | 18.62 | 17.13 |
Our work illustrates the importance of the precise composition on the structural integrity of the perovskite structure, including segregation into non-perovskite phases as well as Br- and I-rich perovskites. These are all important aspects for device operation. Compositional changes allow us to tailor the crystallographic properties and improve the structural stability of perovskite materials. The phase separation phenomenon could be suppressed by incorporating Br− and limited Cs+, as well as increasing the crystallization temperature. For instance, No. 37 (Cs1/6FA5/6PbBr1/2I5/2) with the incorporated Br− shows no δ-phase compared with No. 36 (Cs1/6FA5/6PbI3) annealed at 65 °C in Fig. 5A. Thus, the content of δ-FAPbI3 in No. 36 is significantly decreased when the Cs+ substitutes FA+ and the films are annealed at 65 °C (Fig. S7, ESI†). In addition, the δ-FAPbI3 phase is removed in composition No. 36 when the samples are annealed at 150 °C. Moving away from pure iodine compounds (x ≥ 1/6), no δ-phases are detected, with the exception of the Cs5/6FA1/6PbBr1/2I5/2 (No. 9) composition and unknown phase for No. 44–46. Interestingly, the δ-CsPbI3 phase still exists for Cs-rich compositions (e.g. No. 29) with I− as the exclusive X-site halide even though it is annealed at 150 °C (Fig. S31C, ESI†). There is no appearance of the δ-phase in No. 30 (Cs2/6FA4/6PbBr1/2I5/2) with the incorporation of Br− compared with No. 29 (Cs1/6FA5/6PbI3) even when annealed at 65 °C (Fig. 6A). Thus, the thermodynamic stability of the perovskite material itself at room temperature is critical to its properties. Concerning the optical and crystallographic properties for solar cell applications, the optimal Br ratio needs to include an analysis of the trade-off between the opposing effects, i.e., the widening of the bandgap and the enhanced structural stability, which we believe is in the compositions No. 36 and 37.
Conclusions
Through the systematic exploration of the MA-free CsyFA1−yPb(BrxI1−x)3 compositional space, we have revealed the structure–property relationships by combining crystallographic and optoelectronic characterization. We qualitatively discussed the correlation between the Goldschmidt tolerance factor and the experimentally identified crystal structures. We showed that Cs-rich compositions exhibit significant phase separation into the perovskite phase and the non-perovskite δ-phase alongside poor surface morphology, which resulted in low efficiencies once the layers were incorporated into full solar cell stacks. However, there are indications that lower symmetries alone in Cs-rich perovskites lead to lower open-circuit voltages, which is indicative of increased recombination dynamics. In I-rich perovskite compositions, it was found that the bandgap, phase purity and surface morphology of the perovskite phase dominate the performance. Of the explored perovskite compositions, Cs1/6FA5/6PbI3 and Cs1/6FA5/6PbBr1/2I5/2 yield the highest efficiency values and operational stability, showing the greatest promise as materials for optoelectronic devices. A concomitant tuning of the charge selective layers for proper energy level alignment to these optimized perovskites may be required in future applications. This work highlights the significance of compositional design for improving the optoelectronic performance of perovskite films, and shows how analysis of the structure–property relationships for a class of materials can be used to provide deeper insight into their optoelectronic properties.Conflicts of interest
There are no conflicts to declare.Acknowledgements
This work was performed in part at the Georgia Tech Institute for Electronics and Nanotechnology, a member of the National Nanotechnology Coordinated Infrastructure (NNCI), which is supported by the National Science Foundation (Grant ECCS-1542174). J. P. C. B., Y. A., C. A. R. P., J. H., A. F. C. M., and J. N. V. thank Georgia Institute of Technology for the financial support. Y. A. thanks the financial support from China Scholarship Council (CSC) fellowship (No. 201906250003). W.A.S. acknowledge support from U.S. National Science Foundation (Award No. CSSI-2003808). Also, we are grateful for computing time provided in part by the Pittsburgh Center for Research Computing (CRC) resources at the University of Pittsburgh. X. L. and S. W. acknowledge financial support from the National Science Foundation of China (No. 21676188). This research used CMS beamline of the National Synchrotron Light Source II, a U.S. Department of Energy (DOE) Office of Science User Facility operated for the DOE Office of Science by Brookhaven National Laboratory under Contract No. DE-SC0012704.References
- A. Kojima, K. Teshima, Y. Shirai and T. Miyasaka, J. Am. Chem. Soc., 2009, 131, 6050–6051 CrossRef CAS PubMed.
- H. Min, D. Y. Lee, J. Kim, G. Kim, K. S. Lee, J. Kim, M. J. Paik, Y. K. Kim, K. S. Kim, M. G. Kim, T. J. Shin and S. Il Seok, Nature, 2021, 598, 444–450 CrossRef CAS PubMed.
- S. Rühle, Sol. Energy, 2016, 130, 139–147 CrossRef.
- M. Saliba, T. Matsui, J.-Y. Y. Seo, K. Domanski, J.-P. P. Correa-Baena, M. K. Nazeeruddin, S. M. Zakeeruddin, W. Tress, A. Abate, A. Hagfeldt and M. Grätzel, Energy Environ. Sci., 2016, 9, 1989–1997 RSC.
- J. P. Correa-Baena, M. Saliba, T. Buonassisi, M. Grätzel, A. Abate, W. Tress and A. Hagfeldt, Science, 2017, 358, 739–744 CrossRef CAS PubMed.
- K. Xiao, R. Lin, Q. Han, Y. Hou, Z. Qin, H. T. Nguyen, J. Wen, M. Wei, V. Yeddu, M. I. Saidaminov, Y. Gao, X. Luo, Y. Wang, H. Gao, C. Zhang, J. Xu, J. Zhu, E. H. Sargent and H. Tan, Nat. Energy, 2020, 5, 870–880 CrossRef CAS.
- J. Xu, C. C. Boyd, Z. J. Yu, A. F. Palmstrom, D. J. Witter, B. W. Larson, R. M. France, J. Werner, S. P. Harvey, E. J. Wolf, W. Weigand, S. Manzoor, M. F. A. M. Van Hest, J. J. Berry, J. M. Luther, Z. C. Holman and M. D. McGehee, Science, 2020, 367, 1097–1104 CrossRef CAS PubMed.
- D. P. McMeekin, G. Sadoughi, W. Rehman, G. E. Eperon, M. Saliba, M. T. Hörantner, A. Haghighirad, N. Sakai, L. Korte, B. Rech, M. B. Johnston, L. M. Herz and H. J. Snaith, Science, 2016, 351, 151–155 CrossRef CAS PubMed.
- R. E. Beal, D. J. Slotcavage, T. Leijtens, A. R. Bowring, R. A. Belisle, W. H. Nguyen, G. F. Burkhard, E. T. Hoke and M. D. McGehee, J. Phys. Chem. Lett., 2016, 7, 746–751 CrossRef CAS PubMed.
- J. J. Yoo, G. Seo, M. R. Chua, T. G. Park, Y. Lu, F. Rotermund, Y.-K. K. Kim, C. S. Moon, N. J. Jeon, J.-P. P. Correa-Baena, V. Bulović, S. S. Shin, M. G. Bawendi and J. Seo, Nature, 2021, 590, 587–593 CrossRef CAS PubMed.
- B. Conings, J. Drijkoningen, N. Gauquelin, A. Babayigit, J. D’Haen, L. D’Olieslaeger, A. Ethirajan, J. Verbeeck, J. Manca, E. Mosconi, F. De Angelis and H. G. Boyen, Adv. Energy Mater., 2015, 5, 1–8 Search PubMed.
- J. H. Noh, S. H. Im, J. H. Heo, T. N. Mandal and S. Il Seok, Nano Lett., 2013, 13, 1764–1769 CrossRef CAS PubMed.
- E. T. Hoke, D. J. Slotcavage, E. R. Dohner, A. R. Bowring, H. I. Karunadasa and M. D. McGehee, Chem. Sci., 2015, 6, 613–617 RSC.
- S. J. Yoon, M. Kuno and P. V. Kamat, ACS Energy Lett., 2017, 2, 1507–1514 CrossRef CAS.
- C. G. Bischak, C. L. Hetherington, H. Wu, S. Aloni, D. F. Ogletree, D. T. Limmer and N. S. Ginsberg, Nano Lett., 2017, 17, 1028–1033 CrossRef CAS PubMed.
- S. Mahesh, J. M. Ball, R. D. J. Oliver, D. P. McMeekin, P. K. Nayak, M. B. Johnston and H. J. Snaith, Energy Environ. Sci., 2020, 13, 258–267 RSC.
- S. M. Yoon, H. Min, J. B. Kim, G. Kim, K. S. Lee and S. Il Seok, Joule, 2021, 5, 183–196 CrossRef CAS.
- J. J. Yoo, G. Seo, M. R. Chua, T. G. Park, Y. Lu, F. Rotermund, Y. K. Kim, C. S. Moon, N. J. Jeon, J. P. Correa-Baena, V. Bulović, S. S. Shin, M. G. Bawendi and J. Seo, Nature, 2021, 590, 587–593 CrossRef CAS PubMed.
- G. E. Eperon, S. D. Stranks, C. Menelaou, M. B. Johnston, L. M. Herz and H. J. Snaith, Energy Environ. Sci., 2014, 7, 982–988 RSC.
- H. Min, M. Kim, S. U. Lee, H. Kim, G. Kim, K. Choi, J. H. Lee and S. Il Seok, Science, 2019, 366, 749–753 CrossRef CAS PubMed.
- M. Saliba, T. Matsui, K. Domanski, J. Y. Seo, A. Ummadisingu, S. M. Zakeeruddin, J. P. Correa-Baena, W. R. Tress, A. Abate, A. Hagfeldt and M. Grätzel, Science, 2016, 354, 206–209 CrossRef CAS PubMed.
- G. Kieslich, S. Sun and A. K. Cheetham, Chem. Sci., 2014, 5, 4712–4715 RSC.
- G. E. Eperon, G. M. Paternò, R. J. Sutton, A. Zampetti, A. A. Haghighirad, F. Cacialli and H. J. Snaith, J. Mater. Chem. A, 2015, 3, 19688–19695 RSC.
- N. J. Jeon, J. H. Noh, W. S. Yang, Y. C. Kim, S. Ryu, J. Seo and S. Il Seok, Nature, 2015, 517, 476–480 CrossRef CAS PubMed.
- C. C. Stoumpos, C. D. Malliakas and M. G. Kanatzidis, Inorg. Chem., 2013, 52, 9019–9038 CrossRef CAS PubMed.
- Z. Li, M. Yang, J. S. Park, S. H. Wei, J. J. Berry and K. Zhu, Chem. Mater., 2016, 28, 284–292 CrossRef CAS.
- K. A. Bush, K. Frohna, R. Prasanna, R. E. Beal, T. Leijtens, S. A. Swifter and M. D. McGehee, ACS Energy Lett., 2018, 3, 428–435 CrossRef CAS.
- A. Binek, F. C. Hanusch, P. Docampo and T. Bein, J. Phys. Chem. Lett., 2015, 6, 1249–1253 CrossRef CAS PubMed.
- T. Jesper Jacobsson, J. P. Correa-Baena, M. Pazoki, M. Saliba, K. Schenk, M. Grätzel and A. Hagfeldt, Energy Environ. Sci., 2016, 9, 1706–1724 RSC.
- G. Niu, H. Yu, J. Li, D. Wang and L. Wang, Nano Energy, 2016, 27, 87–94 CrossRef CAS.
- W. Rehman, D. P. McMeekin, J. B. Patel, R. L. Milot, M. B. Johnston, H. J. Snaith and L. M. Herz, Energy Environ. Sci., 2017, 10, 361–369 RSC.
- J. W. Lee, D. H. Kim, H. S. Kim, S. W. Seo, S. M. Cho and N. G. Park, Adv. Energy Mater., 2015, 5, 1501310 CrossRef.
- C. Yi, J. Luo, S. Meloni, A. Boziki, N. Ashari-Astani, C. Grätzel, S. M. Zakeeruddin, U. Röthlisberger and M. Grätzel, Energy Environ. Sci., 2016, 9, 656–662 RSC.
- W. Rehman, R. L. Milot, G. E. Eperon, C. Wehrenfennig, J. L. Boland, H. J. Snaith, M. B. Johnston and L. M. Herz, Adv. Mater., 2015, 27, 7938–7944 CrossRef CAS PubMed.
- J. P. Correa-Baena, Y. Luo, T. M. Brenner, J. Snaider, S. Sun, X. Li, M. A. Jensen, N. T. P. Hartono, L. Nienhaus, S. Wieghold, J. R. Poindexter, S. Wang, Y. S. Meng, T. Wang, B. Lai, M. V. Holt, Z. Cai, M. G. Bawendi, L. Huang, T. Buonassisi and D. P. Fenning, Science, 2019, 363, 627–631 CrossRef CAS.
- G. Kim, H. Min, K. S. Lee, D. Y. Lee, S. M. Yoon and S. Il Seok, Science, 2020, 370, 108–112 CrossRef CAS.
- R. D. Shannon, Acta Crystallogr., Sect. A: Cryst. Phys., Diffr., Theor. Gen. Crystallogr., 1976, 32, 751–767 CrossRef.
- Y. An, J. Hidalgo, C. A. R. Perini, A.-F. Castro-Méndez, J. N. Vagott, K. Bairley, S. Wang, X. Li and J.-P. Correa-Baena, ACS Energy Lett., 2021, 1942–1969 CrossRef CAS.
- J. A. Vigil, A. Hazarika, J. M. Luther and M. F. Toney, ACS Energy Lett., 2020, 5, 2475–2482 CrossRef CAS.
- Q. Zhao, A. Hazarika, L. T. Schelhas, J. Liu, E. A. Gaulding, G. Li, M. Zhang, M. F. Toney, P. C. Sercel and J. M. Luther, ACS Energy Lett., 2020, 5, 238–247 CrossRef CAS.
- R. E. Beal, N. Z. Hagström, J. Barrier, A. Gold-Parker, R. Prasanna, K. A. Bush, D. Passarello, L. T. Schelhas, K. Brüning, C. J. Tassone, H. G. Steinrück, M. D. McGehee, M. F. Toney and A. F. Nogueira, Matter, 2020, 2, 207–219 CrossRef.
- B. Charles, M. T. Weller, S. Rieger, L. E. Hatcher, P. F. Henry, J. Feldmann, D. Wolverson and C. C. Wilson, Chem. Mater., 2020, 32, 2282–2291 CrossRef CAS.
- J. A. Vigil, A. Hazarika, J. M. Luther and M. F. Toney, ACS Energy Lett., 2020, 5, 2475–2482 CrossRef CAS.
- B. Zhao, S. F. Jin, S. Huang, N. Liu, J. Y. Ma, D. J. Xue, Q. Han, J. Ding, Q. Q. Ge, Y. Feng and J. S. Hu, J. Am. Chem. Soc., 2018, 140, 11716–11725 CrossRef CAS PubMed.
- A. Marronnier, G. Roma, S. Boyer-Richard, L. Pedesseau, J.-M. M. Jancu, Y. Bonnassieux, C. Katan, C. C. Stoumpos, M. G. Kanatzidis and J. Even, ACS Nano, 2018, 12, 3477–3486 CrossRef CAS PubMed.
- J. A. Steele, H. Jin, I. Dovgaliuk, R. F. Berger, T. Braeckevelt, H. Yuan, C. Martin, E. Solano, K. Lejaeghere, S. M. J. Rogge, C. Notebaert, W. Vandezande, K. P. F. Janssen, B. Goderis, E. Debroye, Y. K. Wang, Y. Dong, D. Ma, M. Saidaminov, H. Tan, Z. Lu, V. Dyadkin, D. Chernyshov, V. Van Speybroeck, E. H. Sargent, J. Hofkens and M. B. J. Roeffaers, Science, 2019, 365, 679–684 CrossRef CAS PubMed.
- M. Rodová, J. Brožek, K. Knížek and K. Nitsch, J. Therm. Anal. Calorim., 2003, 71, 667–673 CrossRef.
- M. Zhang, Z. Zheng, Q. Fu, Z. Chen, J. He, S. Zhang, L. Yan, Y. Hu and W. Luo, CrystEngComm, 2017, 19, 6797–6803 RSC.
- E. C. Schueller, G. Laurita, D. H. Fabini, C. C. Stoumpos, M. G. Kanatzidis and R. Seshadri, Inorg. Chem., 2018, 57, 695–701 CrossRef CAS PubMed.
- A. Boziki, D. J. Kubicki, A. Mishra, S. Meloni, L. Emsley, M. Grätzel and U. Rothlisberger, Chem. Mater., 2020, 32, 2605–2614 CrossRef CAS.
- T. Tadano and S. Tsuneyuki, Phys. Rev. B: Condens. Matter Mater. Phys., 2015, 92, 054301 CrossRef.
- W. A. Saidi and J. J. Choi, J. Chem. Phys., 2016, 145, 144702 CrossRef PubMed.
- H. Li, G. Wu, W. Li, Y. Zhang, Z. Liu, D. Wang and S. Liu, Adv. Sci., 2019, 6, 1901241 CrossRef CAS PubMed.
- A. F. Castro-Méndez, J. Hidalgo and J. P. Correa-Baena, Adv. Energy Mater., 2019, 9, 1901489 CrossRef.
- S. Zhang, H. Liu, X. Li and S. Wang, Nano Energy, 2020, 77, 105302 CrossRef CAS.
- V. K. Ravi, G. B. Markad and A. Nag, ACS Energy Lett., 2016, 1, 665–671 CrossRef CAS.
- R. Prasanna, A. Gold-Parker, T. Leijtens, B. Conings, A. Babayigit, H. G. Boyen, M. F. Toney and M. D. McGehee, J. Am. Chem. Soc., 2017, 139, 11117–11124 CrossRef CAS PubMed.
- X. Zhu, Q. Su, W. Feng and F. Li, Chem. Soc. Rev., 2017, 46, 1025–1039 RSC.
- J. Yang, X. Wen, H. Xia, R. Sheng, Q. Ma, J. Kim, P. Tapping, T. Harada, T. W. Kee, F. Huang, Y.-B. Cheng, M. Green, A. Ho-Baillie, S. Huang, S. Shrestha, R. Patterson and G. Conibeer, Nat. Commun., 2017, 8, 1–9 CrossRef PubMed.
- A. Granados del Águila, T. T. H. Do, J. Xing, W. J. Jee, J. B. Khurgin and Q. Xiong, Nano Res., 2020, 13, 1962–1969 CrossRef.
- J. Hidalgo, C. A. R. R. Perini, A.-F. F. Castro-Mendez, D. Jones, H. Köbler, B. Lai, R. Li, S. Sun, A. Abate and J.-P. P. Correa-Baena, ACS Energy Lett., 2020, 5, 3526–3534 CrossRef CAS.
- M. I. Saidaminov, J. Kim, A. Jain, R. Quintero-Bermudez, H. Tan, G. Long, F. Tan, A. Johnston, Y. Zhao, O. Voznyy and E. H. Sargent, Nat. Energy, 2018, 3, 648–654 CrossRef CAS.
- R. He, S. Ren, C. Chen, Z. Yi, Y. Luo, H. Lai, W. Wang, G. Zeng, X. Hao, Y. Wang, J. Zhang, C. Wang, L. Wu, F. Fu and D. Zhao, Energy Environ. Sci., 2021, 14, 5723–5759 RSC.
- M. Jošt, L. Kegelmann, L. Korte and S. Albrecht, Adv. Energy Mater., 2020, 10, 1904102 CrossRef.
- S. Masi, A. F. Gualdrón Reyes and I. Mora-Seró, ACS Energy Lett., 2020, 5, 1974–1985 CrossRef CAS.
Footnote |
| † Electronic supplementary information (ESI) available. See DOI: 10.1039/d1ee02691g |
| This journal is © The Royal Society of Chemistry 2021 |