
 Open Access Article
 This Open Access Article is licensed under a
 Creative Commons Attribution 3.0 Unported Licence
Abnormal spatial heterogeneity governing the charge-carrier mechanism in efficient Ruddlesden–Popper perovskite solar cells†
Jun
Xi‡
 *ab,
Junseop
Byeon‡
ac,
Unsoo
Kim‡
ac,
Kijoon
Bang‡
ac,
Gi Rim
Han
d,
Ji-Young
Kim
e,
Jungjin
Yoon
f,
Hua
Dong
g,
Zhaoxin
Wu
g,
Giorgio
Divitini
h,
Kai
Xi
h,
Jinwoo
Park
i,
Tae-Woo
Lee
ij,
Seong Keun
Kim
d,
Mansoo
Choi
ac and
Jong Woo
Lee
*k
*ab,
Junseop
Byeon‡
ac,
Unsoo
Kim‡
ac,
Kijoon
Bang‡
ac,
Gi Rim
Han
d,
Ji-Young
Kim
e,
Jungjin
Yoon
f,
Hua
Dong
g,
Zhaoxin
Wu
g,
Giorgio
Divitini
h,
Kai
Xi
h,
Jinwoo
Park
i,
Tae-Woo
Lee
ij,
Seong Keun
Kim
d,
Mansoo
Choi
ac and
Jong Woo
Lee
*k
aGlobal Frontier Center for Multiscale Energy Systems, Seoul National University, Seoul 08826, Republic of Korea. E-mail: j.xi@rug.nl
bZernike Institute for Advanced Materials, University of Groningen, Nijenborgh 4, 9747 AG Groningen, The Netherlands
cDepartment of Mechanical and Aerospace Engineering, Seoul National University, Seoul 08826, Republic of Korea
dDepartment of Chemistry, Seoul National University, Seoul 08826, Republic of Korea
eAdvanced Analysis Center, Korea Institute of Science and Technology (KIST), Hwarangno 14-gil 5, Seongbuk-gu, Seoul 02792, Republic of Korea
fMaterials Research Institute, Pennsylvania State University, University Park, PA 16802, USA
gSchool of Electronic and Information Engineering, Xi’an Jiaotong University, No. 28, Xianning West Road, Xi’an, 710049, China
hDepartment of Materials Science and Metallurgy, University of Cambridge, Cambridge CB3 0FS, UK
iDepartment of Materials Science and Engineering, Research Institute of Advanced Materials, and Institute of Engineering Research, Nano Systems Institute (NSI), Seoul National University, 1 Gwanak-ro, Gwanak-gu, Seoul 08826, Republic of Korea
jSchool of Chemical and Biological Engineering, Seoul National University, Seoul 08826, Republic of Korea
kDepartment of Chemistry, Myongji University, 116 Myongji Ro, Yongin, Gyeonggi-do, 17058, Republic of Korea. E-mail: iamljw7@gmail.com
First published on 26th July 2021
Abstract
Layered Ruddlesden–Popper perovskite (RPP) photovoltaics have gained substantial attention owing to their excellent air stability. However, their photovoltaic performance is still limited by the unclear real-time charge-carrier mechanism of operating devices. Herein, we report the correlation between the charge-carrier mechanism and the spatially heterogeneous RPP bulks induced by distinct sublattice cations in the state-of-the-art antisolvent-driven RPP devices. In particular, abnormal heterogeneities ranging from the lateral long-range to local sub-grain scale and corresponding charge-carrier behaviours are visualized for triple-cation RPPs. We discovered that such heterogeneities with a unitary 2D/3D hybrid suppress lattice vibrations and reduce Fröhlich interactions by about 2 times, significantly promoting charge-carrier dynamics. Consequently, optimized triple-cation RPP solar cells greatly outperform their mono-cation counterparts. Furthermore, this principle can be applicable irrespective of 2D layer thickness (n > 2) and substrate type. This work provides a rationale for leveraging a disordered structure to stimulate charge-carrier motion and suggests the design principle of low-dimensional perovskites.
Broader contextSolar cells using layered Ruddlesden–Popper perovskites (RPPs) as active layers have demonstrated promising long-term stability to approach industrial application. Different from the traditional phase-pure three dimensional perovskites, the peculiar spatial heterogeneous phases within RPPs make the charge-carrier mechanism ambiguous especially when the device is working. Here, we demonstrate a systematic way to tune and understand the correlation between the charge-carrier mechanism and the spatial heterogeneities in efficient RPP solar cells. We visualized the presence of abnormal heterogeneities from the lateral long-range to local sub-grain scale with a unitary 2D/3D hybrid, which contributed to an improved charge-carrier dynamics with reduced Fröhlich interactions in triple-cation RPPs. Such principle can enhance device performance irrespective of 2D layer thickness (n > 2) and substrate type. The designed spatial heterogeneities offer unique opportunities to advance the layered RPP devices. |
Introduction
Organic–inorganic perovskites have emerged as promising alternatives to traditional photovoltaic semiconductors,1–8 owing to their excellent optoelectronic properties.9–12 Despite the substantial progress in device performance using perovskites, the stability issue has not been resolved yet. This can be attributed to their high ionic mobility and the related ion migration.13–15Two-dimensional (2D) perovskites have been recently reinvestigated to address the instability against open air, which entails the introduction of bulky ammonium cations along certain crystal planes.16–19 Bulky organic spacers allow less ion migration between crystal planes to stabilize devices.20 In addition, 2D layer can modify 3D perovskite surface to adjust interfacial energy level, thus favoring for higher device efficiency.21 Ruddlesden–Popper phases (RPPs) are the most prevalent 2D structures with a general formula of (A)2(B)n−1PbnI3n+1, where A is a bulky ammonium cation, B is a small cation and n is the number of [PbI6]4− units.17,22,23 Theoretically, an ordered quantum well regime in RPPs imposes strong in-plane exciton binding energies and limits charge transport in solar cells.24,25
To achieve a high efficiency in RPP photovoltaics, investigating reproducible lattice compositions at the molecular level and understanding the underlying operando mechanism at the device level are prerequisite. Hot-casting methods have been proposed to overcome the limited charge transport and achieve efficient RPP solar cells.22 However, production up-scaling and reproducibility still remain challenging due to the difficulty of pure stoichiometric polycrystalline RPP film formation, where a 2D/3D hybrid forms inevitably.25,26 To this end, efforts have been dedicated to produce and regulate RPP phases without hot-casting, such as antisolvent methods.27–30 In addition, the lessons learned from traditional 3D perovskites suggest that triple cation lattices possess an enhanced structural stability and improved charge-carrier dynamics. In this scenario, the triple cation engineering is expected to be a reproducible way to control over the RPP lattices by antisolvents.31–33 Importantly, energy transfer from low- to high-dimensional phase was suggested to be responsible for the charge-carrier mechanism in the fabricated RPP films.34–37 Nevertheless, such measurements only limited to RPP films cannot fully address the correlation between the charge-carrier mechanism and spatial phase heterogeneity in a real device. The mechanism of energy transfer, both between separate grains and within a grain, remains unclear for efficient RPP solar cells. Thus, the fundamental understanding of RPP solar cells severely lags behind the continuously improving device efficiency.
In this study, we identify and further investigate the fundamental correlation between the charge-carrier mechanism and spatial perovskite heterogeneity in efficient antisolvent-driven RPP devices. Here, triple-cation-based RPPs (henceforth referred to as CsFMRP) and mono-cation-CH3NH3+-based ones (denoted as MRP) were employed to allow diverse spatial hierarchical compositions. During device operation, real-time visualisation of the spatial charge-carrier distribution and local phase verified an abnormal heterogeneity with a unitary 2D (n = 3)/3D hybrid, from the lateral long-range to local sub-grain scales, in bulk CsFMRP. Furthermore, the observed 3D-like phases arising from the sub-grains governed the charge-carrier collection of the corresponding device. In contrast, the MRP devices exhibited a complex behaviour assisted by multiple 2D-like phases (hybrid low dimensional perovskite with various n values) together with limited 3D-like phases. Such abnormal heterogeneity in CsFMRP was proven to suppress lattice vibrations, thereby lowering carrier–lattice interactions. We discovered that the heterogeneity can enhance device efficiency irrespective of the choice of 2D layers (n > 2) and substrate type. Accordingly, an optimal solar cell efficiency of 16.15% was achieved using CsFMRP (n = 4). Our findings offer a fundamental perspective on the charge-carrier mechanism in highly efficient RPP solar cells.
Results and discussions
Herein, RPPs with 2-phenylethylammonium (PEA) were investigated. Fig. 1a illustrates the unit lattice of CsFMRP (n = 4), inspired by the superior lattice stability of 3D prototypes.31,32 The solar cells fabricated here are based on the p–i–n inverted structure of indium tin oxide (ITO; ∼150 nm)/poly(bis(4-phenyl)(2,4,6-trimethylphenyl)amine) (PTAA; ∼8 nm)/RPP/C60 (20 nm)/bathocuproine (BCP; 6 nm)/Cu (80 nm).38 We adopted an antisolvent dripping method to assemble the RPP films (Fig. 1b), whose details are presented in the Methods (ethyl acetate was found to be the best for RPP fabrication (Fig. S1, ESI†)). | ||
| Fig. 1 (a) Crystal lattice unit of CsFMRP, where each green [PbI6]4− octahedron is surrounded by FA+ (blue sphere), MA+ (purple sphere), and Cs+ (silver sphere). (b) Fabrication process for antisolvent-driven CsFMRP films. Real-time charge-carrier mechanism studied via (c) secondary electron SEM and (d) corresponding EBIC measurements of cross-sectional images of a typical efficient p–i–n solar cell device with CsFMRP (scale bar: 600 nm). Inset in (c) is an illustration of the device structure and (d) the depth profile of EBIC signals in selected regions. Sub-grain heterogeneities observed by HRTEM and the corresponding FFT at the (e) top, (f) centre, and (g) bottom regions (scale bar: 20 nm). (h) TEM image and corresponding EDS maps of selected elements (scale bar: 20 nm). | ||
First, we aim to understand the real-time charge-carrier behaviour and its dependence on the crystal phases in working RPP devices. Electron-beam-induced current (EBIC) was used in situ to drive the device operation and generate charge-carriers.39–42 Regarding EBIC, an electron beam locally excites electron–hole pairs with a high spatial resolution (<100 nm), which then either recombine or are collected at the electrodes.39 This allows building a two-dimensional map that highlights grain-scale charge transport properties. Fig. 1c and d present the scanning electron microscopy (SEM) and the corresponding real-time EBIC cross-sectional images of a typical working CsFMRP solar cell. The respective insets illustrate the device structure and the depth profile of the EBIC current. The EBIC map clearly exhibits a lateral long-range heterogeneous distribution of current signals along the bulk CsFMRP, where domains corresponding to strong local currents were discretely located. Notably, in these high-current domains, a well-defined p–i–n heterojunction was typically formed (highlighted by the depth profiles of EBIC signals from Fig. 1d), where CsFMRP was identified as an intrinsic semiconductor with bipolar properties considering the fixed charge transport layers39,42 This contrasts with the homogeneous electron generation in 3D perovskite devices, identifiable via a more consistent contrast in EBIC maps (Fig. S2, ESI†). The more flat EBIC profile in 3D perovskite devices can be attributed to the longer diffusion length of carriers,39 while the central dominant EBIC profile in CsFMRP devices is likely due to 2D-like phases progressively diminishing the carrier diffusion.25 Moreover, no clear EBIC signals in the working MRP devices (Fig. S2, ESI†) were observed, suggesting ultralow electron densities. These differences implied that some “hot” phases in CsFMRP are associated with the high-current domains, whereas such phases are seldomly observed in MRP devices.
To verify the presence of the “hot” phases (labeled as boxes) observed with EBIC and understand their relation to local heterogeneity,43,44 focused ion beam assisted high-resolution transmission electron microscopy (FIB-HRTEM) was performed. Fig. S3 (ESI†) shows the cross-sectional TEM images of the devices corresponding to different RPPs. The bright-field and dark-field low-magnification images of the CsFMRP sample showed local anomalous domains, which appeared in sharp contrast to the other uniform grains. These observed uneven domains appear to match the particular “hot” phases observed via EBIC. To verify our hypothesis, the uneven domains were magnified to resolve the fine sub-structures. Notably, the local sub-grains of the CsFMRP domain seemed more heterogeneous than those of the MRP domain. Fast Fourier transform (FFT) patterns were then obtained to highlight the local sub-grain heterogeneity, as shown in Fig. 1e–g. Three major conclusions were derived from these findings. First, the sub-grain near the top surface was the most heterogeneous. In addition to the specific (111) diffraction peak (d-spacing = 6.18 Å) of 3D-like (large-n) phases, other diffraction patterns were observed owing to the presence of multiple overlapping 2D domains. Second, around the central sub-grain, sharp diffraction spots indexed to the (111) and (202) planes were observed around the central sub-grain, implying highly crystalline 3D-like phases. Notably, a semi-circular (111) diffraction pattern indicated the preferred crystal orientation. Third, at the bottom sub-grain, a series of parallel 2D (n = 3) diffraction features with periodic (0k0) planes were observed. Additionally, compared to those observed near the central domain, the 2D diffraction spots were more elongated because of higher lattice strain produced by the overlapping bulk crystals.43 The HRTEM results clearly revealed that the local sub-grain heterogeneity corresponding to 3D-like phases causes the strong real-time current domains of CsFMRP devices. Besides, a unitary 2D (n = 3)/3D hybrid emerges to dominate the CsFMRP bulks.
To further examine the local sub-grain heterogeneity, electron dispersive X-ray spectroscopy (EDS) mapping was employed. The elemental ratios of typical 3D-like and 2D-like phases are given in Table S1 (ESI†), where 3D-like regions show higher ratios of Cs and I, whereas 2D-like regions show a higher ratio of C. Fig. 1h shows the TEM image and corresponding EDS elemental maps of a cross-sectional “hot” domain. Interestingly, a small 3D-like striped sub-grain was embedded near the top surface, and a broad 3D-like rectangular sub-grain with an area of approximately 90 × 120 nm2 was centrally located. In other areas, 2D-like phases were dominant. The classification of phases via elemental analysis agreed well with the phases identified via HRTEM-FFT patterns, clearly verifying the local sub-grain 2D/3D heterogeneity of the “hot” domain where 3D-like phases dominated around the center. In addition, the low magnified TEM and EDS elemental maps (Fig. S4, ESI†) indicated the “dark” domains of EBIC signals should correspond to 2D-like phases (n = 3). In contrast, the area within the MRP crystal grains was almost composed of broadly distributed multiple 2D-like phases (Fig. S5, ESI†). However, such small 3D-like sub-grains generated negligible EBIC signals because the energy transfer to these phases is likely not allowed (see below spectral discussion). Hence, we attributed the extremely overall low EBIC signals measured in MRP devices to the predominance of the multiple 2D-like phases, instead of the absence of the 3D-like phases.
Despite the spatial heterogeneity from the lateral long-range to local sub-grain scale, the “hot” domain within the bulk CsFMRP exhibited excellent charge-carrier extraction during device operation. The statistical deviations of photovoltaic parameters of solar cells fabricated using antisolvent-driven RPPs are summarized in Fig. 2a–d and Table S2 (ESI†). All parameters of the CsFMRP devices were superior to those of the MRP references, indicating improved exciton dissociation and charge-carrier dynamics in CsFMRP films. Notably, the CsFMRP devices showed the smaller statistical distribution of the parameters (especially n = 4), likely originating from efficient energy transfer from 2D- to 3D-like phases (discussed later). The power law dependence factor α, the slope of the linear fit of short-circuit current density (Jsc) versus light intensity (Iint) (Fig. S6, ESI†), revealed higher charge collection efficiencies in CsFMRP especially when n > 2 (n = 2 appears to be limited due to emerging strong excitonic decay dominates the photogenerated species45). Fig. 2e shows current density–voltage (J–V) curves of the best device (CsFMRP; n = 4) with an excellent power conversion efficiency (PCE) of 16.15%. Notably, negligible hysteresis confirmed the genuine device performance. In addition, the scan rates did not significantly affect the PCE (Fig. S7, ESI†). The external quantum efficiency (EQE) spectrum of the best device (Fig. 2f) further confirmed the reliability of Jsc. The maximum power point tracking (MPP) obtained by applying the voltage at the maximum power point (Vmax = 0.97 V) showed almost no roll-off of the highest power output for 300 s (Fig. 2g). In addition, with respect to the long term light soaking stability, CsFMRP devices were comparable to 3D devices, but much better than MRP ones (Fig. S8, ESI†), revealing CsFMRP is an eligible photoactive candidate. We further proved the long-term moisture stability (∼50% humidity) of both 2D devices is comparable (Fig. S9, ESI†). This can be attributed to that the moisture resistant 2D-like phases positively protect the 3D-like ones. To best assess the device long-term operando stability under 1 Sun illumination, a reliable device encapsulation technology is encouraged to be exploited particularly for RPPs. Presently, there are only a few reports regarding RPP-based flexible devices.46 We successfully fabricated a flexible CsFMRP solar cell with an appreciable PCE of 11.5%, where little hysteresis can be found (Fig. S10, ESI†). This favourable result suggested that the substrate type is not crucial for the spatial charge-carrier behaviour. Hence, with rational spatial heterogeneities, excellent device performance could be achieved regardless of the n value (particularly n > 2) and substrate selection.
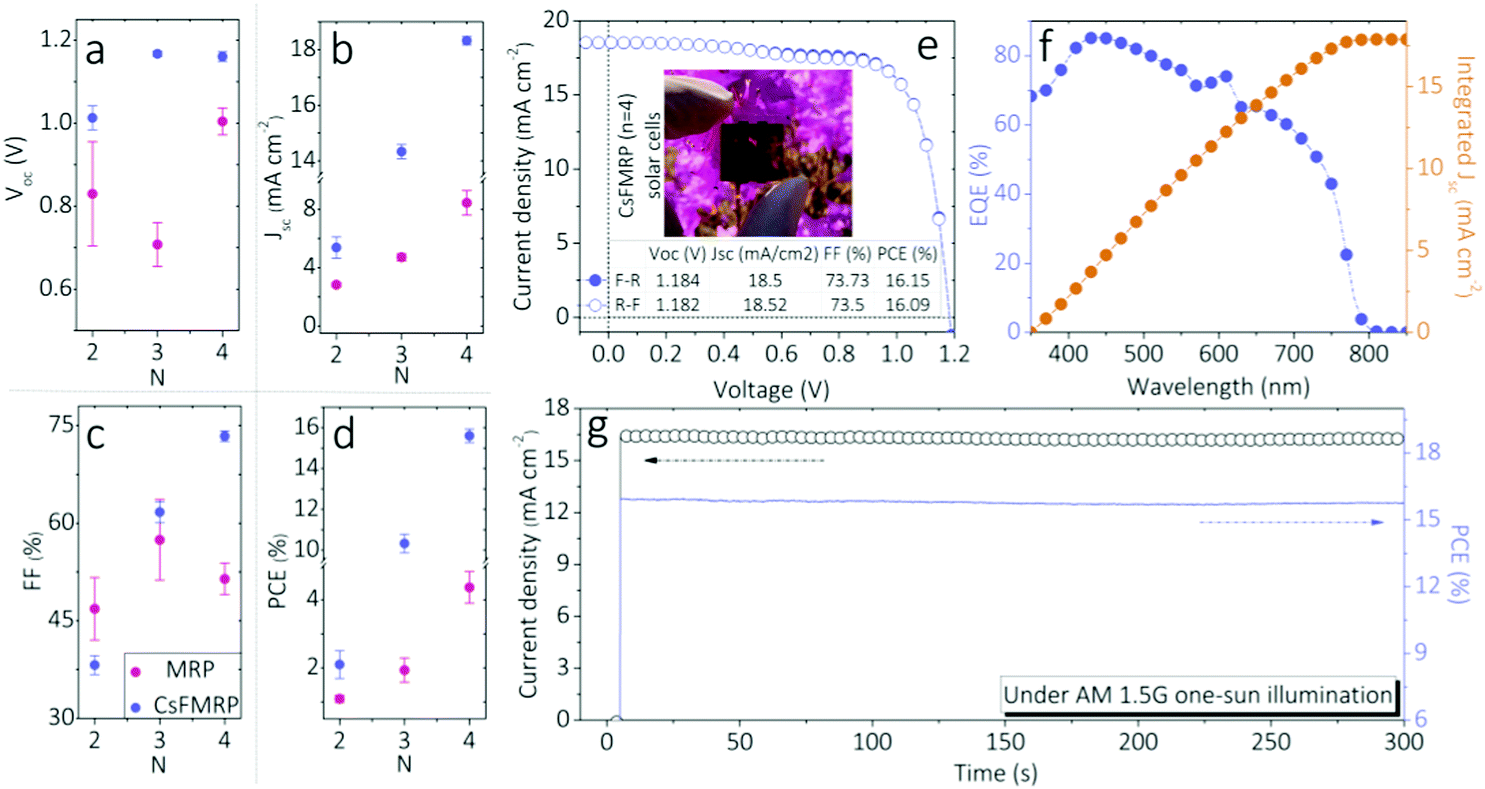 | ||
| Fig. 2 (a) Open circuit voltage (Voc); (b) short-circuit current density (Jsc); (c) fill factor (FF); and (d) power conversion efficiency (PCE) of ITO/PTAA/RPP/C60/BCP/Cu solar cells with either MRP (red points) or CsFMRP (purple points) as the RPP layer. Characterization of the best device using CsFMRP (n = 4): (e) J–V curves measured using a forward scan (F-R) and reverse scan (R-F), where the inset shows a photograph of the cell, (f) EQE spectra, and (g) stability of the output determined using MPP at 0.97 V as a function of time. | ||
We then investigated the charge-carrier dynamics of neat RPP films. Notably, large Voc deficits were observed in MRP devices (Fig. 3a), implying significant nonradiative exciton recombinations. By contrast, the Voc deficits for the CsFMRP devices were significantly smaller. Hence, the triple cation contributed to radiative exciton recombinations in RPPs. Fig. 3b shows the respective bandgaps (Eg), photoluminescence (PL) peaks, and correlated Stokes shifts between the Eg and PL peaks of both RPPs. The original UV-Vis absorption curves and PL spectra are given in Fig. S11 and S12 (ESI†), respectively. The CsFMRP series clearly exhibited lower Eg and PL values than the corresponding MRP materials, which is attributed to the considerable 3D-like sub-grains in the former. Importantly, the Stokes shifts of all CsFMRP materials were substantially smaller than those of the MRP group, indicating intrinsically higher radiative exciton recombination. This conclusion agreed well with that from the Voc deficits.
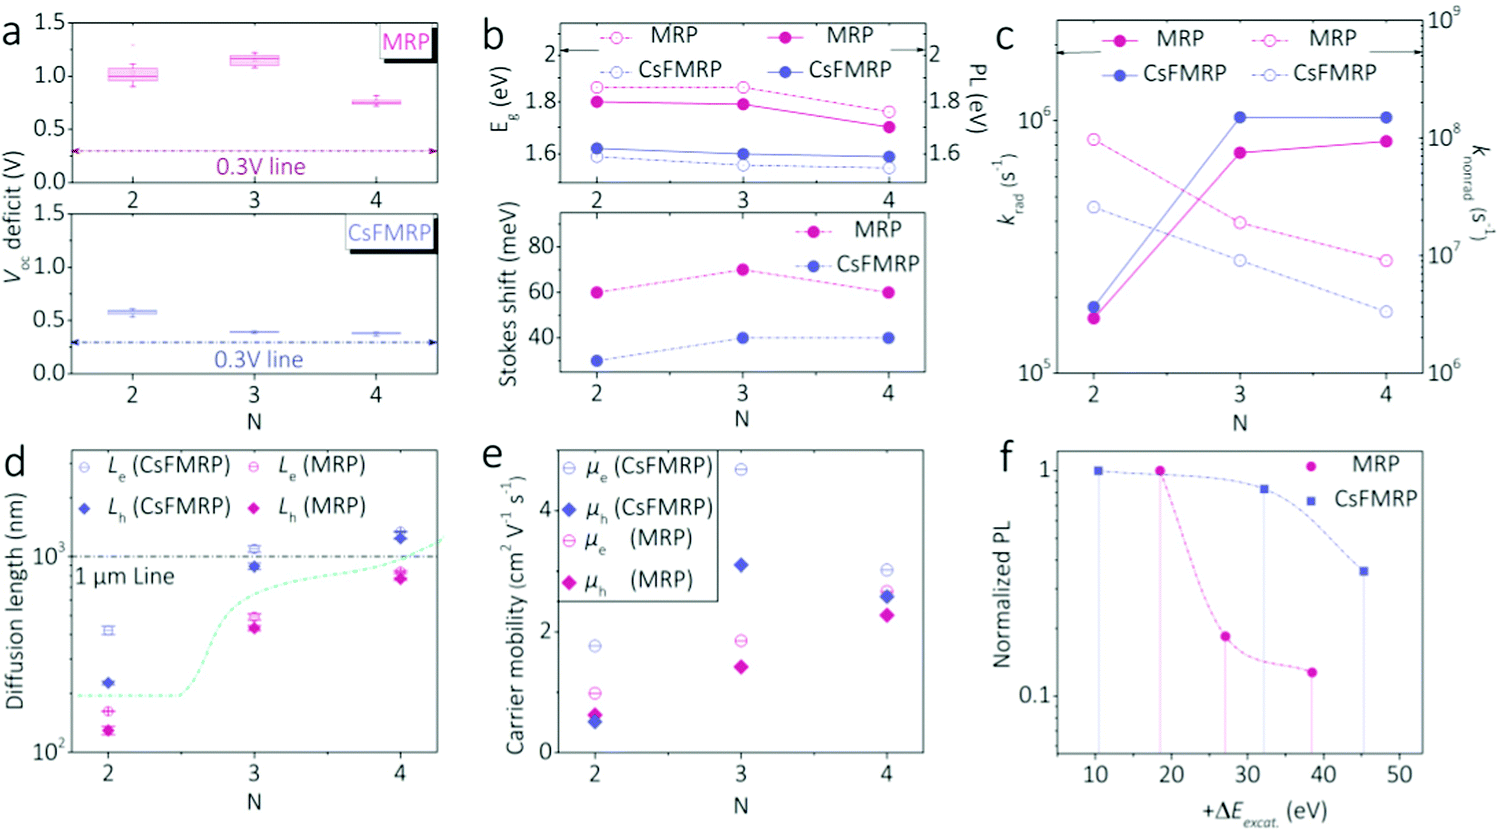 | ||
| Fig. 3 (a) Statistical Voc deficit of MRP and CsFMRP (n = 4) devices. (b) Bandgaps, PL energies, and the corresponding Stokes shifts of MRP and CsFMRP films (n = 2–4). Evaluation of the charge-carrier dynamics via the (c) radiative recombination rate (krad) and nonradiative recombination rate (knonrad), (d) charge-carrier diffusion length, and (e) mobility of MRP and CsFMRP films (n = 2–4). (f) Normalized PL intensity as a function of excess energy (+ΔEexcit) using on-gap excitation. | ||
To quantitatively understand the charge-carrier behaviour, the radiative (krad) and nonradiative recombination rates (knonrad) were evaluated together with PL quantum yields (see ESI;† PLQY in Table S3, ESI†) and are shown in Fig. 3c. As the n value increased, radiative recombination was enhanced owing to the creation of more free charge carriers. In addition, the triple cation significantly increased krad and decreased knonrad. These quantitative results verified improved radiative events in CsFMRP, reflected by the reduced Voc deficits and Stokes shifts. The difference may also be related to the lower density of trap states in CsFMRP (Fig. S14, ESI†).
The diffusion lengths (L) and mobilities (μ) of the charge carriers are affected by recombination mechanisms. We analyzed L and μ using 1D diffusion models and Einstein equations (see ESI†).37 As shown in Fig. 3d and e, CsFMRP exhibited higher L and μ for both electrons (e) and holes (h) compared to MRP materials. For n = 4, the charge-carrier transport was the most balanced, with a bipolar diffusion length exceeding 1 μm. These findings agreed with the superior charge carrier dynamics in the bulk CsFMRP. In bulk RPPs, the well-known energy transfer is involved in the charge-carrier dynamics.34–37 The validated spatial heterogeneity can strongly affect the energy landscape, where excited charge-carriers in 2D-like domains relax to band edges in 3D-like phases via Förster and Dexter transfer.47 Furthermore, we evaluated the radiative efficiency of charge carrier near the band edges using an on-gap PL measurement with varied excess energies (+ΔEexcit). Steady-state PL spectra were recorded using an on-gap excitation measurement dependent on excess energy (+ΔEexcit). The original PL spectra are shown in Fig. S17 (ESI†). We summarized the PL peak intensity as a function of +ΔEexcit (Fig. 3f), normalized by the peak of the excitation nearest to the band gap. The PL intensity of MRP significantly decreased with increasing +ΔEexcit between 20 and 40 meV. In contrast, as +ΔEexcit increased the PL intensity of CsFMRP decreased less, indicating that the excited carriers were efficiently relaxed to the ground state with greatly reduced nonradiative loss. These undesirable losses should originate from the accumulated nonradiative relaxation between vibrational modes.
Next, we studied the correlation between the charge-carrier mechanism and the lattice vibrations arising from spatial heterogeneities. Fig. 4a and Fig. S18 (ESI†) show similar surface roughnesses for MRP and CsFMRP. Uniform grains in MRP should result from the preferred orientation parallel to substrate of all the 2D-like phases, where very little ligands disturb the in-plane growth (Fig. S19, ESI†).25 Notably, some domains (labelled in orange) composed of thicker 2D layers were only observed in CsFMRP, consistent with the 3D-like phases observed via TEM. Such differences also led to the higher conductivity in CsFMRP than that in MRP (Fig. 4b), implying better charge-carrier transport. Furthermore, the crystal characteristics results of both films are given in Fig. S19 (ESI†). Interestingly, 2D phases (n = 3) with narrow distributions were found in CsFMRP. By using the Debye–Scherrer equation with the refined XRD patterns, the possible size of 3D- and 2D-like phase is estimated to 76.75 nm and 49.85 nm, respectively.
 | ||
| Fig. 4 Top-view microscopy images from (a) SEM, (b) conductive atomic force microscopy (c-AFM) and (c) deformation images of MRP and CsFMRP films. The statistical distributions of pixels are shown in the bottom panels. (d) Raman spectra of MRP and CsFMRP films. Analysis of solid-state NMR results involving (e) the representative 13C resonances and (f) corresponding spin lattice relaxation rates (R1) of MRP and CsFMRP crystal powders. | ||
In contrast, a considerable amount of various 2D phases (n = 1, 2, and 3) coexisted in MRP. Owing to the soft crystal lattices of lateral RPP bulk,48,49 MRP is supposed to be softer than CsFMRP due to its massively disordered 2D phases. The relative ratios between different phases seem to be deviated from the theoretical ones can be a result of the varied iodide vacancy densities affected by the formation enthalpy.50 Deformation maps (Fig. 4c) indicated the relatively soft nature of MRP and the stiffer lattice of CsFMRP. Therefore, suppressed lattice vibrations are expected in CsFMRP. A substantially lower Raman band (100–110 cm−1) for CsFMRP than that for MRP (Fig. 4d) revealed weaker Pb–I stretching modes from PbI3− sublattices, suggesting cooled lattice vibrations owing to triple cations. Previous studies argued that the Pb–X (X = halogen) stretching intensities should be similar for perovskites with similar inorganic [PbX6]4− frameworks.51,52 Although this is valid for 3D perovskites, the spatial heterogeneities and organic ligands in our materials may also affect the [PbX6]4− cages and vibrational strengths. Different binding energies of Pb and I for MRP and CsFMRP (Fig. S20, ESI†) implied variations of the Pb–I interactions. Nonetheless, owing to the varying compositions, it is imperative to exclude the effect of the cations on the lattice vibrations. Hence, solid-state nuclear magnetic resonance (SSNMR) was employed to determine the spin lattice relaxation rate (R1) of different organic groups.49Fig. 4e shows the representative 13C resonances of MRP and CsFMRP crystal powders, where the carbon shifts within the MA, FA, and PEA groups are assigned. The R1 values were obtained by fitting the 13C resonance curves as a function of recovery time (t1), as shown in Fig. 4f and Fig. S21 (ESI†). Interestingly, the R1 of the aromatic ring carbon of PEA was approximately 0.018 s−1 for both MRP and CsFMRP. The R1 values of the methyl carbon of MA were exceedingly similar: 0.08 s−1 for MRP and 0.07 s−1 for CsFMRP, and the methane carbon of FA had a similar R1 of 0.10 s−1. Therefore, rather than introduced cations, spatial heterogeneities dominated the crystal rigidity and lattice vibrations.
Different spectroscopy measurements, ultrafast transient absorption (TAS), and temperature-dependent photoluminescence (TPL) were used to elucidate the detailed charge-carrier mechanism and lattice effect. Fig. 5a and b show the pseudocolour TAS spectra for MPR and CsFMRP, respectively. Fig. 5c shows the decay dynamics of the representative ground state bleach (GSB) peaks, the rates of which are fitted and given in Table S4 (ESI†). For MRP, two GSB peaks at 610 nm (n = 3) and 645 nm (n = 4) appeared initially. Further, another broad GSB peak at 675 nm was allocated to the phase with n = 5. The GSB peak for n = 3 monotonically decreases with a rate of 0.039 ps−1. For n = 4 and 5, the GSB peaks firstly increased with rates of 2.457 and 2.231 ps−1 and then decreased with rates of 0.014 and 0.022 ps−1, respectively. The first increase might be due to the edge states being filled by free carriers. However, for room temperature PL spectra, a sole 3D-like peak appeared instead of 2D peaks. In this case, we presumed that these 2D charge carriers progressively transferred to the 3D-like phases via significant nonradiative loss. For CsFMRP, the pronounced GSB peaks could be observed at 620 nm (n = 3) and 750 nm (3D-like). Moreover, a broad weak GSB band (660–700 nm) indicated the presence of layers with n = 4–5. In particular, for n = 3, transfer dynamics comparable to those in MRP were observed. Notably, 3D-like excitons exhibited an initial rise (1.243 ps−1), followed by a second much slower decay (0.007 ps−1). Hence, the charge carriers that accumulated in 3D-like sub-grains via strong 2D transfer underwent efficient radiative recombinations, clarifying the improved dynamics (Fig. 3).
 | ||
| Fig. 5 Pseudocolor ultrafast transient absorption spectra as a function of probe wavelength and delay time for (a) MRP and (b) CsFMRP. (c) Decay dynamics of selected GSB peaks extracted from TAS spectra. Pseudocolor temperature-dependent PL spectra as a function of probe wavelength and temperature for (d) MRP and (e) CsFMRP. The red line in (d) indicates the phase transition. (f) PL line width as a function of temperature, where the fitting results for carrier–phonon interactions are inset. (g) Schematic illustration of the fundamental charge-carrier process in CsFMRP perovskites. | ||
The TPL spectra in Fig. 5d and e exhibit distinct temperature-dependent PL evolution for CsFMRP and MRP (see details in Fig. S22, ESI†). For MRP, a broad single PL peak centred at 1.74 eV was observed at room temperature. As the temperature decreased from 300 K to 150 K, the PL peak shifted towards higher energy because of the contribution from phases with a small n. We observed an abrupt PL change at 150 K, probably caused by a phase transition to the orthorhombic phase of the MA sublattice. When the temperature further decreased to 50 K, the single PL peak split into multiple 2D peaks (n = 3–7), supporting the coexistence of dynamic non-uniform 2D phases. Regarding CsFMRP, a narrow PL peak was located at approximately 1.56 eV, attributed to its 3D-like sub-grains. With decreasing temperature, the PL peak gradually narrowed and shifted to a lower energy, owing to the destabilisation of out-of-phase band-edge states at low temperature.53 The n = 3 phase that appeared in TAS was not observed here. This atypical phenomenon may originate from the ultrafast energy transfer of the n = 3 phase. Despite the spatial heterogeneities, the photoexcited carriers in CsFMRP show single-channel radiative recombination close to that of 3D perovskites.
The relation between charge carriers and lattice vibrations has been further studied with PL linewidth change,53
| Γ(T) = Γ0 + ΓLO = Γ0 + γLO/(exp(ELO/kBT) − 1), | (1) |
Conclusions
Unlike traditional homogeneous photoactive layers, the triple-cation RPP films present a complex local structure, with spatially heterogeneous multi-dimensional phases, which had so far hindered a complete understanding of the fundamental charge-carrier dynamics in working devices. We propose a comprehensive strategy by examining real-time charge-carrier behaviour, analysing charge-carrier dynamics and correlating the mechanism with spatial phases at multiple length scales. For the RPPs yielding high device performance, the charge-carrier behaviour and the assigned abnormal heterogeneity of structural phases were identified from the lateral long-range to local sub-grain scale with a unitary 2D/3D hybrid, rationalizing the lattice vibration dependent energy transfer mechanism. We foresee that the visualized peculiar abnormal heterogeneity of solution-processed RPPs will affect the fundamental understanding of low dimensional perovskite photovoltaic devices as well as other hybrid semiconductors with multiscale structures. Finally, this work will provide insights regarding both compositional design and charge-carrier engineering for future applications of organic–inorganic perovskites.Experimental
Chemicals
Lead iodide (99.999%) and lead bromide (99.998%) were purchased from Alfa Aesar. Formamidinium iodide (FAI), methylammonium iodide (MAI), methylammonium bromide (MABr), and 2-phenylethylammonium iodide (PEAI) were obtained from Greatcell solar. Caesium iodide (99.999%) and all the solvents used in this study, including dimethylformamide (anhydrous 99.8%), dimethylsulfoxide (anhydrous 99.9%), ethyl acetate (anhydrous 99.8%) and toluene (anhydrous 99.8%), were purchased from Sigma Aldrich. All chemicals were used without further purification.Preparation of Ruddlesden–Popper perovskites
For all compositions, the Pb2+ concentration was set to 0.85 mM, and CsI stock solutions (1.5 M in DMSO) were prepared in advance. For MA-based (PEA)2(MA)n−1PbnI3n+1 (MRP), precursor solutions were prepared by dissolving PbI2, MAI, and PEAI into DMF/DMSO (4/1) with a stoichiometric ratio of n![[thin space (1/6-em)]](https://www.rsc.org/images/entities/char_2009.gif) :(n − 1):2. For triple-cation-based (PEA)2[Cs0.05(FA0.88MA0.12)0.95]n−1Pbn(IBr)3n+1 (CsFMRP), the hybrid compositions were regarded as a mixture of 1 molar 2D (PEA)2PbI4 and (n − 1) molar 3D [Cs0.05(FA0.88MA0.12)0.95]Pb(I0.88Br0.12)3. Notably, in the 3D subpart, PbI2 concentrations were increased by 10% for local passivation. After dissolution of the precursors, corresponding volumes of the CsI stock solutions were added to form the final precursors. The composition details for MRP and CsFMRP are listed in Table S5 (ESI†). All precursors were filtered using a syringe (Whatman) with a 0.45 μm pore size. For film fabrication, 100 μL of the precursors was dropped onto substrates and then spin coated at 3000 rpm for 20 s. When the coating process was complete, 200 μL of ethyl acetate was immediately dropped to form the film. Then, the substrates were moved to a hotplate and heated at 100 °C for 10 min, and then at 110 °C for 30 min.
:(n − 1):2. For triple-cation-based (PEA)2[Cs0.05(FA0.88MA0.12)0.95]n−1Pbn(IBr)3n+1 (CsFMRP), the hybrid compositions were regarded as a mixture of 1 molar 2D (PEA)2PbI4 and (n − 1) molar 3D [Cs0.05(FA0.88MA0.12)0.95]Pb(I0.88Br0.12)3. Notably, in the 3D subpart, PbI2 concentrations were increased by 10% for local passivation. After dissolution of the precursors, corresponding volumes of the CsI stock solutions were added to form the final precursors. The composition details for MRP and CsFMRP are listed in Table S5 (ESI†). All precursors were filtered using a syringe (Whatman) with a 0.45 μm pore size. For film fabrication, 100 μL of the precursors was dropped onto substrates and then spin coated at 3000 rpm for 20 s. When the coating process was complete, 200 μL of ethyl acetate was immediately dropped to form the film. Then, the substrates were moved to a hotplate and heated at 100 °C for 10 min, and then at 110 °C for 30 min.
Device fabrication
ITO substrates (25 mm × 25 mm) were cleaned sequentially using acetone, isopropanol, and deionized water. Then, the substrates were dried in a nitrogen flow, and treated by UV-ozone for 20 min. Before perovskite deposition, PTAA solutions (1.5 mg mL−1 in toluene) were spin coated at 6000 rpm for 30 s. The coated substrates were annealed at 100 °C for 10 min. Perovskites were fabricated as described previously. Finally, the substrates were moved to a vacuum chamber for evaporation deposition of 20 nm C60, 6 nm BCP, and 80 nm Cu films at a rate of 0.2 Å s−1. For the flexible devices, 50 μm-thick polyethylene(naphthalate) (PEN) films were used as flexible substrates and PEDOT:PSS (Clevios PH1000) was used for transparent conductive electrode. PEN substrates were treated by O2 plasma and subsequently PH1000 was spin coated at 4000 rpm for 40 s. The flexible devices were completed by annealing at 120 °C for 15 min, followed by cooling for 3 min; no further annealing was required.Device characterization
A metal aperture mask was used to define the active area as 7.29 mm2. A standard silicon cell (91150-KG5, Newport) was used to calibrate the light intensity to that of the AM 1.5G simulated solar spectrum using 100 mW cm−2 radiation from a solar simulator (Sol 3A Class AAA 64023A, Oriel). Current-density–voltage curves were obtained using a Keithley 2400, from −0.1 to 1.2 V in forward scan and from 1.2 to −0.1 V in reverse scan. The scan rate was set as 100 mV s−1 with a delay time of 200 ms. To validate device performance, the scan rate was varied from 10 to 2000 mV s−1. A homemade EQE system with a Xenon lamp (75 W; USHIO Ltd, Japan) was used to record the EQE spectra. To investigate the stability of the output, the current density was recorded continuously at the MPP voltage determined from the J–V scan. All characterization experiments were conducted in a glovebox at room temperature.Characterization of EBIC
A field-emission SEM (FESEM; FEI Corp., Inspect F, USA) with an EBIC accessory (DISS 5, Point Electronic GmbH, Germany) was used to conduct the EBIC measurements. Before measurement, the devices were cleaved to produce cross-sectional specimens. During EBIC analysis, the accelerating voltage was 2 kV and the working distance was approximately 12 mm. In addition, secondary electron SEM images were recorded in parallel.Characterization of HRTEM
An FESEM (Helios 650, FEI Corp., USA) with a FIB gun was used to prepare high-quality cross-sectional samples after finishing EBIC measurements. The samples were then transferred to a field-emission transmission electron microscope (TEM; JEM-F200 (TFEG), JEOL Ltd, Japan) to analyze the high-resolution crystal properties with an accelerating voltage of 200 kV. The electron dose rate was limited (1–5 e Å−2 s−1) to avoid damage and phase changes.Characterization of SSNMR
A 500 MHz SSNMR system (Bruker Advance III HD, Bruker, Germany) was used to study the relaxation dynamics of the organic groups. To prepare samples, numerous perovskite films deposited on glass were scraped off to form powders, with a weight of at least 50 mg. These powders were milled to ∼60–70 mesh, and then tightly filled into the 4 mm probe head. For CP/MAS 13C experiments, the spinning frequency was 7 kHz, with a contact time of 2 ms. All experiments were completed in less than 16 h to ensure full spin relaxation.Characterization of TAS
TAS was conducted using a regeneratively-amplified Ti:Sapphire laser (Hurricane, Spectra-Physics) with the output wavelength centred at 800 nm, an energy of 0.55mJ per pulse, full-width-at-half-maximum of 130fs, and 1 kHz repetition rate. We generated 400 nm pump pulses by passing the source pulses through a second harmonic generator (TP-1A, Spectra-Physics) with a power of 20μW. Probe pulses were obtained by focusing the 800 nm light using a UV-fused silica planoconvex lens (CVI Melles Griot, f = 100mm) onto a 3 mm sapphire plate (WG30530, Thorlabs). The angle between the polarisation of the pump and the probe was set to 54.7° to exclude polarisation effects. The time delay between the pump and the probe pulses was scanned using a linear stage (M-414.3PD, Princeton Instruments). The pump pulses were modulated using an optical chopper (MC1000, Thorlabs) synchronised to the trigger from the source laser. The probe pulses of the signal were detected by photodiodes (2031, New Focus) after wavelength selection using a monochromator (250 IS/SM, Chromex, 600 grooves mm−1 grating blazed at 750nm). TAS signals were obtained using a lock-in amplifier (SR830, Stanford Research Systems).
Other characterization
A UV-visible spectrophotometer (Cary 5000 UV-Vis-NIR, Agilent Ltd, USA) was used to measure the UV-Vis absorption spectra. A steady-state and lifetime bench-top spectrofluorometer (Fluoromax-4, Horiba Ltd, France) was used to measure the steady-state PL and time-resolved PL spectra. In particular, on-gap excitation PL measurements were performed using a QM-3/2004SE (PTI) from a TAS system. The PL quantum yield was obtained by mounting an integrating sphere in the PL spectrofluorometer. Top-view SEM images were acquired using an FESEM (Auriga, Carl Zeiss Ltd, Germany). The typical film profiles, including height, conductivity, and deformation, were simultaneously measured using an atomic force microscope (AFM; Park NX10, Park Systems, Korea) by externally connecting various enhanced conducted AFM modules. A Raman spectrometer (T64000, Horiba Ltd, France) was used to analyze the lattice vibrations using 532 nm laser excitations, where the samples were encapsulated by glass and sealed with epoxy. XRD patterns over the range of 0° to 60° 2θ were obtained using a high-resolution system (SmartLab, Rigaku Ltd, Japan) with Cu Kα radiation. Grazing-incidence wide-angle X-ray scattering was conducted using a Xeuss 2.0 HR SAXS/WAXS system (France) with an exposure dwell time of 60 s. An electron spectroscopy instrument (AXIS SUPRA, Kratos Ltd, United Kingdom) was used to measure both XPS and ultraviolet photoelectron spectra (UPS), calibrated by an incident radiation using the He I peak (21.22 eV). For temperature-dependent PL, a spectrofluorometer (FlouTime 300, PicoQuant, Germany) was used to measure PL spectra with changes in temperature using 520 nm laser excitations.Author contributions
J. X. and J. W. L. conceived the idea. J. X., J. B. and U. K. prepared the samples. J. X. conducted the device characterization, most film property measurements, and data analysis. J. B. and J.-Y. Kim performed EBIC experiments. U. K. and J. Y. finished the fabrication of the flexible devices. K. B. conducted atomic force microscopy-related characterization, including c-AFM and nano-indentation mechanical mode. J. W. L., G. R. H., and S. K. K. performed TAS and on-gap excitation PL measurements. K. X. assisted with TEM results and analysis. H. D. and Z. W. provided some materials and performed data analysis. J. P. completed temperature-dependent PL, under the supervision of T.-W. L. The research was supervised by M. C. The first version of the manuscript was written by J. X. All other authors read, commented on, and revised the manuscript.Conflicts of interest
There are no conflicts to declare.Acknowledgements
This work was mainly supported by the Global Frontier R&D Program of the Center for Multiscale Energy Systems funded by the National Research Foundation under the Ministry of Education, Science and Technology, Korea (2012M3A6A7054855). J. W. Lee, G. R. Han, and S. K. K. acknowledge the support from the Basic Science Research Program, through the National Research Foundation of Korea (NRF) funded by the Ministry of Education (2020R1I1A1A01066243). H. D. and Z. W. thank for the National Natural Science Foundation of China (Grant No. 11574248, 61505161). We thank Simon Kahmann for the fruitful discussions about the spectroscopy results.Notes and references
- A. Kojima, K. Teshima, Y. Shirai and T. Miyasaka, J. Am. Chem. Soc., 2009, 131, 6050–6051 CrossRef CAS PubMed.
- H.-S. Kim, C.-R. Lee, J.-H. Im, K.-B. Lee, T. Moehl, A. Marchioro, S.-J. Moon, R. Humphry-Baker, J.-H. Yum, J. E. Moser, M. Grätzel and N.-G. Park, Sci. Rep., 2012, 2, 591 CrossRef PubMed.
- W. S. Yang, B. W. Park, E. H. Jung, N. J. Jeon, Y. C. Kim, D. U. Lee, S. S. Shin, J. Seo, E. K. Kim, J. H. Noh and S. I. Seok, Science, 2017, 356, 1376–1379 CrossRef CAS PubMed.
- Y. Hou, X. Du, S. Scheiner, D. McMeekin, Z. Wang, N. Li, M. Killian, H. Chen, M. Richter, I. Levchuk, N. Schrenker, E. Spiecker, T. Stubhan, N. Luechinger, A. Hirsch, P. Schmuki, H.-P. Steinrück, R. Fink, M. Halik, H. J. Snaith and C. Brabec, Science, 2017, 358, 1192–1197 CrossRef CAS PubMed.
- S. Bai, P. Da, C. Li, Z. Wang, Z. Yuan, F. Fu, M. Kawecki, X. Liu, N. Sakai, J. T.-W. Wang, S. Huettner, S. Buecheler, M. Fahlman, F. Gao and H. J. Snaith, Nature, 2019, 571, 245–250 CrossRef CAS PubMed.
- M. Abdi-Jalebi, Z. Andaji-Garmaroudi, S. Cacovich, C. Stavrakas, B. Philippe, J. M. Richter, M. Alsari, E. P. Booker, E. M. Hutter, A. J. Pearson, S. Lilliu, T. J. Savenije, H. Rensmo, G. Divitini, C. Ducati, R. H. Friend and S. D. Stranks, Nature, 2018, 555, 497–501 CrossRef CAS PubMed.
- N.-G. Park and K. Zhu, Nat. Rev. Mater., 2020, 5, 333–350 CrossRef CAS.
- Best Research-cell Efficiency Chart (NREL, accessed October 2020); https://www.nrel.gov/pv/cell-efficiency.html.
- S. D. Stranks, G. E. Eperon, G. Grancini, C. Menelaou, M. J. P. Alcocer, T. Leijtens, L. M. Herz, A. Petrozza and H. J. Snaith, Science, 2013, 342, 341–344 CrossRef CAS PubMed.
- Q. Dong, Y. Fang, Y. Shao, P. Mulligan, J. Qiu, L. Cao and J. Huang, Science, 2015, 347, 967–970 CrossRef CAS PubMed.
- M. Stolterfoht, M. Grischek, P. Caprioglio, C. M. Wolff, E. Gutierrez-Partida, F. Peña-Camargo, D. Rothhardt, S. Zhang, M. Raoufi, J. Wolansky, M. Abdi-Jalebi, S. D. Stranks, S. Albrecht, T. Kirchartz and D. Neher, Adv. Mater., 2020, 32, 2000080 CrossRef CAS PubMed.
- D. W. deQuilettes, K. Frohna, D. Emin, T. Kirchartz, V. Bulovic, D. Ginger and S. D. Stranks, Chem. Rev., 2019, 119, 11007–11019 CrossRef CAS PubMed.
- C. C. Boyd, R. Cheacharoen, T. Leijtens and M. D. McGehee, Chem. Rev., 2019, 119, 3418–3451 CrossRef CAS PubMed.
- Z. Xiao, Y. Yuan, Y. Shao, Q. Wang, Q. Dong, C. Bi, P. Sharma, A. Gruverman and J. Huang, Nat. Mater., 2015, 14, 193–198 CrossRef CAS PubMed.
- H. Kim, J. S. Kim, J.-M. Heo, M. Pei, I.-H. Park, Z. Liu, H. J. Yun, M.-H. Park, S.-H. Jeong, Y.-H. Kim, J.-W. Park, E. Oveisi, S. Nagane, A. Sadhanala, L. Zhang, J. J. Kweon, S. K. Lee, H. Yang, H. M. Jang, R. H. Friend, K. P. Loh, M. K. Nazeeruddin, N.-G. Park and T.-W. Lee, Nat. Commun., 2020, 11, 3378 CrossRef PubMed.
- L. Pedesseau, D. Sapori, B. Traore, R. Robles, H.-H. Fang, M. A. Loi, H. Tsai, W. Nie, J.-C. Blancon, A. Neukirch, S. Tretiak, A. D. Mohite, C. Katan, J. Even and M. Kepenekian, ACS Nano, 2016, 10, 9776–9786 CrossRef CAS PubMed.
- C. C. Stoumpos, D. H. Cao, D. J. Clark, J. Young, J. M. Rondinelli, J. I. Jang, J. T. Hupp and M. G. Kanatzidis, Chem. Mater., 2016, 28, 2852–2867 CrossRef CAS.
- J. Byun, H. Cho, C. Wolf, M. Jang, A. Sadhanala, R. H. Friend, H. Yang and T.-W. Lee, Adv. Mater., 2016, 28, 7515–7520 CrossRef CAS PubMed.
- L. N. Quan, M. Yuan, R. Comin, O. Voznyy, E. M. Beauregard, S. Hoogland, A. Buin, A. R. Kirmani, K. Zhao, A. Amassian, D. H. Kim and E. H. Sargent, J. Am. Chem. Soc., 2016, 138, 2649–2655 CrossRef CAS PubMed.
- Z. Huang, A. H. Proppe, H. Tan, M. I. Saidaminov, F. Tan, A. Mei, C.-S. Tan, M. Wei, Y. Hou, H. Han, S. O. Kelley and E. H. Sargent, ACS Energy Lett., 2019, 4, 1521–1527 CrossRef CAS.
- Y.-W. Jang, S. Lee, K. M. Yeom, K. Jeong, K. Choi, M. Choi and J. H. Noh, Nat. Energy, 2021, 6, 63–71 CrossRef CAS.
- H. Tsai, W. Nie, J.-C. Blancon, C. C. Stoumpos, R. Asadpour, B. Harutyunyan, A. J. Neukirch, R. Verduzco, J. J. Crochet, S. Tretiak, L. Pedesseau, J. Even, M. A. Alam, G. Gupta, J. Lou, P. M. Ajayan, M. J. Bedzyk, M. G. Kanatzidis and A. D. Mohite, Nature, 2016, 536, 312–316 CrossRef CAS PubMed.
- L. Mao, C. C. Stoumpos and M. G. Kanatzidis, J. Am. Chem. Soc., 2016, 141, 1171–1190 CrossRef PubMed.
- C. Katan, N. Mercier and J. Even, Chem. Rev., 2019, 119, 3140–3192 CrossRef CAS PubMed.
- J. Xi, I. Spanopoulos, K. Bang, J. Xu, H. Dong, Y. Yang, C. D. Malliakas, J. M. Hoffman, M. G. Kanatzidis and Z. Wu, J. Am. Chem. Soc., 2020, 142, 19705 CrossRef CAS PubMed.
- G. Grancini and M. K. Nazeeruddin, Nat. Rev. Mater., 2019, 4, 4–22 CrossRef CAS.
- J. Qing, X.-K. Liu, M. Li, F. Liu, Z. Yuan, E. Tiukalova, Z. Yan, M. Duchamp, S. Chen, Y. Wang, S. Bai, J.-M. Liu, H. J. Snaith, C.-S. Lee, T. C. Sum and F. Gao, Adv. Energy Mater., 2018, 8, 1800185 CrossRef.
- H. Lai, B. Kan, T. Liu, N. Zheng, Z. Xie, T. Zhou, X. Wan, X. Zhang, Y. Liu and Y. Chen, J. Am. Chem. Soc., 2018, 140, 11639–11646 CrossRef CAS PubMed.
- F. Zhang, D. H. Kim, H. Lu, J.-S. Park, B. W. Larson, J. Hu, L. Gao, C. Xiao, O. G. Reid, X. Chen, Q. Zhao, P. F. Ndione, J. J. Berry, W. You, A. Walsh, M. C. Beard and K. Zhu, J. Am. Chem. Soc., 2019, 141, 5972–5979 CrossRef CAS PubMed.
- Z. Xu, D. Lu, F. Liu, H. Lai, X. Wan, X. Zhang, Y. Liu and Y. Chen, ACS Nano, 2020, 14, 4871–4881 CrossRef CAS PubMed.
- M. Saliba, T. Matsui, J.-Y. Seo, K. Domanski, J.-P. Correa-Baena, M. K. Nazeeruddin, S. M. Zakeeruddin, W. Tress, A. Abate, A. Hagfeldt and M. Grätzel, Energy Environ. Sci., 2016, 9, 1989–1997 RSC.
- M. Stolterfoht, C. M. Wolff, J. A. Márquez, S. Zhang, C. J. Hages, D. Rothhardt, S. Albrecht, P. L. Burn, P. Meredith, T. Unold and D. Neher, Nat. Energy, 2018, 3, 847–854 CrossRef CAS.
- C. Liang, K. M. M. Salim, P. Lim, Z. Wang, T. M. Koh, H. Gu, J. Xia, Z. Zhang, K. Wang, T. Liu, Q. Wei, S. Wang, Y. Tang, G. Shao, Y. Song, N. Mathews and G. Xing, J. Mater. Chem. A, 2020, 8, 5874–5881 RSC.
- S. G. Motti, T. Crothers, R. Yang, Y. Cao, R. Li, M. B. Johnston, J. Wang and L. M. Herz, Nano Lett., 2019, 19, 3953–3960 CrossRef CAS PubMed.
- S. Zhang, S. M. Hosseini, R. Gunder, A. Petsiuk, P. Caprioglio, C. M. Wolff, S. Shoaee, P. Meredith, S. Schorr, T. Unold, P. L. Burn, D. Neher and M. Stolterfoht, Adv. Mater., 2019, 31, 1901090 CrossRef PubMed.
- Y. Lin, Y. Fang, J. Zhao, Y. Shao, S. J. Stuard, M. M. Nahid, H. Ade, Q. Wang, J. E. Shield, N. Zhou, A. M. Moran and J. Huang, Nat. Commun., 2019, 10, 1008 CrossRef PubMed.
- A. H. Proppe, R. Quintero-Bermudez, H. Tan, O. Voznyy, S. O. Kelley and E. H. Sargent, J. Am. Chem. Soc., 2018, 140, 2890–2896 CrossRef CAS PubMed.
- J. Xi, C. Piao, J. Byeon, J. Yoon, Z. Wu and M. Choi, Adv. Energy Mater., 2019, 9, 1901787 CrossRef.
- N. Klein-Kedem, D. Cahen and G. Hodes, Acc. Chem. Res., 2016, 49, 347–354 CrossRef CAS PubMed.
- O. Hentz, P. Rekemeyer and S. Gradečak, Adv. Energy Mater., 2018, 8, 1701378 CrossRef.
- B.-W. Park, N. Kedem, M. Kulbak, D. Y. Lee, W. S. Yang, N. J. Jeon, J. Seo, G. Kim, K. J. Kim, T. J. Shin, G. Hodes, D. Cahen and S. I. Seok, Nat. Commun., 2018, 9, 3301 CrossRef PubMed.
- J. Byeon, J. Kim, J.-Y. Kim, G. Lee, K. Bang, N. Ahn and M. Choi, ACS Energy Lett., 2020, 5, 2580–2589 CrossRef CAS.
- T. W. Jones, A. Osherov, M. Alsari, M. Sponseller, B. C. Duck, Y. K. Jung, C. Settens, F. Niroui, R. Brenes, C. V. Stan, Y. Li, M. Abdi-Jalebi, N. Tamura, J. E. MacDonald, M. Burghammer, R. H. Friend, V. Bulović, A. Walsh, G. J. Wilson, S. Lilliu and S. D. Stranks, Energy Environ. Sci., 2019, 12, 596–606 RSC.
- T. A. S. Doherty, A. J. Winchester, S. Macpherson, D. N. Johnstone, V. Pareek, E. M. Tennyson, S. Kosar, F. U. Kosasih, M. Anaya, M. Abdi-Jalebi, Z. Andaji-Garmaroudi, E. L. Wong, J. Madéo, Y.-H. Chiang, J.-S. Park, Y.-K. Jung, C. R. E. Petoukhoff, G. Divitini, M. K. L. Man, C. Ducati, A. Walsh, P. A. Midgley, K. M. Dani and S. D. Stranks, Nature, 2020, 580, 360–366 CrossRef CAS PubMed.
- J.-C. Blancon, H. Tsai, W. Nie, C. C. Stoumpos, L. Pedesseau, C. Katan, M. Kepenekian, C. M. M. Soe, K. Appavoo, M. Y. Sfeir, S. Tretiak, P. M. Ajayan, M. G. Kanatzidis, J. Even, J. J. Crochet and A. D. Mohite, Science, 2017, 355, 1288–1292 CrossRef CAS PubMed.
- C. Zuo, A. D. Scully, D. Vak, W. Tan, X. Jiao, C. R. McNeill, D. Angmo, L. Ding and M. Gao, Adv. Energy Mater., 2018, 8, 1803258 Search PubMed.
- C. Qin, T. Matsushima, W. J. Potscavage Jr, A. S. D. Sandanayaka, M. R. Leyden, F. Bencheikh, K. Goushi, F. Mathevet, B. Heinrich, G. Yumoto, Y. Kanemitsu and C. Adachi, Nat. Photonics, 2020, 14, 70–75 CrossRef CAS.
- K. Leng, I. Abdelwahab, I. Verzhbitskiy, M. Telychko, L. Chu, W. Fu, X. Chi, N. Guo, Z. Chen, Z. Chen, C. Zhang, Q.-H. Xu, J. Lu, M. Chhowalla, G. Eda and K. P. Loh, Nat. Mater., 2018, 17, 908–914 CrossRef CAS PubMed.
- X. Gong, O. Voznyy, A. Jain, W. Liu, R. Sabatini, Z. Piontkowski, G. Walters, G. Bappi, S. Nokhrin, O. Bushuyev, M. Yuan, R. Comin, D. McCamant, S. O. Kelley and E. H. Sargent, Nat. Mater., 2018, 17, 550–556 CrossRef CAS PubMed.
- C. M. M. Soe, G. P. Nagabhushana, R. Shivaramaiah, H. Tsai, W. Nie, J.-C. Blancon, F. Melkonyan, D. H. Cao, B. Traoré, L. Pedesseau, M. Kepenekian, C. Katan, J. Even, T. J. Marks, A. Navrotsky, A. D. Mohite, C. C. Stoumpos and M. G. Kanatzidis, Proc. Natl. Acad. Sci. U. S. A., 2019, 116, 58–66 CrossRef PubMed.
- K. Miyata, D. Meggiolaro, M. T. Trinh, P. P. Joshi, E. Mosconi, S. C. Jones, F. De Angelis and X.-Y. Zhu, Sci. Adv., 2017, 3, e1701217 CrossRef PubMed.
- S. Neutzner, F. Thouin, D. Cortecchia, A. Petrozza, C. Silva and A. R. S. Kandada, Phys. Rev. Mater., 2018, 2, 064605 CrossRef CAS.
- A. D. Wright, C. Verdi, R. L. Milot, G. E. Eperon, M. A. Pérez-Osorio, H. J. Snaith, F. Giustino, M. B. Johnston and L. M. Herz, Nat. Commun., 2016, 7, 11755 CrossRef PubMed.
Footnotes |
| † Electronic supplementary information (ESI) available. See DOI: 10.1039/d1ee00984b |
| ‡ These authors contributed equally. |
| This journal is © The Royal Society of Chemistry 2021 |