 Open Access Article
A material catalogue with glass-like thermal conductivity mediated by crystallographic occupancy for thermoelectric application†
Zihang
Liu‡
 a,
Wenhao
Zhang‡
ab,
Weihong
Gao
a and
Takao
Mori
 *ab
*ab
aWPI Center for Materials Nanoarchitectonics (WPI-MANA), National Institute for Materials Science (NIMS), Namiki 1-1, Tsukuba 305-0044, Japan. E-mail: MORI.Takao@nims.go.jp
bGraduate School of Pure and Applied Sciences, University of Tsukuba, Tennodai 1-1-1, Tsukuba 305-8671, Japan
First published on 21st April 2021
Abstract
Discovering materials with intrinsically low lattice thermal conductivity κlat is an important route for achieving high thermoelectric performance. In reality, the conventional synthetic approach, however, relies on trial and error. Herein, we proposed a new crystallographic parameter, namely the site occupancy factor, as an effective indicator to identify a material catalogue with low κlat. Taking Cu6Te3S, in which some Cu atoms show partial occupancy, as the representative sample, it was found that this compound exhibited ultralow κlat with weak temperature dependence from 5 K to 350 K. The appearance of a boson peak and unusual two-level tunneling states in the heat capacity measurement revealed the low-lying optical modes and dynamic diffusion disorder, respectively. This glass-like thermal property in a crystalline material arose from the combination of the anharmonic and anisotropic vibration of the Cu atom, the ionic bond feature around the Cu atom, and the global weak bonding, confirmed by the calculated phonon dispersion, electron localization function, and potential energy curves. Utilizing the proposed indicator of partial occupancy, we searched in the Crystallography Open Database for further potential candidate materials with low κlat. As a further test of the efficacy of this strategy, two unearthed compounds were synthesized and both were indeed found to exhibit very low κlat, around 0.6 W m−1 K−1 at 300 K. Our work explored the close relationship between crystallography and thermal property in crystalline materials and revealed the impact of partial occupancy in complex lattice dynamics, opening up new avenues towards discovering materials with low κlat.
Broader contextThe thermoelectric effect enables the direct conversion of heat into electricity and vice versa, which has received intensive interest for powering IoT devices and cooling applications. Discovering materials with an intrinsically low lattice thermal conductivity κlat is an important route for decoupling these interrelated thermoelectric parameters and therefore achieving high thermoelectric performance. The conventional synthetic approach used long-term has been based largely on laboratory trial and error, or complex quantum calculations. In this study, we proposed a new crystallographic parameter, namely the site occupancy factor, as an effective indicator to identify a material catalogue with low κlat using the REST-API framework. In a representative material, Cu6Te3S, which contains Cu with partial occupancy, an amorphous thermal conductivity was observed and, more importantly, the thermoelectric performance can be further enhanced by Ag alloying on the Cu site. The corresponding phonon mechanism of low κlat was attributed to the anharmonic and anisotropic vibration of the Cu atom, the ionic bond feature around the Cu atom, and the global weak bonding. Our study offers fresh insights into discovering materials with low κlat for thermoelectric applications. |
Introduction
The ability to tune the thermal conductivity is vital in diverse technological applications. One important aspect is to discover or design inorganic materials with a low thermal conductivity as potential thermal barrier coatings and thermoelectric materials.1,2 The thermoelectric effect enables the direct conversion of heat into electricity and vice versa, which has received interest for powering Internet of Things (IoT) devices and cooling applications.3–5 The dimensionless thermoelectric figure of merit (ZT), defined as ZT = (S2σ/κtot)T, dominates the conversion efficiency, where S, σ, κtot, and T are the Seebeck coefficient, the electrical conductivity, the total thermal conductivity (including lattice thermal conductivity κlat and electronic thermal conductivity κele) and the absolute temperature, respectively. The parameter κele usually follows the Wiedemann–Franz law, and is linearly proportional to σ and T. Considering the intertwined or contradicted thermoelectric parameters (S, σ, and κele),6 optimizing the charge carrier concentration7–9 or suppressing κlat through nano–microstructural engineering10–15 is the common method to increase ZT.Alternatively, discovering materials with an intrinsically low κlat is another important route for achieving high ZT in thermoelectrics.16–18 Nearly all good thermoelectric materials are heavily doped semiconductors. The transport of thermal energy in crystalline semiconductors is predominantly by atomic vibrations, which can be quantized by the quasiparticle ‘phonon’. The parameter κlat can be approximately estimated based on the simple kinetic theory:
 | (1) |
The conventional synthetic approach to discovering materials with low κlat values has for a long time been based on significant laboratory trial and error. Some recently developed methods, including high-throughput computation,41 inverse design approach,42 and machine learning43 have accelerated the discovery process, all of which, however, rely on complex quantum calculations and/or models. Herein, we report, for the first time, that the crystallographic site occupancy can be used to enable the simple and efficient search for materials with low κlat. According to the theory of harmonic lattice vibration, lp would be infinite in a perfect lattice but becomes finite once the periodicity is broken. Thus, the reduction in translational symmetry will lead to a reduced κlat. Partial occupancy is a source of such reduction in periodicity, which can be easily checked by looking at crystal structures, therefore serving as the first indicator of lattice thermal conductivity. For Cu6Te3S, which contains Cu atoms showing partial occupancy, the observed temperature dependence and the magnitude of κlat, as well as low-temperature heat capacity measurements, were similar to those of amorphous materials, and are closely related to the partial occupancy. Density-functional theory (DFT) calculations reveal that the corresponding microscopic mechanism originates from the anharmonic and anisotropic vibration of the Cu atom, the ionic bond feature around the Cu atom, and the global weak bonding, which unveils the unusual phonon conduction of crystalized compounds with partial occupancy.
Results and discussion
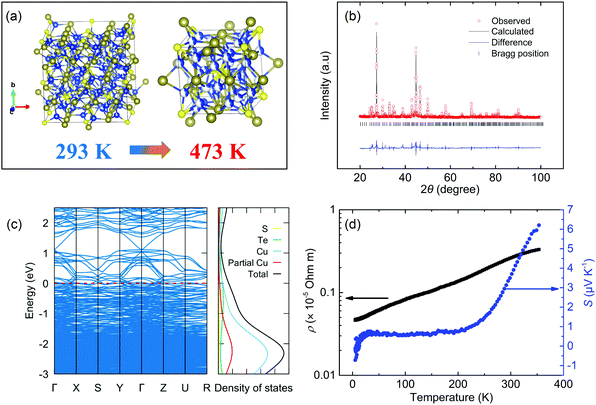
Pristine Cu6Te3S exhibits a phase transition around 404 K from the low-temperature α phase to the high-temperature β phase, displayed in Fig. 1a. Both α-Cu6Te3S and β-Cu6Te3S crystallize in the cubic system with different space groups of P213 and P![[4 with combining macron]](https://www.rsc.org/images/entities/char_0034_0304.gif) 3n,44 respectively. The high-temperature phase can be seen as a Cu-filled Cr3Si structure type and the low-temperature cell is 8 times bigger. One unusual feature in these two crystal structures is the distinct site occupancy factor (sof) of the Cu atoms. In α-Cu6Te3S, 4 out of 11 Cu sites are fully occupied while the other Cu atoms show partial occupancy. By contrast, all Cu atoms in β-Cu6Te3S are fully disordered with lower partial occupancy. In crystallography, there are two kinds of partial occupancy with a sof value of less than unity in terms of an average unit cell: there are mixtures of atoms that share the same crystallographic site (substitutional disorder) or there are mixtures that contain fewer atoms than there are symmetry equivalent sites to occupy. The latter is the one occurring in our currently investigated system of Cu6Te3S, signifying the spatial fluctuations of Cu atoms at some Wyckoff positions. If there is no strict description, partial occupancy in the following context means the latter condition. It should be mentioned that filler atoms in skutterudite also show the partial occupancy feature,45 which, however, has received little attention about its effect on lowering the κlat. Fig. 1b shows that the powder X-ray diffraction (XRD) refinement result exhibits a reasonable fit with the model of collection code 427
3n,44 respectively. The high-temperature phase can be seen as a Cu-filled Cr3Si structure type and the low-temperature cell is 8 times bigger. One unusual feature in these two crystal structures is the distinct site occupancy factor (sof) of the Cu atoms. In α-Cu6Te3S, 4 out of 11 Cu sites are fully occupied while the other Cu atoms show partial occupancy. By contrast, all Cu atoms in β-Cu6Te3S are fully disordered with lower partial occupancy. In crystallography, there are two kinds of partial occupancy with a sof value of less than unity in terms of an average unit cell: there are mixtures of atoms that share the same crystallographic site (substitutional disorder) or there are mixtures that contain fewer atoms than there are symmetry equivalent sites to occupy. The latter is the one occurring in our currently investigated system of Cu6Te3S, signifying the spatial fluctuations of Cu atoms at some Wyckoff positions. If there is no strict description, partial occupancy in the following context means the latter condition. It should be mentioned that filler atoms in skutterudite also show the partial occupancy feature,45 which, however, has received little attention about its effect on lowering the κlat. Fig. 1b shows that the powder X-ray diffraction (XRD) refinement result exhibits a reasonable fit with the model of collection code 427![[thin space (1/6-em)]](https://www.rsc.org/images/entities/char_2009.gif) 560 in the Inorganic Crystal Structure Database (ICSD) and no strong peaks of the impurity phase are observed within the detection limit. The microscale homogeneity was further confirmed by scanning electron microscopy (SEM) and energy dispersive spectrometry (EDS) composition mapping analysis (Fig. S1, ESI†). The composition analysis shows that the atomic percentage of Cu, Te, and S elements is 60.57, 29.62, and 9.81, respectively, which is close to the nominal composition. The thermogravimetry (TG) curve for the synthesized Cu6Te3S ingot from 373 K to 773 K under a N2 flow atmosphere confirms that the weight drop is almost negligible over the entire temperature range (Fig. S2, ESI†). Besides, the sintering temperature of Cu6Te3S is at a relatively low temperature (723 K), which seems not to be high enough for inducing the sulfur loss. Overall, the effect of sulfur loss on the thermoelectric properties of Cu6Te3S can be neglected, although sulfur loss sometimes occurs in Cu–chalcogen compounds during sintering, leading to the introduction of disorder and a low κlat.46,47
560 in the Inorganic Crystal Structure Database (ICSD) and no strong peaks of the impurity phase are observed within the detection limit. The microscale homogeneity was further confirmed by scanning electron microscopy (SEM) and energy dispersive spectrometry (EDS) composition mapping analysis (Fig. S1, ESI†). The composition analysis shows that the atomic percentage of Cu, Te, and S elements is 60.57, 29.62, and 9.81, respectively, which is close to the nominal composition. The thermogravimetry (TG) curve for the synthesized Cu6Te3S ingot from 373 K to 773 K under a N2 flow atmosphere confirms that the weight drop is almost negligible over the entire temperature range (Fig. S2, ESI†). Besides, the sintering temperature of Cu6Te3S is at a relatively low temperature (723 K), which seems not to be high enough for inducing the sulfur loss. Overall, the effect of sulfur loss on the thermoelectric properties of Cu6Te3S can be neglected, although sulfur loss sometimes occurs in Cu–chalcogen compounds during sintering, leading to the introduction of disorder and a low κlat.46,47
For our DFT calculation, a cubic unit cell containing 160 atoms is used. The minimum 2 × 2 × 2 supercell would contain more than 1000 atoms, which becomes impractical for DFT calculation. We generate the fixed structure by filling the partial occupancy site but keep the symmetry of the resulting cell as the space group P212121 for calculation efficiency. According to the crystal symmetry and those crystallographic sites with partial occupancy, the configuration of partial occupancy that needs to be considered is reduced. In the end, 4 of them with the smallest ground state energy for the phonon calculation are chosen. The detailed calculation method in terms of the partial-occupancy-structure was displayed in the ESI.† The results of electronic and phononic structures are almost identical, suggesting that the specific choice of Cu site does not have a big impact on the physical properties. We show one of the band structures in Fig. 1c while the others are displayed in Fig. S3 (ESI†). No band gap is found in its electronic band structure with a finite DOS at the Fermi energy, indicating a metallic character. The larger density of states just below the Fermi level leads to p-type conduction. The measured low-temperature electrical resistivity ρ and Seebeck coefficient S in Fig. 1d also support this conclusion of metallic conduction. The temperature dependence of ρ is positive from 5 K to 350 K, in which the relatively small residual resistivity ratio (RRR ρ300K/ρ5K = 5.7) and the high ρ at 300 K ∼2.6 μΩ m are an indicator of poor metallic behavior. The positive S is near constant at low temperature but changes to a linearly positive temperature dependence from 200 K to 350 K.
After subtracting the κele component based on the Wiedemann–Franz law, it was found that Cu6Te3S exhibits an extremely low κlat over the entire measured temperature range in Fig. 2a. For example, the peak κlat value is less than 0.7 W m−1 K−1, lower than those of typical low thermal conductivity materials such as In4Se3,48 Zn4Sb3,49 and α-MgAgSb,29 while the room temperature κlat value is around 0.3 W m−1 K−1 which is even lower than those of amorphous SiO2.50 The weak temperature dependence resembles glass-like behavior. The slow increase in κlat at low temperature is mainly due to the increase in phonon heat capacity and, based on eqn (1), we can deduce a weakly temperature-dependent lp at low temperature. The disappearance of the peak-shape dependence in κlat(T) also occurs in some crystalline materials with a strong structural disorder, including (KBr)1−x(KCN)x,51 complex boride compounds,19,21,22 skutterudites and clathrates with a filler32,52 as well as ionic semiconductors.36,53 This similarity in magnitude and temperature dependence between Cu6Te3S and amorphous materials is ascribed to the Cu atom partial occupancy, as well as the resulting atomic-level dynamic heterogeneity, the ionic bond feature around the Cu atom, and the global weak bonding, revealed by the following DFT calculations.
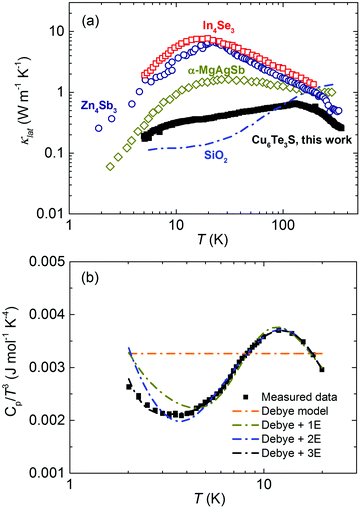 | ||
| Fig. 2 Thermal properties of Cu6Te3S. (a) Temperature dependent lattice thermal conductivity κlat of Cu6Te3S from 5 K to 350 K, in comparison with other typical materials with a low thermal conductivity, including In4Se3,48 Zn4Sb3,49 α-MgAgSb,29 Cu2Se,53 and amorphous SiO2.50 (b) Temperature-dependent heat capacity Cp, depicted as Cp/T3 as a function of T. The dashed lines are fitting results based on the Debye model, Debye-1 Einstein oscillator model (Debye + 1E), Debye-2 Einstein oscillator model (Debye + 2E), and Debye-3 Einstein oscillator model (Debye + 3E). | ||
The low-temperature heat capacity Cp was measured to probe the related phonon contribution mechanism, which was present as Cp/T3 as a function of T over the T range from 2 K to 20 K in Fig. 2b. The complete Cp data from 2 K to 350 K are displayed in Fig. S4 (ESI†). A hump from 10 K to 20 K, referred to as the “boson peak,” is observed, which is related to the excess phonon density of states (DOS) resulting from these low-lying optical modes.54 In addition to amorphous solids, this behavior has recently been reported in some crystalline solids, such as clathrates,32 Cu3SbSe3,30 α-MgAgSb,29 and CsSnBrI2.28 More importantly, there is a clear upturn below 3 K in Cu6Te3S, which did not occur in these abovementioned systems but which has been observed previously in rare earth borides.22,55 This can be explained by the two-level tunneling states in amorphous solids,56 corresponding to two neighboring equilibrium positions. As pointed out by Phillips, “we can say that tunneling states will occur in materials with an open structure”.56 This unusual phenomenon in Cu6Te3S should be ascribed to the unique crystallographic occupancy, in which the existence of atomic partial occupancy results in Cu atoms tunneling among several possible crystallographic sites with low formation energy. Therefore, the migration of Cu may also occur in Cu6Te3S, especially at high temperature, and has commonly occurred in Cu–chalcogen compounds, like Cu2Se and Cu12+xSb4S13.36,57 In general, the atomic partial occupancy, as the fundamental mechanism, leads to the possible atomic migration and complex lattice dynamics.
The experimental Cp/T3 data show a strong deviation from the classical Debye model dependence and, therefore, the Debye–Einstein model with a different number of oscillators was utilized, as shown in the following equation:
 | (2) |
The calculated phonon dispersion in Fig. 3a shows the extremely soft acoustic phonons with an ultralow cutoff frequency around 0.6 THz at the Brillouin zone boundary, comparable to these materials with intrinsically low thermal conductivity, e.g., Ag9GaSe6 (0.54 THz),38 MgAgSb (0.6 THz),29,59 and PbTe (0.78 THz).26 This corresponding origin is due to the combination of weak chemical bonding and a large primitive cell ∼3176.1 Å3. The former leads to the low νp defined as the slope of the acoustic dispersion relation, while the latter restricts the zone boundary of the first Brillouin zone. It is known that the low cutoff frequency is directly associated with the low κlat according to the Debye model prediction. Besides, the hybridization between acoustic phonons and low-frequency optical phonons can be also observed. In one of the calculated configurations, we even found some low-lying optical phonons, solely involving the partially occupied Cu atom (Fig. S5, ESI†), leading to the anticrossing behavior.58 These calculations are supportive of the observation of the boson peak in our Cp analysis.
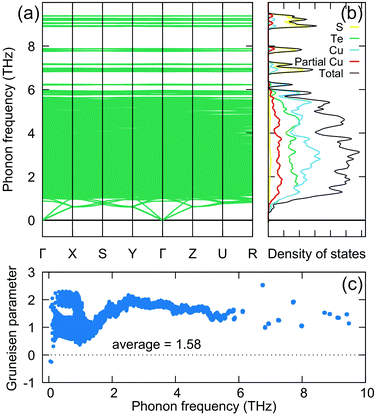 | ||
| Fig. 3 The calculated lattice dynamics and ELF plot in Cu6Te3S. (a) Phonon dispersion, (b) the projected phonon DOS, and (c) the Grüneisen parameter. | ||
The corresponding projected phonon DOS in Fig. 3b reveals that the main contribution of low-energy phonons (<2 THz) originates from the Cu atom, including fixed Cu atoms and partial-occupancy Cu atoms. It indicates that the Cu atom is responsible for the complex lattice dynamics of Cu6Te3S. The calculated average Grüneisen parameter γ, characterizing the strength of the anharmonicity of the lattice vibration, is about 1.58, close to the obtained value based on the sound velocity of ∼2.0, demonstrating the relatively strong lattice anharmonicity in Cu6Te3S. The typical expression of Umklapp scattering that dominates the high-temperature phonon scattering in solids is shown in the following:20
 | (3) |
![[M with combining macron]](https://www.rsc.org/images/entities/i_char_004d_0304.gif) is the average atomic mass, νs is the average sound velocity, V is the volume per atom, and N is the number of atoms per primitive cell. Together with the low νs ≈ 1484 m s−1 and the large N ≈ 160, the resulting strong Umklapp scattering in Cu6Te3S limits the heat conduction.
is the average atomic mass, νs is the average sound velocity, V is the volume per atom, and N is the number of atoms per primitive cell. Together with the low νs ≈ 1484 m s−1 and the large N ≈ 160, the resulting strong Umklapp scattering in Cu6Te3S limits the heat conduction.
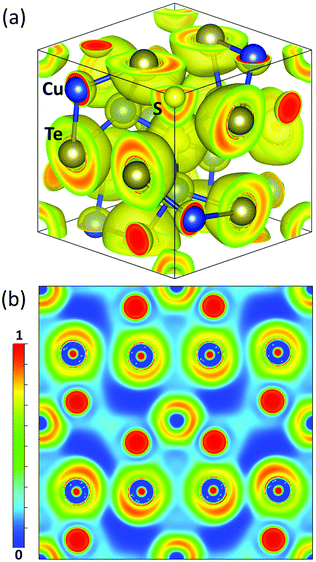
To understand the chemical bonding environment in Cu6Te3S, we further calculated the electron localization function (ELF) since the ELF is a simple measure of electron localization in an atomic and molecular system.60 The ELF values are defined between 0 and 1, in which ELF = 1 means the perfect localization and ELF = 0.5 corresponds to the electron gas. From the three-dimensional and the two-dimensional ELFs in Fig. 4a and b, respectively, the following can be learned: (1) the Te atom possesses an asymmetrically distributed electron cloud, with a higher density regime approaching the direction where there is a large interatomic space due to the existence of the Cu atom partial occupancy. (2) The strongly localized electron on the Cu atom illustrates the ionic bond feature while the Te atom with the neighboring Te atom shares electrons as an indication of covalent bonding. The physical binding feature of the Cu atom accounts for the global weak bonding environment in Cu6Te3S.
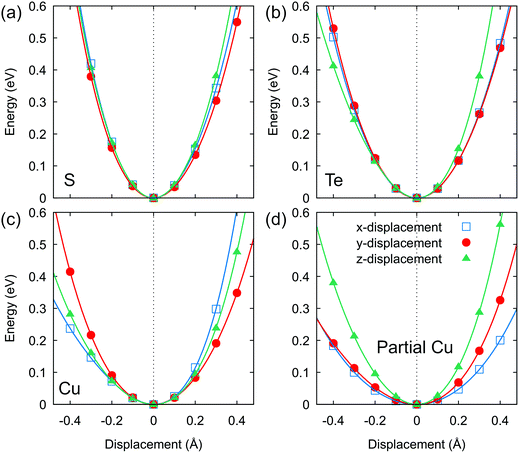
To further gain insight into the lattice anharmonicity and chemical bonding strength in Cu6Te3S, the potential energy surface can be a conceptual tool for analysis. The potential energy as a function of displacement in Fig. 5 was calculated on four different crystallographic sites, respectively. Both the Te atom and the S atom show a rather harmonic potential that is also relatively isotropic along the three Cartesian directions. By contrast, a non-parabolicity was observed for the Cu atom, including the fixed Cu atom and the partial-occupancy Cu atom, indicating the anharmonic feature. Besides, their interatomic force constants (IFCs) are also smaller, especially for the partially occupied Cu site, suggesting loose spring constants of vibration around the equilibrium position and anisotropic behavior. In this scenario, Cu atoms, due to the partial occupancy, do not belong to the static disorder category but show dynamic disorder with anharmonic and anisotropic vibration, which underscores the origin of this unusual glass-like κlat on the atomic scale.
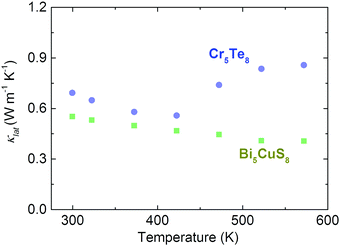
In addition to this specific example of Cu6Te3S, we further search for potential candidates of compounds with partial occupancy in the entirely open-access Crystallography Open Database (COD) via the REpresentational State Transfer (REST) Application Programming Interface (API) approach that offers great convenience, flexibility and scalability for users to access and use data from the targeted database. Detailed information on the REST-API method can be found in the ESI.† To reduce the number of candidates, we only consider binary or ternary compounds containing Te, Se, Sb, Ge, or S elements and we check the structure information from their Crystallographic Information File (CIF) files using the python PyCifRW package. We selected two compounds (Bi5CuS8 and Cr5Te8) and experimentally synthesized them, both of which are single phase (Fig. S6, ESI†). Their corresponding crystal structure is given in Fig. S7 (ESI†) where the partial occupancy is shown and highlighted. After measuring their thermoelectric properties (Fig. S8 and S9, ESI†), both of them are found to possess an ultralow κlat with weak temperature dependence (Fig. 6), where the corresponding room-temperature value is around 0.64 W m−1 K−1 and 0.55 W m−1 K−1 for Cr5Te8 and Bi5CuS8, respectively. It should be mentioned that the relative densities of Cu6Te3S, Bi5CuS8, and Cr5Te8 are above 97% (Table S3, ESI†), which would guarantee that the measured thermoelectric properties, especially for thermal conduction, are not affected by the pore effect. Besides, the Lorenz number L used in the Wiedemann–Franz law is shown in Fig. S10 (ESI†).
The obtained data in Fig. 7a include 6320 compounds, in which 1587 compounds contain the partial occupancy feature. Combining κlat data from our current work, and other typical compounds reported with and without partial occupancy, Fig. 7b highlights their anomalously low κlat values in partially occupied compounds in comparison with common semiconductors,61 with the x- and y-axes indicating their unit cell volume and average mass per atom, respectively. It should be noted that although compounds with partial occupancy often tend to have a large unit cell volume due to the reduction of translational symmetry, their κlat values are significantly lower than those of Zintl compounds that possess a complex crystal structure and heavy atomic mass.62,63
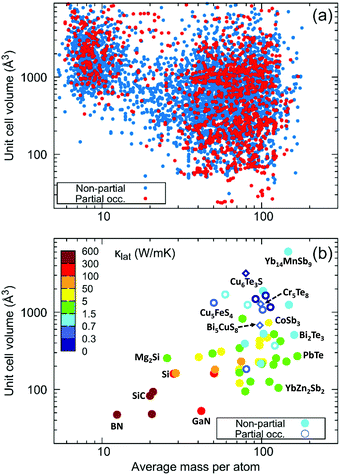 | ||
| Fig. 7 The importance of partial occupancy as a function of unit cell volume and average mass per atom. (a) The obtained database of potential candidates of compounds with partial occupancy; and (b) a comparison of κlat among common semiconductors (including elements, I–V–VI2, I2–IV–VI3, I3–V–VI4, I–V–VI2, II2–IV, III–V, IV–VI, and V3–VI2 compounds),61 Zintl compounds62,63 (including CoSb3, CaZn2Sb2, YbZn2Sb2, Ca3AlSb3, Sr3GaSb3,Yb11InSb9, and Yb14MnSb9) and compounds with partial occupancy (including Ag8GeTe6,64 Ba8Ga16Ge30,65 Ba2Sb2Se5,66 Cu4Bi4Se9,67 Cu5FeS4,68 Cu4Sn7S16,69 Cu2SnSe4,70 Ge1Sb4Te7,71 and Zn8Sb772 as well as Cu6Te3S, Bi5CuS8 and Cr5Te8). Only some important compounds are named in Fig. 7b. | ||
Table S4 (ESI†) lists the corresponding parameters of these common semiconductors and Zintl compounds, as well as the compounds with partial occupancy of Fig. 7b. Therefore, the most significant discovery is the direct observation of low κlat in compounds with partial occupancy, demonstrating the close relationship between intrinsic crystal disorder and thermal properties. This new indicator of atom site occupancy, with no need for time-consuming phonon calculations, enables simple and efficient screening to search for new materials with low κlat.
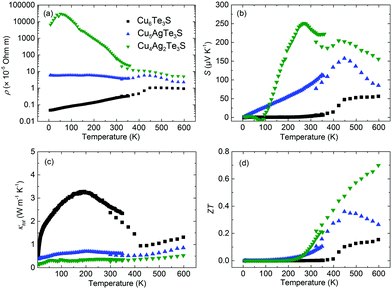
Despite the intrinsically low κlat of Cu6Te3S, the small S, e.g., 6 μV K−1 at 300 K, results in the low thermoelectric performance. The sudden change of thermoelectric properties of Cu6Te3S around 440 K was due to the phase transition, which was confirmed by the differential scanning calorimetry (DSC) analysis (Fig. S11, ESI†). The peak value turns out to be about 439 K, consistent with our thermoelectric properties measurements. Ag alloying on the Cu site was further used to optimize the electrical transport properties. It has been reported that the cation vacancy formation energy can be tuned in (Cu, Ag)2Te,73,74 in which Cu2Te possesses the lowest formation energy, probably due to the small Cu atomic radius. Here a similar tendency is also observed that Ag alloying in Cu6Te3S leads to a significantly increased ρ (Fig. 8a), in agreement with Ag alloying in Cu2Te.73 Specifically, the room-temperature ρ value of Cu4Ag2Te3S is two orders-of-magnitude higher than that of pristine Cu6Te3S. Besides, the temperature dependency changes from the metallic type to the semiconductor type as well. Simultaneously, a remarkable enhancement of S is observed after Ag alloying (Fig. 8b), with the maximum room-temperature value surpassing 200 μV K−1. Thanks to the increased ρ, κtot is obviously reduced (Fig. 8c), where the room-temperature value is about 0.3 W m−1 K−1. It should be noted that the small discrepancy in S (and κtot) between ZEM-2 (laser flash) and PPMS data is due to the radiation heat loss during the PPMS measurement. As a result, Ag alloying in Cu6Te3S enables a significant improvement of ZT (Fig. 8d), the maximum ZT, to about 0.7 at 600 K, which is comparable to the well-optimized Cu2Te based materials at the same temperature range.73
It is highly possible that other donor dopants, such as divalent ions on the Cu site or halogen ions on the Te/S site, can also be effective for improving the ZT of Cu6Te3S. Besides, since Cu6Te3S based materials show an extremely low κlat, increasing the power factor by modulation doping75 and magnetic effects76 may be also promising for the overall enhancement of thermoelectric performance.
Conclusions
In conclusion, we provided new insights into the unique chemical bonding and the complex lattice dynamics of Cu6Te3S, which contains the Cu atom with partial occupancy, and first proposed the use of crystallographic occupancy for the simple and efficient screening of materials with low κlat. The low-temperature lattice thermal conductivity and heat capacity results of Cu6Te3S resemble the amorphous property. Based on DFT calculations, the corresponding microscopic mechanism originates from the anharmonic and anisotropic vibration of the Cu atom, the ionic bond feature around the Cu atom, and the global weak bonding. The importance of partial occupancy in thermal properties was further confirmed using the REST-API framework in the Crystallography Open Database, from which we identified a potential material catalogue in which compounds with partial occupancy exhibit an anomalously lower κlat compared with common semiconductors and Zintl compounds. According to the obtained database, another two compounds with partial occupancy, namely Bi5CuS8 and Cr5Te8, were experimentally synthesized, both of which exhibited a low κlat, of around 0.6 W m−1 K−1 at 300 K. More importantly, Ag alloying on the Cu site in Cu6Te3S further significantly increased the electrical resistivity and achieved an enhanced ZT, which emphasizes the possibility of optimized performance in these compounds with partial occupancy via chemical doping or alloying for thermoelectric applications.Conflicts of interest
There are no conflicts to declare.Acknowledgements
This work was supported by JST Mirai Program Grant Number JPMJMI19A1 and JSPS KAKENHI JP16H06441. The computation in this work has been performed using Numerical Materials Simulator at NIMS.Notes and references
- D. R. Clarke, Surf. Coat. Technol., 2003, 163, 67–74 CrossRef.
- J. Mao, Z. H. Liu, J. W. Zhou, H. T. Zhu, Q. Zhang, G. Chen and Z. F. Ren, Adv. Phys., 2018, 67, 69–147 CrossRef.
- I. Petsagkourakis, K. Tybrandt, X. Crispin, I. Ohkubo, N. Satoh and T. Mori, Sci. Technol. Adv. Mater., 2018, 19, 836–862 CrossRef CAS PubMed.
- G. Tan, M. Ohta and M. G. Kanatzidis, Philos. Trans. R. Soc., A, 2019, 377, 20180450 CrossRef CAS PubMed.
- J. Mao, G. Chen and Z. Ren, Nat. Mater., 2021, 20, 454–461 CrossRef CAS PubMed.
- T. J. Zhu, Y. T. Liu, C. G. Fu, J. P. Heremans, J. G. Snyder and X. B. Zhao, Adv. Mater., 2017, 29, 1605884 CrossRef PubMed.
- Z. H. Liu, Y. M. Wang, J. Mao, H. Y. Geng, J. Shuai, Y. X. Wang, R. He, W. Cai, J. H. Sui and Z. F. Ren, Adv. Energy Mater., 2016, 6, 1502269 CrossRef.
- Z. H. Liu, W. H. Gao, W. H. Zhang, N. Sato, Q. S. Guo and T. Mori, Adv. Energy Mater., 2020, 10, 2002588 CrossRef CAS.
- F. Guo, H. Wu, J. Zhu, H. Yao, Y. Zhang, B. Cui, Q. Zhang, B. Yu, S. J. Pennycook, W. Cai, C.-W. Chu and J. Sui, Proc. Natl. Acad. Sci. U. S. A., 2019, 116, 21998–22003 CrossRef CAS PubMed.
- B. Poudel, Q. Hao, Y. Ma, Y. C. Lan, A. Minnich, B. Yu, X. Yan, D. Z. Wang, A. Muto, D. Vashaee, X. Y. Chen, J. M. Liu, M. S. Dresselhaus, G. Chen and Z. F. Ren, Science, 2008, 320, 634–638 CrossRef CAS PubMed.
- G. Tan, F. Shi, S. Hao, L.-D. Zhao, H. Chi, X. Zhang, C. Uher, C. Wolverton, V. P. Dravid and M. G. Kanatzidis, Nat. Commun., 2016, 7, 12167 CrossRef CAS PubMed.
- A. U. Khan, K. Kobayashi, D.-M. Tang, Y. Yamauchi, K. Hasegawa, M. Mitome, Y. M. Xue, B. Z. Jiang, K. Tsuchiya, D. Golberg, Y. Bando and T. Mori, Nano Energy, 2017, 31, 152–159 CrossRef CAS.
- J. Shuai, Y. Sun, X. Tan and T. Mori, Small, 2020, 1906921 CrossRef CAS PubMed.
- D. Qin, H. Wu, S. Cai, J. Zhu, B. Cui, L. Yin, H. Qin, W. Shi, Y. Zhang, Q. Zhang, W. Liu, J. Cao, S. J. Pennycook, W. Cai and J. Sui, Adv. Energy Mater., 2019, 9, 1902435 CrossRef CAS.
- Z. H. Liu, J. Mao, T.-H. Liu, G. Chen and Z. F. Ren, MRS Bull., 2018, 43, 181–186 CrossRef.
- T. Mori, Small, 2017, 13, 1702013 CrossRef PubMed.
- M. K. Jana and K. Biswas, ACS Energy Lett., 2018, 3, 1315–1324 CrossRef CAS.
- Y. Xiao and L.-D. Zhao, Science, 2020, 367, 1196–1197 CrossRef CAS PubMed.
- T. Mori, J. Martin and G. Nolas, J. Appl. Phys., 2007, 102, 073510 CrossRef.
- E. S. Toberer, A. Zevalkink and G. J. Snyder, J. Mater. Chem., 2011, 21, 15843–15852 RSC.
- T. Mori, J. Solid State Chem., 2019, 275, 70–82 CrossRef CAS.
- D. G. Cahill, H. E. Fischer, S. Watson, R. Pohl and G. Slack, Phys. Rev. B: Condens. Matter Mater. Phys., 1989, 40, 3254 CrossRef CAS PubMed.
- T. Mori, Modules, systems, and applications in thermoelectrics, CRC Press Taylor and Francis, London, 2012, vol. 14 Search PubMed.
- E. J. Skoug and D. T. Morelli, Phys. Rev. Lett., 2011, 107, 235901 CrossRef PubMed.
- M. D. Nielsen, V. Ozolins and J. P. Heremans, Energy Environ. Sci., 2013, 6, 570–578 RSC.
- S. Lee, K. Esfarjani, T. F. Luo, J. W. Zhou, Z. T. Tian and G. Chen, Nat. Commun., 2014, 5, 3525 CrossRef PubMed.
- W. H. Zhang, N. Sato, K. Tobita, K. Kimura and T. Mori, Chem. Mater., 2020, 32, 5335–5342 CrossRef CAS.
- H. Xie, S. Hao, J. Bao, T. J. Slade, G. J. Snyder, C. Wolverton and M. G. Kanatzidis, J. Am. Chem. Soc., 2020, 142, 9553–9563 CrossRef CAS PubMed.
- P. J. Ying, X. Li, Y. C. Wang, J. Yang, C. G. Fu, W. Q. Zhang, X. B. Zhao and T. J. Zhu, Adv. Funct. Mater., 2017, 27, 1604145 CrossRef.
- W. Qiu, L. Xi, P. Wei, X. Ke, J. Yang and W. Zhang, Proc. Natl. Acad. Sci. U. S. A., 2014, 111, 15031–15035 CrossRef CAS PubMed.
- X. Shi, J. Yang, J. R. Salvador, M. F. Chi, J. Y. Cho, H. Wang, S. Q. Bai, J. H. Yang, W. Q. Zhang and L. D. Chen, J. Am. Chem. Soc., 2011, 133, 7837–7846 CrossRef CAS PubMed.
- T. Takabatake, K. Suekuni, T. Nakayama and E. Kaneshita, Rev. Mod. Phys., 2014, 86, 669–716 CrossRef CAS.
- M. Dutta, S. Matteppanavar, M. V. D. Prasad, J. Pandey, A. Warankar, P. Mandal, A. Soni, U. V. Waghmare and K. Biswas, J. Am. Chem. Soc., 2019, 141, 20293–20299 CrossRef CAS PubMed.
- L.-D. Zhao, S.-H. Lo, Y. S. Zhang, H. Sun, G. J. Tan, C. Uher, C. Wolverton, V. P. Dravid and M. G. Kanatzidis, Nature, 2014, 508, 373–377 CrossRef CAS PubMed.
- J. Hong and O. Delaire, Mater. Today Phys., 2019, 10, 100093 CrossRef.
- H. L. Liu, X. Shi, F. F. Xu, L. L. Zhang, W. Q. Zhang, L. D. Chen, Q. Li, C. Uher, T. Day and G. J. Snyder, Nat. Mater., 2012, 11, 422–425 CrossRef CAS PubMed.
- K. P. Zhao, P. F. Qiu, Q. F. Song, A. B. Blichfeld, E. Eikeland, D. Ren, B. H. Ge, B. B. Iversen, X. Shi and L. D. Chen, Mater. Today Phys., 2017, 1, 14–23 CrossRef.
- S. Q. Lin, W. Li, S. S. Li, X. Y. Zhang, Z. W. Chen, Y. D. Xu, Y. Chen and Y. Z. Pei, Joule, 2017, 1, 816–830 CrossRef CAS.
- J. Zhang, J. Zhu, L. You, K. Guo, Z. Li, W. Lin, J. Huang and J. Luo, Mater. Today Phys., 2019, 10, 100095 CrossRef.
- K. Zhao, P. Qiu, X. Shi and L. Chen, Adv. Funct. Mater., 2020, 30, 1903867 CrossRef CAS.
- J. Carrete, W. Li, N. Mingo, S. Wang and S. Curtarolo, Phys. Rev. X, 2014, 4, 011019 CAS.
- R. Gautier, X. W. Zhang, L. H. Hu, L. P. Yu, Y. Y. Lin, T. O. Sunde, D. Chon, K. R. Poeppelmeier and A. Zunger, Nat. Chem., 2015, 7, 308 CrossRef CAS PubMed.
- T. Wang, C. Zhang, H. Snoussi and G. Zhang, Adv. Funct. Mater., 2020, 30, 1906041 CrossRef CAS.
- M. Giller, C. Grotz, B. W. Rudyk, A. Mar and T. Nilges, Z. Kristallogr., 2014, 229, 831–839 CAS.
- G. Nolas, J. Cohn and G. Slack, Phys. Rev. B: Condens. Matter Mater. Phys., 1998, 58, 164 CrossRef CAS.
- Y. Kikuchi, Y. Bouyrie, M. Ohta, K. Suekuni, M. Aihara and T. Takabatake, J. Mater. Chem. A, 2016, 4, 15207–15214 RSC.
- K. Suekuni, Y. Shimizu, E. Nishibori, H. Kasai, H. Saito, D. Yoshimoto, K. Hashikuni, Y. Bouyrie, R. Chetty, M. Ohta, E. Guilmeau, T. Takabatake, K. Watanabe and M. Ohtaki, J. Mater. Chem. A, 2019, 7, 228–235 RSC.
- X. Shi, J. Y. Cho, J. R. Salvador, J. Yang and H. Wang, Appl. Phys. Lett., 2010, 96, 162108 CrossRef.
- B. L. Pedersen, H. Birkedal, B. B. Iversen, M. Nygren and P. T. Frederiksen, Appl. Phys. Lett., 2006, 89, 242108 CrossRef.
- D. G. Cahill, H. E. Fischer, T. Klitsner, E. Swartz and R. Pohl, J. Vac. Sci. Technol., A, 1989, 7, 1259–1266 CrossRef CAS.
- D. G. Cahill, S. K. Watson and R. O. Pohl, Phys. Rev. B: Condens. Matter Mater. Phys., 1992, 46, 6131 CrossRef CAS PubMed.
- J. Cohn, G. Nolas, V. Fessatidis, T. Metcalf and G. Slack, Phys. Rev. Lett., 1999, 82, 779 CrossRef CAS.
- H. Liu, J. Yang, X. Shi, S. A. Danilkin, D. Yu, C. Wang, W. Zhang and L. Chen, J. Materiomics, 2016, 2, 187–195 CrossRef.
- M. T. Dove, M. J. Harris, A. C. Hannon, J. M. Parker, I. P. Swainson and M. Gambhir, Phys. Rev. Lett., 1997, 78, 1070 CrossRef CAS.
- T. Tanaka, Y. Shi, T. Mori and A. Leithe-Jasper, J. Solid State Chem., 2000, 154, 54–60 CrossRef CAS.
- W. Phillips, J. Low Temp. Phys., 1972, 7, 351–360 CrossRef CAS.
- P. Vaqueiro, G. Guélou, A. Kaltzoglou, R. I. Smith, T. Barbier, E. Guilmeau and A. V. Powell, Chem. Mater., 2017, 29, 4080–4090 CrossRef CAS.
- O. Delaire, J. Ma, K. Marty, A. F. May, M. A. McGuire, M. H. Du, D. J. Singh, A. Podlesnyak, G. Ehlers, M. Lumsden and B. C. Sales, Nat. Mater., 2011, 10, 614–619 CrossRef CAS PubMed.
- Z. H. Liu, Y. S. Zhang, J. Mao, W. H. Gao, Y. M. Wang, J. Shuai, W. Cai, J. H. Sui and Z. F. Ren, Acta Mater., 2017, 128, 227–234 CrossRef CAS.
- A. Savin, R. Nesper, S. Wengert and T. F. Fässler, Angew. Chem., Int. Ed. Engl., 1997, 36, 1808–1832 CrossRef CAS.
- O. Madelung, Semiconductors: Data Handbook, Springer, Berlin Heidelberg, New York, 2004 Search PubMed.
- E. S. Toberer, A. F. May and G. J. Snyder, Chem. Mater., 2009, 22, 624–634 CrossRef.
- J. Shuai, J. Mao, S. W. Song, Q. Y. Zhang, G. Chen and Z. F. Ren, Mater. Today Phys., 2017, 1, 74–95 CrossRef.
- A. Charoenphakdee, K. Kurosaki, H. Muta, M. Uno and S. Yamanaka, Phys. Status Solidi RRL, 2008, 2, 65–67 CrossRef CAS.
- X. Hou, Y. Zhou, L. Wang, W. Zhang, W. Zhang and L. Chen, J. Alloys Compd., 2009, 482, 544–547 CrossRef CAS.
- J. Wang, K. Lee and K. Kovnir, J. Mater. Chem. C, 2015, 3, 9811–9818 RSC.
- Y. Jiang, F. Jia, L. Chen and L.-M. Wu, ACS Appl. Mater. Interfaces, 2019, 11, 36616–36625 CrossRef CAS PubMed.
- P. Qiu, T. Zhang, Y. Qiu, X. Shi and L. Chen, Energy Environ. Sci., 2014, 7, 4000–4006 RSC.
- C. Bourgès, P. Lemoine, O. I. Lebedev, R. Daou, V. Hardy, B. Malaman and E. Guilmeau, Acta Mater., 2015, 97, 180–190 CrossRef.
- W. Li, S. Q. Lin, X. Y. Zhang, Z. W. Chen, X. F. Xu and Y. Z. Pei, Chem. Mater., 2016, 28, 6227–6232 CrossRef CAS.
- P. Konstantinov, L. Shelimova, E. Avilov, M. Kretova and V. Zemskov, Inorg. Mater. (Transl. Neorg. Mater.), 2001, 37, 662–668 CrossRef CAS.
- J. Wang and K. Kovnir, J. Am. Chem. Soc., 2015, 137, 12474–12477 CrossRef CAS PubMed.
- K. Zhao, K. Liu, Z. Yue, Y. Wang, Q. Song, J. Li, M. Guan, Q. Xu, P. Qiu, H. Zhu, L. Chen and X. Shi, Adv. Mater., 2019, 31, 1903480 CrossRef CAS PubMed.
- R. Wu, Z. Li, Y. Li, L. You, P. Luo, J. Yang and J. Luo, J. Materiomics, 2019, 5, 489–495 CrossRef.
- M. Zebarjadi, G. Joshi, G. Zhu, B. Yu, A. Minnich, Y. Lan, X. Wang, M. Dresselhaus, Z. Ren and G. Chen, Nano Lett., 2011, 11, 2225–2230 CrossRef CAS.
- J.-B. Vaney, S. A. Yamini, H. Takaki, K. Kobayashi, N. Kobayashi and T. Mori, Mater. Today Phys., 2019, 9, 100090 CrossRef.
Footnotes |
| † Electronic supplementary information (ESI) available. See DOI: 10.1039/d1ee00738f |
| ‡ These authors contributed equally to this work. |
| This journal is © The Royal Society of Chemistry 2021 |

