Multicomponent diffusion in atmospheric aerosol particles
Received
30th September 2020
, Accepted 14th December 2020
First published on 4th January 2021
Abstract
Condensed phase mass transport in single aerosol particles is investigated using a linear quadrupole electrodynamic balance (LQ-EDB) and the Maxwell–Stefan (MS) framework. In the LQ-EDB experiments, water loss from model aqueous inorganic–organic aerosol particles composed of water, ammonium sulfate (AS) and citric acid (CA) is measured by tracking morphology-dependent resonances that appear in light scattering spectra. Characteristic equilibration times are found to not follow simple mixing rules and can be much longer than those of either aqueous CA or aqueous AS. To understand these observations, we develop a multicomponent (more than two components) model based on the MS diffusion model. Activities in the mixture are calculated using the aerosol inorganic–organic mixtures functional groups activity coefficients (AIOMFAC) thermodynamic model. Fluxes from the MS equation are incorporated into an adaptive finite-volume scheme that we use to numerically solve the mass transport problem in a spherical particle with a moving boundary. The resulting model is applied to the aqueous AS/CA system and is able to provide an accurate quantitative description of measured equilibration times. The longer equilibration times in aqueous AS/CA can be understood to result from thermodynamic nonideality rather than, for instance, a phase change.
Environmental significance
In this work, we study mass transport in atmospherically relevant inorganic–organic aerosol particles using both laboratory-based measurements and a multicomponent diffusion model. Diffusion influences many important physical properties in aerosol such as size, phase and optical properties. We demonstrate that for certain mixing ratios of organic to inorganic solutes, water transport can be significantly impeded. Furthermore, we illustrate that the behaviour is very different from that of the extensively studied binary systems which are often used as surrogates for atmospheric particles. We are able to successfully model this phenomenon using a framework where mass transport is driven by gradients in chemical potential. These results provide new insight into mass transport in atmospheric aerosol particles.
|
1 Introduction
Aerosols in the atmosphere regulate global climate through light scattering and cloud interactions, and have negative impacts on air quality and human health.1 The phase state, size and composition of aerosol particles are important properties to consider in describing the overall effects of aerosol.2–5 These determine, for example, the role of aerosol in radiative forcing, through both direct scattering of light and indirect effects due to their role in cloud formation.6–10 A detailed understanding of atmospheric aerosol is challenging, however, due to their chemical and physical complexity and the evolution of particle size, composition and morphology over time in response to environmental conditions. The timescales for these changes depend on many factors, such as the rate of diffusive mass transport in both the gas and condensed phases, and determine whether the aerosol exists in an equilibrium state.
Condensed phase diffusion plays an integral role in many atmospheric aerosol processes. The formation of a glassy phase in aerosol particles can influence aerosol–cloud interactions by causing enhanced ice nucleation, for example.11–14 Mass transport delays associated with low diffusivity can hinder gas-particle partitioning of semi-volatile organics.15–18 Diffusion limitations are also known to significantly impede condensed phase chemical reactions in aerosol,19,20 but can also lead to increased oxidation of the exposed outer surface,21,22 creating steep chemical gradients. Chemical gradients also develop in diffusion-limited particles in response to changes in ambient relative humidity (RH) that occur on a faster timescale than characteristic liquid–vapor equilibration times.23 Developing a fundamental understanding of diffusion and applying an accurate representation to atmospheric aerosol is thus an area of immense interest.
Water transport limitations in single aerosol particles can readily be studied through spectroscopic techniques that monitor morphology dependent resonances (MDRs) over time during water uptake and loss.23–29 For a homogeneous spherical particle, the spectral positions of MDRs will depend on the radius and refractive index of the particle. These MDR positions can be fit with Mie theory allowing for the accurate retrieval of particle size and the refractive index.30,31 For aerosol particles where condensed phase diffusion limits water uptake and loss in response to a RH step, inhomogeneities in composition will exist during the equilibration time due to the presence of concentration gradients as water transport takes place. As Mie theory is only accurate for a spherical particle with a homogeneous composition (uniform refractive index profile), it should not strictly be applied to the analysis of light scattering from particles in these non-equilibrium states. However, MDR shifts will still provide information on the relative radius change over time.27
To date, the majority of studies on condensed phase diffusion in single particles have focused on droplets with two components (water + one solute). These studies have been crucial to our current understanding of mass transport in the condensed aerosol phase. However, atmospheric aerosol particles are multicomponent in nature.32 The use of binary descriptions of diffusion may be misleading when attempting to understand multicomponent systems. For example, experiments have shown that mixing two sugars (surrogates for oxidized organic material) can result in water diffusivities lower than either limiting binary solute.17,33 Conversely, experiments on mixed systems of sucrose and sodium chloride resulted in faster equilibration times and higher diffusivities as the molar ratio of sodium chloride was increased.34 While these examples may be qualitatively rationalized through changes in viscosity, a physically accurate model of diffusion in ternary systems is required for a quantitative description. Thus, equilibration times may be misrepresented in atmospheric aerosol if multicomponent diffusion is improperly implemented. In fact, other fields of research have long established that mass transport in multicomponent systems can deviate significantly from binary systems.35–38
In the Fickian description of diffusion, transport is driven by concentration gradients (mass or molar). In the Maxwell–Stefan (MS) framework, diffusion is driven by gradients in chemical potential. From an experimental point of view, this driving force makes the MS model less appealing than the Fickian model as chemical potential gradients cannot be directly measured whereas concentration gradients can be. Certainly, when dealing with binary systems, Fick's laws are used in the vast majority of studies. However, for multicomponent systems (>2 components), there are benefits of the MS model that can significantly outweigh the difficulties of working with chemical potential gradients over concentration gradients. These include: the symmetry of the MS diffusion coefficients, their relationship to binary diffusivities, their weaker dependence on concentration in many cases, and their lack of dependence of a reference frame.39 These statements are not true for Fickian diffusivities and are a hindrance to their application in multicomponent solutions. We will discuss these properties and their specific application to ternary diffusion in Section 3.
Defining chemical potential gradients (or gradients of the natural logarithm of activity) has historically been a major limitation in applying the MS framework. Depending on the methodology that is used to calculate activities, drastically different mass or molar fluxes can be obtained.40,41 However, the atmospheric aerosol community has been very successful in the development of thermodynamic models that allow for the accurate calculation of solute and solvent activities in solutions. The aerosol inorganic–organic mixtures functional groups activity coefficients (AIOMFAC)42 model and the extended aerosol inorganics model (E-AIM)43 are two popular tools for thermodynamic modelling. Based on the previous application of the MS framework to binary systems of atmospheric interest,44 it is anticipated that errors from activity calculations will be small for multicomponent solutions.
In this work, we apply the MS framework to water loss in a spherical particle containing more than two components. We present the numerical solution to the diffusion-convection problem where fluxes are calculated using the MS equations and activities are calculated using AIOMFAC. The model is used to analyze water loss measurements for mixed aqueous ammonium sulfate/citric acid (AS/CA) particles that were performed using a linear quadrupole electrodynamic balance (LQ-EDB). In this experiment, equilibration timescales were determined by monitoring MDRs over time in response to a step-wise change in RH. The AS/CA system was chosen as a model for atmospheric inorganic–organic particles in this work as both ammonium and sulfate are common in tropospheric aerosol45 and CA is a common surrogate for secondary organic material found in organic aerosol particles.11 Furthermore, diffusivity measurements for aqueous AS are available46 and binary diffusion in aqueous CA is now well studied.25,47–49 We are able to quantitatively explain the observed trend in the characteristic equilibration time as a function of the molar ratio of AS/CA. We also discuss the physical origin of the increase in equilibration time that is observed for certain ratios of AS/CA.
2 Experimental
2.1 Materials
Solutions were prepared in HPLC water using citric acid (>99.5%, Sigma-Aldrich) and ammonium sulfate (>99% VWR) without further purification. All ternary solutions were prepared using molar ratios.
2.2 Instrumentation
Single particle experiments were performed with a LQ-EDB. The ambient temperature was always 298 K. The experimental setup has been outlined in more detail in previous work and thus will only be briefly described here.50,51 Incoming droplets are inductively charged at generation with an electrode placed at the entrance of the trapping cell. The charged droplet is spatially confined along the axis of the trap by four stainless-steel rods with an applied oscillating voltage while an additional electrode provides a repulsive electrostatic force to balance vertical forces on the droplet and hold it in a fixed position. Illumination of the droplet using a 532 nm laser (Laser Quantum Gem) allowed imaging of the trapped droplet in a CMOS camera (Thorlabs DCC1545). Stable trapping throughout the entirety of the experiment is achieved by continually varying the DC voltage of the base electrode through a PID feedback loop controlled with LabVIEW software. The RH in the trapping chamber is controlled using two mass flow controllers by mixing wet and dry nitrogen into the cell. The droplet was additionally illuminated with broadband white light from a LED (Thorlabs MCWHL5) and resonance spectra were collected in a back-scattered configuration with a spectrometer (FERGIE, Princeton Instruments, 1200 grooves per mm grating).
2.3 Measuring the characteristic equilibration time
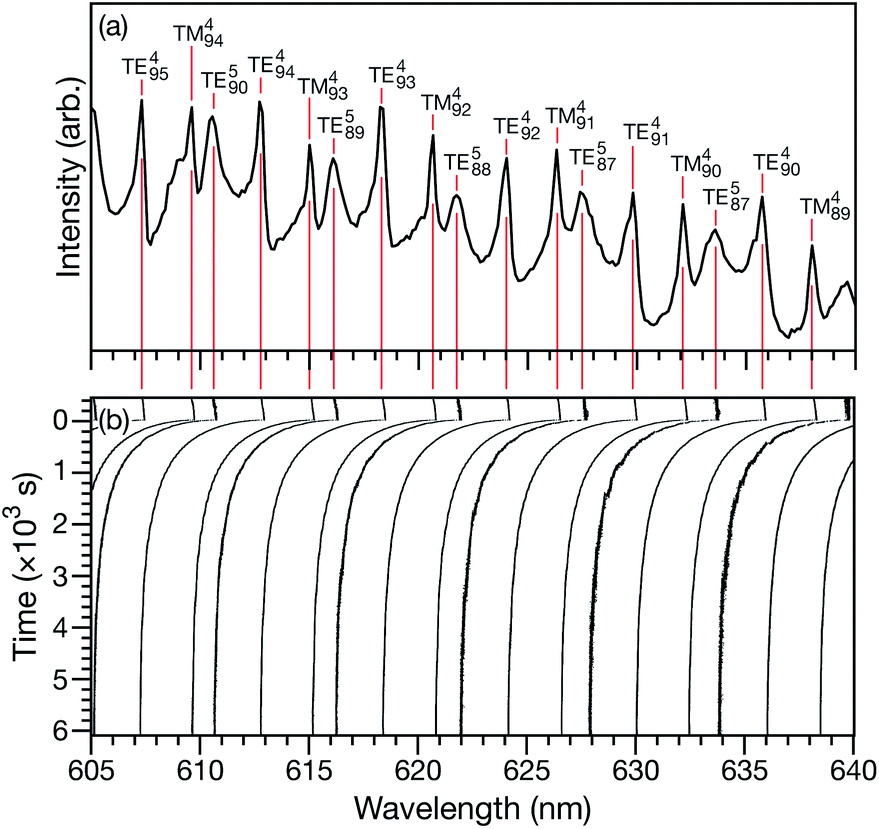
Characteristic equilibration times (or e-folding times), τ, for aqueous AS/CA particles were measured as follows: particles were held at an initial RH until MDR positions would no longer shift over time (λi). At this point, it was assumed that the particle was in equilibrium with the surrounding RH. Sizing of a particle in this equilibrated state could then be performed using Mie theory and the measured MDR positions (Fig. 1a).30 The RH of the cell was then changed to its final state (<5 s for the cell to reach this state) and the response of the particle to the change in RH could be tracked over time by monitoring MDR positions (Fig. 1b). Once the MDR positions stopped changing (λf) it was assumed that the particle was in equilibrium with the final RH and the particle could once again be sized using Mie theory. Using the time-dependent wavelength response to the RH change, τ will be the time at which the MDR wavelength satisfies| | | λ(τ) = (λi − λf)/e + λf. | (1) |
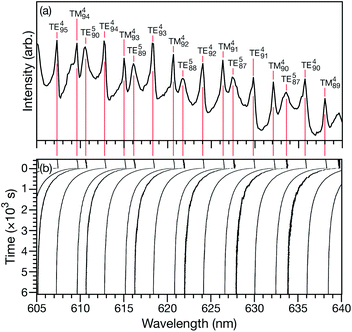 |
| | Fig. 1 (a) Broadband spectrum of an aqueous citric acid aerosol particle in the LQ-EDB. The particle is in equilibrium with the surrounding RH of 20%. The peaks have been labeled with their MDR assignments. (b) Movement of the MDRs in response to a RH change from 20 to 10% at t = 0 s. | |
For a given RH step, the response of many MDRs were analyzed and the average value of τ was reported (e.g. for the measurement shown in Fig. 1b, 15 MDRs would be used).
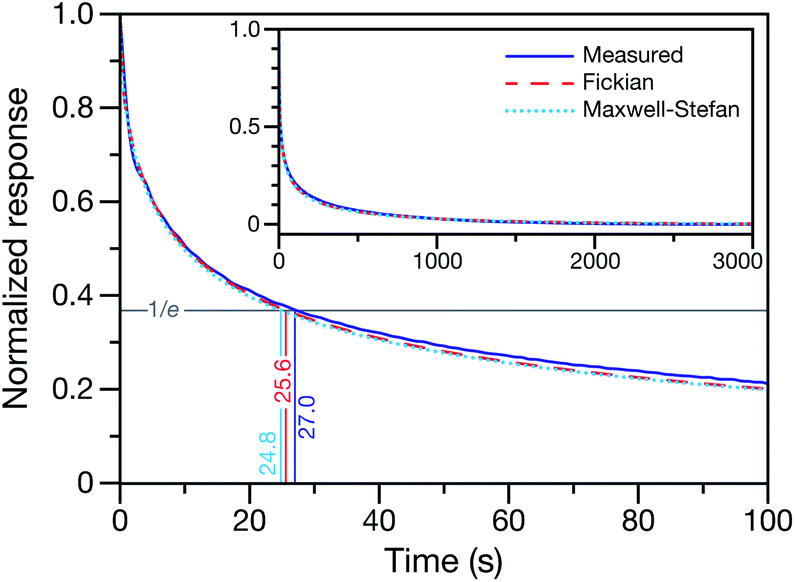
This technique for determining τ from the MDR response to a RH change was validated using aqueous CA particles. Fig. 2 compares the response from a measured MDR wavelength to the response in radius from two numerical calculations (one performed using the Fickian framework and one performed using the MS framework discussed in Section 3). Agreement was always found to be within the uncertainty of the measurement.
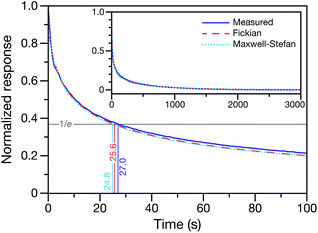 |
| | Fig. 2 Measured and calculated normalized response curves for aqueous CA. The aqueous CA particle is initially in equilibrium with the surrounding RH of 40%. At t = 0, the RH of the cell is lowered to 10%. For the experimental measurement, the response is determined using a measured MDR wavelength and eqn (1). For the numerical calculations, the time-dependent radius is used instead of a MDR wavelength when calculating the response. Both the Fickian24 and MS (see Section 3) frameworks were used for the calculations. Inset shows the measurement and calculations over the entire time period of the experiment. | |
3 Theory
3.1 Maxwell–Stefan diffusion
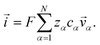
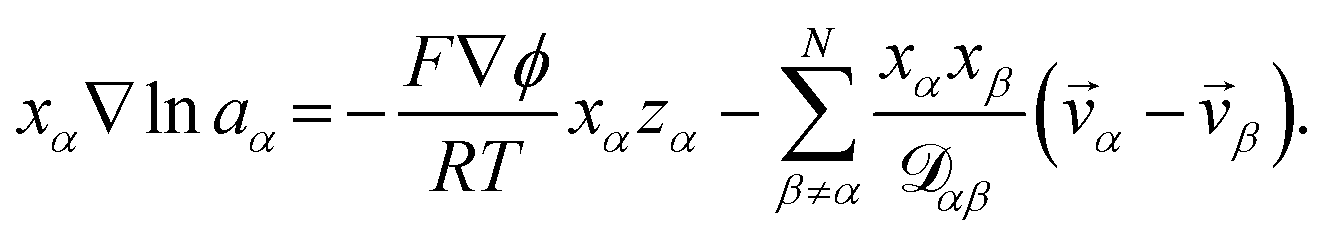
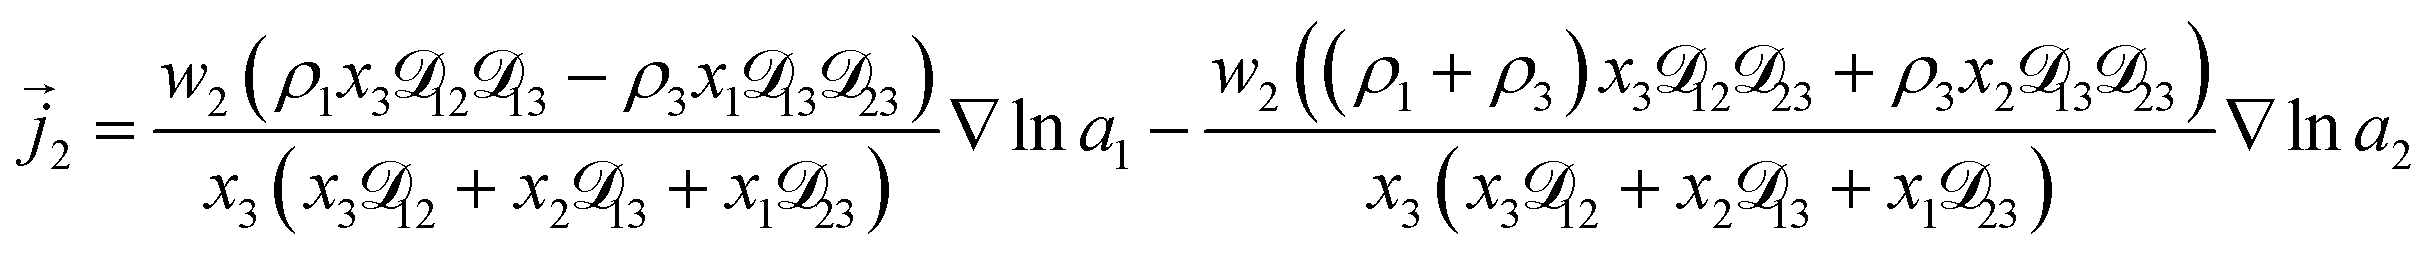
To model multicomponent diffusion in an aqueous system containing both electrolytes and non-dissociating organic solutes, we use the MS equations to describe either the mass flux, ![[j with combining right harpoon above (vector)]](https://www.rsc.org/images/entities/i_char_006a_20d1.gif) α, or molar flux,
α, or molar flux,  , of species, α. At constant temperature T and pressure p, the MS equation can be written as52
| |  | (2) |
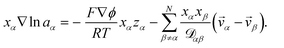
where, for species α, aα is the activity, xα is the mole fraction, ρα is the mass concentration, wα is the mass fraction and ![[v with combining right harpoon above (vector)]](https://www.rsc.org/images/entities/i_char_0076_20d1.gif) α is the velocity. The force per unit mass acting on species α is
α is the velocity. The force per unit mass acting on species α is ![[g with combining right harpoon above (vector)]](https://www.rsc.org/images/entities/i_char_0067_20d1.gif) α. The activity is defined as aα = γαxα, where γα is the activity coefficient. The total number of species in solution, including the solvent, is N, the total molar concentration is c, and R is the gas constant.
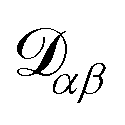
α. The activity is defined as aα = γαxα, where γα is the activity coefficient. The total number of species in solution, including the solvent, is N, the total molar concentration is c, and R is the gas constant.  are the multicomponent MS diffusivities. The inverse of these diffusivities can be thought of as drag or friction coefficients53 and the N × N matrix will have
  independent elements
  and these elements are symmetric
  .54 The relationship between the velocity of a species α and its mass flux is defined as α = α/ρα − , where is the mass average velocity. The relationship between the velocity of a species α and its molar flux is defined as
  , where cα is the molar concentration of species α and * is the molar average velocity. The sum of all mass or molar fluxes is equal to zero.
The solution considered in this work will contain charged species, so we set the external force per unit mass to
| | 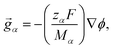 | (3) |
where
zα and
Mα are the charge number and molar mass of species
α, respectively,
F is the Faraday constant, and
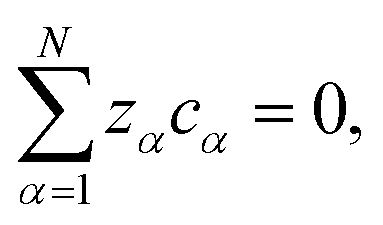
ϕ is the electrostatic potential. If the condition of electroneutrality,
| |  | (4) |
is satisfied, then
eqn (2) can be written as
| |  | (5) |
The term containing the gradient of the electrostatic potential in the system of equations generated by eqn (5) can always be eliminated if electroneutrality is satisfied.
3.2 Mass flux in an aqueous solution containing both charged and uncharged species
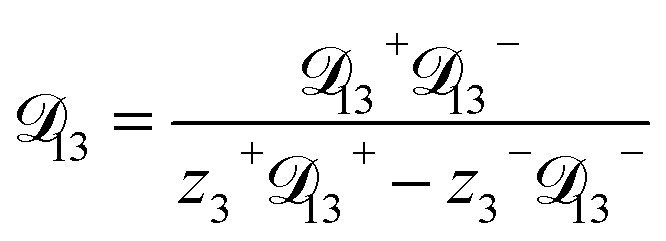
In this section we apply the MS equation to the specific case of an aqueous solution containing an uncharged solute (labeled 2) and an electrolyte (labeled 3) that dissociates completely in water (labeled 1). The concentration of the electrolyte and its two ions are related through c3 = c3−/z3+ = −c3+/z3−, where the superscript + denotes a positive species and the superscript − denotes a negative species.
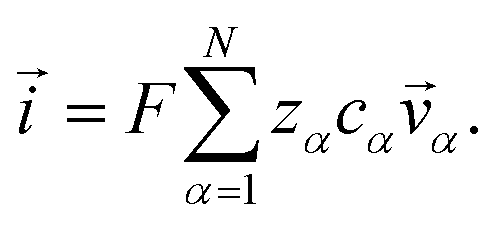
The current ![[i with combining right harpoon above (vector)]](https://www.rsc.org/images/entities/i_char_0069_20d1.gif) in the electrolytic solution is
in the electrolytic solution is
| |  | (6) |
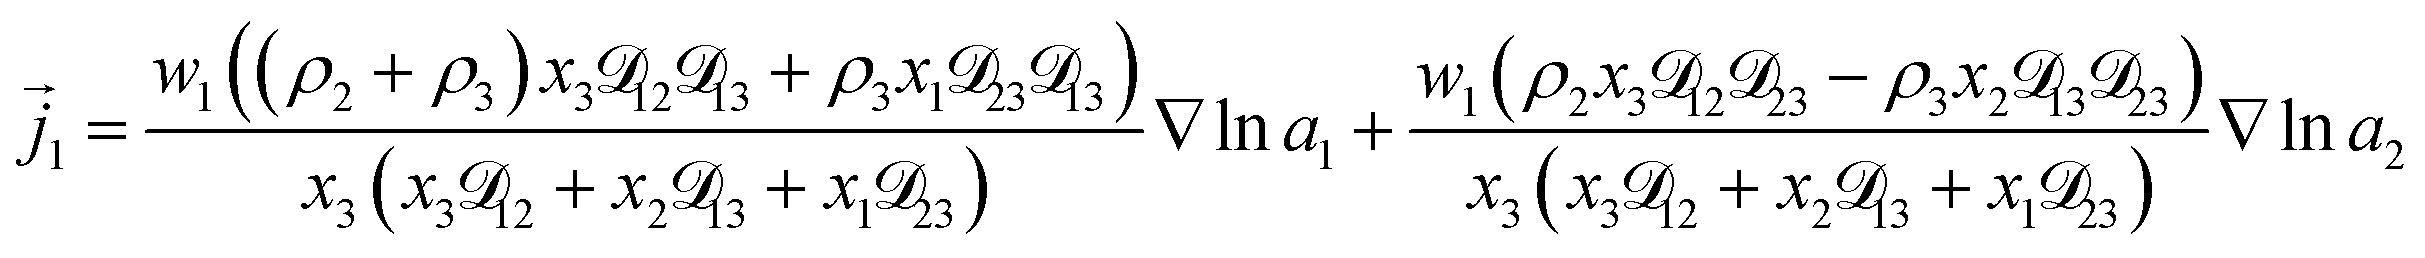
For the solution considered here, under zero current flow ( = 0), eqn (6) yields the condition 3− − 3+ = 0. Applying this result to the set of equations generated with eqn (5), we are able to solve for the mass fluxes of the three components:
| |  | (7) |
| | 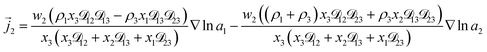 | (8) |
| |  | (9) |
where
| | 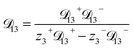 | (10) |
and
| | 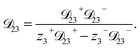 | (11) |
As the solution contains only a single electrolyte, the ions will effectively diffuse as neutral pairs. While the activity coefficient for the electrolyte, a3, does not appear in eqn (7)–(9), it is connected to a1 and a2 through the auxiliary relation that states that the sum of the diffusional driving forces is zero (in this case that relation is x1∇![[thin space (1/6-em)]](https://www.rsc.org/images/entities/char_2009.gif) lna1 + x2∇lna2 + x3∇lna3 = 0).
lna1 + x2∇lna2 + x3∇lna3 = 0).
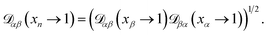
3.3 Diffusion coefficients
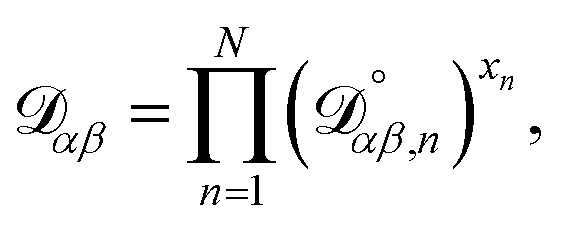
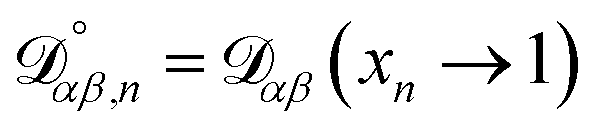
The accurate calculation of multicomponent diffusion coefficients within the MS framework is a challenge.53 Here we use the generalized Vignes equation55| |  | (12) |
where 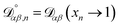 , which is the diffusivity when all components in solution except n are infinitely dilute.
For the case when n ≠ α or β,  physically represents the diffusivity of component n in a binary solution where both components are infinitely dilute and neither component is n. This cannot be measured directly56 and needs to be calculated using a model or treated as a fitting parameter for an experiment where the components of the binary solution are not infinitely dilute. For our system, the most practical model is the geometric average57
| |  | (13) |
We will examine the accuracy of this equation in the analysis of our measurements.
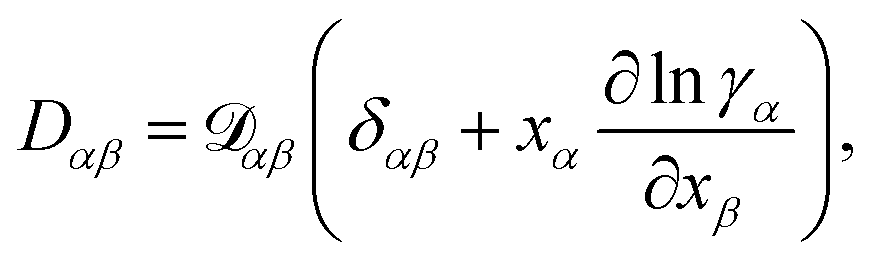
At constant T and p, the relationship between the MS diffusivity and the Fickian diffusivity, Dαβ, is55
| |  | (14) |
where
δαβ is the Kronecker delta.
3.4 Mass transport by diffusion and convection in an aqueous particle
We will consider water uptake or loss in an aqueous particle with a time-dependent radius s(t). The radial components of the mass average velocity and mass flux fields will be v and j, respectively. All other components of these fields are set to zero due to radial symmetry. The equation of continuity for each species α will be| | 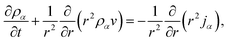 | (15) |
and the continuity equation will be| |  | (16) |
where ρ is the mass density of solution, which is equal to the sum of the mass concentrations of all N species in solution.
The mass density of a multicomponent solution containing N − 1 solutes can be expressed using the density of the pure solvent,  , partial specific volumes,
 ![[v with combining macron]](https://www.rsc.org/images/entities/i_char_0076_0304.gif) α, and mass concentrations of the solutes58
α, and mass concentrations of the solutes58
| |  | (17) |
The solvent in all of the systems studied here is water.
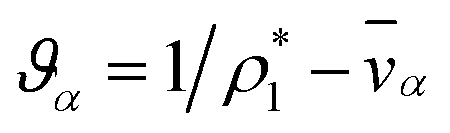
Inserting eqn (17) into eqn (16), assuming α are constant, and then using eqn (15) in order to eliminate all of the partial time-derivatives results in
| | 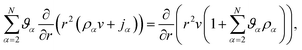 | (18) |
where

.
Eqn (18) can be integrated from 0 to
r to obtain the mass average velocity of the solution
| |  | (19) |
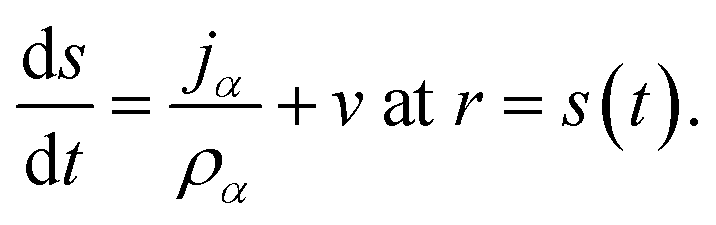
The surface of the particle is a moving boundary and for any species α that is non-volatile it can be shown, using conservation of mass, that47
| | 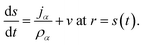 | (20) |
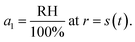
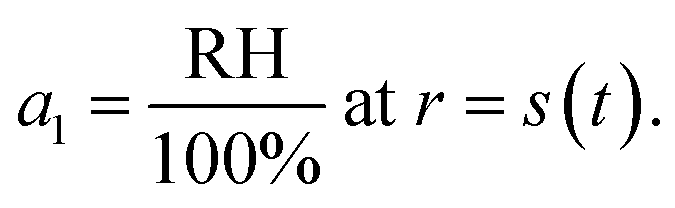
For the second boundary condition at the surface, we will set the water activity, a1, to be in equilibrium with the surrounding RH to yield
| |  | (21) |
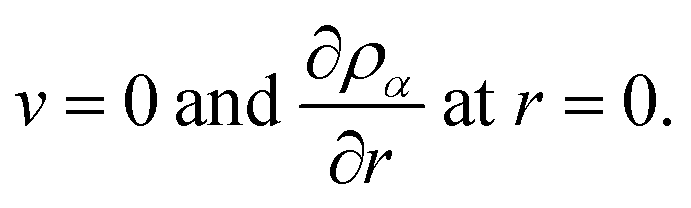
Finally, due to symmetry at the center of the sphere we will have the conditions
| | 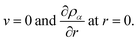 | (22) |
3.5 Numerical solution
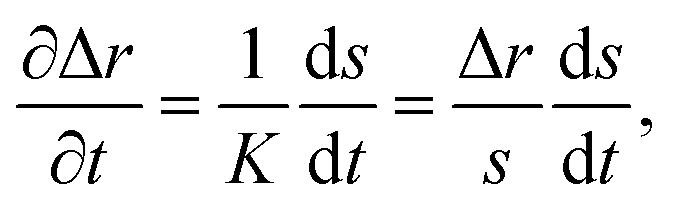
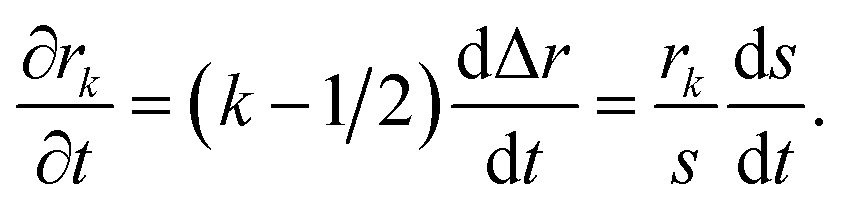
To solve eqn (15) numerically, we use an adaptive grid finite-volume scheme.59,60 The spherical particle is divided into K shells of equal thickness Δr = s(t)/K. For the kth shell, the center will be located at rk = (k − 1/2)Δr, the inner edge will be at rk−1/2 = (k − 1)Δr, and the outer edge will be at rk+1/2 = kΔr. Then, the time-dependence of the shell thickness and shell centers will be59| |  | (23) |
| | 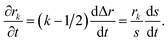 | (24) |
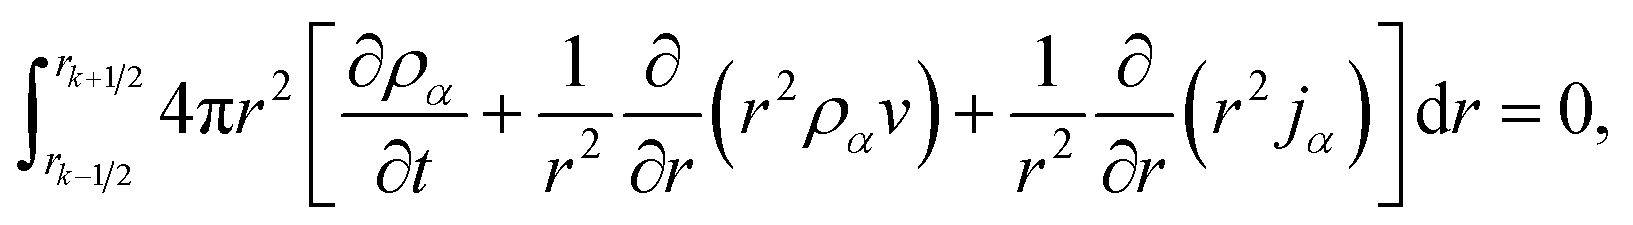
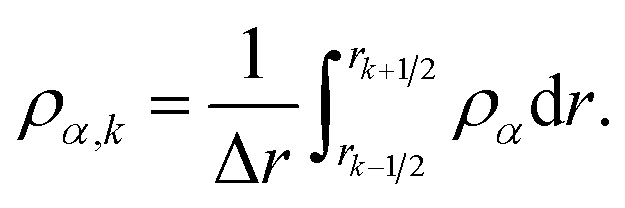
Integrating eqn (15) over the volume of the kth shell,
| | 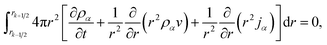 | (25) |
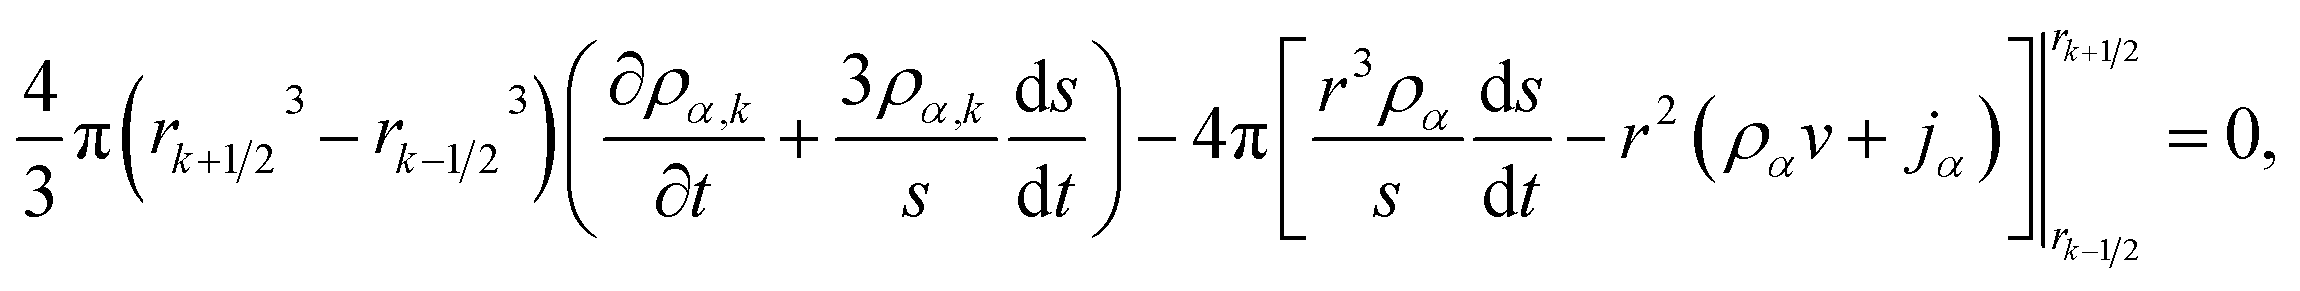
results in, after application the Leibniz integral rule and some manipulation,
| | 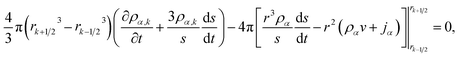 | (26) |
where
| |  | (27) |
In our implementation of eqn (26), ds/dt was evaluated using the boundary condition in eqn (20). In order to apply the boundary condition in eqn (21), we added an extra shell located at rK+1 that always satisfied the boundary condition. Explicit time integration was used in the numerical calculations.
The activities of all components in each shell were calculated using the AIOMFAC thermodynamic model.42,61,62 In practice, this was accomplished by incorporating the AIOMFAC source code files into the code base for our Fortran implementation of the adaptive grid finite-volume scheme outlined above. At every time step, the activities in each shell could then be found by calling the appropriate AIOMFAC subroutines with the mass fraction of each component as the input.
4 Results
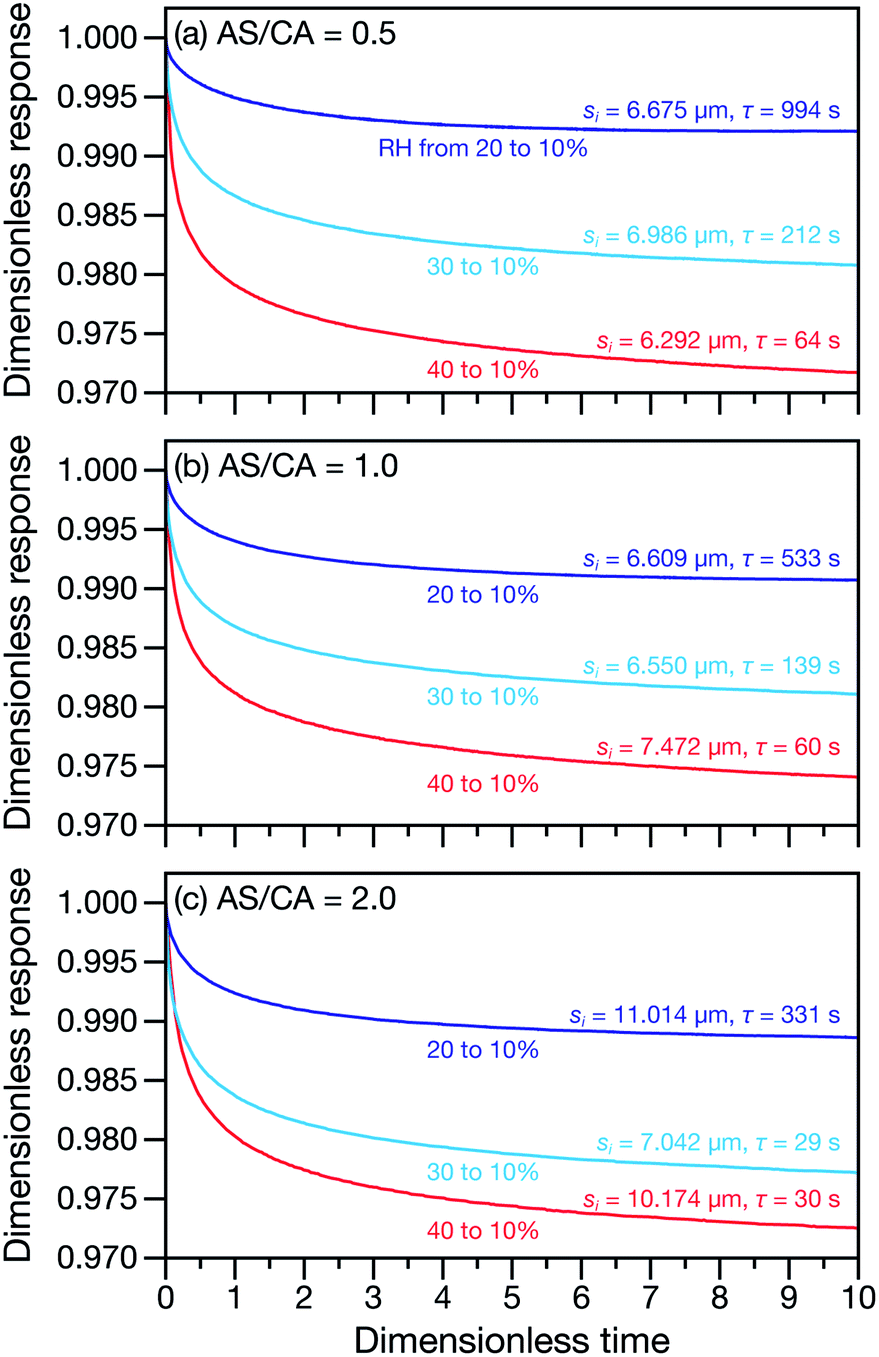
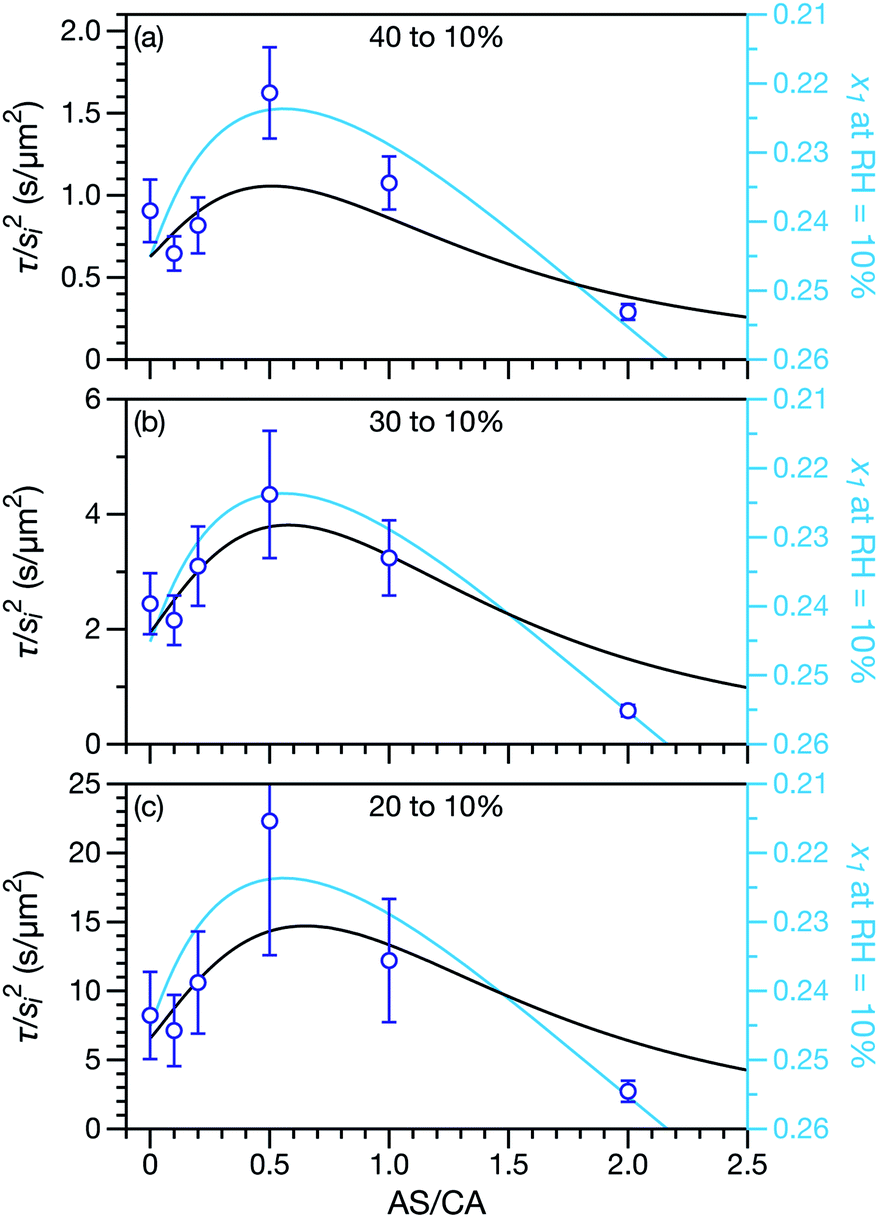
Measured and modelled characteristic equilibration times, τ, for aqueous AS/CA are listed in Table 1. Measured τ were determined using the MDR tracking methodology (Section 2.3) and modelled τ were found using the numerical solution to the change in particle radius that occurs during water loss (Section 3.5). Fig. 3 shows examples of response measurements for three different molar ratios of AS/CA for three different RH step-wise changes. As τ is proportional to the initial radius squared, si2, a comparison between two measurements is not possible unless the initial radii in both cases are nearly identical. To eliminate this size dependence, in Fig. 4 measured values of τ divided by si2 are shown. Fig. 4 also shows modelled curves and the calculated mole fraction of water in the final state. Both of these calculations will be discussed later. The presentation in Fig. 4 allows for a direct comparison between measurements. The most notable result is that at AS/CA = 0.5, the timescale of water loss can roughly double that of AS/CA = 0 for an identical RH change. Water loss at AS/CA = 0.5 is also much slower than of AS/CA = 2.0, beyond which the response of our cell to a RH change is too slow to perform measurements.
Table 1 Measured, τmeas., and simulated, τsim., characteristic equilibration timescales for various molar ratios of AS/CA and RH steps from an initial, i, to final, f, RH. Initial radii, si, are also listed. Simulated times were calculated using the MS framework-based single particle model from Section 3
| AS/CA |
s
i
(μm) |
RHi (%) |
RHf (%) |
τ
meas. (s) |
τ
sim. (s) |
| 0 |
9.131 |
40 |
30 |
9 ± 5 |
4 |
| 0 |
9.131 |
40 |
20 |
25 ± 5 |
14 |
| 0 |
5.12 |
40 |
10 |
24 ± 5 |
16 |
| 0 |
7.473 |
30 |
20 |
44 ± 11 |
23 |
| 0 |
5.827 |
30 |
10 |
83 ± 18 |
66 |
| 0 |
7.67 |
20 |
10 |
484 ± 186 |
386 |
| 0.1 |
6.928 |
40 |
10 |
31 ± 5 |
37 |
| 0.1 |
5.897 |
30 |
10 |
75 ± 15 |
87 |
| 0.1 |
7.262 |
20 |
10 |
376 ± 136 |
460 |
| 0.2 |
5.42 |
40 |
10 |
24 ± 5 |
26 |
| 0.2 |
7.119 |
30 |
10 |
157 ± 35 |
153 |
| 0.2 |
5.93 |
20 |
10 |
373 ± 130 |
378 |
| 0.5 |
12.051 |
40 |
30 |
15 ± 5 |
11 |
| 0.5 |
5.117 |
40 |
20 |
15 ± 5 |
7 |
| 0.5 |
6.292 |
40 |
10 |
64 ± 9 |
42 |
| 0.5 |
7.698 |
30 |
20 |
76 ± 18 |
44 |
| 0.5 |
6.986 |
30 |
10 |
212 ± 54 |
185 |
| 0.5 |
6.675 |
20 |
10 |
994 ± 433 |
638 |
| 1 |
14.11 |
40 |
30 |
15 ± 5 |
11 |
| 1 |
9.516 |
40 |
20 |
40 ± 6 |
18 |
| 1 |
7.472 |
40 |
10 |
60 ± 9 |
48 |
| 1 |
8.228 |
30 |
20 |
58 ± 14 |
41 |
| 1 |
6.55 |
30 |
10 |
139 ± 28 |
141 |
| 1 |
6.609 |
20 |
10 |
533 ± 195 |
582 |
| 2 |
10.174 |
40 |
10 |
30 ± 5 |
40 |
| 2 |
10.808 |
30 |
20 |
19 ± 5 |
29 |
| 2 |
7.042 |
30 |
10 |
29 ± 5 |
74 |
| 2 |
11.014 |
20 |
10 |
331 ± 93 |
777 |
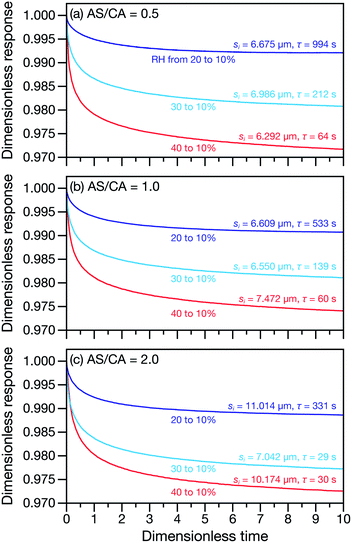 |
| | Fig. 3 Response measurements for AS/CA particles to changes in RH. Three different AS/CA ratios are shown: (a) 0.5, (b) 1.0, and (c) 2.0. Both the characteristic equilibration time, τ, and the initial radius of each particle, si, are also listed next to their associated traces. The dimensionless response is λ(t)/λi, where λ(t) is the time-dependent MDR wavelength position and λi is the MDR wavelength position at t = 0. The dimensionless time is t/τ. | |
 |
| | Fig. 4 Characteristic equilibration time, τ, divided by the initial radius, si, squared. Black curves are calculations using the MS framework-based single particle model from Section 3 and open circles are measurements. For the calculations and the measurements the initial RH was (a) 40%, (b) 30%, or (c) 20%. The final RH was always 10%. The diffusion coefficients used in the calculations are listed in Table 2. The mole fraction of water, x1, in the final state is also shown on a reverse scale in all three panels and plotted using light blue curves. This is discussed in Section 5. | |
In all of the model calculations performed here, the particle was divided into 200 shells. As activities were calculated using AIOMFAC, the only free parameters in the calculation of modelled τ were the diffusion coefficients. Using the labels: (1)-water, (2)-CA, and (3)-AS, the multicomponent MS diffusivities that need to be determined for the ternary system of aqueous AS/CA are  ,
,  , and
, and  . Here we describe how these three MS diffusivities, listed in Table 2, were found.
Table 2 MS diffusivities for (1)-water, (2)-CA, and (3)-AS. See Section 4 for details on how these diffusivities were determined
| Diffusivity |
Value |

|
 m2 s−1 m2 s−1 |

|
2.92 × 10⁻⁹ |

|
1.81 × 10⁻¹⁷ |

|
8.79 × 10⁻¹⁹ |

|
5.10 × 10⁻¹⁰ m2 s−1 |

|
0 |
 : the generalized Vignes equation (eqn (12)) was used when calculating this diffusivity and
  ,
,  , and
, and  were all treated as parameters to be fitted. Parameter optimization was performed using a differential evolution algorithm.63 In the limit of binary aqueous CA, the fitted values of
  and
and  and the Vignes equation agree well with previous binary diffusivity measurements from Davies and Wilson.48Fig. 5 shows a comparison across the activity range studied here. This agreement gives us confidence that the fitted value of
  is also likely reasonable as it was simultaneously determined using the same set of measurements. We also performed optimizations where
  was not treated as a fitting parameter and instead constrained using eqn (13) (the geometric average of
  and
and  ). With this restriction, there was no way to yield even qualitative agreement with all of the measured values of τ.
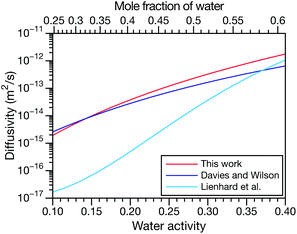 |
| | Fig. 5 Comparison between MS diffusivities for the binary system of water and citric acid from this work, Lienhard et al.25 and Davies and Wilson.48 Fickian diffusion coefficients from ref. 25 and 48 were converted to MS diffusivities using eqn (14). The MS diffusivity from this work was calculated using the parameters in Table 2 in the limit of binary aqueous CA ( when x3 = 0). Diffusivities are plotted as a function of both water activity and mole fraction of water. when x3 = 0). Diffusivities are plotted as a function of both water activity and mole fraction of water. | |
 : binary diffusion coefficient measurements for aqueous ammonium sulfate show a fairly weak dependence on water activity when available data is extrapolated to low water activities.46 Therefore, we assumed that
  was constant and it was calculated with eqn (10) using the listed diffusion coefficients for NH4+ and SO42− in ref. 64, p. 284. As
  will be much greater than
  across the activity range considered here, the accuracy of the chosen value of
  will not be that important for these calculations. All that will matter is that
  .
.
 : this diffusion coefficient can, in principle, be calculated using eqn (11). However, neither
  nor
nor  are accessible through experiments as their measurement would require a binary solution containing only AS and CA. When
  was treated as a free parameter during the optimization process it would always tend towards values that were much smaller than both
  and
and  . Further, if
  was set to values that were comparable to
  , the numerical solution to the moving boundary problem would predict behaviour that was not observed during experiments. As the physical interpretation of MS coefficients is that they represent inverse friction coefficients, it was perhaps reasonable to expect that
  would be much smaller than both
  and
and  . Based on this analysis,
  was set to zero.
In both Fig. 4 and 6, it can be seen that the multicomponent diffusion model developed here does a good job of reproducing the AS/CA-dependent behaviour of τ. The results in Fig. 4 clearly show that the model captures the correct behaviour of τ across the studied range of AS/CA ratios. The shortcomings of the model are that it under-predicts τ near the peak of the curve (AS/CA ∼ 0.5) and over-predicts τ at large AS/CA. However, the general agreement is still good. Fig. 6 visualizes the entire measured and simulated dataset tabulated in Table 1. The closer the points are to the straight line, the better the accuracy of the model is. Overall, there is satisfactory agreement between measured and predicted values of τ.
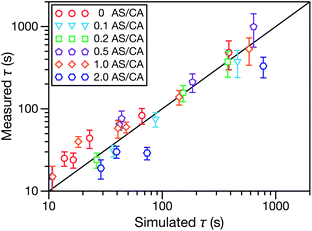 |
| | Fig. 6 Measured vs. simulated characteristic equilibration time, τ, for the five different molar ratios of AS to CA studied here. More details on the data in this figure are given in Table 1. The simulated values of τ were calculated numerically using the implementation of MS diffusion in a spherical particle from Section 3. The solid line is added to guide the eye. | |
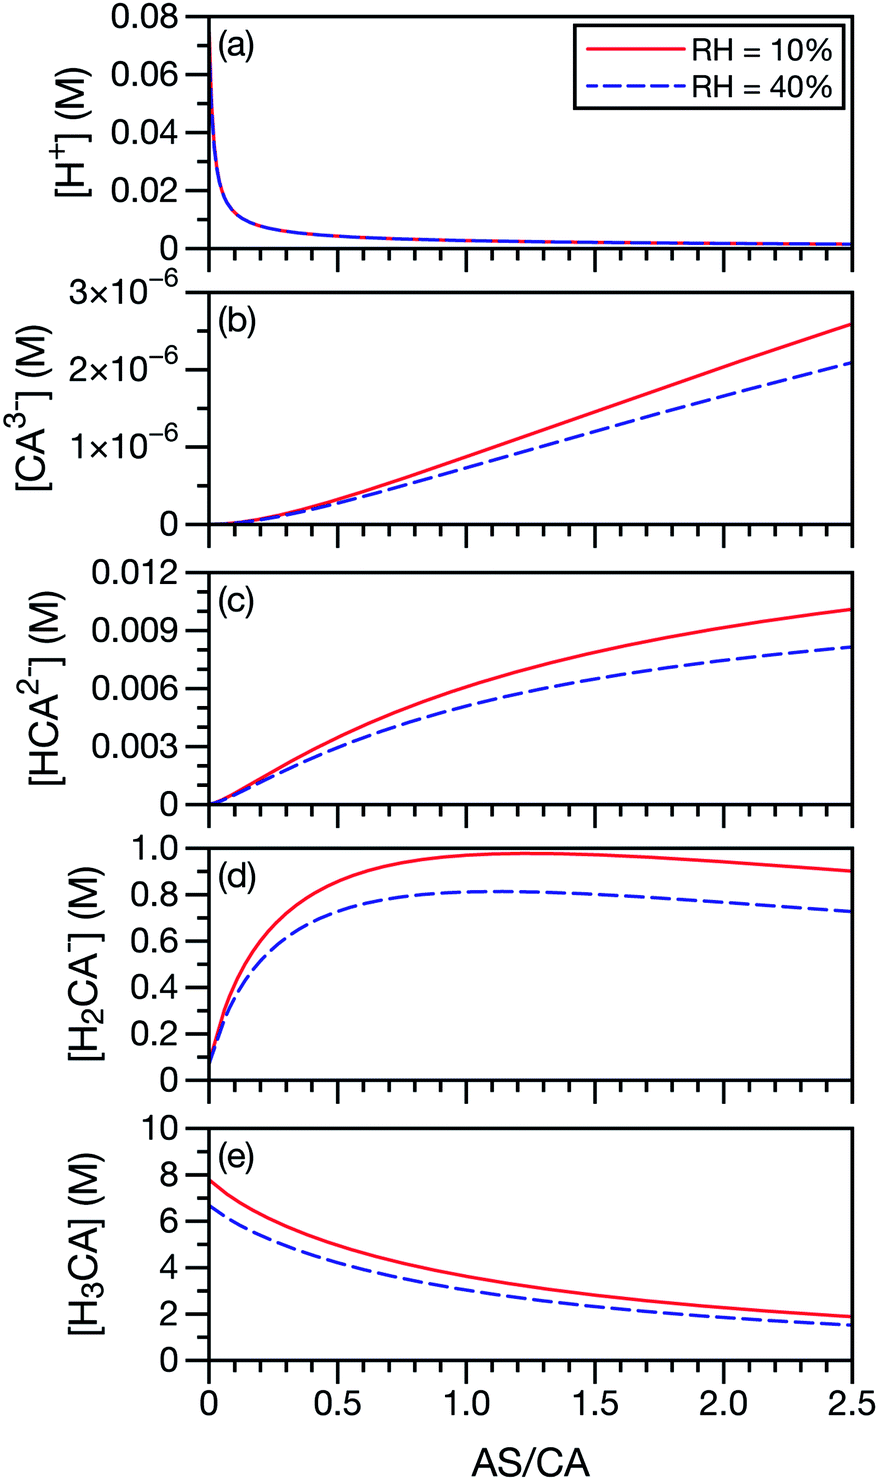
In our application of the MS framework to aqueous AS/CA, we have treated CA, a polyprotic acid, as always being in its neutral form. To investigate the potential role of acid dissociation in this system, we calculated the species concentrations of CA and H+ at the two RH limits considered in the measurements (10% and 40%). Concentrations were determined using AIOMFAC and the pKas for CA, SO42−, and NH4+. For this calculation, we have also used the free-H+ approximation, where the activity coefficient of H+ is set to unity. When exact pH calculations are not possible, the free-H+ approximation has proven to be a reliable estimate.65 In Fig. 7, it can be seen that the neutral form of CA is the most dominant CA species present at low AS/CA ratios and at high AS/CA ratios it is still larger than H2CA− by a factor of two. The concentrations of the two other CA species, HCA2− and CA3−, are negligible across both the AS/CA and RH ranges studied here. The behavior of the species concentrations of CA do not correlate with the observed measurements shown in Fig. 4 (e.g. no maximum or minimum near AS/CA ∼ 0.5). It seems very unlikely that pH and CA speciation play a significant role in water transport in aqueous AS/CA.
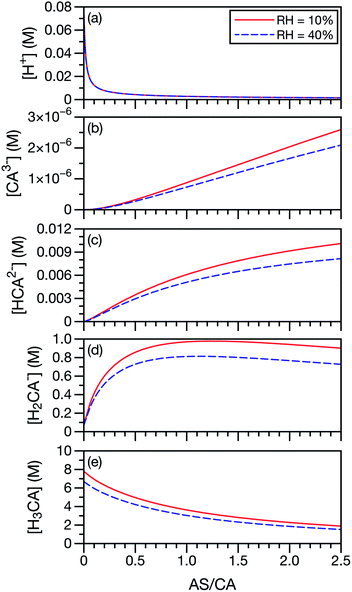 |
| | Fig. 7 Species concentrations of CA and H+ as a function of AS/CA in equilibrium with either RH = 10 or 40%. Here, CA3− is C6H5O73−, HCA2− is HC6H5O72−, H2CA− is H2C6H5O7− and H3CA is H3C6H5O7. | |
5 Discussion
A primary reason why aqueous multicomponent systems such as AS/CA,66 glucose/sucrose,17,33 and several others67,68 have received recent attention is because water transport can be slower in the multicomponent mixture than in the binary aqueous limits. In rheological terms, the viscosity of the multicomponent mixture is greater than the binary aqueous mixtures. Fig. 4 illustrates this behavior for water transport in the system studied here: for a ratio of AS/CA ∼ 0.5 the equilibration time is clearly longer than either of the limits of AS/CA = 0 or CA/AS = 0.
In some of the previously studied multicomponent systems the origin of a slower equilibration timescale (increase in viscosity) is a phase change such as gel formation. It has been shown that under certain conditions ion pairs can combine to form long, continuous structures in microdroplets leading to gel formation.69–72 In atmospheric aerosol science, aqueous MgSO4 is a well-studied example of this phenomenon.48,70,73 The onset of gel formation has also been observed in particles composed of a range of sugar–alcohols in equimolar mixtures with calcium chloride at low RHs.67 A gel is a phase wherein a solid micro-structure exists throughout a liquid medium giving the phase physical properties, such as rheology, resembling a solid.74,75 With the formation of a gel, the physical characteristics of the aerosol particle phase will be very different from that of a liquid or glassy phase. The solid network can greatly hinder mass transport as movement through channels or pores within the aerosol will be required. Decreases in diffusion coefficients by orders of magnitude have been observed upon the onset of gel formation48 as well as severe delays in water transport timescales.73 Gel formation is associated with a sharp decrease in diffusion due to a distinct phase transition. We do not observe orders of magnitude increases in the equilibration timescale for aqueous AS/CA when compared to aqueous CA, only increases of at most two to three times when AS/CA ∼ 0.5. Therefore, gel formation is unlikely to explain the observations presented here for aqueous AS/CA (nor in a system such as aqueous sucrose/glucose).
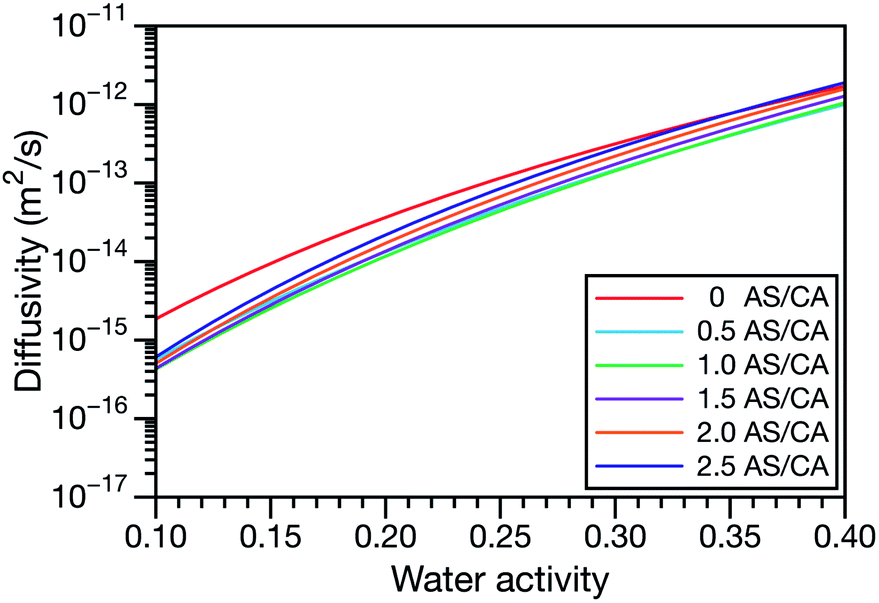
A key factor in regulating the diffusivity and viscosity of a mixture is the amount of available water, which acts as a plasticiser.76 In binary aqueous systems where diffusivity has a strong concentration dependence, equilibration time is largely controlled by the final state.49 An example of such a concentration-dependent diffusivity is shown in Fig. 5 for aqueous CA. With this in mind, and the fact that the model developed in Section 3 can reproduce measurements with reasonable accuracy, a straightforward explanation for the increased equilibration time in aqueous AS/CA can be proposed: in Fig. 4, we have superimposed the mole fraction of water in the final state (RH = 10%) using a reverse scale to show that the “drier” the final state, the longer the equilibration time. The correspondence to the measurements is excellent, suggesting that the composition of the final state strongly influences the equilibration time in aqueous AS/CA particles. If this is indeed correct, it raises the question as to why the model calculations in Fig. 4, which use the same thermodynamic model, do not provide a better match to the measurements? The likely answer is that the generalized Vignes equation is too simple to provide a high accuracy representation of  . In Fig. 8,
  is plotted as a function of AS/CA for several different RHs. At the lowest RH, the minimum in
  is very shallow compared to the other RHs. With modifications to the empirical Vignes equation it should be possible to increase the depth of this minimum and subsequently reduce the error between measured and calculated equilibration times in Fig. 4. In fact, this approach towards the Vignes equation has already been taken in its more common binary applications. For instance, with aqueous CA, using only mole fractions as exponents in a binary Vignes equation is insufficient to accurately reproduce diffusivity measurements and corrections need to be introduced.25
 |
| | Fig. 8 The Maxwell–Stefan diffusivity,  , as a function of AS/CA calculated using the parameters in Table 2. Calculations were performed at 10, 20, 30, and 40% RH. , as a function of AS/CA calculated using the parameters in Table 2. Calculations were performed at 10, 20, 30, and 40% RH. | |
The model aqueous inorganic–organic system considered in this work also demonstrates the appeal of the MS framework over a Fickian framework when analyzing multicomponent systems where activities can be accurately calculated. Not only will there be fewer diffusion coefficients to consider but, more importantly, the ternary MS diffusivities can be related to binary diffusivities. This second point was taken advantage of here when determining  and could have also been used in our analysis of
  . That diffusivity was modelled using a generalized Vignes equation and we treated the three Vignes parameters (
 ,
,  , and
, and  ) as unknown parameters in the optimization process. However, both
  and
and  could have been determined using binary aqueous CA data, leaving only one unknown parameter. Table 3 shows the results from such a single parameter optimization. The results in Section 4 also show that the calculated equilibration times only depend on
  so long as
  . Put differently,
  controls the timescale of water uptake and loss in aqueous AS/CA. As can be seen in Fig. 9,
  has a fairly weak dependence on the ratio of AS/CA for a fixed water activity. These results can allow for simplifications in future model development as they indicate that the binary diffusivity of the aqueous organic can be used to approximate the multicomponent MS diffusivity.
Table 3 MS diffusivities for (1)-water, (2)-CA, and (3)-AS. See Section 5 for details on how these diffusivities were determined
| Diffusivity |
Value |

|
 m2 s−1 m2 s−1 |

|
2.97 × 10⁻¹⁰ |

|
6.33 × 10⁻¹⁷ |

|
2.88 × 10⁻¹⁸ |

|
5.10 × 10⁻¹⁰ m2 s−1 |

|
0 |
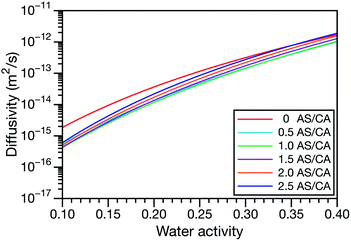 |
| | Fig. 9 The Maxwell–Stefan diffusivity,  , as a function of water activity for several different AS/CA ratios calculated using the parameters in Table 2. , as a function of water activity for several different AS/CA ratios calculated using the parameters in Table 2. | |
6 Conclusions
In our experimental study of water loss from aqueous inorganic–organic aerosol particles using a LQ-EDB we showed that equilibration timescales can greatly exceed either of the limiting binary aqueous cases. Specifically, in the model system of aqueous AS/CA, at a molar ratio of AS/CA ∼ 0.5, equilibration timescales will be greater than those of pure aqueous AS or pure aqueous CA. Condensed phase mass transport in single aerosol particles was modelled using a spherical particle with a moving boundary and a multicomponent diffusion model based on the MS framework. A predicted maximum in the equilibration timescale at AS/CA ∼ 0.5 matched observations. The origin of this peak was related to thermodynamic nonideality identified using the AIOMFAC model and the model developed here quantitatively predicted measured equilibration timescales across a range of molar ratios and RH changes. Discrepancies between experimental and predicted values likely originated from the generalized Vignes equation.
Conflicts of interest
There are no conflicts to declare.
Note added after first publication
This article replaces the version published on 4th January 2021, which contained errors in equations 2 and 5.
Acknowledgements
BJW acknowledges support from McGill University through a Graduate Mobility Award. TCP acknowledges support from the Natural Sciences and Engineering Research Council of Canada (NSERC). We would also like to thank Andreas Zuend for his help with the AIOMFAC source code and Laure Doué for her comments and input. JFD acknowledges the support UC Riverside startup funds and a UC Regents Faculty Fellowship.
Notes and references
-
J. H. Seinfeld and S. N. Pandis, Atmospheric chemistry and physics: from air pollution to climate change, John Wiley & Sons, 2016 Search PubMed.
- J. Prospero, R. Charlson, V. Mohnen, R. Jaenicke, A. Delany, J. Moyers, W. Zoller and K. Rahn, Rev. Geophys., 1983, 21, 1607–1629 CrossRef CAS.
- B. J. Murray, D. A. Knopf and A. K. Bertram, Nature, 2005, 434, 202–205 CrossRef CAS.
- U. Pöschl and M. Shiraiwa, Chem. Rev., 2015, 115, 4440–4475 CrossRef.
- M. Shiraiwa, A. Zuend, A. K. Bertram and J. H. Seinfeld, Phys. Chem. Chem. Phys., 2013, 15, 11441–11453 RSC.
- R. J. Charlson, J. Langner, H. Rodhe, C. B. Leovy and S. G. Warren, Tellus Ser. A, 1991, 43, 152–163 Search PubMed.
- R. J. Charlson, S. E. Schwartz, J. M. Hales, R. D. Cess, J. A. Coakley, J. E. Hansen and D. J. Hofmann, Science, 1992, 255, 423–430 CrossRef CAS.
- G. L. Stephens, J. Atmos. Sci., 1978, 35, 2111–2122 CrossRef.
- B. A. Albrecht, Science, 1989, 245, 1227–1230 CrossRef CAS.
- J. H. Slade, M. Shiraiwa, A. Arangio, H. Su, U. Pöschl, J. Wang and D. A. Knopf, Geophys. Res. Lett., 2017, 44, 1583–1591 CrossRef CAS.
- D. M. Lienhard, A. J. Huisman, U. K. Krieger, Y. Rudich, C. Marcolli, B. P. Luo, D. L. Bones, J. P. Reid, A. T. Lambe, M. R. Canagaratna, P. Davidovits, T. B. Onasch, D. R. Worsnop, S. S. Steimer, T. Koop and T. Peter, Atmos. Chem. Phys., 2015, 15, 13599–13613 CrossRef CAS.
- T. Berkemeier, M. Shiraiwa, U. Pöschl and T. Koop, Atmos. Chem. Phys., 2014, 14, 12513–12531 CrossRef.
- B. Zobrist, C. Marcolli, D. A. Pedernera and T. Koop, Atmos. Chem. Phys., 2008, 8, 5221–5244 CrossRef CAS.
- H. C. Price, J. Mattsson, Y. Zhang, A. K. Bertram, J. F. Davies, J. W. Grayson, S. T. Martin, D. O'Sullivan, J. P. Reid, A. M. Rickards and B. J. Murray, Chem. Sci., 2015, 6, 4876–4883 RSC.
- T. D. Vaden, D. Imre, J. Beránek, M. Shrivastava and A. Zelenyuk, Proc. Natl. Acad. Sci. U. S. A., 2011, 108, 2190–2195 CrossRef CAS.
- C. D. Cappa and K. R. Wilson, Atmos. Chem. Phys., 2011, 11, 1895–1911 CrossRef CAS.
- S. Ingram, C. Cai, Y. C. Song, D. R. Glowacki, D. O. Topping, S. O'Meara and J. P. Reid, Phys. Chem. Chem. Phys., 2017, 19, 31634–31646 RSC.
- L. Renbaum-Wolff, J. W. Grayson, A. P. Bateman, M. Kuwata, M. Sellier, B. J. Murray, J. E. Shilling, S. T. Martin and A. K. Bertram, Proc. Natl. Acad. Sci. U. S. A., 2013, 110, 8014–8019 CrossRef CAS.
- M. Shiraiwa, C. Pfrang and U. Pöschl, Atmos. Chem. Phys. Discuss., 2010, 10, 281–326 CrossRef.
- F. H. Marshall, R. E. Miles, Y. C. Song, P. B. Ohm, R. M. Power, J. P. Reid and C. S. Dutcher, Chem. Sci., 2016, 7, 1298–1308 RSC.
- J. F. Davies and K. R. Wilson, Chem. Sci., 2015, 6, 7020–7027 RSC.
- A. A. Wiegel, M. J. Liu, W. D. Hinsberg, K. R. Wilson and F. A. Houle, Phys. Chem. Chem. Phys., 2017, 19, 6814–6830 RSC.
- D. L. Bones, J. P. Reid, D. M. Lienhard and U. K. Krieger, Proc. Natl. Acad. Sci. U. S. A., 2012, 109, 11613–11618 CrossRef CAS.
- B. Zobrist, V. Soonsin, B. P. Luo, U. K. Krieger, C. Marcolli, T. Peter and T. Koop, Phys. Chem. Chem. Phys., 2011, 13, 3514–3526 RSC.
- D. M. Lienhard, A. J. Huisman, D. L. Bones, Y. F. Te, B. P. Luo, U. K. Krieger and J. P. Reid, Phys. Chem. Chem. Phys., 2014, 16, 16677–16683 RSC.
- J. W. Lu, A. M. Rickards, J. S. Walker, K. J. Knox, R. E. Miles, J. P. Reid and R. Signorell, Phys. Chem. Chem. Phys., 2014, 16, 9819–9830 RSC.
- A. M. J. Rickards, Y.-C. Song, R. E. H. Miles, T. C. Preston and J. P. Reid, Phys. Chem. Chem. Phys., 2015, 17, 10059–10073 RSC.
- A. Moridnejad, T. C. Preston and U. K. Krieger, J. Phys. Chem. A, 2017, 121, 8176–8184 CrossRef CAS.
- S. Bastelberger, U. K. Krieger, B. P. Luo and T. Peter, J. Chem. Phys., 2018, 149, 244506 CrossRef CAS.
- T. C. Preston and J. P. Reid, J. Opt. Soc. Am. A, 2015, 32, 2210 CrossRef.
- L. J. N. Lew, M. V. Ting and T. C. Preston, Appl. Opt., 2018, 57, 4601–4609 CrossRef CAS.
- J. L. Jimenez, M. R. Canagaratna, N. M. Donahue, A. S. Prevot, Q. Zhang, J. H. Kroll, P. F. DeCarlo, J. D. Allan, H. Coe, N. L. Ng, A. C. Aiken, K. S. Docherty, I. M. Ulbrich, A. P. Grieshop, A. L. Robinson, J. Duplissy, J. D. Smith, K. R. Wilson, V. A. Lanz, C. Hueglin, Y. L. Sun, J. Tian, A. Laaksonen, T. Raatikainen, J. Rautiainen, P. Vaattovaara, M. Ehn, M. Kulmala, J. M. Tomlinson, D. R. Collins, M. J. Cubison, E. J. Dunlea, J. A. Huffman, T. B. Onasch, M. R. Alfarra, P. I. Williams, K. Bower, Y. Kondo, J. Schneider, F. Drewnick, S. Borrmann, S. Weimer, K. Demerjian, D. Salcedo, L. Cottrell, R. Griffin, A. Takami, T. Miyoshi, S. Hatakeyama, A. Shimono, J. Y. Sun, Y. M. Zhang, K. Dzepina, J. R. Kimmel, D. Sueper, J. T. Jayne, S. C. Herndon, A. M. Trimborn, L. R. Williams, E. C. Wood, A. M. Middlebrook, C. E. Kolb, U. Baltensperger and D. R. Worsnop, Science, 2009, 326, 1525–1529 CrossRef CAS.
- C. Cai, S. Ingram and C. Zhao, J. Non-Cryst. Solids, 2019, 523, 119595 CrossRef CAS.
- H.-J. Tong, J. P. Reid, D. L. Bones, B. P. Luo and U. Krieger, Atmos. Chem. Phys., 2011, 11, 4739–4754 CrossRef CAS.
- J. G. Albright and R. Mills, J. Phys. Chem., 1965, 69, 3120–3126 CrossRef CAS.
- Z. Deng and D. G. Leaist, Can. J. Chem., 1991, 69, 1548–1553 CrossRef CAS.
- R. Callendar and D. G. Leaist, J. Solution Chem., 2006, 35, 353–379 CrossRef CAS.
- A. Mialdun, V. Sechenyh, J. C. Legros, J. M. Ortiz De Zárate and V. Shevtsova, J. Chem. Phys., 2013, 139, 104903 CrossRef CAS.
- X. Liu, S. K. Schnell, J. M. Simon, P. Krüger, D. Bedeaux, S. Kjelstrup, A. Bardow and T. J. H. Vlugt, Int. J. Thermophys., 2013, 34, 1169–1196 CrossRef CAS.
- R. Krishna and J. Wesselingh, Chem. Eng. Sci., 1997, 52, 861–911 CrossRef CAS.
- S. Rehfeldt and J. Stichlmair, Fluid Phase Equilib., 2010, 290, 1–14 CrossRef CAS.
- A. Zuend, C. Marcolli, B. P. Luo and T. Peter, Atmos. Chem. Phys., 2008, 8, 4559–4593 CrossRef CAS.
- S. L. Clegg, K. S. Pitzer and P. Brimblecombe, J. Phys. Chem., 1992, 96, 9470–9479 CrossRef CAS.
- K. Fowler, P. J. Connolly, D. O. Topping and S. O'Meara, Atmos. Chem. Phys., 2018, 18, 1629–1642 CrossRef CAS.
- P. J. Adams, J. H. Seinfeld and D. M. Koch, J. Geophys. Res.: Atmos., 1999, 104, 13791–13823 CrossRef CAS.
- D. G. Leaist and L. Hao, J. Solution Chem., 1992, 21, 345–350 CrossRef CAS.
- T. C. Preston, J. F. Davies and K. R. Wilson, Phys. Chem. Chem. Phys., 2017, 19, 3922–3931 RSC.
- J. F. Davies and K. R. Wilson, Anal. Chem., 2016, 88, 2361–2366 CrossRef CAS.
- B. J. Wallace and T. C. Preston, J. Phys. Chem. A, 2019, 123, 3374–3382 CrossRef CAS.
- J. F. Davies, Aerosol Sci. Technol., 2019, 53, 309–320 CrossRef CAS.
- C. L. Price, A. Bain, B. J. Wallace, T. C. Preston and J. F. Davies, J. Phys. Chem. A, 2020, 124, 1811–1820 CrossRef CAS.
-
R. B. Bird, W. Stewart and E. Lightfoot, Transport Phenomena, Revised, John Wiley & Sons, 2nd edn, 2006 Search PubMed.
- J. A. Wesselingh and A. M. Bollen, Chem. Eng. Res. Des., 1997, 75, 590–602 CrossRef CAS.
- C. F. Curtiss and R. B. Bird, Ind. Eng. Chem. Res., 1999, 38, 2515–2522 CrossRef CAS.
-
R. Taylor and R. Krishna, Multicomponent mass transfer, John Wiley & Sons, 1993 Search PubMed.
- X. Liu, T. J. H. Vlugt and A. Bardow, Ind. Eng. Chem. Res., 2011, 50, 10350–10358 CrossRef CAS.
- H. A. Kooijman and R. Taylor, Ind. Eng. Chem. Res., 1991, 30, 1217–1222 CrossRef CAS.
- J. D. Wells, J. Phys. Chem., 1986, 90, 2433–2440 CrossRef CAS.
- T. Bertrand, J. Peixinho, S. Mukhopadhyay and C. W. MacMinn, Phys. Rev. Appl., 2016, 6, 5–20 Search PubMed.
- C. W. MacMinn, E. R. Dufresne and J. S. Wettlaufer, Phys. Rev. Appl., 2016, 5, 044020–044030 CrossRef.
- A. Zuend, C. Marcolli, A. M. Booth, D. M. Lienhard, V. Soonsin, U. K. Krieger, D. O. Topping, G. McFiggans, T. Peter and J. H. Seinfeld, Atmos. Chem. Phys., 2011, 11, 9155–9206 CrossRef CAS.
-
A. Zuend, Aerosol Inorganic-Organic Mixtures Functional groups Activity Coefficients (AIOMFAC) website and online model, 2020, https://aiomfac.lab.mcgill.ca, last accessed: 2020-05-18 Search PubMed.
-
K. V. Price, R. M. Storn and J. A. Lampinen, Differential Evolution, Springer-Verlag, 2005 Search PubMed.
-
J. Newman and K. E. Thomas-Alyea, Electrochemical systems, John Wiley & Sons, 3rd edn, 2012 Search PubMed.
- H. O. Pye, A. Nenes, B. Alexander, A. P. Ault, M. C. Barth, S. L. Clegg, J. L. Collett, K. M. Fahey, C. J. Hennigan, H. Herrmann, M. Kanakidou, J. T. Kelly, I. T. Ku, V. Faye McNeill, N. Riemer, T. Schaefer, G. Shi, A. Tilgner, J. T. Walker, T. Wang, R. Weber, J. Xing, R. A. Zaveri and A. Zuend, Atmos. Chem. Phys., 2020, 20, 4809–4888 CrossRef CAS.
- X.-J. Lv, Z. Chen, J.-B. Ma and Y.-H. Zhang, Spectrochim. Acta, Part A, 2020, 226, 117552–117557 CrossRef CAS.
- D. S. Richards, K. L. Trobaugh, J. Hajek-Herrera and R. D. Davis, Anal. Chem., 2020, 92, 3086–3094 CrossRef CAS.
- D. S. Richards, K. L. Trobaugh, J. Hajek-Herrera, C. L. Price, C. S. Sheldon, J. F. Davies and R. D. Davis, Sci. Adv., 2020, 6, eabb5643 CrossRef CAS.
- Y.-H. Zhang and C. K. Chan, J. Phys. Chem. A, 2000, 104, 9191–9196 CrossRef CAS.
- F. Wang, Y.-H. Zhang, S.-H. Li, L.-Y. Wang and L.-J. Zhao, Anal. Chem., 2005, 77, 7148–7155 CrossRef CAS.
- L.-J. Zhao, Y.-H. Zhang, Z.-F. Wei, H. Cheng and X.-H. Li, J. Phys. Chem. A, 2006, 110, 951–958 CrossRef CAS.
- A. K. Lee, T. Y. Ling and C. K. Chan, Faraday Discuss., 2008, 137, 245–263 RSC.
- C. Cai, S. Tan, H. Chen, J. Ma, Y. Wang, J. P. Reid and Y. Zhang, Phys. Chem. Chem. Phys., 2015, 17, 29753–29763 RSC.
- L. A. Estroff and A. D. Hamilton, Chem. Rev., 2004, 104, 1201–1218 CrossRef CAS.
- E. Mikhailov, S. Vlasenko, S. T. Martin, T. Koop and U. Pöschl, Atmos. Chem. Phys., 2009, 9, 9491–9522 CrossRef CAS.
- T. Koop, J. Bookhold, M. Shiraiwa and U. Pöschl, Phys. Chem. Chem. Phys., 2011, 13, 19238–19255 RSC.
|
| This journal is © The Royal Society of Chemistry 2021 |

 Open Access Article
 This Open Access Article is licensed under a Creative Commons Attribution-Non Commercial 3.0 Unported Licence
 a,
Chelsea L.
Price
b,
James F.
Davies
a,
Chelsea L.
Price
b,
James F.
Davies
 , of species, α. At constant temperature T and pressure p, the MS equation can be written as52
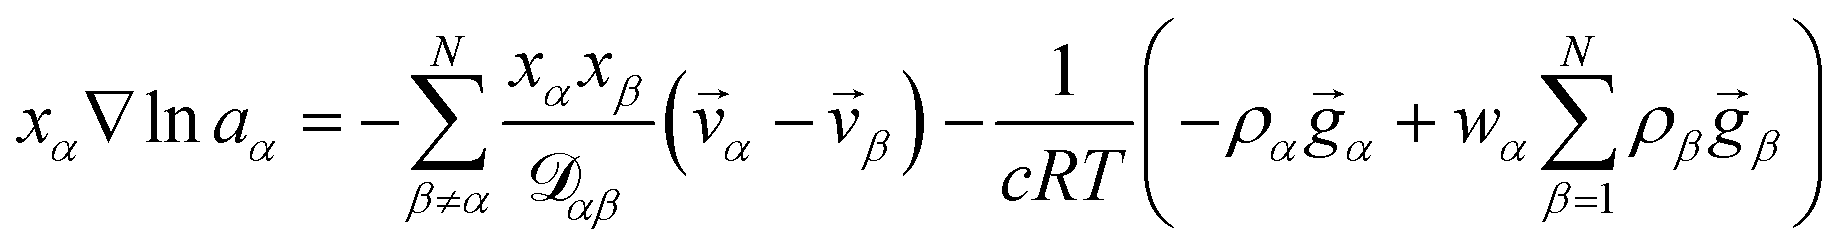
 are the multicomponent MS diffusivities. The inverse of these diffusivities can be thought of as drag or friction coefficients53 and the N × N matrix will have
  independent elements
  and these elements are symmetric
  .54 The relationship between the velocity of a species α and its mass flux is defined as
  , where cα is the molar concentration of species α and


 , which is the diffusivity when all components in solution except n are infinitely dilute.
 physically represents the diffusivity of component n in a binary solution where both components are infinitely dilute and neither component is n. This cannot be measured directly56 and needs to be calculated using a model or treated as a fitting parameter for an experiment where the components of the binary solution are not infinitely dilute. For our system, the most practical model is the geometric average57
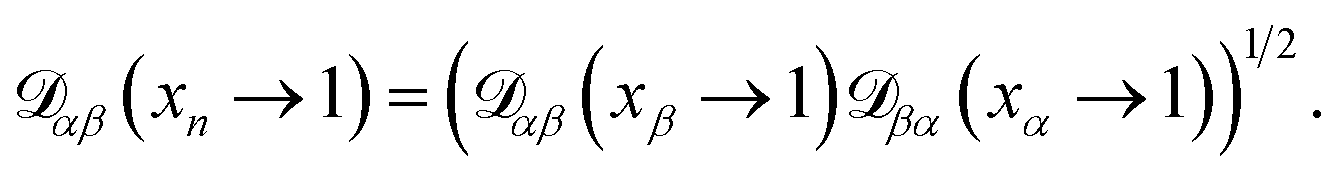

 , partial specific volumes,
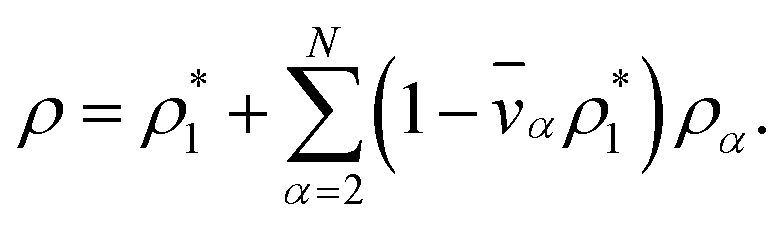

 . Eqn (18) can be integrated from 0 to r to obtain the mass average velocity of the solution
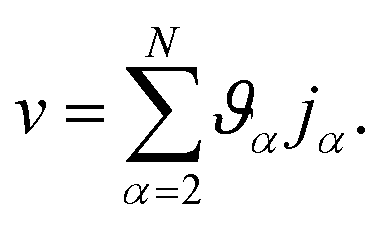
 ,
,  , and
, and  . Here we describe how these three MS diffusivities, listed in Table 2, were found.
 m2 s−1


 : the generalized Vignes equation (eqn (12)) was used when calculating this diffusivity and
  ,
,  , and
, and  were all treated as parameters to be fitted. Parameter optimization was performed using a differential evolution algorithm.63 In the limit of binary aqueous CA, the fitted values of
  and
and  and the Vignes equation agree well with previous binary diffusivity measurements from Davies and Wilson.48Fig. 5 shows a comparison across the activity range studied here. This agreement gives us confidence that the fitted value of
  is also likely reasonable as it was simultaneously determined using the same set of measurements. We also performed optimizations where
  was not treated as a fitting parameter and instead constrained using eqn (13) (the geometric average of
  and
and  ). With this restriction, there was no way to yield even qualitative agreement with all of the measured values of τ.
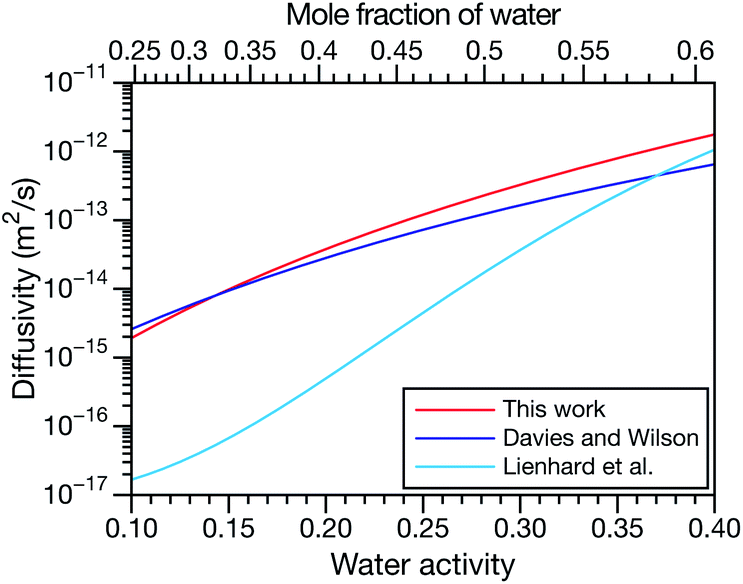
 when x3 = 0). Diffusivities are plotted as a function of both water activity and mole fraction of water.
 : binary diffusion coefficient measurements for aqueous ammonium sulfate show a fairly weak dependence on water activity when available data is extrapolated to low water activities.46 Therefore, we assumed that
  was constant and it was calculated with eqn (10) using the listed diffusion coefficients for NH4+ and SO42− in ref. 64, p. 284. As
  will be much greater than
  across the activity range considered here, the accuracy of the chosen value of
  will not be that important for these calculations. All that will matter is that
 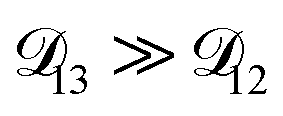 .
. : this diffusion coefficient can, in principle, be calculated using eqn (11). However, neither
  nor
nor  are accessible through experiments as their measurement would require a binary solution containing only AS and CA. When
  was treated as a free parameter during the optimization process it would always tend towards values that were much smaller than both
  and
and  . Further, if
  was set to values that were comparable to
  , the numerical solution to the moving boundary problem would predict behaviour that was not observed during experiments. As the physical interpretation of MS coefficients is that they represent inverse friction coefficients, it was perhaps reasonable to expect that
  would be much smaller than both
  and
and  . Based on this analysis,
  was set to zero.
 . In Fig. 8,
  is plotted as a function of AS/CA for several different RHs. At the lowest RH, the minimum in
  is very shallow compared to the other RHs. With modifications to the empirical Vignes equation it should be possible to increase the depth of this minimum and subsequently reduce the error between measured and calculated equilibration times in Fig. 4. In fact, this approach towards the Vignes equation has already been taken in its more common binary applications. For instance, with aqueous CA, using only mole fractions as exponents in a binary Vignes equation is insufficient to accurately reproduce diffusivity measurements and corrections need to be introduced.25
 , as a function of AS/CA calculated using the parameters in Table 2. Calculations were performed at 10, 20, 30, and 40% RH.
 and could have also been used in our analysis of
  . That diffusivity was modelled using a generalized Vignes equation and we treated the three Vignes parameters (
 ,
,  , and
, and  ) as unknown parameters in the optimization process. However, both
  and
and  could have been determined using binary aqueous CA data, leaving only one unknown parameter. Table 3 shows the results from such a single parameter optimization. The results in Section 4 also show that the calculated equilibration times only depend on
  so long as
 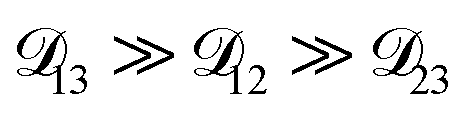 . Put differently,
  controls the timescale of water uptake and loss in aqueous AS/CA. As can be seen in Fig. 9,
  has a fairly weak dependence on the ratio of AS/CA for a fixed water activity. These results can allow for simplifications in future model development as they indicate that the binary diffusivity of the aqueous organic can be used to approximate the multicomponent MS diffusivity.
 m2 s−1


 , as a function of water activity for several different AS/CA ratios calculated using the parameters in Table 2.