 Open Access Article
Creative Commons Attribution 3.0 Unported Licence
The influence of alkyl chains on the performance of DSCs employing iron(II) N-heterocyclic carbene sensitizers†
Mariia
Becker
 ,
Vanessa
Wyss
,
Catherine E.
Housecroft
,
Vanessa
Wyss
,
Catherine E.
Housecroft
 and
Edwin C.
Constable
 *
*
Department of Chemistry, University of Basel, BPR 1096, Mattenstrasse 24a, 4058 Basel, Switzerland
First published on 20th October 2021
Abstract
The photovoltaic performances of DSCs employing two new iron(II) N-heterocyclic carbene (NHC) sensitizers are presented. The presence of n-butyl side chains had a significant impact on DSC performace. The improvement in DSC performance up to 0.93–0.95% was observed for a new heteroleptic sensitizer bearing one carboxylic acid anchoring group. The photovoltaic performance was remarkably affected by sensitization time and by a presence/absence of coadsorbent on the semiconductor surface. The highest photoconversion efficiencies (PCE) were achieved for DSCs sensitized over 17.5 hours without addition of coadsorbents. However, for a shorter dipping time of 4 hours, the presence of chenodeoxycholic acid improved the PCE from 0.46% (no coadsorbents) to 0.74%, respectively. The performance of DSCs based on a new homoleptic complex bearing two n-butyl side chains and a carboxylic acid anchor on each NHC-ligand was improved from 0.05 to 0.29% via changes in dye-bath concentration and sensitization time. The changes in the dye load on the semiconductor surface depending on the sensitization conditions were confirmed using solid-state UV-Vis spectroscopy and thermogravimetric analysis. Electrochemical impedance spectroscopy was used to gain information about the processes occurring at the different interfaces in the DSCs. The impedance response was strongly affected by the immersion time of the photoanodes in the dye-bath solutions. In the case of the homoleptic iron(II) complex, a Gerischer impedance was observed after 17.5 hours immersion. Shorter dipping times resulted in a decrease in the resistance in the system. For the heteroleptic complex, values of the chemical capacitance and electron lifetime were affected by the immersion time. However, the diffusion length was independent of sensitization conditions.
Introduction
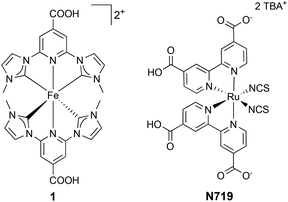
According to the Intergovernmental Panel on Climate Change (IPCC) that released its 6th Assessment Report on the Physical Science Basis for climate change on August 2021,1 the man-made contribution to global warming resulted in numerous extreme incidents including tropical cyclones, heavy precipitation, heatwaves and droughts. Moreover, recent studies revealed that the rapid ice-mass loss is associated with horizontal motions of the Earth's crust.2 These fast changes are happening in the ocean, atmosphere and biosphere and will continue unless a reduction of greenhouse gases occurs.3 To cut carbon dioxide (CO2) emissions, fossil fuels have to be replaced with carbon neutral and green energy sources. Solar-to-electrical energy conversion has a crucial role in sustainable energy production. Dye-sensitized solar cells (DSCs) offer a low-cost alternative to well-known photovoltaics based on crystalline silicon. A typical n-type DSC consists of two electrodes, coated with conducting layers. A key part of a DSC is the photoanode (working electrode) which comprises an n-type semiconductor (commonly TiO2) deposited on a substrate (usually FTO-coated glass).4 A photosensitizer is adsorbed on the surface and provides an electron injection into the conduction band (CB) of a semiconductor under irradiation. The dye (or sensitizer) is chosen to provide a broad absorption in the visible region of the solar spectrum and to have a long-lived metal-to-ligand charge transfer (MLCT) excited state.5 Commonly used Ru(II) polypyridyl complexes fulfil these requirements and offer photoconversion efficiencies (PCE) up to ≈12%.5 However, ruthenium suffers from being scarce and, therefore, expensive. Hence, Earth abundant metal complexes have become of great significance for DSC applications.Despite the low performance of first bis(2,2′-bipyridine)iron(II) derivative as a sensitizer in DSCs,6 it was shown that iron-based dyes could, in principle, be used for photovoltaic applications. The limiting feature of iron(II) polypyridyl complexes lies in their inefficient electron injection into the CB of the semiconductor. This is the result of fast deactivation from an MLCT to metal-centred (MC) state.7 In 2013, the first iron(II) N-heterocyclic carbene (NHC) complex with an extended 3MLCT state lifetime of 9 ps was published by Wärnmark and co-workers, and DSCs sensitized with complex 1 (Fig. 1) gave 0.13% PCE.8 This breakthrough resulted in optimization studies of DSCs sensitized with 1. In 2018, it was shown that the PCE could be improved from 0.13 to 0.57% (9.3% relative to N719 set at 100%) by optimization of electrolyte composition.9 Further electrolyte optimizations10,11 were done in combination with the application of the blocking underlayer on the photoanodes, which resulted in a PCE of near 1%.12 Gros and co-workers published a series of heteroleptic iron(II) NHC complexes bearing a carboxylic acid functionality on one ligand.13,14 The push–pull strategy proved to be beneficial for a heteroleptic analogue of 1 with a PCE up to 1.27%. However, the introduction of phenyl and thienyl spacers to the anchoring ligand decreased the DSCs performance to 0.81 and 0.95%, respectively, in comparison to the analogous dye without spacers. It is important to note that the investigations were performed in the presence of a blocking layer under the semiconductor and in the presence of Mg2+ ions and tetrabutylammonium iodide in the electrolyte.12 Moreover, it has been shown that an iron(II) NHC complex featuring a (porphyrinato)zinc(II) conjugate stabilizes the 3MLCT state and increases its lifetime to 160 ps.15
One of the challenging aspects of dye 1 is rapid recombination of electrons injected into the conduction band (einj) with the oxidized dye (sometimes referred to as a dye-cation).16 For the efficient DSC performance, the electron transfer from the CB to the oxidized dye has to be slower than the dye regeneration with the redox couple.17 However, the recombination of einj with the dye-cation may be supressed in the presence of chenodeoxycholic acid (CA) as has been shown by Durrant and co-workers with a Ru(II)–phthalocyanine complex.18 On the other hand, alkyl chains can also offer a surface protection from this type of recombination.19 Using [Ru(dcbpy)(4,4′-dialkyl-2,2′-bipyridine)(NCS)2] (dcbpy = [2,2′-bipyridine]-4,4′-dicarboxylic acid) it was shown that the length of the alkyl substituents on the bipyridine moiety had an influence on the emission decay dynamics and, thus, on electron injection.20 Moreover, the observed recombination between injected electrons and the iodide/triiodide (I−/I3−) redox couple was less when the ancillary ligand contained an increased length of alkyl chains. The modification of N719 (Fig. 1) dye by attachment of nonyl substituents significantly decreased the recombination between einj and Co2+/3+ redox couples.21
The sensitization of the semiconductor surface with a dye is a subtle process which is affected by the nature of the dye molecule, solvent of electrode-immersion solution and sensitization time. If the dye molecules are too close to one another, dye⋯dye interactions may occur that could affect their charge characteristics.22 Dye aggregation is the result of intermolecular interactions including π-stacking of arene rings. This limitation can be overcome by the addition of coadsorbents23,24 such as chenodeoxycholic acid or the implementation of alkyl spacers in the dye structure.25–27 Furthermore, an excess of dye molecules in the dye-bath solution may result in the formation of multilayers on the TiO2 surface.22 In this case, the dye bath concentration together with the immersion duration have to be optimized.
In this investigation, we present a study of DSCs based on new homoleptic and heteroleptic iron(II) NHC complexes 2 and 3, respectively (Fig. 2), with n-butyl functionalities, and investigate the optimization of the electrode sensitization process in terms of time, presence of coadsorbent and concentration of the dye-bath solution.
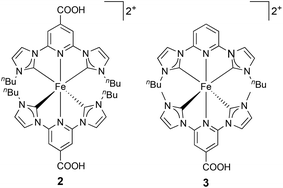 | ||
| Fig. 2 Structures of the sensitizers 2 and 3. Both complexes were isolated and used in DSCs as the [PF6]− salts. | ||
Results and discussion
Materials and methods
Performance of DSCs
DSCs sensitized with 2 in the presence of the co-adsorbant CA exhibited a lower photovoltaic performance then those containing 1 with CA (Table 1). The low values of JSC, VOC and ff resulted in a PCE of 0.05% (Table 1). Upon going from methyl to n-butyl side-chains (Fig. 1 and 2), steric effects could play an important role, and it was likely that the loading of the dye decreased on going from 1 to 2. Thus, the CA was removed from the dye solution in an attempt to increase the dye loading sites on the semiconductor. However, the values of all parameters (JSC, VOC and ff) decreased, leading to a lower PCE of 0.03% (Table 1). This effect could occur due to an increased rate of recombination between the semiconductor surface and redox-shuttle in the electrolyte that was suppressed in the presence of a CA. On the other hand, the increase in the dye load might lead to a higher rate of recombination between the dye molecules and the surface, or to quenching of excited states due to the dye aggregation on the surface.
| Dyea | Dipping time/h | J SC/mA cm−2 | V OC/mV | ff/% | PCE/% | Rel. PCEb/% |
|---|---|---|---|---|---|---|
| a CA – in the presence of chenodeoxycholic acid (0.10 mM). b Relative efficiencies are given with respect to N719 PCE set as 100%. c Previously published data from ref. 10 (dye/CA 0.50 mM:0.10 mM). | ||||||
| Dye 1 CA | 17.5 | 3.27 | 348 | 58 | 0.66 | 11.8c |
| Dye 2 | 17.5 | 0.58 | 114 | 46 | 0.03 | 0.5 |
| Dye 2 CA | 17.5 | 0.63 | 132 | 49 | 0.05 | 0.7 |
| Dye 2 CA | 4 | 1.31 | 256 | 64 | 0.22 | 3.4 |
| Dye 2 CA | 2 | 1.33 | 226 | 62 | 0.19 | 2.9 |
| N719 | 17.5 | 14.70 | 651 | 66 | 6.36 | 100 |
In order to provide support for the latter, the immersion time of the electrodes in the dye solution was decreased from 17.5 to 4 hours in the presence of CA. The concentrations of the dye and CA were maintained (0.50 mM and 0.10 mM, respectively). The shorter sensitization time was beneficial for the performance of the DSCs. The values of JSC and VOC were approximately doubled compared to the 17.5 hours sensitization time, and the values of the fill factor increased from 49 to 64% (Table 1). The combined effect was an increase in PCE to 0.22%. A further decrease in the sensitization time to 2 hours had no significant impact on the photoconversion efficiencies (Table 1). However, it is noteworthy that the highest values of the fill factor and the open circuit voltage were observed for a dipping time of 4 hours. Thus, with a dye concentration of 0.50 mM and in the presence of 0.10 mM of chenodeoxycholic acid in MeCN, immersion times of 2 or 4 hours were beneficial to cell performance, and extended dipping times led to lower PCEs (Table 1).
Our unpublished optimizations of dye/coadsorbent concentration of complex 130 revealed that the best performing combination was dye 1![[thin space (1/6-em)]](https://www.rsc.org/images/entities/char_2009.gif) :
:![[thin space (1/6-em)]](https://www.rsc.org/images/entities/char_2009.gif) CA in a 1
CA in a 1![[thin space (1/6-em)]](https://www.rsc.org/images/entities/char_2009.gif) :
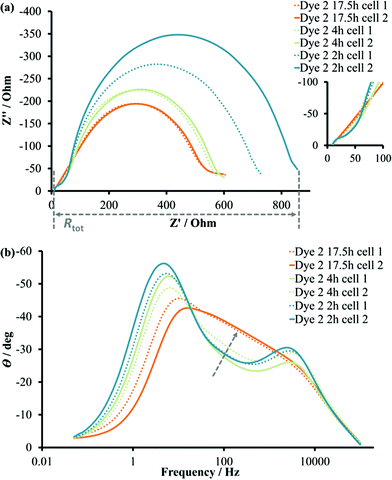
:![[thin space (1/6-em)]](https://www.rsc.org/images/entities/char_2009.gif) 1 ratio with 0.05 mM concentrations of both dye and CA in MeCN due to the increased values of JSC and VOC. The positive influence of shorter dipping times for 2 (Table 1) suggested the necessity of decreasing the dye bath concentration. Moreover, the reproducibility of these DSCs was not sufficient, indicating the necessity of further optimization. Therefore, the concentration of 2 was lowered from 0.50 mM to 0.05 mM, and corresponding DSCs were fabricated in the absence or presence of 0.05 mM CA after various immersion times (Table 2). Interestingly, the decrease in dye concentration in the sensitization solution had a beneficial impact on the PCE irrespective of the presence of CA in the mixture compared to 0.50 mM dye/0.10 mM CA. The JSC–VOC trend could be described as an increase of short circuit current density and corresponding decrease of open circuit voltage on going from dye-bath times of 2 to 17.5 hours. Moreover, the changes in dye-bath concentration significantly improved the reproducibility of the DSCs (Fig. 3). For all DSCs, the PCE was in the range of 0.25–0.29% (average values, Tables 2 and S3†) for the different dipping times. The presence of CA had only a slight influence on the VOC values, and the PCE was not significantly affected.
1 ratio with 0.05 mM concentrations of both dye and CA in MeCN due to the increased values of JSC and VOC. The positive influence of shorter dipping times for 2 (Table 1) suggested the necessity of decreasing the dye bath concentration. Moreover, the reproducibility of these DSCs was not sufficient, indicating the necessity of further optimization. Therefore, the concentration of 2 was lowered from 0.50 mM to 0.05 mM, and corresponding DSCs were fabricated in the absence or presence of 0.05 mM CA after various immersion times (Table 2). Interestingly, the decrease in dye concentration in the sensitization solution had a beneficial impact on the PCE irrespective of the presence of CA in the mixture compared to 0.50 mM dye/0.10 mM CA. The JSC–VOC trend could be described as an increase of short circuit current density and corresponding decrease of open circuit voltage on going from dye-bath times of 2 to 17.5 hours. Moreover, the changes in dye-bath concentration significantly improved the reproducibility of the DSCs (Fig. 3). For all DSCs, the PCE was in the range of 0.25–0.29% (average values, Tables 2 and S3†) for the different dipping times. The presence of CA had only a slight influence on the VOC values, and the PCE was not significantly affected.
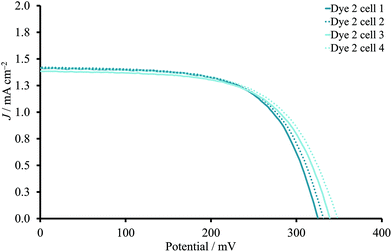 | ||
| Fig. 3 J–V curves to present the reproducibility for DSCs sensitized with 2 (0.05 mM) in the absence of CA. The dipping time was 2 hours. | ||
| Dyea | Dipping time/h | J SC/mA cm−2 | V OC/mV | ff/% | PCE/% | Rel. PCEb/% |
|---|---|---|---|---|---|---|
| a CA – in the presence of chenodeoxycholic acid (0.05 mM). b Relative efficiencies are given with respect to N719 PCE set as 100%. c Unpublished data from ref. 30 (dye 0.05 mM). d Unpublished data from ref. 30 (dye/CA 0.05 mM:0.05 mM). | ||||||
| Dye 1 | 17.5 | 2.46 | 328 | 65 | 0.52 | 8.65c |
| Dye 1 CA | 17.5 | 2.96 | 355 | 62 | 0.64 | 10.67d |
| Dye 2 | 17.5 | 1.64 | 270 | 63 | 0.28 | 4.4 |
| Dye 2 CA | 17.5 | 1.57 | 259 | 62 | 0.25 | 3.9 |
| Dye 2 | 4 | 1.55 | 301 | 63 | 0.29 | 4.6 |
| Dye 2 CA | 4 | 1.56 | 277 | 63 | 0.28 | 4.4 |
| Dye 2 | 2 | 1.41 | 336 | 63 | 0.29 | 4.6 |
| Dye 2 CA | 2 | 1.46 | 323 | 63 | 0.29 | 4.6 |
| N719 | 17.5 | 14.70 | 651 | 66 | 6.36 | 100 |
DSCs with the heteroleptic iron(II) complex 3 (Fig. 2) were fabricated using a 0.05 mM dye-bath concentration. A PCE of 0.94% was achieved for a 17.5 hours sensitization time (Table 3). This approaches the record values for NHC-iron(II) dyes reported by Gros and co-workers.12 A shorter dipping time of 4 hours resulted in significantly lower JSC and VOC values and a PCE of only 0.46% (Table 3). This trend was reproduced for a multiple cells (Table S4†). In contrast to the observations with homoleptic dye 2, the addition of CA improved both JSC and VOC and, consequently, PCE values of DSCs with a 4 hours dipping time despite the slight decrease in ff (Table 3). At the same time, the presence of the CA in the DSCs with 17.5 hours sensitization decreased the PCE from 0.94 to 0.71% (Fig. 4). Thus, DSCs with CA had similar performances irrespective of the 4 or 17.5 hours dipping times (Tables 3 and S4†).
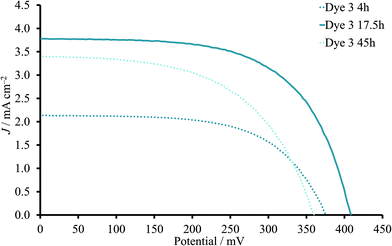 | ||
| Fig. 4 J–V curves for DSCs sensitized with 3 in the absence of CA. The dipping time was 4, 17.5 or 45 hours. | ||
| Dyea | Dipping time/h | J SC/mA cm−2 | V OC/mV | ff/% | PCE/% | Rel. PCEb/% |
|---|---|---|---|---|---|---|
| a CA – in the presence of chenodeoxycholic acid (0.05 mM). b Relative efficiencies are given with respect to N719 PCE set as 100%. | ||||||
| Dye 3 | 45 | 3.38 | 358 | 55 | 0.67 | 10.5 |
| Dye 3 | 17.5 | 3.68 | 417 | 62 | 0.94 | 14.8 |
| Dye 3 CA | 17.5 | 3.00 | 397 | 60 | 0.71 | 11.2 |
| Dye 3 | 4 | 2.05 | 370 | 61 | 0.46 | 7.3 |
| Dye 3 CA | 4 | 3.22 | 396 | 58 | 0.74 | 11.6 |
| N719 | 17.5 | 14.70 | 651 | 66 | 6.36 | 100 |
Since a longer sensitization time proved to be beneficial for dye 3 (17.5h compared to 4 h) in the absence of CA, the immersion was extended to 45 hours. However, the values of all three photovoltaic parameters decreased and led to lower PCE (average 0.67%, Table 3) compared to 17.5 hours.
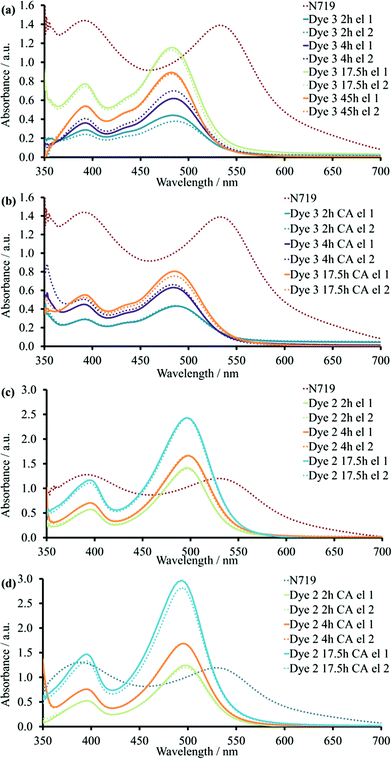
The solid-state UV-Vis (ssUV-Vis) spectra provide information about a dye adsorbed on the semiconductor. Typically, the ssUV-Vis may be used to give insight into the dye loading on the surface, because the absorption spectra depend on the concentration of the immersing dye solution and the sensitization time. Since the exact amount of the dye adsorbed on the surface is not known, arbitrary units of absorbance are used, and spectra are compared with that of a standard dye, in this case N719.
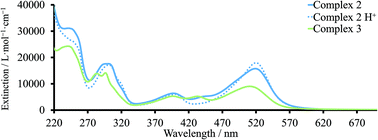
For complex 3, the band assigned to charge transfer to pyridine exhibited a blue shift from 510 to ≈482 nm (Fig. 6a). The bands with maxima at ≈434 and ≈393 nm were similar to those observed in MeCN. For complex 2, the λmax was also blue-shifted to ca. 497 nm compared to the UV-Vis spectrum in MeCN solution (Fig. 6c). However, the second MLCT band at higher energies was unchanged with λmax ≈396 nm. Blue or red-shifting of the absorption maximum on going from solution to solid-state may indicate either H- or J-type aggregation, respectively.22
As detailed above, our optimizations of dye/coadsorbent combinations for 130 had shown that the presence of CA reduced the dye load on the TiO2 surface. For complex 3, the same tendency was found. The addition of CA decreased the difference in absorbance values at ≈482 nm for 3 between 17.5 and 4 hours (Fig. 6b), and this was in agreement with similar performance of DSCs with corresponding immersion times. For DSCs containing 3 and without CA, dipping times of 2 or 4 hours led to difference in the ssUV-Vis spectra (Fig. 6a). This observation illustrated that there was no competition between dye and CA for the duration of the dye-adsorption. Due to this, the enhanced PCE of DSCs dipped for 4 hours with CA in comparison to the corresponding set without CA corresponded to the suppressed recombination between surface and electrolyte. The increase in the immersion time from 17.5 to 45 hours resulted in a reduction of absorbance. Despite the logical assumption that longer dipping times should favour adsorption of more dye molecules on the surface, it could also bring the system into an equilibrium state between surface and solution. This would result in partial detachment of dye from the semiconductor.
In the case of complex 2, the adsorption was enhanced on going from 2 to 17.5 hours (Fig. 6c). However, in contrast to complex 3, the addition of CA to the dye-bath did not have an influence on intensity of ssUV-Vis absorption spectrum (Fig. 6d). The presence of two anchoring groups changes the ways of dye arrangement on the semiconductor surface and could result in stronger binding.
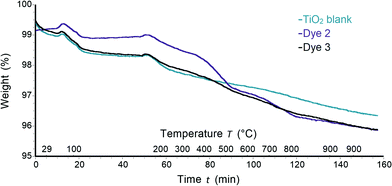
The weight losses of 0.32–0.59% and 0.22–0.35% (<120 °C and <220 °C, respectively) corresponded to loss of physisorbed and chemisorbed water31 and were observed for all samples including functionalized TiO2 and a control with no adsorbed dye (Fig. 7). Between 220 and 900 °C non-functionalized TiO2 had 1.6% weight lost (Fig. S3†). In the following discussion, only the weight losses corresponding to decomposition of dye molecules will be described, and the weight loss corresponding to TiO2 was subtracted from each TGA trace. The decomposition of each pristine dye was also analysed by TGA and the results were taken into account for mass loss calculations of sensitized TiO2 (Fig. S4†). A weight loss of 71.5% was detected for complex 3. Mass peaks at m/z 41.0, 43.0 and 44.0 were assigned to acetonitrile, propylium and carbon dioxide arising from ligand decomposition (Fig. S4a†). Identical mass peaks were detected for complex 2 (Fig. S4b†). However, a higher weight loss of 78.2% was observed compared to 3. Once the dye was deposited on TiO2, the loss of CO2 was detected with corresponding mass peaks at m/z 44.0 for all complexes (Fig. S5a and b†). It is important to note that no peaks at m/z 44.0 were detected for non-functionalized TiO2. Thus, the loss of CO2 could be attributed to decomposition and subsequent detachment of complexes from TiO2 surface. In the case of the homoleptic complex 2 with n-butyl chains a weight loss of 1.61% was observed. Dye 3 exhibited a similar weight loss of 0.77%. The variance in weight loss between samples with 2 and 3 deposited on TiO2 supports the proposal of different binding models and dye arrangement on the surface for homoleptic and heteroleptic complexes.
For dye 3, the fit was performed with a help of an electric circuit model (Fig. S6†). The parameters for fitted experimental curves are presented in Table 4 and the fitted curves are presented in Fig. S7.† As for DSCs with complex 2, the sensitization time and the addition of a CA had a significant influence on the impedance of the DSC. The Rrec values decreased by a factor of two on going from 4 to 17.5 hours (without CA) of sensitization. The extended dipping time of 45 hours did not affect the recombination resistance. The values of chemical capacitance were increased from 4 to 17.5 hours, and this was consistent with the enhanced short circuit current density values. The addition of CA for the 4 hours-dipping DSCs set increased the JSC values by more than 1 mA cm−2. This improvement corresponded to changes in Cμ from 528 to 845 μF and in Rtr from 10 to 3 Ω (Table 4 and Fig. S7c, d†). The recombination resistance decreased with the addition of CA (4 hours). The combination of respective factors indicated more efficient electron injection and fewer recombination processes taking place in the presence of CA. Interestingly, in the case of 17.5-hour sensitization the addition of CA decreased Cμ values from 905 to 665 μF (Fig. S7e, f and g, h†). This observation was associated with the competition between dye and CA on the surface and was supported by ssUV-Vis measurements. For all dipping times in the presence/absence of CA, the electron lifetime was significantly higher than transport time. Together with a diffusion length greater than the TiO2 thickness (d ≈14 μm), τ and τt offered an effective electron transport through the working electrode. One of the important observations was the simultaneous increase in electron lifetime together with chemical capacitance after 45 hours of sensitization. This was consistent with a higher electron density in the semiconductor compared with a 17.5 hours dipping time. However, the diffusion length remained similar (Table 4) meaning the higher dye load did not affect the recombination rate at the semiconductor/electrolyte interface. Series resistance and counter electrode parameters (RPt and CPt) stayed constant and, expectedly, were not affected by changes at photoanode.
| Dyea | Timeb/h | R rec/Ω | C μ/μF | R tr/Ω | τ/ms | τ t/ms | L d/μm | R s/Ω | R Pt/Ω | C Pt/μF |
|---|---|---|---|---|---|---|---|---|---|---|
| a CA – in the presence of chenodeoxycholic acid (0.05 mM). b The immersing time of working electrodes into the dye solution. | ||||||||||
| Dye 3 | 4 | 487 | 528 | 10 | 257 | 5 | 101 | 11 | 6 | 6 |
| Dye 3 CA | 4 | 355 | 845 | 3 | 297 | 2 | 155 | 11 | 5 | 6 |
| Dye 3 | 17.5 | 257 | 905 | 3 | 231 | 3 | 144 | 12 | 5 | 6 |
| Dye 3 CA | 17.5 | 501 | 665 | 4 | 332 | 3 | 157 | 12 | 5 | 6 |
| Dye 3 | 45 | 274 | 1555 | 3 | 429 | 4 | 149 | 12 | 7 | 6 |
Conclusions
Two new iron(II) complexes with n-butyl side chains were employed in n-type DSCs. Initial studies showed that cells with the homoleptic complex 2 had significantly lower PCE (0.05%) compared to those with the homoleptic dye 1 (0.66%). Such a low performance was a result of lower values of JSC and VOC together with a low ff. However, the optimization of the dye-bath concentration and the immersion time enhanced all parameters extracted from J–V curves. This improvement resulted in six times higher PCE of 0.29%. Interestingly, when the dye-bath concentration was decreased from 0.50 to 0.05 mM, the overall PCE was little affected (0.27–0.29%). The addition of CA did not have a significant influence on DSCs performance. Moreover, the EIS response was more influenced by changes in dipping times, but not by the presence of CA. Gerischer impedance was observed for 17.5-hour immersion, and a decrease in Rtot and Rtr was observed for shorter dipping times.DSCs with the new heteroleptic dye 3 significantly improved their overall photoconversion efficiency compared to dyes 1 and 2. The highest PCE of 0.94% (average of a range 0.93–0.95%) was observed for DSCs sensitized over 17.5 hours without addition of coadsorbents. The shorter immersion of 4 hours decreased PCE (0.46%) due to the reduction of both, JSC and VOC values. However, a further increase of dipping time to 45 hours also resulted in lower PCE of 0.67% in comparison to 17.5 hours. The presence of CA led to similar DSC performances of 0.71 and 0.74% for 17.5 and 4 hours immersions, respectively. Interestingly, in the case of 17.5 hours, the presence of CA decreased JSC values, but in the case of 4 hours, JSC values were enhanced in the presence of CA. These observations could be rationalized using impedance spectra. A decrease in chemical capacitance was observed with addition of CA for 17.5-hour dipping time, but in contrast, after 4 hours the presence of CA led to the increase of Cμ. In the case of 45-hour immersion, Cμ values had a remarkable increase in combination with the electron lifetime. However, the diffusion length stayed unchanged. Thus, the recombination rate at semiconductor/electrolyte interface was not affected despite the changes on the dye load on the surface.
The differences in DSC performance were strongly affected by the molecular structure of the dye. The variation in dye loading on the surface was supported by ssUV-Vis measurements in the presence/absence of CA. For complex 2, absorbance maxima were not affected by addition of CA. On the other hand, a decrease in absorption intensity was observed for dye 3 in the presence of CA. Moreover, different weight losses of TiO2 sensitized with 2 or 3 were observed during thermogravimetric analysis. These observations lead us to propose different binding models on the surface for homoleptic and heteroleptic complexes.
Author contributions
Conceptualization – M. B.; investigation – M. B. and V. W.; project administration, funding acquisition and supervision – C. E. H and E. C. C.; writing – original draft – M. B.; writing – review and editing – C. E. H. and E. C. C.Conflicts of interest
There are no conflicts to declare.Acknowledgements
We thank the Swiss National Science Foundation (grant number 200020_182000) and University of Basel for the support. We thank Sven Freimann (University of Basel) for assistance with TGA measurements and helpful discussions.References
- https://www.ipcc.ch/report/ar6/wg1/ , (accessed 18.08.2021, 2021).
- S. Coulson, M. Lubeck, J. X. Mitrovica, E. Powell, J. L. Davis and M. J. Hoggard, Geophys. Res. Lett., 2021, 48 CrossRef.
- https://www.ipcc.ch/report/ar6/wg1/downloads/report/IPCC_AR6_WGI_Headline_Statements.pdf , (accessed 18.08.2021).
- D. Devadiga, M. Selvakumar, P. Shetty and M. S. Santosh, J. Power Sources, 2021, 493 CrossRef CAS.
- S. Aghazada and M. Nazeeruddin, Inorganics, 2018, 6, 52 CrossRef.
- S. Ferrere and B. A. Gregg, J. Am. Chem. Soc., 1998, 120, 843 CrossRef CAS.
- O. S. Wenger, Chem. – Eur. J., 2019, 25, 6043 CrossRef CAS PubMed.
- T. Duchanois, T. Etienne, C. Cebrián, L. Liu, A. Monari, M. Beley, X. Assfeld, S. Haacke and P. C. Gros, Eur. J. Inorg. Chem., 2015, 14, 2469 CrossRef.
- M. Karpacheva, C. E. Housecroft and E. C. Constable, Beilstein J. Nanotechnol., 2018, 9, 3069 CrossRef CAS PubMed.
- M. Karpacheva, V. Wyss, C. E. Housecroft and E. C. Constable, Materials, 2019, 12, 4181 CrossRef CAS PubMed.
- M. Becker, C. E. Housecroft and E. C. Constable, Materials, 2021, 14, 3053 CrossRef PubMed.
- E. Marchini, M. Darari, L. Lazzarin, R. Boaretto, R. Argazzi, C. A. Bignozzi, P. C. Gros and S. Caramori, Chem. Commun., 2020, 56, 543 RSC.
- A. Reddy Marri, E. Marchini, V. D. Cabanes, R. Argazzi, M. Pastore, S. Caramori and P. C. Gros, J. Mater. Chem. A, 2021, 9, 3540 RSC.
- T. Duchanois, L. Liu, M. Pastore, A. Monari, C. Cebrián, Y. Trolez, M. Darari, K. Magra, A. Francés-Monerris, E. Domenichini, M. Beley, X. Assfeld, S. Haacke and P. Gros, Inorganics, 2018, 6, 63 CrossRef.
- T. Jiang, Y. Bai, P. Zhang, Q. Han, D. B. Mitzi and M. J. Therien, Proc. Natl. Acad. Sci. U. S. A., 2020, 117, 20430 CrossRef CAS PubMed.
- T. C. Harlang, Y. Liu, O. Gordivska, L. A. Fredin, C. S. Ponseca Jr., P. Huang, P. Chabera, K. S. Kjaer, H. Mateos, J. Uhlig, R. Lomoth, R. Wallenberg, S. Styring, P. Persson, V. Sundstrom and K. Wärnmark, Nat. Chem., 2015, 7, 883 CrossRef CAS PubMed.
- S. N. Mori, W. Kubo, T. Kanzaki, N. Masaki, Y. Wada and S. Yanagida, J. Phys. Chem. C, 2007, 111, 3522 CrossRef CAS.
- A. Morandeira, I. López-Duarte, B. O'Regan, M. V. Martínez-Díaz, A. Forneli, E. Palomares, T. Torres and J. R. Durrant, J. Mater. Chem., 2009, 19, 5016 RSC.
- C. Li, S.-J. Wu and C.-G. Wu, J. Mater. Chem. A, 2014, 2, 17551 RSC.
- J. E. Kroeze, N. Hirata, S. Koops, M. K. Nazeeruddin, L. Schmidt-Mende, M. Gratzel and J. R. Durrant, J. Am. Chem. Soc., 2006, 128, 16376 CrossRef CAS PubMed.
- M. F. M. Kavungathodi, I. Cho, P. Wagner and A. J. Mozer, J. Phys. Chem. C, 2020, 124, 23013 CrossRef CAS.
- L. Zhang and J. M. Cole, J. Mater. Chem. A, 2017, 5, 19541–19559 RSC.
- V. Dryza, J. L. Nguyen, T. H. Kwon, W. W. Wong, A. B. Holmes and E. J. Bieske, Phys. Chem. Chem. Phys., 2013, 15, 20326 RSC.
- S. Y. Bang, M. J. Ko, K. Kim, J. H. Kim, I.-H. Jang and N.-G. Park, Synth. Met., 2012, 162, 1503 CrossRef CAS.
- A. K. Singh, M. F. Mele Kavungathodi and J. Nithyanandhan, ACS Appl. Mater. Interfaces, 2020, 12, 2555 CrossRef PubMed.
- G. Yang, Y. Tang, X. Li, H. Agren and Y. Xie, ACS Appl. Mater. Interfaces, 2017, 9, 36875–36885 CrossRef CAS PubMed.
- J. Wang, S. Liu, Z. Chai, K. Chang, M. Fang, M. Han, Y. Wang, S. Li, H. Han, Q. Li and Z. Li, J. Mater. Chem. A, 2018, 6, 22256 RSC.
- M. Becker, M. S. Bertrams, E. C. Constable and C. E. Housecroft, Materials, 2020, 13, 1547 CrossRef CAS PubMed.
- M. Pastore, T. Duchanois, L. Liu, A. Monari, X. Assfeld, S. Haacke and P. C. Gros, Phys. Chem. Chem. Phys., 2016, 18, 28069 RSC.
- D. Wagner, Master Thesis, University of Basel, 2020.
- S. A. Freimann, A. Prescimone, C. E. Housecroft and E. C. Constable, RSC Adv., 2021, 11, 5537 RSC.
- A. Sacco, Renewable Sustainable Energy Rev., 2017, 79, 814 CrossRef CAS.
- J. Bisquert, I. Mora-Sero and F. Fabregat-Santiago, ChemElectroChem, 2014, 1, 289 CrossRef CAS.
- B. Boukamp, Solid State Ionics, 2003, 157, 29 CrossRef CAS.
Footnote |
| † Electronic supplementary information (ESI) available: Experimental details and compound characterization; Tables S1–S4: DSC parameters; Fig. S1 and S2: Synthetic schemes; Fig. S3: Electric circuit model used for fitting EIS experimental data; Table S5: EIS parameters; Fig. S4: Nyquist and Bode plots. See DOI: 10.1039/d1dt03252f |
| This journal is © The Royal Society of Chemistry 2021 |

