 Open Access Article
Creative Commons Attribution 3.0 Unported Licence
Field-induced single-ion magnet based on a quasi-octahedral Co(II) complex with mixed sulfur–oxygen coordination environment†
D. V.
Korchagin
 *a,
Ya. E.
Gureev
ab,
E. A.
Yureva
 a,
G. V.
Shilov
 a,
A. V.
Akimov
 a,
E. Ya.
Misochko
 a,
R. B.
Morgunov
a,
K. V.
Zakharov
b,
A. N.
Vasiliev
a,
R. B.
Morgunov
a,
K. V.
Zakharov
b,
A. N.
Vasiliev
 bc,
A. V.
Palii
 ad,
T.
Lohmiller
 *e,
K.
Holldack
 f and
S. M.
Aldoshin
 a
a
aInstitute of Problems of Chemical Physics, Russian Academy of Sciences, 1, Acad. Semenov Av., Chernogolovka, Russian Federation 142432. E-mail: korden@icp.ac.ru
bM.V. Lomonosov Moscow State University, Moscow 119991, Russia
cNational University of Science and Technology “MISiS”, Moscow, 119049, Russia
dInstitute of Applied Physics, Academy of Sciences of Moldova, Kishinev, Moldova
eEPR4Energy Joint Lab, Department Spins in Energy Conversion and Quantum Information Science, Helmholtz-Zentrum Berlin für Materialien und Energie GmbH, 12489 Berlin, Germany
fInstitut für Methoden und Instrumentierung der Forschung mit Synchrotronstrahlung, Helmholtz-Zentrum Berlin für Materialien und Energie GmbH, 12489 Berlin, Germany
First published on 7th September 2021
Abstract
Synthesis and characterization of structure and magnetic properties of the quasi-octahedral complex (pipH2)[Co(TDA)2] 2H2O (I), (pipH22+ = piperazine dication, TDA2− = thiodiacetic anion) are described. X-ray diffraction studies reveal the first coordination sphere of the Co(II) ion, consisting of two chelating tridentate TDA ligands with a mixed sulfur–oxygen strongly elongated octahedral coordination environment. SQUID magnetometry, frequency-domain Fourier-transform (FD-FT) THz-EPR spectroscopy, and high-level ab initio SA-CASSCF/NEVPT2 quantum chemical calculations reveal a strong “easy-plane” type magnetic anisotropy (D ≈ +54 cm−1) of complex I. The complex shows field-induced slow relaxation of magnetization at an applied DC field of 1000 Oe.
Introduction
For a few decades since the discovery of single molecule magnets (SMMs),1,2 researchers have sought to obtain polynuclear SMMs with record magnitudes of the spin-inverse barrier (Ueff) and blocking temperature by increasing the total spin of the molecule.3,4 However, contrary to the expectations, the increase of the total molecular spin was unable to give rise to a significant increase of Ueff due to the fact that such increase of the spin leads to a decrease in the absolute value of the axial zero field splitting (ZFS) parameter D,5 which represents the main contribution to the global axial anisotropy of the molecule. It thus has become clear that magnetic anisotropy is a key ingredient in the design of SMMs with desired properties. An important class of SMMs, which is of current interest in molecular magnetism, is represented by mononuclear complexes exhibiting slow magnetic relaxation, the so-called single ion magnets (SIMs). Numerous SIMs based on transition metal ions have been reported (see ref. 6 and 7 and refs. therein). Quasi-octahedral Co(II) complexes constitute the largest family of 3d-metal-based complexes showing slow relaxation of magnetization.8,9 The first such example of a SIM was the [Co(dmphen)2(NCS)2] complex,10 this being followed by investigation of many other SIMs based on quasi-octahedral high-spin Co(II) complexes with coordination spheres dominated by Co–N or Co–O bonds.8,11–14 Most recently, the first field-induced SIM based on a quasi-octahedral Co(II) complex with sulfur atoms in its coordination sphere, trans-[Co{(OPPh2)(SPPh2)N}2(DMF)2], has been reported.15 It should be noted that the hexacoordinated Co(II) ion in a completely sulfuric environment possesses a low-spin state with S = 1/2, and such complexes do not exhibit SIM properties.16–19 On the contrary, tetrahedral high-spin (S = 3/2) Co(II) complexes in purely sulfuric or mixed environments are quite numerous and often exhibit SIM properties.20–22 Although Co(II) complexes with only one thiodiacetate (TDA) ligand were previously known,23,24 until 2010 such mononuclear 3d-metal complexes were not considered as SIMs.25–27In the present work, we report synthesis and characterization of a new anionic Co(II) complex with two chelating tridentate TDA ligands, which is shown to exhibit field-induced slow relaxation of magnetization. This complex represents a rather rare example of a single ion magnet based on a quasi-octahedral Co(II) ion with a mixed sulfur-oxygen environment. The magnetic properties of the complex are determined by a combination of experimental methods SQUID magnetometry, frequency-domain Fourier-transform (FD-FT) THz-EPR spectroscopy, and are in agreement with the results of high-level ab initio SA-CASSCF/NEVPT2 quantum chemical calculations. Our study has shown that the combination of different mutually supportive experimental techniques and quantum chemical calculations can provide important complementary information. All these data show a strong “easy-plane” type magnetic anisotropy (D ≈ +54 cm−1) of complex I.
Results and discussion
Molecular and crystal structure of I
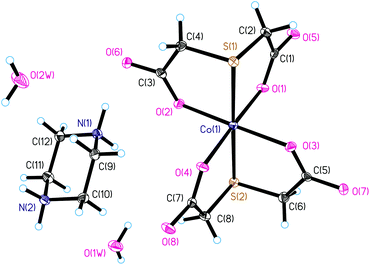
Compound I crystallizes in the monoclinic space group P21/n. The asymmetric unit of the crystal structure of I consists of the anionic complex [Co(TDA)2]2−, the double protonated piperazinium cation pipH22+, and two solvate water molecules. In the complex anion [Co(TDA)2]2−, the cobalt(II) ion is coordinated by two tridentate thiodiacetate ligands (Fig. 1). The Co(II) ion has a distorted axially elongated quasi-octahedral coordination environment [S2O4] with donor S atoms in apical positions and practically equal Co–S bond lengths (∼2.4802(7) Å). In the equatorial plane, the Co–O bond lengths are almost the same (Table S2†), and the average length of the Co–O bond is ∼2.054(2) Å. The bond angles S(1)–Co(1)–S(2), O(1)–Co(1)–O(4), O(2)–Co(1)–O(3) slightly deviate from the linear ones (180°) (Table S2†). Other bond angles in the coordination polyhedron X–Co(1)–X deviate significantly from 90° and lie in the range of 82.32(5) to 98.37(5)°. The octahedral distortion parameters (Σ, Θ and ζ) have been employed to calculate the magnitude of distortions from a perfect octahedral geometry around the cobalt(II) ion. Distortion parameters Σ, Θ and ζ for I are 66.60°, 198.26°, and 1.137 Å, respectively; all these values lie in the expected range observed for distorted quasi-octahedral Co(II) complexes. In fact, a perfectly octahedral complex would give Σ = Θ = 0. The structural distortions of the cobalt(II) coordination environment was also examined by CShM using the SHAPE program (1.414 for octahedral and 16.376 for trigonal prismatic), where a zero value of the shape factor signifies an ideal octahedral geometry. The SHAPE analysis shows a clear difference from a trigonal prismatic environment. The deprotonated piperazinium cation is in a stable chair conformation (Fig. 1), with geometric parameters characteristic for this molecule.The crystal structure of complex I is stabilized by numerous hydrogen bonds between the amino groups of the piperazinium dication and the oxygen atoms of the carboxyl groups, as well as between water molecules and the oxygen atoms of the carboxyl groups (Fig. S2, Table S3†). The anionic complexes [Co(TDA)2]2−are isolated from each other in the crystal structure, with the shortest intermolecular Co⋯Co distance being equal to 6.44 Å. In the crystal structure of I, the anionic layers of the metal complexes alternate with the cationic ones of the piperazinium dications (Fig. S2†).
Quantum chemical calculations
To correctly describe DC magnetic properties, the electronic structure and the magnetic anisotropy of complex I, ab initio multi-reference calculations using the ORCA28 software package were performed. The ORCA program allows SA-CASSCF/NEVPT2 results to be obtained, including spin–orbit contributions from the quasi-degenerate perturbation theory (QDPT). The energies for the low-lying spin-free (δE) and spin–orbit (ΔE) states, those being the energies of the terms and Kramers doublets, respectively, are given in Table 1. The six spin–orbit states (Kramers doublets) lowest in energy roughly correspond to the Griffith diagram8 at a large positive value of the axial crystal field parameter; also, the first quartet excited state is well separated from the ground one, thus showing that the spin-Hamiltonian description used is an adequate one.29 As can be observed, the d-orbitals splitting (Fig. 2) does not match a D4h distorted octahedral coordination; there is a strong destabilization of the dz2-orbital which is more characteristic for square planar coordination. Thus, the first excitation should occur within the dyz/dz2 orbitals, between which there is a large energy gap (∼3000 cm−1).| Term | Spin-free states (δE) | Spin–orbit states (ΔE) |
|---|---|---|
| 4A2g | 0.0 | 0.0 |
| 111.7 | ||
| 4Eg | 2428.3 | 1909.3 |
| 2080.3 | ||
| 2945.4 | 2409.4 | |
| 2507.5 |
Table 2 presents the values of the axial and rhombic ZFS parameters D and E as well as principal values of the g-tensor extracted by means of the effective Hamiltonian approach.
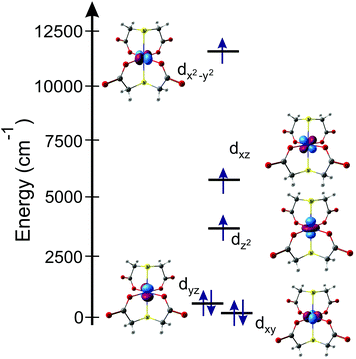 | ||
Fig. 2 Co(II) ion d-orbital splitting in [Co(TDA)2]2− anion (orbital energies: dxy = 0.0, dyz = 230.2, dz2 = 3240.5, dxz = 5745.9, dx2−y2 = 11![[thin space (1/6-em)]](https://www.rsc.org/images/entities/char_2009.gif) 407.8, cm−1). 407.8, cm−1). | ||
| Parameter | SA-CASSCF/NEVPT2 | SQUID | FD-FT THz-EPR |
|---|---|---|---|
| a Parameter not fitted, fixed to the value from SQUID. b A rationale for the deviation of this effective g′Z value from theory and SQUID is given below. | |||
| Δ(ZFS), cm−1 | 111.7 | 109.8 | 109.6 |
| D, cm−1 | +54.76 | +54.3 | +54.17 |
| |E|/D | 0.082 | 0.085 | 0.085a |
| g X | 2.46 | 2.59 | 2.59a |
| g Y | 2.37 | 2.59 | 2.59a |
| g Z | 1.99 | 2.00 | 1.61b |
DC Magnetic properties of complex I
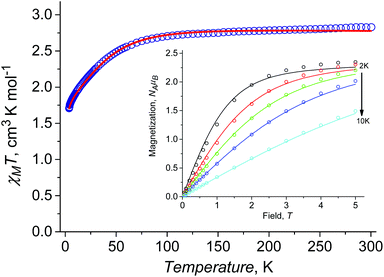
At room temperature χMT is around 2.83 cm3 K mol−1 (Fig. 3a), this being higher than the spin only value (1.875 cm3 K mol−1) due to the orbital contribution to the magnetic moment. Upon cooling, χMT remains almost constant in the temperature range of 300 to 75 K, with further decrease to the value of ≈1.69 cm3 K mol−1 at 2 K. For I at T = 2 K, the magnetization as a function of the magnetic field almost saturates at 5 T reaching a value of around 2.35NAμB (Fig. 3b), which is significantly lower than the value of 3NAμB corresponding to the pure spin S = 3/2 ground state with g = 2.To describe the DC magnetic properties, we use the following ZFS spin Hamiltonian:
 | (1) |
The crystal structure analysis has revealed the presence of pathways (via H-bonds) for intermolecular exchange interactions. Inclusion of intermolecular exchange in the model allows the theoretical description to be significantly improved, and the slope of the magnetic susceptibility curve in the low temperature region to be perfectly reproduced. The molar magnetic susceptibility is calculated by
 | (2) |
The set of the best-fit parameters are found to be: D = +54.3 cm−1, E/D = 0.0845, zJ = −0.05 cm−1, gZ = 2.00 (fixed), gX = gY = 2.59. The system exhibits a positive axial magnetic anisotropy with non-zero rhombicity parameter. These parameters allow the observed temperature dependence of χMT (Fig. 3a) and field dependences of magnetization at different temperatures (Fig. 3b) to be satisfactorily described, and they agree well with the ones calculated by SA-CASSCF/NEVPT2 (Table 2).
FD-FT THz-EPR
First we examined I by X-band CW EPR (Fig. S3†). The spectrum of complex I is broadened by magnetic interactions with neighboring Co(II) ions, which does not allow it to be reliably interpreted on its own. However, comparison with a simulated spectrum based on magnetic parameters from a quantum chemical calculation does not contradict the experimental one (Fig. S3†). Usually, Co/Zn dilution is used to increase the spectral resolution (see for example ref. 8, 11), but for I, the Zn substituted compound has a completely different structure (compare ref. 30). Therefore, to independently obtain the magnetic parameters of complex I, a modern, qualitatively different method of EPR measurements was used.30,31Direct, highly accurate experimental characterization of the transitions between the two lowest lying Kramers doublets can be achieved by EPR spectroscopy. In case of such large excitation energies (∼3.3 THz), it requires FD-FT THz-EPR, using a broadband far-infrared radiation source, as conventional EPR sources with sufficient power in that range do not exist. Magnetic-field division spectra (MDS), in which field-independent, i.e. purely electronic transitions cancel out, of a pellet sample of I (Fig. 4) disclose a zero-field energy splitting of 109.6 cm−1 between the two lowest Kramers doublets  . This is very close to the theoretical number, thus validating the ab initio calculations (Table 2). With increasing magnetic field, the absorption peak is split by the Zeeman interaction, thus providing information on g′Z as the signal is dominated by the magnetic interactions along Z. Spectral simulations on basis of the spin-only Hamiltonian in eqn (1) reproduce both the ZFS energy and the overall field dependence employing optimized parameters g′Z = 1.61 and D = 54.17 cm−1 (Fig. 4). (Since the signals are not very sensitive to the perpendicular g components and the rhombicity E/D, their values from DC magnetometry were used.) However, an additional splitting of spectral lines is observed, most prominently from the downward pointing peaks between 110 and 113 cm−1 of the ‘0.5 T/0 T’ and ‘1 T/0.5 T’ spectra (for proof of authenticity, see Fig. S4†), which cannot be rationalized on basis of Zeeman interaction and ZFS only. Moreover, the apparent g′Z value, accounting for the widening of the signal with increasing field, is significantly smaller than that determined by quantum chemical calculations and SQUID measurements. The splitting and such unusually small gZ-value (typically it should be around 2) can be explained by the effect of intermolecular antiferromagnetic exchange. Indeed, at Z-direction of the external magnetic field the part of the spin-Hamiltonian (presented in the molecular field approximation), which includes the Zeeman term and the term describing the intermolecular exchange can be written as
 | (3) |
 | (4) |
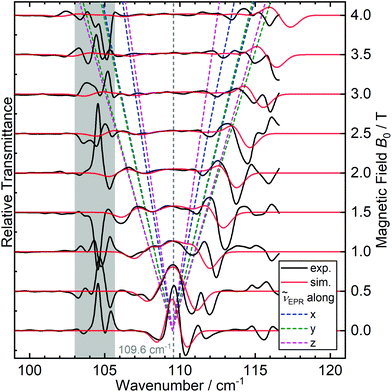 | ||
| Fig. 4 Experimental (black traces) FD-FT THz-EPR MDS of I measured at 5 K, superimposed by spin-Hamiltonian-based simulations (red traces) for an isolated single cobalt(II) site without considering intermolecular interactions. The traces above are MDS obtained by division of a raw spectrum at B0 + 0.5 T (0.5–4.5 T) by one measured at B0 (0.0–4.0 T). Maxima correspond to stronger absorption at lower B0, minima to increased absorption at higher B0. The field-dependencies of the calculated energies of the MS = |±1/2> → |±3/2> transitions along the three canonical orientations, centered at 109.6 cm−1, are depicted as dashed lines. The grey shaded area is dominated by noise due to strongly absorbing electronic transitions of I (Fig. S3†). | ||
The intermolecular hydrogen bonds between the TDA ligands along the crystallographic a axis (Fig. S2†) suggest possible exchange pathways. Thus, the FD-FT THz-EPR spectroscopic method makes it possible to independently experimentally determine the Δ(ZFS) splitting for complex I (Table 2). This confirms both the SQUID magnetometric results and the quality of the quantum chemical calculation.
AC susceptibility
Like most hexacoordinated Co(II) complexes exhibiting strong easy-plane type anisotropy,32–36 complex I does not exhibit a slow magnetic relaxation at zero applied field, but at applied HDC (1000 Oe), the out-of-phase AC signal frequency dependence with observable χ′′ maxima does appear (Fig. 5b). Such behavior indicates that complex I is a field-induced SIM. The experimental AC dependences can be described by a generalized Debye model (solid lines on Fig. 5a–c).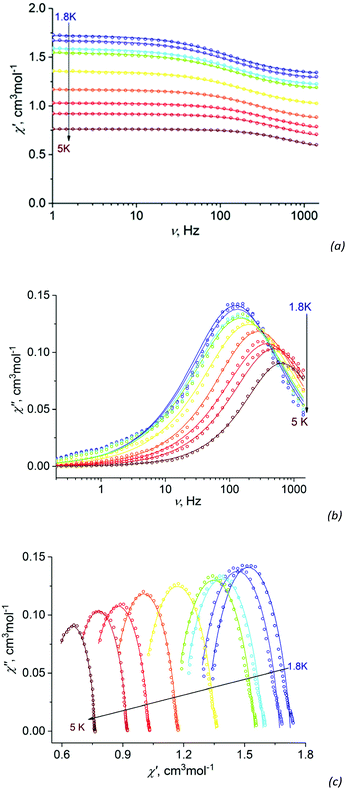 | ||
| Fig. 5 Frequency dependence of the in-phase χ′ (a) and out-of-phase χ′′ (b) AC susceptibility χM at different temperatures and HDC = 1000 Oe for I. Argand (Cole–Cole) plot (c) of complex I under 1000 Oe DC field from 1.8 to 5 K. Empty circles – experimental data, solid lines – fit data within the generalized Debye model with parameters listed in Table S4.† | ||
The obtained parameters are given in Table S4.† The temperature dependence of the relaxation time was fitted to the equation:
| τ−1 = A(HDC)2T + CTn, | (5) |
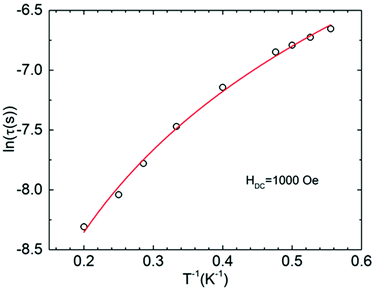 | ||
| Fig. 6 Arrhenius plot of relaxation times as ln(τ) vs. 1/T for I with applied dc fields of 1000 Oe. The solid line represents the graph of eqn (5) with best-fit parameters (see the text). | ||
Noteworthy is the abnormally low value of the Raman exponent n ∼ 2. In our recent work,34 we have already observed the similar value for this parameter. The standard Raman exponent at low temperatures should be n = 5–9.37 Taking into account a low value of the Raman exponent, we have tried to fit the temperature dependence of the relaxation time (Fig. 6) by other different combinations of the relaxation processes (Orbach + Direct, Orbach + Raman, Orbach + Raman + Direct), as well as by individual ones, but all of them except Direct + Raman combination appeared unsuccessful.
Conclusions
The synthesis and characterization of the new quasi-octahedral complex (pipH2)[Co(TDA)2] 2H2O, (pipH22+ = piperazine dication, TDA2− = thiodiacetic anion) have been described. As follows from X-ray analysis, complex I possesses an axially elongated octahedral CoO4S2 coordination sphere. The data of DC and AC magnetometry analysis, FD-FT THz-EPR spectroscopy, in combination with SA-CASSCF/NEVPT2 calculations show that the complex exhibits a strong easy-plane magnetic anisotropy (D ≈ +54 cm−1) and field-induced slow relaxation of magnetization. We have shown that the splitting between the two lowest Kramers doublets can be directly measured by a modern, alternative EPR-based approach, FD-FT THz-EPR spectroscopy. As distinct from the recently reported first field-induced SIM with sulfur atoms in the coordination sphere, trans-[Co{(OPPh2)(SPPh2)N}2(DMF)2],15 DC magnetic properties of complex I can be described by the ZFS spin-Hamiltonian formalism. This work also extends the dataset of quasi-octahedral Co(II) complexes with a rare mixed sulfur-oxygen strongly elongated octahedral coordination environment.
Experimental section
Instrumentation
All chemicals were purchased from commercial sources and used without further purification. Elemental analysis was performed on a Vario MICRO Cube analyzer. IR spectra were recorded on a Bruker Alpha FT-IR spectrometer equipped with a diamond attenuated total reflection accessory in the range of 4000–400 cm−1. The powder XRD patterns were recorded at room temperature on an ARL X'TRA X-ray diffractometer.Synthesis and characterization of I
2.5 ml of CoCl2 6H2O aqueous solution (0.0783 g, 0.330 mmol) was added to 4 ml of aqueous solution of thiodiacetic acid (0.099 g, 0.660 mmol) and piperazine (0.0605 g, 0.703 mmol). The solution was filtered, and mauve crystals of I suitable for single crystal X-ray structure analysis were obtained after slow evaporation of water at ambient temperature for three days. The obtained crystals were filtered off, washed with cold water and Et2O, and air-dried (0.125 g, 79%). Piperazine was taken in a small excess (∼7%) in order to increase the pH of the resulting solution from 5 to 7, otherwise an amorphous finely dispersed pink product was formed, this being [Co(TDA)(H2O)]n.23 Anal. calc. for C12H24S2N2O10Co: C, 30.04; H, 5.00; N, 5.84; S, 13.35%; found: C, 30.16; H, 5.25; N, 5.73; S, 13.82%. IR (ATR, cm−1): 3500–3200 w (broad), 3006 w, 2955 w, 1656 m, 1631 m, 1556 vs, 1469 m, 1405 s, 1373 s, 1239 m, 1172 w, 1076 m, 1026 m, 991 w, 931 s, 876 m, 798 m, 766 s, 696 vs, 607 m, 479 m, 444 s. The powder XRD measurements showed that the sample is a monophase crystalline material (Fig. S1†).X-ray analysis
The single crystal X-ray diffraction measurements of I were performed on a Xcalibur diffractometer with EOS CCD detector (Agilent Technologies UK Ltd). Recording of reflections, determination and refinement of unit cell parameters were performed at 150.0(1) K with monochromatic MoKα radiation (0.71073 Å) using the CrysAlis PRO software.38 The structure was solved by direct methods and refined against all F2 data. All non-hydrogen atoms were refined with anisotropic thermal parameters; positions of hydrogen atoms were obtained from difference Fourier syntheses and refined with riding model constraints. Selected crystallographic parameters and the refinement statistics are given in Table S1.† All calculations were performed with the SHELXTL software suite.39 The X-ray crystal structure data of I have been deposited with the Cambridge Crystallographic Data Center, with reference code CCDC 2036667.†Quantum chemical calculations
Ab initio calculations of ZFS parameters were performed based on state-averaged complete-active-space self-consistent-field (SA-CASSCF) wave functions complemented by N-electron valence second-order perturbation theory (NEVPT2)40 using ORCA program.28 The active space of the CASSCF calculations was composed of seven electrons in five d-orbitals of the Co atom – CAS(7,5). The state-averaged approach was used, in which all 10 quartet states and 40 doublets states were averaged with equal weights. The polarized triple-ζ-quality basis set def2-TZVP was used for cobalt, oxygen, and sulfur atoms, while the def2-SVP basis set was used for other atoms.41–43 The calculations were started with the geometry of the experimentally determined X-ray structure. The ZFS parameters, based on dominant spin–orbit coupling contributions from excited states, were calculated through quasi-degenerate perturbation theory (QDPT),44 in which approximation to the Breit–Pauli form of the spin–orbit coupling operator (SOMF approximation)45 was utilized. Splitting of the d-orbitals was analyzed within the ab initio ligand field theory (AILFT).46,47DC and AC magnetic properties
Magnetic data were obtained with a SQUID magnetometer (MPMS-5XL, Quantum Design). The DC susceptibility data were scanned in the temperature range 2–300 K at an applied field of B = 0.1 T. The magnetization has been measured at T = 2–7 K. Dynamic magnetic behavior of I was studied by alternating-current (AC) susceptibility measurements at various temperatures in oscillating magnetic field of 4 Oe and frequencies between 0.2 and 1400 Hz. The in-phase (χ′) and out-of-phase (χ′′) magnetic susceptibilities were measured in the temperature range of 1.8 to 5 K. The obtained data were fitted for each temperature using CC-FIT program.48CW X-band EPR spectroscopy
Continuous-wave EPR spectra (CW-EPR) spectra were measured at X-band (≈9.4 GHz) using a Bruker ELEXSYS E500 spectrometer equipped with 4122SHQE resonator. Powder samples were placed in a 2 mm diameter quartz tube and fixed in glassy methylcyclohexane (MCH) to avoid the partial orientation of microcrystals in a magnetic field. Continuous flow cryostat Bruker ER4112HV refrigerated with liquid helium was used for cooling the samples up to 4.2 K. The microwave power (6.325 mW) and modulation amplitude (10 G at 100 kHz) were low enough to avoid saturation effects and line broadening.FD-FT THz-EPR
FD-FT THz-EPR spectra were measured at the THz-EPR end-station of the electron storage ring BESSY II at Helmholtz-Zentrum Berlin (HZB), the main components of which are a high-resolution FTIR spectrometer (Bruker IFS 125), an evacuated optical transmission line, a 10 T superconducting magnet (Oxford Instruments Spectromag 4000) and a liquid He cooled bolometer detector (IR labs) and which is described in detail elsewhere.49,50 It employs coherent synchrotron radiation (CSR) or, in the present case, broadband, unpolarized THz radiation (>12 cm−1) emitted by a Hg arc lamp for EPR excitation. Samples were prepared as pressed pellets of a powderous mixture of ∼9 mg polycrystalline I with polyethylene. Spectra were recorded in Voigt geometry. The experimental resolution was 0.5 cm−1. To discriminate between frequency-dependent variations in the excitation spectrum and absorption bands of the sample, differential spectra were calculated for referencing as described in ref. 51 and 52.Spin-Hamiltonian-based simulations of THz-EPR spectra in the frequency domain were performed using the pepper function of the EasySpin toolbox.53–55 The Hamiltonian, considering only the angular momentum of one spin, and comprising the Zeeman interaction and the zero-field splitting (ZFS), was the same as in eqn (1). All tensors were collinear. The relative transmittance T in MDS is calculated from the simulated absorbance spectra A at different fields B as Tsim = 10AB2 − AB1.
Conflicts of interest
There are no conflicts to declare.Acknowledgements
The work was supported by the state assignment of the Ministry of Science and Higher Education of the Russian Federation (No. AAAA-A19-119092390079-8). ANV acknowledges the support by the NUST “MISiS” grant K2-2020-039. AA thanks HZB for the allocation of beamtime at BESSY II. KH and TL are indebted to D. Ponwitz for technical support and A. Schnegg for scientific advice.References
- R. Sessoli, D. Gatteschi, A. Caneschi and M. A. Novak, Nature, 1993, 365, 141–143 CrossRef CAS.
- R. Sessoli, H. L. Tsai, A. R. Schake, S. Wang, J. B. Vincent, K. Folting, D. Gatteschi, G. Christou and D. N. Hendrickson, J. Am. Chem. Soc., 1993, 115, 1804–1816 CrossRef CAS.
- G. Aromi and E. K. Brechin, Struct. Bonding, 2006, 122, 1–67 CrossRef CAS.
- C. J. Milios and R. E. P. Winpenny, Molecular Nanomagnets and Related Phenomena, 2015, vol. 164, pp. 1–109 Search PubMed.
- O. Waldmann, Inorg. Chem., 2007, 46, 10035–10037 CrossRef CAS PubMed.
- M. Feng and M. L. Tong, Chem. – Eur. J, 2018, 24, 7574–7594 CrossRef CAS PubMed.
- F.-S. Guo, A. K. Bar and R. A. Layfield, Chem. Rev., 2019, 119, 8479–8505 CrossRef CAS PubMed.
- A. V. Palii, D. V. Korchagin, E. A. Yureva, A. V. Akimov, E. Y. Misochko, G. V. Shilov, A. D. Talantsev, R. B. Morgunov, S. M. Aldoshin and B. S. Tsukerblat, Inorg. Chem., 2016, 55, 9696–9706 CrossRef CAS PubMed.
- S. Tripathi, A. Dey, M. Shanmugam, R. S. Narayanan and V. Chandrsekhar, Cobalt(II) Complexes, as Single- Ion Magnets. In: Topics in Organometallic Chemistry, Springer, Berlin, Heidelberg, 2018 Search PubMed.
- J. Vallejo, I. Castro, R. Ruiz-García, J. Cano, M. Julve, F. Lloret, G. D. Munno, W. Wernsdorfer and E. Pardo, J. Am. Chem. Soc., 2012, 134, 15704–15707 CrossRef CAS PubMed.
- D. V. Korchagin, A. V. Palii, E. A. Yureva, A. V. Akimov, E. Y. Misochko, G. V. Shilov, A. D. Talantsev, R. B. Morgunov, A. A. Shakin, S. M. Aldoshin and B. S. Tsukerblat, Dalton Trans., 2017, 46, 7540–7548 RSC.
- J. Walsh, G. Bowling, A.-M. Ariciu, N. Jailani, N. Chilton, P. Waddell, D. Collison, F. Tuna and L. Higham, Magnetochemistry, 2016, 2, 23–33 CrossRef.
- A. Switlicka-Olszewska, J. Palion-Gazda, T. Klemens, B. Machura, J. Vallejo, J. Cano, F. Lloret and M. Julve, Dalton Trans., 2016, 45, 10181–10193 RSC.
- L. Sun, S. Zhang, S. Chen, B. Yin, Y. Sun, Z. Wang, Z. Ouyang, J. Ren, W. Wang, Q. Wei, G. Xie and S. Gao, J. Mater. Chem. C, 2016, 4, 7798–7808 RSC.
- E. Ferentinos, M. Xu, A. Grigoropoulos, I. Bratsos, C. P. Raptopoulou, V. Psycharis, S.-D. Jiang and P. Kyritsis, Inorg. Chem. Front., 2019, 6, 1405–1414 RSC.
- J. A. Hartman, E. J. Hintsa and S. R. Cooper, J. Am. Chem. Soc., 1986, 108, 1208–1214 CrossRef CAS.
- S. Chandrasekhar and A. McAuley, Inorg. Chem., 1992, 31, 480–487 CrossRef CAS.
- C. Ohrenberg, P. Ge, P. Schebler, C. G. Riordan, G. P. A. Yap and A. L. Rheingold, Inorg. Chem., 1996, 35, 749–754 CrossRef CAS.
- J. Nishijo, A. Miyazaki and T. Enoki, Bull. Chem. Soc. Jpn., 2004, 77, 715–727 CrossRef CAS.
- J. M. Zadrozny, J. Telser and J. R. Long, Polyhedron, 2013, 64, 209–217 CrossRef CAS.
- S. Vaidya, P. Shukla, S. Tripathi, E. Rivière, T. Mallah, G. Rajaraman and M. Shanmugam, Inorg. Chem., 2018, 57, 3371–3386 CrossRef CAS PubMed.
- S. Vaidya, S. K. Singh, P. Shukla, K. Ansari, G. Rajaraman and M. Shanmugam, Chem. – Eur. J., 2017, 23, 9546–9559 CrossRef CAS PubMed.
- A. Grirrane, A. Pastor, E. Álvarez, C. Mealli, A. Ienco, D. Masi and A. Galindo, Inorg. Chem. Commun., 2005, 8, 463–466 CrossRef CAS.
- A. Grirrane, A. Pastor, E. Álvarez, C. Mealli, A. Ienco, P. Rosa and A. Galindo, Eur. J. Inorg. Chem., 2007, 2007, 3543–3552 CrossRef.
- G. A. Craig and M. Murrie, Chem. Soc. Rev., 2015, 44(8), 2135–2147 RSC.
- M. Feng and M.-L. Tong, Chem. – Eur. J., 2018, 24, 7574–7594 CrossRef CAS PubMed.
- P. S. Perlepe, D. Maniaki, E. Pilichos, E. Katsoulakou and S. P. Perlepes, Inorganics, 2020, 8, 39, DOI:10.3390/inorganics8060039.
- F. Neese, The ORCA Program System, WILEY Interdiscip. Rev.: Comput. Mol. Sci, 2012, 2, 73–78 CAS.
- Y. P. Tupolova, I. N. Shcherbakov, L. D. Popov, V. E. Lebedev, V. V. Tkachev, K. V. Zakharov, A. N. Vasiliev, D. V. Korchagin, A. V. Palii and S. M. Aldoshin, Dalton Trans., 2019, 48, 6960–6970 RSC.
- J. Nehrkorn, I. A. Valuev, M. A. Kiskin, A. S. Bogomyakov, E. A. Suturina, A. M. Sheveleva, V. I. Ovcharenko, K. Holldack, C. Herrmann, M. V. Fedin, A. Schnegg and S. L. Veber, J. Mater. Chem. C, 2021, 9, 9446–9452 RSC.
- E. Y. Misochko, A. V. Akimov, D. V. Korchagin, J. Nehrkorn, M. Ozerov, A. V. Palii, J. M. Clemente-Juan and S. M. Aldoshin, Inorg. Chem., 2019, 58, 16434–16444 CrossRef CAS PubMed.
- F. Varga, C. Rajnák, J. Titiš, J. Moncoľ and R. Boča, Dalton Trans., 2017, 46(13), 4148–4151 RSC.
- B. Brachňaková, S. Matejová, J. Moncol, R. Herchel, J. Pavlik, E. Moreno-Pineda, M. Ruben and I. Šalitroš, Dalton Trans., 2020, 49, 1249–1264 RSC.
- Y. P. Tupolova, I. N. Shcherbakov, L. D. Popov, R. B. Morgunov, D. V. Korchagin, V. E. Lebedev, A. V. Palii and S. M. Aldoshin, Dalton Trans., 2020, 49, 15592–15596 RSC.
- S. Mandal, S. Mondal, C. Rajnák, J. Titiš, R. Boča and S. Mohanta, Dalton Trans., 2017, 46(38), 13135–13144 RSC.
- C. Rajnák, J. Titiš, J. Moncol’ and R. Boča, Dalton Trans., 2020, 49, 4206–4210 RSC.
- A. Abragam and B. Bleaney, Electron Paramagnetic Resonance of Transition Ions, Oxford University Press, Oxford, 2012 Search PubMed.
- CrysAlis PRO version 171.36.20, Agilent Technologies UK Ltd, 2011 Search PubMed.
- G. M. Sheldrick, SHELXTL v.6.14, Structure Determination Software Suite, Bruker AXS, 2000 Search PubMed.
- C. Angeli, B. Bories, A. Cavallini and R. Cimiraglia, J. Chem. Phys., 2006, 124, 054108–054108 CrossRef PubMed.
- F. Weigend and R. Ahlrichs, Phys. Chem. Chem. Phys., 2005, 7, 3297–3297 RSC.
- A. Schäfer, H. Horn and R. Ahlrichs, J. Chem. Phys., 1992, 97, 2571–2577 CrossRef.
- A. Schäfer, C. Huber and R. Ahlrichs, J. Chem. Phys., 1994, 100, 5829–5835 CrossRef.
- D. Ganyushin and F. Neese, J. Chem. Phys., 2006, 125, 024103–024103 CrossRef PubMed.
- F. Neese, J. Chem. Phys., 2005, 122, 034107–034107 CrossRef PubMed.
- M. Atanasov, D. Ganyushin, K. Sivalingam and F. Neese, in Molecular Electronic Structures of Transition Metal Complexes II, ed. D. M. P. Mingos, P. Day and J. P. Dahl, Springer Berlin Heidelberg, Berlin, Heidelberg, 2012, pp. 149–220 Search PubMed.
- S. K. Singh, J. Eng, M. Atanasov and F. Neese, Coord. Chem. Rev., 2017, 344, 2–25 CrossRef CAS.
- N. F. Chilton, CC-Fit, The Univesity of Manchester, UK, 2014 Search PubMed.
- K. Holldack and A. Schnegg, J. Large-Scale Res. Facilities, 2016, 2, A51 CrossRef.
- J. Nehrkorn, K. Holldack, R. Bittl and A. Schnegg, J. Magn. Reson., 2017, 280, 10–19 CrossRef CAS PubMed.
- J. Krzystek and J. Telser, Dalton Trans., 2016, 45, 16751–16763 RSC.
- A. Schnegg, eMagRes, 2017, 6, 115–132 CAS.
- S. Stoll and A. Schweiger, J. Magn. Reson., 2006, 178, 42–55 CrossRef CAS PubMed.
- J. Nehrkorn, A. Schnegg, K. Holldack and S. Stoll, Phys. Rev. Lett., 2015, 114, 114–114 CrossRef PubMed.
- J. Nehrkorn, J. Telser, K. Holldack, S. Stoll and A. Schnegg, J. Phys. Chem. B, 2015, 119, 13816–13824 CrossRef CAS PubMed.
Footnote |
| † Electronic supplementary information (ESI) available. CCDC 2036667. For ESI and crystallographic data in CIF or other electronic format see DOI: 10.1039/d1dt02413b |
| This journal is © The Royal Society of Chemistry 2021 |

