 Open Access Article
Creative Commons Attribution 3.0 Unported Licence
Lanthanide complexes of DOTA–nitroxide conjugates for redox imaging: spectroelectrochemistry, CEST, relaxivity, and cytotoxicity†
D.
Mouchel Dit Leguerrier
a,
R.
Barré
a,
Q.
Ruet
b,
D.
Imbert
 c,
C.
Philouze
a,
P. H.
Fries
c,
V.
Martel-Frachet
bd,
J. K.
Molloy
c,
C.
Philouze
a,
P. H.
Fries
c,
V.
Martel-Frachet
bd,
J. K.
Molloy
 *a and
F.
Thomas
 *a
*a
aUniv. Grenoble Alpes, CNRS, DCM, 38000 Grenoble, France. E-mail: jennifer.molloy@univ-grenoble-alpes.fr; fabrice.thomas@univ-grenoble-alpes.fr
bInstitute for Advanced Biosciences, INSERM U1209, UMR CNRS 5309, Grenoble Alpes University, 38700 La Tronche, France
cUniv. Grenoble Alpes, CEA, CNRS, IRIG-LCBM, 38000 Grenoble, France
dEPHE, PSL Research University, 75014 Paris, France
First published on 6th July 2021
Abstract
The lanthanide(III) complexes (Gd, Eu, Dy, and Yb) of DOTA tris(amide) and bis(amide) derivatives (L1 and L2) featuring one redox active TEMPO arm were prepared. Ligand L2 harbours an alkyne fragment for further functionalization. The X-ray crystal structure of ligand L2 in complexation with Na+ was solved. The complexes showed in their CV one oxidation wave (0.26–0. 34 V vs. Fc+/Fc) due to an oxoammonium/nitroxide redox couple and a broad reduction corresponding to the nitroxide/hydroxylamine system. The Eu complexes demonstrated the presence of one water molecule in their coordination sphere. The nitroxide complexes were characterized by EPR spectroscopy, showing the typical 3-line pattern in the high temperature regime, which is quenched upon the addition of ascorbate (reduction into hydroxylamine). In their nitroxide form, the complexes show essentially no CEST peak. Conversely, the reduced complexes demonstrate a 12% CEST peak at 51 ppm, corresponding to the metal bound water molecule. Fast exchange precluded the CEST activity for the amide protons. All the complexes proved to be essentially non-toxic for M21 cells at concentrations up to 50 μM.
1. Introduction
Medical imaging is an extremely important domain for current research due to the necessity of precocious detection, follow-up, and treatment of dangerous illnesses.1 In particular, molecular imaging can provide the details of biological processes in tissues of the human body, giving more information for the diagnosis of diseased tissues.2 The development of molecular imaging requires the development of novel imaging probes capable of giving an effective response to a stimulus. The redox status of a tissue is an important marker of its activity. The redox potential is defined by the sum of the redox couples weighted with the concentration of the respective reduced species. The intracellular medium is buffered by several redox couples of which glutathione disulfide/sulfhydryl GSSG/GSH is the main one (a redox potential of −120 to −70 mV).3 The redox environment of the extracellular space is dominated by the cysteine disulfide/sulfhydryl redox couple CySSCy/CysSH, with higher concentrations (0.05–0.3 mM) than those of the GSSG/GSH couple (0.002–0.02 mM) and with less negative redox potential (−80 to −20 mV) than that of GSSG/GSH, giving a more oxidized compartment than the cytosol.4 The conditions of oxidative stress are encountered when the natural metabolism of oxygen is disrupted, leading to the overproduction of reactive oxygen species (ROS) by incomplete reduction.5 Changes in the redox status (oxidative stress or hypoxia) are believed to contribute to cellular signalling (differentiation and apoptosis)6 but also the proliferation of diseases such as cardiovascular diseases,7,8 cancers9,10 or neurodegenerative diseases.11Among various non-invasive detection techniques, magnetic resonance imaging (MRI) has proved to be a key technique for clinical imaging. It relies on the differential relaxation of protons of the bulk water in the human body.12 Its success lies in its high spatial resolution, lack of hazardous radiation, and the fact that it is painless and can be functional in addition to being anatomical. Approximately one third of the MRI scans are realized with a relaxation contrast agent (CA), which is often a gadolinium complex. GdIII is the metal ion of choice due to its quenched total electronic orbital angular momentum L = 0, the highest possible total electronic spin value S = 7/2, and slow longitudinal electronic relaxation, especially under a rather high magnetic field B0 ≥ 1 T of the MRI scanners.13–15 The CA is injected into a vein before the analysis to improve the details and clarity of the images. The CA effectiveness is gauged by its relaxivity r1, which is the increase in the longitudinal relaxation rate of the water protons (hydrogen nuclei) per mM of the contrast agent in biological tissues.11,14 It was suggested almost ten years ago that lanthanide-based CAs could also be used to sense the redox environment.16,17 Two main strategies emerged that are based on either a redox-reactive ligand or redox-active metal. In the first case, the r1 value of the GdIII-based CA can be tuned by the hydration state (the number of coordinated water molecules q), which is itself modulated by a redox event at the ligand. This first strategy is illustrated by DOTA-based Gd3+ complexes (DOTA is 1,4,7,10-tetraazacyclododecane-1,4,7,10-tetraacetic acid) appended by a merocyanine group. This group cyclizes into spirooxazine upon reduction by NADH, resulting in decoordination and further increase of q from 1 to 2 with the change in r1.18–20 Several Gd3+ complexes functionalized by a thiol-reactive 2-pyridyldithio group were also prepared and shown to react with GSH with a change in the q number from 2 to 1.21,22 Alternatively, the slower rotational dynamics upon the redox reaction of the ligand by reversible (or irreversible) binding of low molecular weight Gd3+ complexes to macromolecules can be used to increase the r1 values at constant q. Some Gd3+–DOTA complexes appended by terminal thiol groups demonstrated such behaviour, whereby they react with the Cys-34 residue of human serum albumin.23
The second strategy is exemplified by the cryptates of europium, the only lanthanide susceptible to adopting two different oxidation states in vivo.24 The Eu2+ ion, isoelectronic to Gd3+, is oxidized in vivo into Eu3+, which shows negligible paramagnetic relaxation because of its very fast electronic relaxation.25–27
Paramagnetic Chemical Exchange Saturation Transfer (PARACEST) is an attractive contrast mechanism for MRI, which often employs paramagnetic lanthanide complexes.29 Recently, this technique based on paramagnetic lanthanide ions such as EuIII, YbIII, and DyIII which display very fast electronic relaxation thus lends itself to more sensitive specific functional imaging. A pre-saturation pulse is applied to exchangeable protons within the complex, resulting in a transfer of saturated spins to the bulk. As a consequence, the water signal intensity decreases and negative contrast is observed. Very few lanthanide redox-responding complexes have been reported to date for PARACEST imaging.16 All are based on the Eu3+ complexes of DOTA tetraamide ligands as this lanthanide shows the slowest water exchange rates (Chart 1)28 and operate according to two distinct mechanisms: the ligands can undergo reduction such as in a nitrobenzene (Chart 1a)30 or quinolinium group,31 resulting in an alteration of the water exchange rate. Alternatively, the nitroxide appended Eu3+–DOTA complex (Chart 1b) exhibits a T1-shortening of bulk water protons by the paramagnetic centers, which increases upon reduction.32 Interestingly, an Eu3+/Eu2+ switch was recently proposed as a redox PARACEST agent.33
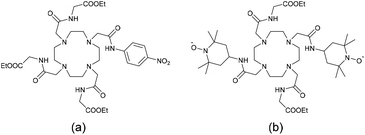 | ||
| Chart 1 Structures of ligands whose Eu3+ complexes were reported as redox-responsive PARACEST agents.28 | ||
We recently reported LnIII complexes that are sensitive to environmental redox changes. We monitored the changes in the oxidation state by luminescence, wherein over 90% switch could be achieved.34–36 We have also demonstrated through EPR the spin trap of a major ROS, the hydroxyl radicals, by lanthanide complexes of a DOTA-hydroxylamine derivative.37
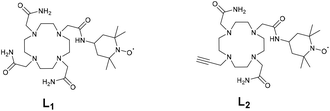
Following the elegant strategy developed by Sherry et al. to design PARACEST agents responsive to redox changes,32 we herein report a series of lanthanide(III) complexes (Gd, Eu, Dy, and Yb) based on a cyclen scaffold containing the redox active TEMPO arm38 (Chart 2). Two different derivatives L1 and L2 have been designed containing three acetamides or with an alkyne. The alkyne was chosen in order to allow future functionalization and bioconjugation of these complexes via click chemistry. We investigate their photophysical, redox and relaxometry properties and their potential as redox-responsive PARACEST agents.
2. Results and discussion
2.1 Synthesis
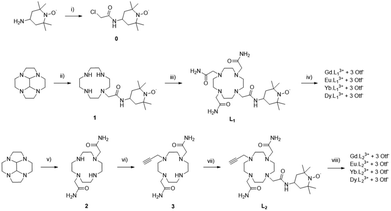
The synthesis of ligands L1 and L2 was performed using the successive functionalization of the cyclen macrocycle (Scheme 1). L1 was synthesised via substitution with the nitroxide acetamide and further functionalization with three bromoacetamide arms. L2 was synthesised by the protection of the cyclen macrocycle in order to selectively functionalise 2 bromoacetamide arms, deprotection, and followed by the addition of a dilute solution of propargyl bromide to perform the mono substitution. Purification and further addition of the nitroxide acetamide afforded the desired product (see experimental).The GdIII, EuIII, YbIII and DyIII complexes were prepared from L1 and L2 by reaction with the corresponding lanthanide salt in H2O at pH 7.4 and precipitation of the resulting complex.
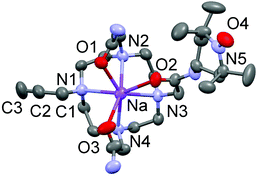
Ligand L2 was crystallised by slow evaporation of water solution to give single crystals of quality for X-ray diffraction. Surprisingly, the structural analysis demonstrated the complexation of a Na+ ion into the cyclen cavity, giving the species [Na(L2)]+, 0.5 Br−, and 0.5 Cl−. The sodium ion is heptacoordinated to four nitrogens of the macrocycle and three oxygens of the acetamide arms (Fig. 1). The Na–N bond distances range from 2.527(10) to 2.643(9) Å, while the Na–O bond distances are between 2.398(3) and 2.436(3) Å. The C2–C3 bond distance in one pending arm is 1.17(2) Å, which confirms its triple bond character. The N–O bond distance in the opposite pending arm is 1.289(4) Å, which is reminiscent of the TEMPO radicals.
2.2 Electrochemistry
Electrochemical investigations were performed by cyclic voltammetry (CV), differential pulse voltammetry (DPV) and rotating disc electrode (RDE) voltammetry in an acetonitrile solution containing 0.1 M tetra-n-butylammonium perchlorate (TBAP) as the supporting electrolyte. All the potentials are referred to the ferrocenium/ferrocene redox standard.The ligands demonstrate oxidation potentials of 0.25 V and 0.31 V vs. Fc+/Fc (0.88 to 0.94 V vs. NHE),39 respectively, for L1 and L2. The complexes exhibit a reversible oxidation wave in the range of 0.26–0.34 V vs. Fc+/Fc (Table 1 and Fig. 2), which is assigned to the oxidation of the TEMPO moiety into the persistent oxoammonium species TEMPO+.40 These values are slightly more positive than that reported for free TEMPO (0.21 V vs. Fc+/Fc)41 due to the presence of the amide function. An irreversible reduction wave corresponding to the reduction of the TEMPO moiety into the hydroxylamine TEMPOH is observable as a broad feature between −1 and −1.5 V vs. Fc+/Fc (about −0.3 to −0.9 V vs. NHE, Fig. 2).40 The apparent irreversibility of the redox wave is due to the very slow electron transfer of the proton-coupled TEMPOH/TEMPO redox couple and an exceedingly large anodic-to-cathodic peak separation, which shifts the oxidation peak of TEMPOH above the TEMPO+/TEMPO wave.40,42
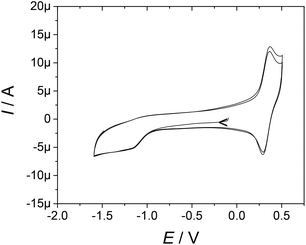 | ||
| Fig. 2 Cyclic voltammetry curve of [Eu(L2)]3+ in 0.5 mM CH3CN solution containing 0.1 M TBAP. Scan rate, 0.1 V s−1; T = 298 K; carbon electrode. | ||
| Complex | E ox1/2 | Complex | E ox1/2 |
|---|---|---|---|
| a In 0.5 mM CH3CN solutions containing TBAP as the supporting electrolyte. All the potential values are given in V and referred to the Fc+/Fc redox couple. T = 298 K and the scan rate is 0.1 V s−1. Parameters for ferrocene against the reference used (AgNO3 0.01 M): E1/2 = 0.090 V. In order to convert the potentials from the Fc+/Fc reference to the NHE, 0.630 V must be added to the listed values.39 | |||
| [Gd(L1)]3+ | 0.26 | [Gd(L2)]3+ | 0.33 |
| [Eu(L1)]3+ | 0.30 | [Eu(L2)]3+ | 0.34 |
| [Dy(L1)]3+ | 0.28 | [Dy(L2)]3+ | 0.33 |
| [Yb(L1)]3+ | 0.32 | [Yb(L2)]3+ | 0.33 |
| L1 | 0.25 | L2 | 0.31 |
Each complex, EuIII, DyIII, GdIII or YbIII, demonstrates similar features with only a slight shift of the oxidation and reduction waves, thus confirming that the metal ion had very little effect on the redox behaviour of the TEMPO group. It must be stressed that no oxidation or reduction of the LnIII centre was observed in the investigated potential range.
2.3 Absorption and luminescence spectroscopy
The UV-vis absorption spectra of the ligands L1 and L2 in CH3CN show two main bands at 246 nm (ε = 14![[thin space (1/6-em)]](https://www.rsc.org/images/entities/char_2009.gif) 200 M−1 cm−1) and 286 nm (345 M−1 cm−1) for L1 and 246 nm (22
200 M−1 cm−1) and 286 nm (345 M−1 cm−1) for L1 and 246 nm (22![[thin space (1/6-em)]](https://www.rsc.org/images/entities/char_2009.gif) 530 M−1 cm−1) and 286 nm (1590 M−1 cm−1) for L2.43 Upon complexation, these bands were slightly red shifted with respect to the ligand, with the [Gd(L2)]3+ complex showing a λ value of 292 nm (4020 M−1 cm−1) and 363 nm (ε = 1760 M−1 cm−1). The complexes also possess very weak epsilon absorption corresponding to the f–f lanthanide transitions (Table 2).
530 M−1 cm−1) and 286 nm (1590 M−1 cm−1) for L2.43 Upon complexation, these bands were slightly red shifted with respect to the ligand, with the [Gd(L2)]3+ complex showing a λ value of 292 nm (4020 M−1 cm−1) and 363 nm (ε = 1760 M−1 cm−1). The complexes also possess very weak epsilon absorption corresponding to the f–f lanthanide transitions (Table 2).
| Complex | λ (nm) /ε (M−1 cm−1) |
|---|---|
| a In 0.5 mM CH3CN solutions containing TBAP as the supporting electrolyte (0.1 M). T = 298 K. In order to ensure full nitroxide radical formation, the complexes were subjected to electrolysis at a potential intermediate between the TEMPOH/TEMPO and TEMPO+/TEMPO redox couples. | |
| [Gd(L1)]3+ | 245 (30![[thin space (1/6-em)]](https://www.rsc.org/images/entities/char_2009.gif) 040), 292 (5770), 363 (3000) 040), 292 (5770), 363 (3000) |
| [Eu(L1)]3+ | 245 (26![[thin space (1/6-em)]](https://www.rsc.org/images/entities/char_2009.gif) 970), 292 (8110), 363 (4270) 970), 292 (8110), 363 (4270) |
| [Dy(L1)]3+ | 245 (34![[thin space (1/6-em)]](https://www.rsc.org/images/entities/char_2009.gif) 190), 292 (3620), 363 (1800) 190), 292 (3620), 363 (1800) |
| [Yb(L1)]3+ | 246 (22![[thin space (1/6-em)]](https://www.rsc.org/images/entities/char_2009.gif) 720), 292 (5220), 363 (2700) 720), 292 (5220), 363 (2700) |
| [Gd(L2)]3+ | 292 (4020), 363 (1760) |
| [Eu(L2)]3+ | 292 (3900), 363(1860) |
| [Dy(L2)]3+ | 288 (7090), 363 (1840) |
| [Yb(L2)]3+ | 279 (8780), 363 (918) |
The luminescence spectra were recorded for the europium complexes since structural information can be extracted from a 7F0–5 band shape analysis. They were recorded via excitation of the ligand at 315 nm, providing the expected spectra of the EuIII ions (Fig. 3). A sharp band is observed at 580 nm for [Eu(L1)]3+ that corresponds to the transition 5D0 → 7F0. Its sharpness suggests the high symmetry of the coordination sphere of the complex and the presence of single site symmetry for EuIII. The 5D0 → 7F1 transition is a magnetic dipole transition independent of the coordination sphere. The hypersensitive electric dipole transition 5D0 → 7F2 is most influenced by the local symmetry. The distinct ratio of the integrated bands corresponding to the transitions 5D0 → 7F2 over 5D0 → 7F1 in [Eu(L1)]3+ and [Eu(L2)]3+ suggests a different coordination environment. In particular, the higher ratio of [Eu(L2)]3+ (Fig. 3) supports a lower symmetry around the first coordination sphere. Finally, the excitation spectra confirmed that the excitation occurred via the accumulation of ligand and transfer towards the EuIII metal.
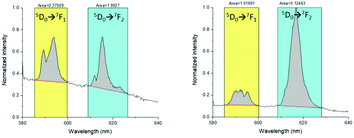 | ||
| Fig. 3 Luminescence spectra of [Eu(L1)]3+ (left) and [Eu(L2)]3+ (right) in D2O upon excitation at 395 nm. | ||
Luminescence measurements were also used to determine the lifetimes of the complexes via excitation at 396 nm in both H2O and D2O. For [Eu(L1)]3+, we determined t = 0.43 s in H2O and t = 1.32 in D2O, representing one water molecule in the coordination sphere of the LnIII ion. This result is mostly as expected due to the potential eight coordinate macrocyclic ligand. Complex [Eu(L2)]3+ demonstrates t = 0.44 s and t = 1.36 s for H2O and D2O, respectively, again representing one coordinated water molecule. Hence, the coordination number changes upon the substitution of one amide with the alkyne, but the number of coordinated water remains constant, q = 1. This water molecule is crucial in the use of these complexes in imaging.
2.4 Electron paramagnetic resonance spectroscopy
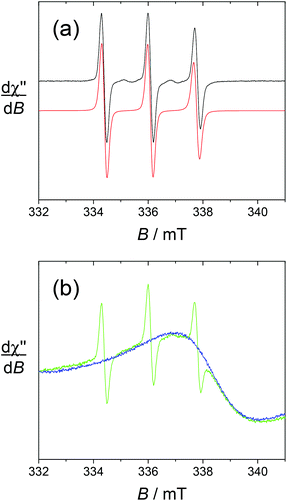
Both the lanthanide ions and the ligands harbour unpaired electrons and hence can be analysed by electron paramagnetic resonance (EPR).We first recorded the fluid solution spectra of the free ligands L1 and L2 at T = 293 K. They show a typical isotropic 3-line pattern centered around g = 2.006 (Fig. 4). The hyperfine coupling constant AN is 1.7 mT, typical for TEMPO radicals. In the absence of metal ions, the broadening of the high field component is solely due to the Brownian rotational motion of the radical. In the fast tumbling regime, the rotational correlation time τc can be calculated by using Kivelson's formula (eqn (1)), where C is a constant calculated from the principal values of g and A tensors of the nitroxide radical (6.6 10−10 for di-tert-butylnitroxide; this value is not expected to change much between nitroxide radicals),44,45 ΔH(+1) is the peak-to-peak linewidth of the low field line and h(+1) and h(−1) are the heights of the low and high field resonances.
| τc = CΔH(+1)[(h(+1)/h(−1))1/2−1] | (1) |
The rotational correlation time τc is 1.6 × 10⁻¹⁰ s for both L1 and L2, in agreement with their low chemical weight and comparable hydrodynamic diameters. The spectrum shown in Fig. 4 was simulated accordingly.
The spectra of the gadolinium complexes [Gd(L1)]3+ and [Gd(L2)]3+ at T = 293 K show noticeable differences. Both display the sharp 3-line nitroxide pattern (Γ = 0.28 mT) with weaker intensity compared to the free ligands. In the case of [Gd(L1)]3+, this 3-line pattern overlaps with an intense and broad resonance (Γ = 3.24 mT) centered at g = 1.99, which is assigned to the gadolinium signal (Fig. 4). Upon the addition of ascorbic acid, the TEMPO unit is reduced to TEMPOH, resulting in the quenching of the 3-line pattern without affecting the broad resonance. Strikingly, the gadolinium resonance cannot be observed in the case of [Gd(L2)]3+. This suggests faster relaxation and hence the distinct influence of the nitroxide and coordination environment on the gadolinium relaxation rate.
We also investigated the reversibility of the reduction by adding the oxidant NaIO4 to an ascorbate-reduced sample of [Gd(L2)]3+ (Fig. S15†). The initial radical signal of [Gd(L2)]3+ was restored to more than 80% after 30 min. The ascorbate-reduced sample could be alternatively reoxidized by O2 bubbling under basic conditions but the reaction proceeds less efficiently (only 20% recovery after 30 min).
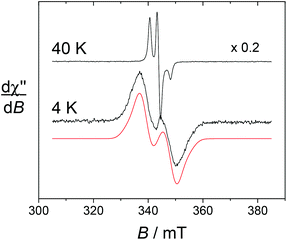
Low temperature measurements were conducted (4–50 K) in order to characterize the Yb, Eu and Dy complexes, wherein fast relaxation prevents the observation of the lanthanides at higher temperatures. At T = 40 K, the complexes exhibit the typical signature of immobilized nitroxide radicals, with the broadening and shift of the mI = +1 and −1 transitions due to anisotropy. Accordingly, similar spectra were obtained for the free ligands in frozen solutions (see the ESI†). Upon cooling down to 5 K, drastic changes were evidenced in the EPR spectra for [Yb(L1)]3+, [Dy(L1)]3+ and their alkyne counterparts. For a given Ln ion, the EPR spectra of the alkyne derivative [Ln(L2)]3+ show essentially the same temperature dependence as [Ln(L1)]3+ and hence will not be commented in detail.
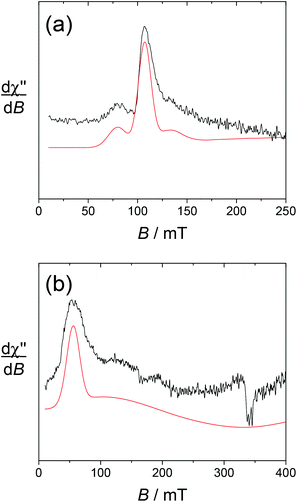
The spectrum of [Yb(L1)]3+ taken at 4 K shows an intense doublet at g = 2.00 (Fig. 5), which corresponds to a radical signature but differs markedly from the 3-line pattern of isolated nitroxides. The spectrum of the free ligand L1 was indeed recorded at this low temperature and shows exclusively the anisotropic 3-line pattern of the nitroxide radical. Hence this behaviour strongly suggests that the paramagnetic lanthanide interacts magnetically with the nitroxide moiety. From the X-ray crystal structure of NaL1+, the N(nitroxide)–metal distance could be estimated at ca. 7.8 Å, confirming that a triplet state may be accessible. Upon considering the feature at 4 K as a spin triplet resonance and using a simple model with an isotropic g tensor, the simulation gives |D| = 300 MHz, which is consistent with the above interspin distance. Note that simulation of this feature by considering an isolated nitroxide anisotropic signal leads to unreasonable 14N hyperfine coupling constants. The addition of ascorbate to [Yb(L1)]3+ results in the full quenching of this feature around g = 2, confirming its assignment. The EPR spectrum of reduced [Yb(L1)]3+ shows resonances at g = 8.6, 6.41 and 5.2, which are assigned to the parallel features of an isolated Yb3+ ion (Fig. 6). The main line at g = 6.41 is assigned to the even isotope, while the satellite ones (approx. 15% in intensity) correspond to the 171Yb3+ and 173Yb3+ isotopes. The g∥ value of the even isotope compares well with that reported for the [Yb·DTMA·OH2]3+ complex (6.45),46 congruent with a similar environment of the metal center.
For [Dy(L1)]3+, the sharp nitroxide lines decrease in intensity upon decreasing the temperature, at the expense of a broader signal centered around g = 2 that we assign to the interacting nitroxide, as observed for [Yb(L1)]3+. It is distributed over a larger window compared to [Yb(L1)]3+, indicative of a distinct influence of the lanthanide ion on the radical moiety. This is also revealed by the spectrum at T = 8 K, which still contains both the sharp nitroxide lines and the broader line (see the ESI†). After the addition of ascorbate (reduction of the nitroxide unit), the signal at g = 2 completely disappears, affording a spectrum with an intense resonance at geff ≈ 11.6, which is reminiscent of isolated Dy3+ complexes (Fig. 6).
The EPR spectrum of [Eu(L1)]3+ at 40 K shows the same nitroxide feature as [Yb(L1)]3+ and [Dy(L1)]3+. At 4 K, the nitroxide signal broadens slightly, but does not show any distinct evolution of its shape, which is likely the consequence of the small magnetic moment of trivalent europium.
2.5 DFT calculations on model compounds
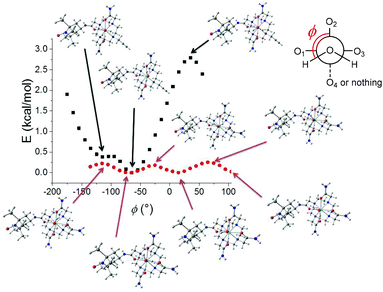
The structure of the lanthanide complexes was investigated by DFT calculations. In order to overcome the prohibitive computational cost of complexes of f-metal ions, the optimizations were performed on two models wherein the lanthanide ion was replaced by Y3+, namely YL13+ and YL23+. Yttrium is indeed a common substitute for Gd3+ in imaging. The number of coordinating water molecules was set to one, in agreement with the luminescence data (see above). For YL13+, the optimized structure shows a pendent TEMPO arm, with the hydrogens of the water molecule pointing along but opposite to the TEMPO group. For YL23+, we first performed a relaxed potential energy surface (PES) scan along the C–N axis of the alkyne arm to determine its preferred orientation. The lowest energy conformation corresponds to the alkyne pointing away from the metal. It is also interesting to note that the water hydrogens point orthogonal to the alkyne and establish H-bonds with the two acetamide arms. Hence this conformation allows minimization of the steric clash between the coordinating water molecule and the alkyne group, while stabilizing YL23+ through H-bonding interactions. The distinct orientation of the water hydrogens in YL13+ and YL23+ prompted us to perform an additional relaxed PES scan, whereby the water molecule was rotated along the M–O axis (ϕ angle in Fig. 7). For YL13+, the variation of energy is monotonic and sinusoidal with alternating minima and maxima every ca. 120° and a total change that does not exceed 0.3 kcal mol−1. Model YL23+ exhibits a strikingly different behaviour: the total energy change during the scan is one order of magnitude higher, with the lowest energy conformation corresponding to the water hydrogens orthogonal to the alkyne. These results show that the barrier for the rotation of the water molecule is very small for YL13+ but significantly higher (immobilized) for YL23+. The functionalization of the macrocycle via an amide linker (TEMPO arm) hence appears to weakly affect the rotational dynamic, in contrast to alkyl linkers (alkyne arm), which do not allow the formation of stabilizing H-bonds with the coordinating water molecule and prevent rotation. Furthermore, the coordination bonds are shorter in YL23+, which is not surprising owing to the lower expected coordination number in this complex.2.6 CEST activity and relaxivity
The ligand design incorporated exchangeable NH2 protons, which can confer potential CEST activity. In addition, these complexes are 8 or 9-coordinate, thus containing a metal bound water molecule that can confer CEST activity via an exchangeable H2O on the metal centre. The CEST spectra, plotted as a percentage decrease in water proton magnetisation as a function of the presaturation pulse frequency, were recorded in 0.1 M HEPES buffer in H2O![[thin space (1/6-em)]](https://www.rsc.org/images/entities/char_2009.gif) :
:![[thin space (1/6-em)]](https://www.rsc.org/images/entities/char_2009.gif) acetonitrile (2
acetonitrile (2![[thin space (1/6-em)]](https://www.rsc.org/images/entities/char_2009.gif) :
:![[thin space (1/6-em)]](https://www.rsc.org/images/entities/char_2009.gif) 1) at 500 MHz for both the nitroxide and hydroxylamine forms of complexes [Ln(L1)]3+ and [Ln(L2)]3+ (Ln = EuIII, DyIII, and YbIII).
1) at 500 MHz for both the nitroxide and hydroxylamine forms of complexes [Ln(L1)]3+ and [Ln(L2)]3+ (Ln = EuIII, DyIII, and YbIII).
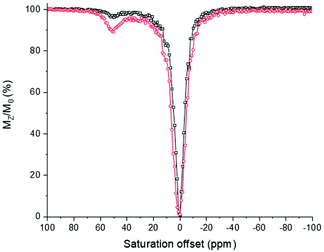
The activity of [Eu(L1)]3+ in its TEMPO form shows a weak CEST spectrum (6% in intensity, Fig. 8) as the relaxation of the water protons near the TEMPO unit is accelerated by the magnetic moment of the free electron spin of that unit.32 Upon the addition of ascorbic acid, the TEMPO unit is reduced, affording a closed-shell ligand. There is no more acceleration of the relaxation of the vicinal water protons. As a consequence, the complex [Eu(L1)]3+ in the reduced form demonstrated a significant CEST peak at +51 ppm with respect to the bulk water proton resonance. The exchangeable water molecule on the metal centre presents a larger CEST effect of 12%. The CEST effect demonstrates small pH dependence with values varying from 9% to more than 13% between pH 5 and 8. This small pH dependence demonstrates that the metal bound water molecule is little affected by pH changes. The CEST effect in [Eu(L1)]3+ is within the same range, albeit slightly weaker than that for the Eu3+ complex of the ligand depicted in Chart 1b in aqueous medium.
Calculation of the rate of exchange via Omega plot calculation and confirmation by RL QUEST plots gave a kex value of approximately 4200 s−1 for the complex [Eu(L1)]3+, which corresponds to a proton residence time of 238 μs.
Not surprisingly, both [Dy(L1)]3+ and [Yb(L1)]3+ did not show any significant activity in the PARACEST spectrum, presumably due to the faster exchange of the NH2 protons mediated by these metal ions.
Surprisingly, the PARACEST spectra for [Eu(L2)]3+ in both its TEMPO and TEMPOH forms demonstrated no CEST effect for the NH exchangeable protons. This result is in line with the distinct coordination number and conformation of the complex due to the presence of the alkyne. The present data do not yet allow for further rationalizing this behaviour. Not surprisingly, complexes [Dy(L2)]3+ and [Yb(L2)]3+ demonstrated no activity like that of the [Dy(L1)]3+ and [Yb(L1)]3+ (Fig. S18 and S20†).
2.7 Relaxometry
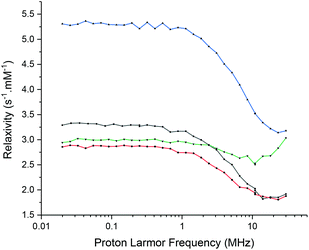
The slow electronic relaxation of the f7 GdIII ion makes this metal ion inefficient as a PARACEST agent but ensures its importance as a relaxation CA. The relaxivity r1 has been studied by Fast Field Cycling (FFC)-NMR (Fig. 9). It shows interesting behaviour. Under a high field (30 MHz), [Gd(L1)]3+ provides a T1 relaxation time of 0.26 s corresponding to an r1 of 1.92 mM−1 s−1 and [Gd(L2)]3+ yields a T1 relaxation time of 0.16 s corresponding to an r1 of 3.18 mM−1 s−1. A very small change in relaxivity was observed between the oxidised and reduced species of 2% and 4% for [Gd(L1)]3+ and [Gd(L2)]3+, respectively.Under a low field (30 kHz), [Gd(L1)]3+ provides a T1 relaxation time of 0.15 s corresponding to an r1 of 3.33 mM−1 s−1 and [Gd(L2)]3+ yields a T1 relaxation time of 0.09 s corresponding to an r1 of 5.28 mM−1 s−1. Upon reduction of nitroxide into hydroxylamine, the relaxivity decreases by 13% and 44% for [Gd(L1)]3+ and [Gd(L2)]3+, respectively.
In the high-field region, it is known that the low exchange rate of the water molecules in the first coordination sphere and fast rotational correlation time of the complex limit the relaxivity of a GdIII-based CA. Besides, in the low-field region, fast electronic relaxation limits the relaxivity under 0.1 T (3–4 MHz).13–15,47 The high relaxivity values in this region are typical of the highly symmetric GdIII complexes with long electronic relaxation times.48 Complex [Gd(L1)]3+ exhibits a higher symmetry than [Gd(L2)]3+ and consequently presents a longer electronic relaxation time, allowing the visualization of the gadolinium signal in the EPR spectrum (0.34 T). Surprisingly, [Gd(L2)]3+ in its reduced form shows similar relaxivity as [Gd(L1)]3+ under a low field but a significantly higher value under a high field. Much more research beyond the objectives of this article is yet needed to unravel the physical origins of the observed effects.14 It is worth noting that the influence of the redox status on relaxivity is weak for [Gd(L1)]3+, ranging from a 20% increase in the low field region to less than 5% in the high field region upon the oxidation of the hydroxylamine moiety. Complex [Gd(L2)]3+ shows a better response to the redox stimulus with up to 75% increase in the low field region upon the hydroxylamine to nitroxide conversion. Under the highest field, the difference in relaxivity between both complex oxidation states remains very weak.
The T1 relaxation time of the water protons is modulated by the redox state without influencing the exchange rate value as demonstrated by D. Sherry and coworkers.32 This is an interesting trend whereby the formation of a paramagnetic radical center in the vicinity of Gd3+ alters significantly the relaxation of the protons of the coordinated water. Hence, complexes [Gd(L1)]3+ and [Gd(L2)]3+ could be considered as gadolinated redox probes though their relaxivity values are still too low to envisage their use as functional MRI probes.
2.8 Biological studies
The toxicity of complexes [Ln(L1)]3+ and [Ln(L2)]3+ has been investigated by MTT assays on M21 cell lines. The range of concentration tested was 1–40 μM, with incubation times up to 72 h. The cell viability upon treatment with [Dy(L1)]3+ and [Dy(L2)]3+ is depicted in Fig. 10 (see the ESI† for the other compounds). Even after the longest incubation time, the viability of the cells treated by up to 40 μM [Ln(L1)]3+ was similar to that of the control sample without complex. Hence, all the compounds of this series show negligible cytotoxicity, which is a prerequisite for their use as imaging agents. Complexes of the [Ln(L2)]3+ series demonstrate slight toxicity above 1 μM, with invariably 60–70% of cell viability upon treatments with up to 40 μM of the compounds. The difference in toxicity is clearly inferred to the substitution of one acetamide arm by the alkyne group, but it is yet unclear why this modification has such an effect.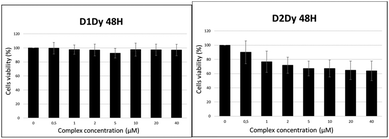 | ||
| Fig. 10 Cell viability after 48 h treatment of M21 cells with increasing amounts of (left) [Dy(L1)]3+ and (right) [Dy(L2)]3+. | ||
One possible explanation for the absence of toxicity in the [Ln(L1)]3+ series is the lack of cellular penetration, in line with the clinically approved MRI CAs that are injected into the circulating system. We quantified the cellular penetration of the representative complex [Dy(L1)]3+ by using EPR spectroscopy. The complex was incubated with M21 cells at 200 μM, which was a minimal concentration for straightforward detection. The supernatant, cell pellets and cell lysate were next analysed by EPR and the intensity of the nitroxide lines was quantified under non-saturating conditions. No signal was detected within the detection limit of EPR (<0.1% penetration) for either the cell pellets or cell lysate. The complex was found to be localized in the supernatant, as demonstrated by a similar integration of the nitroxide resonances of the supernatant and a blank containing the complex at similar concentrations in a culture medium lacking cells. Both the polar nature of the complex and its tripositive nature most likely prevent cell penetration, which may be an advantage for use as an MRI agent. It must be stressed that the alkyne moiety does not affect cell penetration, but offers a possibility for vectorising the complex by adequate functionalization.
3. Conclusions
In summary, we have prepared two series of lanthanide(III) complexes (Gd, Eu, Dy, and Yb) from two DOTA acetamide derivatives appended by one TEMPO arm. One features three acetamide groups ([Ln(L1)]3+) while the other ([Ln(L2)]3+) harbours two acetamides and one alkyne group for further functionalization or vectorization through click chemistry. By luminescence measurements, we demonstrate that both [Eu(L1)]3+ and [Eu(L2)]3+ possess one water molecule in their first coordination sphere, inferring that the metal ion is 9- or 8-coordinated, respectively. The distinct coordination polyhedron between the series is confirmed by EPR spectroscopy. The lanthanide complexes are redox-active in a physiological window, with the TEMPO being, for instance, readily reduced into hydroxylamine by sodium ascorbate. Complex [Eu(L1)]3+ is CEST-active in its hydroxylamine form (CEST effect of 12%). In its nitroxide form, the paramagnetism of the ligand accelerates spin relaxation, resulting in a significant quenching of the CEST effect. Interestingly, [Eu(L2)]3+ does not show CEST activity, which might be the consequence of the different environment and mobility of the coordinated water molecule. The relaxivity of the gadolinium complexes is affected by changes in the oxidation state of the TEMPO arm, whereby r1 decreases by about 15% at 10 MHz upon reduction. It must be stressed that the influence of the nitroxide's redox state is about 10 times greater under a low field than under a high field.Finally, the complexes show only weak or no toxicity at all at concentrations up to 40 μM against M21 cells, which is inferred to disfavoured cellular penetration. These results demonstrate that the original concept of redox-active lanthanide complexes has large potentialities for biological imaging (CEST, MRI). Further works are currently in progress in our laboratory to increase the CEST effect and incorporate sensitizing units for bimodal magnetic/optical imaging.
4. Experimental section
4.1 Materials and methods
All chemicals were of reagent grade and were used without purification. The high resolution mass spectra were recorded using a Waters Xevo G2-S QTof apparatus. The UV/Vis spectra were recorded using a Cary Varian 50 spectrophotometer. NMR spectra were recorded using a Bruker AM 400 (1H at 400 MHz) spectrometer. Chemical shifts are quoted relative to tetramethylsilane (TMS). The X-band EPR spectra were recorded using a Bruker EMX Plus spectrometer equipped with a Bruker Helium flow cryostat and a dual mode cavity. The relaxivity values r1 were derived from the experimental longitudinal relaxation times T1 of the water protons.14 The T1 values were measured from 20 kHz to 30 MHz using a commercial Spinmaster FFC 2000 Stelar relaxometer49,50 (Stelar s.r.l., Mede PV, Italy). The prepolarized (PP) and non-polarized (NP) sequences (see Fig. 1 of ref. 49) were used below and above about 12 MHz, respectively. A high polarization field Bpol corresponding to a proton resonance frequency of 28 MHz was employed in the PP experiments. For each magnetic field, r1 was calculated according to the formula r1 = (R1 − R10)/[complex], where R1 is the relaxation rate measured in the presence of the complex, R10 the relaxation rate measured in the absence of complex (typically 0.4 s−1). The complex concentration is expressed in mM. Cyclic voltammetry curves as well as differential pulse voltammetry curves were recorded using a CHI 620 potentiostat. The measurements were performed in 0.5 mM CH3CN solution containing 0.1 M tetra-n-butyl ammonium perchlorate (TBAP) as the supporting electrolyte. The experiments were performed in a standard three-electrode cell under an argon atmosphere. A glassy carbon disc electrode (3 mm diameter) that was polished with 1 mm diamond paste was used as the working electrode. The auxiliary electrode is a compartmentalized platinum wire, while an Ag/AgNO3 0.01 M electrode was used as a reference.The luminescence spectra of the lanthanide complexes were recorded using a modular Fluorolog FL3-22 spectrometer Horiba-Jobin Yvon-Spex equipped with a double grating excitation monochromator and an iHR320 imaging spectrometer. Hamamatsu R928P and Hamamatsu R5509 photomultipliers were used for visible and NIR measurements, respectively. All spectra were corrected for the detection and optical spectral responses (instrumental functions) of the spectrofluorimeters. Quartz capillaries of diameter 4 mm were used. For the acquisition of the excitation and emission spectra in the NIR, a long pass coloured filter was always used at 870 nm to block the signals of the 2nd harmonics. The q value was determined by using the formula q = 1.2 [Δkobs − 0.25 − 0.075qCONHR],51 which gives for the [Ln(L1)]3+ series q = 1.2 [Δkobs − 0.55] and for the [Ln(L2)]3+ series q = 1.2 [Δkobs − 0.48].
4.2 Synthesis
4-Amino-2,2,6,6-tetramethylpiperidine-1-oxyl, free radical was purchased from Sigma-Aldrich; 1,4,7,10-tetraazacyclododecane-1,7-bisacetamide (2) was synthesized according to literature procedures.524.3 X-ray diffraction
Single crystals were coated with perfluoropolyether, picked up with nylon loops and mounted in the nitrogen cold stream of the diffractometer. Mo-Kα radiation (λ = 0.71073 Å) from a Mo-target rotating-anode X-ray source equipped with INCOATEC Helios mirror optics was used. Final cell constants were obtained from least squares fits of several thousand strong reflections. Intensity data were corrected for absorption using the intensities of redundant reflections with the SADABS program. The structures were solved by Patterson methods and subsequent difference Fourier techniques. The OLEX software was used for the refinement.53 All non-hydrogen atoms were anisotropically refined and hydrogen atoms were placed at calculated positions and refined as riding atoms with isotropic displacement parameters. CCDC 1997062† contains the crystallographic data for [Na(L2)]+(Cl−).4.4 DFT calculations
Full geometric optimizations were performed with the Gaussian 9.0 program.54 The B3LYP functional55,56 was used together with the 6-31g* basis set for the C, H, and N atoms57 and a pseudopotential (LanL2DZ)58 was used for the central metal ion. Frequency calculations were systematically performed on the optimized structures in order to ensure that they correspond to a real energy minimum and not a saddle point. The relaxed potential energy surface scans were performed by varying dihedral angles.4.5 Cell culture
Human melanoma cell line M21 was purchased from ATCC (Molshein, France). Cells were cultured in a DMEM medium supplemented with 10% (v/v) fetal calf serum (FCS) and 2 mM glutamine (Thermo Fisher Scientific, Courtaboeuf, France). The cells were maintained at 37 °C in a 5% CO2− humidified atmosphere and tested to ensure freedom from mycoplasma contamination. All cell lines were used within 5–50 passages of thawing the original stocks.4.6 MTT assay
M21 cells were seeded into 96-well plates (1.5 × 10³ cells per well) with 100 μl of culture medium. After 24 h, the cells were treated with the lanthanide(III) complexes at various concentrations. Following incubation for 24 h, 48 h or 72 h, 10 μl of an MTT (3-(4,5-dimethylthiazol-2-yl)-2,5-diphenyltetrazolium bromide) stock solution (Euromedex, Mundolsheim, France) in PBS at 5 mg ml−1 was added to each well and the plates were incubated at 37 °C for 2 h. To solubilize water-insoluble purple formazan crystals, SDS 10%/HCl 0.1% solution was used. After 24 h, absorbance was measured using an ELISA reader (Tecan, Männedorf, Switzerland) at a test wavelength of 570 nm and a reference wavelength of 650 nm.4.7 EPR spectroscopy
M21 cells were seeded in 4-well plates (1 × 10⁵ cells per well) in 1 mL of culture medium. After 24 h, the cells were treated with the complexes of concentration 200 μM for 5 min, 10 min, 30 min, and 1 h. The cell culture medium was recovered and the M21 cells were harvested. A fraction of M21 pellets was then washed twice in cold PBS and incubated in lysis buffer (10 mmol L−1 Tris-HCl pH 7.5, 120 mmol L−1 NaCl, 1 mmol L−1 EDTA, 1 mmol L−1 dithiothreitol, 0.5% Nonidet P-40, 0.05% sodium dodecyl sulfate, and supplementation with protease inhibitors (Na3VO4 and NaF). After 10 min on ice, the lysates were centrifugated at 20![[thin space (1/6-em)]](https://www.rsc.org/images/entities/char_2009.gif) 000g for 15 minutes and the soluble fraction was recovered. The cell culture medium, pellets of intact M21 cells and M21 cell lysates were then analyzed by EPR spectroscopy.
000g for 15 minutes and the soluble fraction was recovered. The cell culture medium, pellets of intact M21 cells and M21 cell lysates were then analyzed by EPR spectroscopy.
Conflicts of interest
There are no conflicts to declare.Acknowledgements
The authors thank the French National Research Agency in the framework of the “Investissements d'avenir” program (ANR-15-IDEX-02), Labex ARCANE and CBH-EUR-GS (ANR-17-EURE-0003) and the French National Agency for Research, program Co-Lantha (ANR-17-CE07-0034) for financial support. This work was performed under the auspices of the COST Action AC15209, EURELAX. The authors are grateful to Dr Pierre Girard for technical assistance for the DFT calculations and the Centre de Calcul Intensif en Chimie de Grenoble (CECIC) for providing the computational resources. The ICMG Platform (FR 2607) is acknowledged for the analytical support.Notes and references
- G. Maulucci, G. Bačić, L. Bridal, B. Tavitian, T. Viel, H. Utsumi, A. S. Yalçın and M. De Spirito, Antioxid. Redox Signal., 2016, 24, 939–958 CrossRef CAS PubMed.
- E. Terreno, D. D. Castelli, A. Viale and S. Aime, Chem. Rev., 2010, 110, 3019–3042 CrossRef CAS PubMed.
- C. Jacob, M. Doering and T. Burkholz, in Redox Signaling and Regulation in Biology and Medicine, ed. C. Jacob and P. G. Winyard, Wiley-VCH, Weinheim, Germany, 2009, pp. 63–122 Search PubMed.
- F. Q. Schafer and G. R. Buettner, Free Radical Biol. Med., 2001, 30, 1191–1212 CrossRef CAS PubMed.
- B. D'Autréaux and M. B. Toledano, Nat. Rev. Mol. Cell Biol., 2007, 8, 813–824 CrossRef PubMed.
- T. R. Hurd and M. P. Murphy, in Redox Signaling and Regulation in Biology and Medicine, ed. C. Jacob and P. G. Winyard, Wiley-VCH, Weinheim, Germany, 2009, pp. 13–43 Search PubMed.
- G. Csányi and F. J. Miller Jr., Int. J. Mol. Sci., 2014, 15, 6002–6008 CrossRef PubMed.
- H. Abe, H. Semba and N. Takeda, J. Atheroscler. Thromb., 2017, 24, 884–894 CrossRef CAS PubMed.
- D. M. Gilkes, G. L. Semenza and D. Wirtz, Nat. Rev. Cancer, 2014, 14, 430 CrossRef CAS.
- R. Bakalova, Z. Zhelev, I. Aoki and T. Saga, Clin. Cancer Res., 2013, 19, 2503–2517 CrossRef CAS PubMed.
- F. Zhang, R. Zhong, H. Qi, S. Li, C. Cheng, X. Liu, Y. Liu and W. Le, Front. Neurosci., 2018, 12, 314 CrossRef PubMed.
- L. Helm, J. R. Morrow, C. J. Bond, F. Carniato, M. Botta, M. Braun, Z. Baranyai, R. Pujales-Paradela, M. Regueiro-Figueroa, D. Esteban-Gómez, C. Platas-Iglesias and T. J. Scholl, in Contrast Agents for MRI: Experimental Methods, The Royal Society of Chemistry, 2018, pp. 121–242. 10.1039/9781788010146-00121.
- E. Belorizky, P. H. Fries, L. Helm, J. Kowalewski, D. Kruk, R. R. Sharp and P.-O. Westlund, J. Chem. Phys., 2008, 128, 052315 CrossRef PubMed.
- C. S. Bonnet, P. H. Fries, A. Gadelle, S. Gambarelli and P. Delangle, J. Am. Chem. Soc., 2008, 130, 10401–10413 CrossRef CAS PubMed.
- C. S. Bonnet, P. H. Fries, S. Crouzy and P. Delangle, J. Phys. Chem. B, 2010, 114, 8770–8781 CrossRef CAS PubMed.
- Q. N. Do, J. S. Ratnakar, Z. Kovács and A. D. Sherry, ChemMedChem, 2014, 9, 1116–1129 CrossRef CAS PubMed.
- S. M. Pinto, V. Tomé, M. J. F. Calvete, M. M. C. A. Castro, É. Tóth and C. F. G. C. Geraldes, Coord. Chem. Rev., 2019, 390, 1–31 CrossRef CAS.
- C. Tu and A. Y. Louie, Chem. Commun., 2007, 1331–1333, 10.1039/B616991K.
- C. Tu, E. A. Osborne and A. Y. Louie, Tetrahedron, 2009, 65, 1241–1246 CrossRef CAS.
- C. Tu, R. Nagao and A. Y. Louie, Angew. Chem., Int. Ed., 2009, 48, 6547–6551 CrossRef CAS PubMed.
- C. Carrera, G. Digilio, S. Baroni, D. Burgio, S. Consol, F. Fedeli, D. Longo, A. Mortillaro and S. Aime, Dalton Trans., 2007, 4980–4987, 10.1039/B705088G.
- G. Digilio, V. Menchise, E. Gianolio, V. Catanzaro, C. Carrera, R. Napolitano, F. Fedeli and S. Aime, J. Med. Chem., 2010, 53, 4877–4890 CrossRef CAS PubMed.
- N. Raghunand, G. P. Guntle, V. Gokhale, G. S. Nichol, E. A. Mash and B. Jagadish, J. Med. Chem., 2010, 53, 6747–6757 CrossRef CAS PubMed.
- N.-D. H. Gamage, Y. Mei, J. Garcia and M. J. Allen, Angew. Chem., Int. Ed., 2010, 49, 8923–8925 CrossRef CAS PubMed.
- J. Garcia, J. Neelavalli, E. M. Haacke and M. J. Allen, Chem. Commun., 2011, 47, 12858–12860 RSC.
- J. Garcia, A. N. W. Kuda-Wedagedara and M. J. Allen, Eur. J. Inorg. Chem., 2012, 2012, 2135–2140 CrossRef CAS PubMed.
- L. Burai, É. Tóth, S. Seibig, R. Scopelliti and A. E. Merbach, Chem. – Eur. J., 2000, 6, 3761–3770 CrossRef CAS PubMed.
- M. Woods, A. Pasha, P. Zhao, G. Tircso, S. Chowdhury, G. Kiefer, D. E. Woessner and A. D. Sherry, Dalton Trans., 2011, 40, 6759–6764 RSC.
- S. Zhang, M. Merritt, D. E. Woessner, R. E. Lenkinski and A. D. Sherry, Acc. Chem. Res., 2003, 36, 783–790 CrossRef CAS PubMed.
- S. J. Ratnakar, M. Woods, A. J. M. Lubag, Z. Kovács and A. D. Sherry, J. Am. Chem. Soc., 2008, 130, 6–7 CrossRef CAS PubMed.
- S. J. Ratnakar, S. Viswanathan, Z. Kovacs, A. K. Jindal, K. N. Green and A. D. Sherry, J. Am. Chem. Soc., 2012, 134, 5798–5800 CrossRef CAS PubMed.
- S. J. Ratnakar, T. C. Soesbe, L. L. Lumata, Q. N. Do, S. Viswanathan, C.-Y. Lin, A. D. Sherry and Z. Kovacs, J. Am. Chem. Soc., 2013, 135, 14904–14907 CrossRef CAS PubMed.
- A. M. Funk, V. Clavijo Jordan, A. D. Sherry, S. J. Ratnakar and Z. Kovacs, Angew. Chem., Int. Ed., 2016, 55, 5024–5027 CrossRef CAS.
- J. Molloy, K. O. Jarjayes, C. Philouze, L. Fedele, D. Imbert and F. Thomas, Chem. Commun., 2017, 53, 605–608 RSC.
- J. K. Molloy, L. Fedele, O. Jarjayes, C. Philouze, D. Imbert and F. Thomas, Inorg. Chim. Acta, 2018, 483, 609–617 CrossRef CAS.
- J. K. Molloy, C. Philouze, L. Fedele, D. Imbert, O. Jarjayes and F. Thomas, Dalton Trans., 2018, 47, 10742–10751 RSC.
- R. Barré, D. Mouchel dit Leguerrier, L. Fedele, D. Imbert, J. K. Molloy and F. Thomas, Chem. Commun., 2020, 56, 435–438 RSC.
- Z. Zhelev, V. Gadjeva, I. Aoki, R. Bakalova and T. Saga, Mol. Biosyst., 2012, 8, 2733–2740 RSC.
- V. V. Pavlishchuk and A. W. Addison, Inorg. Chim. Acta, 2000, 298, 97–102 CrossRef CAS.
- J. E. Nutting, M. Rafiee and S. S. Stahl, Chem. Rev., 2018, 118, 4834–4885 CrossRef CAS.
- M. Shibuya, F. Pichierri, M. Tomizawa, S. Nagasawa, I. Suzuki and Y. Iwabuchi, Tetrahedron Lett., 2012, 53, 2070–2073 CrossRef CAS.
- Y. Kato, Y. Shimizu, L. Yijing, K. Unoura, H. Utsumi and T. Ogata, Electrochim. Acta, 1995, 40, 2799–2802 CrossRef CAS.
- The difference in molar absortivity was not due to the distinct oxidation state or purity of the samples, as demonstrated by a similar intensity in the EPR resonances for both L1 and L2.
- L. J. Libertini and O. H. Griffith, J. Chem. Phys., 1970, 53, 1359–1367 CrossRef.
- F. Thomas, J. Michon and J. Lhomme, Biochemistry, 1999, 38, 1930–1937 CrossRef CAS PubMed.
- O. A. Blackburn, N. F. Chilton, K. Keller, C. E. Tait, W. K. Myers, E. J. L. McInnes, A. M. Kenwright, P. D. Beer, C. R. Timmel and S. Faulkner, Angew. Chem., Int. Ed., 2015, 54, 10783–10786 CrossRef CAS PubMed.
- J. Wahsner, E. M. Gale, A. Rodríguez-Rodríguez and P. Caravan, Chem. Rev., 2019, 119, 957–1057 CrossRef CAS PubMed.
- S. Aime, A. Barge, J. I. Bruce, M. Botta, J. A. K. Howard, J. M. Moloney, D. Parker, A. S. de Sousa and M. Woods, J. Am. Chem. Soc., 1999, 121, 5762–5771 CrossRef CAS.
- P. H. Fries, G. Ferrante, E. Belorizky and S. Rast, J. Chem. Phys., 2003, 119, 8636–8644 CrossRef CAS.
- G. Ferrante and S. Sykora, Adv. Inorg. Chem., 2005, 57, 405–470 CrossRef CAS.
- A. Beeby, I. M. Clarkson, R. S. Dickins, S. Faulkner, D. Parker, L. Royle, A. S. de Sousa, J. A. Gareth Williams and M. Woods, J. Chem. Soc., Perkin Trans. 2, 1999, 493–504, 10.1039/A808692C.
- F. Oukhatar, M. Beyler and R. Tripier, Tetrahedron, 2015, 71, 3857–3862 CrossRef CAS.
- O. V. Dolomanov, L. J. Bourhis, R. J. Gildea, J. A. K. Howard and H. Puschmann, J. Appl. Crystallogr., 2009, 42, 339–340 CrossRef CAS.
- M. J. Frisch, G. W. Trucks, H. B. Schlegel, G. E. Scuseria, M. A. Robb, J. R. Cheeseman, G. Scalmani, V. Barone, B. Mennucci, G. A. Petersson, H. Nakatsuji, M. Caricato, X. Li, H. P. Hratchian, A. F. Izmaylov, J. Bloino, G. Zheng, J. L. Sonnenberg, M. Hada, M. Ehara, K. Toyota, R. Fukuda, J. Hasegawa, M. Ishida, T. Nakajima, Y. Honda, O. Kitao, H. Nakai, T. Vreven, J. J. A. Montgomery, J. E. Peralta, F. Ogliaro, M. Bearpark, J. J. Heyd, E. Brothers, K. N. Kudin, V. N. Staroverov, R. Kobayashi, J. Normand, K. Raghavachari, A. Rendell, J. C. Burant, S. S. Iyengar, J. Tomasi, M. Cossi, N. Rega, J. M. Millam, M. Klene, J. E. Knox, J. B. Cross, V. Bakken, C. Adamo, J. Jaramillo, R. Gomperts, R. E. Stratmann, O. Yazyev, A. J. Austin, R. Cammi, C. Pomelli, J. W. Ochterski, R. L. Martin, K. Morokuma, V. G. Zakrzewski, G. A. Voth, P. Salvador, J. J. Dannenberg, S. Dapprich, A. D. Daniels, Ö. Farkas, J. B. Foresman, J. V. Ortiz, J. Cioslowski and D. J. Fox, Gaussian 09, Revision D.01, Gaussian, Inc., Wallingford CT, 2009 Search PubMed.
- C. Lee, W. Yang and R. G. Parr, Phys. Rev. B: Condens. Matter Mater. Phys., 1988, 37, 785–789 CrossRef CAS PubMed.
- A. D. Becke, J. Chem. Phys., 1993, 98, 5648–5652 CrossRef CAS.
- G. A. Petersson and M. A. Al-Laham, J. Chem. Phys., 1991, 94, 6081–6090 CrossRef CAS.
- P. J. Hay and W. R. Wadt, J. Chem. Phys., 1985, 82, 299–310 CrossRef CAS.
Footnote |
| † Electronic supplementary information (ESI) available. CCDC 1997062. For ESI and crystallographic data in CIF or other electronic format see DOI: 10.1039/d1dt01628h |
| This journal is © The Royal Society of Chemistry 2021 |

