 Open Access Article
Creative Commons Attribution 3.0 Unported Licence
Layered terbium hydroxides for simultaneous drug delivery and imaging†
Margarita
Strimaite
 a,
Clarissa L. G.
Harman
 a,
Huan
Duan
a,
Yuwei
Wang
ab,
Gemma-Louise
Davies
a,
Huan
Duan
a,
Yuwei
Wang
ab,
Gemma-Louise
Davies
 c and
Gareth R.
Williams
 *a
*a
aUCL School of Pharmacy, University College London, 29-39 Brunswick Square, London, WC1N 1AX, UK. E-mail: g.williams@ucl.ac.uk; Tel: +44207 753 5863
bState Key Laboratory of Chemical Resource Engineering, Beijing University of Chemical Technology, P.O. Box 98, Beijing, 100029, PR China
cDepartment of Chemistry, University College London, 20 Gordon St, Bloomsbury, London, WC1H 0AJ, UK
First published on 6th July 2021
Abstract
Layered rare-earth hydroxides have begun to gather increasing attention as potential theranostic platforms owing to their extensive intercalation chemistry combined with magnetic and fluorescent properties. In this work, the potential of layered terbium hydroxide (LTbH) as a platform for simultaneous drug delivery and fluorescence imaging was evaluated. LTbH-Cl ([Tb2(OH)5]Cl·yH2O) was loaded with three nonsteroidal anti-inflammatory drugs (diclofenac, ibuprofen, and naproxen) via ion-exchange. Drug release studies in phosphate buffered saline (pH = 7.4) revealed all three formulations release their drug cargo rapidly over the course of approximately 5 hours. In addition, solid state fluorescence studies indicated that fluorescence intensity is strongly dependent on the identity of the guest anion. It was postulated that this feature may be used to track the extent of drug release from the formulation, which was subsequently successfully demonstrated for the ibuprofen loaded LTbH. Overall, LTbH exhibits good biocompatibility, high drug loading, and a strong, guest-dependent fluorescence signal, all of which are desirable qualities for theranostic applications.
Introduction
Development of theranostic platforms requires multifunctional materials, able to execute tasks such as carrying drug cargo and acting as contrast, photothermal or photodynamic agents. The use of inorganic systems to achieve this goal exploits the magnetic and fluorescence properties inherent to the metals used and can substantially simplify the synthetic process and performance outcomes compared to organic counterparts. For example, inorganic systems can exhibit strong magnetic resonance imaging (MRI) contrast simply by inclusion of paramagnetic iron(II/III) or gadolinium(III) species, and the addition of a drug moiety can often be performed in a ‘one-pot’ manner during synthesis.1–3 On the other hand, fully organic MRI theranostics (particularly those based on paramagnetic nitroxide), have historically been beset by poor relaxivity and short circulation times that have so far limited their use in clinical settings.4 More recently, macromolecular polymer formulations conjugated to paramagnetic nitroxide have shown greatly improved performance comparable to commercially available gadolinium based contrast agents,5,6 though this enhancement in performance requires a significantly more involved, multi-step, synthetic procedure.Materials which possess a layered internal structure are particularly attractive as candidates for theranostic platforms due to their versatility. In some cases, the basal spacing between the layers can vary widely depending on the size of the guest7 which allows a variety of species, such as drugs, to be intercalated. Intercalation of drugs into a layered material can be achieved by several routes – most commonly by ion exchange (diffusion of drug ions from solution into the interlayer space)8–11 and co-precipitation (synthesis in the presence of neutral or ionic drug species),12–15 but also reconstruction (calcination and reaction with drug solution),16,17 and exfoliation-reassembly (separation of layered material into sheets, and reassembly in drug solution).18,19 There exist many layered systems which are comprised of negatively charged layers and are therefore cation-exchangeable, for example metal oxides,20 metal phosphates,21 and aluminophosphates.22,23 However, layered systems which are able to undergo anion exchange are fewer in number.
The most widely studied anion-exchangeable class of layered materials are the layered double hydroxides (LDHs). They consist of positively charged mixed-metal hydroxide sheets built up from edge-sharing octahedra. Research into the medical applications of LDHs has been fairly extensive, and they are well known to be highly biocompatible.24–26 Reported intercalates of LDHs include a variety of therapeutic guest species, most notably anti-cancer drugs,27–30 but also antimicrobials,31–33 vitamins,34,35 and nonsteroidal anti-inflammatory drugs.36–38 Their ion-exchange properties have also made LDHs attractive for non-medical applications such as heterogeneous catalysis,39,40 removal of pollutants from water and waste,41–44 and as materials for supercapacitor electrodes.45,46
Another class of anion-exchangeable layered materials are the layered rare-earth hydroxides (LRHs). LRHs have the general formula [R2(OH)6−m](Am/nn−)·yH2O, where R is a rare-earth metal ion and A is an intercalated counterion. Structurally, LRHs are similar to LDHs but the component sheets are more complicated because the rare-earth metal ions form two distinct coordination polyhedra, with 8 and 9 vertices.47 The ability of LRHs to exhibit magnetic and fluorescent properties arising from the rare-earth metal ions they contain has fostered increasing interest in their applications in medical imaging,48,49 as optical sensors,50–53 and as tuneable phosphors.54,55 In addition, like LDHs, their layered structure also allows LRHs to be used in conventional applications such as sequestration and catalysis.56–59 The versatility of features that LRHs can exhibit makes them especially attractive as theranostic agents.
A promising theranostic platform based on layered gadolinium hydroxide (LGdH-Cl, [Gd2(OH)5]Cl·yH2O) has been reported previously by our group.2 A mixture of nano and microparticles of the material was synthesised from a gadolinium chloride salt via hydrothermal synthesis. Through several methods, including ion exchange and co-precipitation, it was shown that drug ion intercalation into LGdH was facile using diclofenac, ibuprofen, and naproxen as model drugs. The drug-particle composites were shown to be unstable in acidic media, releasing toxic Gd3+ ions, but stable in neutral media and thus potentially suitable for oral delivery with an enteric coating. In terms of MRI performance, LGdH and all of the drug intercalate compounds were shown to be able to act as negative contrast agents (reducing T2 MRI signal intensity). In addition, the materials were shown to be cytocompatible.
Other investigations into the use of LRH intercalates for diagnostic and drug delivery applications have so far been limited. LGdH and LDyH have been previously successfully intercalated with several amino acids and the antibiotic nalidixic acid,60 but further performance assessments were not conducted. LGdH has also been intercalated with microRNA and shown to exhibit strong magnetic resonance contrast as well as intracellular therapeutic agent delivery in a breast cancer cell line.61
Gu et al. reported that a mixed metal LRH (LGd0.95Eu0.05H) intercalated with amino acids showed a reduction in Ln3+ fluorescence signal intensity, which the researchers suggested may be useful for diagnostic sensing uses.62 Further work by this group developed LEuH intercalated with naproxen (nap), and LTbH intercalated with aspirin, diclofenac, and indomethacin (asa, dic, and imc).63–65 It was demonstrated that LEuH-nap and the LTbH-drug intercalates have high biocompatibility (>80%) in multiple human cancer cell lines at concentrations up to 100 μg ml−1. The majority of drug was released from LEuH-nap and LTbH-asa in the first 3 hours,63,64 whereas LTbH-dic and LTbH-imc showed sustained release over 25 h.65 It was found also that LEuH and LTbH showed vastly increased luminescence intensities after intercalation with nap and asa respectively, owing to efficient energy transfer between the host and guest species.63,64
Most recently, polymer composites of LRHs derived from Eu and Tb were investigated for their application in a 3D printed skin-like motion sensor.66 It was found that that, by varying the molar content of Eu and Tb, the fluorescence emission colour of the resultant 3D printed hydrogels can be adjusted to be red, yellow, or green.66 This high degree of fluorescence tunability provides a simple route to adjust the fluorescence properties of LRHs for different applications, for example to avoid overlap with autofluorescence in tissues.
The work described in this paper considers the layered terbium hydroxide (LTbH-Cl, [Tb2(OH)5]Cl·yH2O, Fig. 1a) as a potential theranostic platform. The anti-inflammatory drugs diclofenac (dic), ibuprofen (ibu), and naproxen (nap, Fig. 1b) are intercalated into LTbH-Cl via ion exchange to form LTbH-dic, LTbH-ibu, and LTbH-nap respectively. These intercalation compounds are characterised and their performance in terms of drug release, fluorescence, and biocompatibility is investigated.
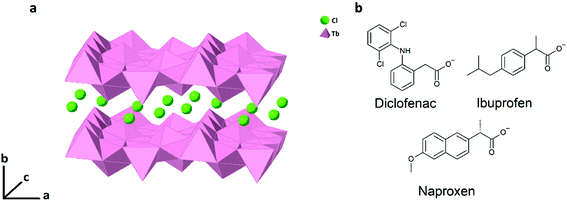 | ||
| Fig. 1 (a) A schematic diagram showing the lamellar structure of LTbH with intercalated Cl− anions. (b) The chemical structures of the anions of diclofenac, ibuprofen, and naproxen. | ||
Experimental
Materials
Terbium chloride hexahydrate and ibuprofen sodium were purchased from Sigma Aldrich. Diclofenac sodium was sourced from Cambridge Bioscience, and naproxen sodium from Fisher Scientific UK. All water used was deionised, and ethanol was of analytical grade.Hydrothermal synthesis of layered terbium hydroxide (LTbH-Cl)
An aqueous solution of TbCl3·6H2O (0.4 M, 15 ml) was added dropwise to a stirring aqueous solution of NaCl/NaOH (1.4 M and 2.1 M respectively, 5 ml). The resultant suspension was stirred for 10 min, and transferred to a Teflon lined hydrothermal reactor (23 ml). The reactor was heated to 150 °C for 15 h, at a heating and cooling rate of 10 °C min−1, after which the white precipitate was collected by centrifugation. The product was washed with water (2 × 30 ml) and ethanol (2 × 30 ml), and subsequently dried at 60 °C for 24 h to yield the product, [Tb2(OH)5]Cl·yH2O (LTbH-Cl).Ion exchange reactions
LTbH-Cl (150 mg) was dispersed in water (15 ml), and the drug of interest was added to this solution in a three-fold molar excess (223 mg for ibuprofen sodium, 310 mg for diclofenac sodium, and 246 mg for naproxen sodium. The mixture was heated at 60 °C for 24 h, with stirring. The product was collected by centrifugation, washed with water (2 × 30 ml) and ethanol (2 × 30 ml), and subsequently dried at 60 °C for 24 h.As diclofenac is poorly soluble in water, the intercalation mixtures contained a large amount of undissolved drug. However, it is highly soluble in ethanol and any remaining undissolved drug was removed in the washing step. The poor drug solubility during intercalation did not affect final drug loading.
Characterisation
Cell viability assessments were conducted using the CellTiter-Glo™ assay, in white 96-well plates (Corning). Cell suspension was prepared at a concentration of 5.6 × 10⁴ cells per ml, and deposited into the wells of the plate (180 μl each). To measure the cytotoxicity of the LTbH-drug intercalates, suspensions of LTbH-X (X = Cl, dic, ibu, nap) in culture medium (10 mg ml−1) were prepared, and either 5 or 10 μl of these suspensions was added directly to the cells. To measure the cytotoxicity of the pure drug counterparts, solutions of each drug in culture medium (3 mg ml−1, approximately equivalent to the amount present in the LTbH-X suspensions assuming a 30% drug loading) were prepared, and either 5 or 10 μl of these suspensions were added directly to the cells. For background luminescence measurements, wells were prepared using only cell culture medium in place of cell suspension. For control cell luminescence measurements, wells were prepared by using cell culture medium in place of LTbH-X suspensions. The plates were then incubated at 37 °C for 24 h. After incubation, CellTiter-Glo™ 2.0 assay reagent (100 μl, Promega) was added to each well, and left to react at room temperature for 30 min. The luminescence of the plates was read over the range 250–850 nm using a SpectraMax M2e microplate reader. Cell viability for each well was calculated according to eqn (1).
 | (1) |
Three independent experiments were performed, each with treatment conditions in triplicate, and results presented as mean ± standard deviation.
Haemolysis assessments were conducted in clear 96-well plates (Corning). The RBC suspension was deposited into the wells of the plate (180 μl each). To measure the haemolytic activity of the LTbH-drug intercalates, suspensions of LTbH-X (X = Cl, dic, ibu, nap) in DPBS (10 mg ml−1) were prepared, and either 5 or 10 μl of these suspensions was added directly to the cells. For negative control haemolysis measurements, wells were prepared by using DPBS in place of LTbH-X suspensions. For a positive control, wells were prepared by using a solution of Triton-X in DPBS (10% v/v) in place of LTbH-X suspensions. The plates were then incubated at 37 °C for 1 h. After incubation, the microplates were centrifuged, and 100 μl of the supernatant from each well was transferred to a clean microplate. The absorbance of the plates at 540 nm was read using a SpectraMax M2e microplate reader. Extent of haemolysis for each well was calculated according to eqn (2).
 | (2) |
Three independent experiments were performed, each in triplicate, and results are presented as mean ± standard deviation.
After time intervals of 2 h and 24 h, samples of the supernatant (50 μl) were collected and were deposited into a clear 96-well plate. To each well AS-3 solution (50 μl) and distilled water (200 μl) were added. 50 μl of the resulting solution was then transferred to another plate, and diluted further by adding distilled water (200 μl). Background absorbance wells were prepared with distilled water in place of sample solution. Absorbance at 652 nm was read using a SpectraMax M2e microplate reader. The measured absorbance values were first corrected by subtracting the average background absorbance, and subsequently converted to concentration of Tb3+ ions using the calibration curve. Finally, the extent of dissolution for each sample was calculated as follows eqn (3):
 | (3) |
The concentration [Tb3+ max] is the maximum possible concentration of Tb3+ ions if 5 mg of LTbH-Cl was completely dissolved in 10 ml of water. In this case, this value was calculated based on the formula [Tb2(OH)5]Cl0.9(CO3)0.05·1.5H2O with a molecular mass of 464.82 g mol−1, which gives [Tb3+ max] = 2.1514 mM. Three independent experiments were performed, each in triplicate, and results are given as mean ± standard deviation.
In order to investigate the effect of pH on the performance of the AS-3 assay, supernatant from the suspensions of LTbH-Cl at pH 1.5 and pH 7.4 was removed after 24 hours of incubation. This supernatant was reacted with AS-3 and diluted as described above. Negative control solutions (unbound AS-3) were prepared with distilled water in place of sample supernatant. Positive control solutions (bound AS-3) were prepared with an aqueous solution of TbCl3·6H2O in place of sample supernatant. Absorbance was then recorded over the wavelength range 400–800 nm.
To assess the effect of pH change on the absorbance at 652 nm specifically, a single-point experiment was performed in which solutions of TbCl3·6H2O (1.25 mM) in water at the appropriate pH were reacted with AS-3 and diluted as described above. The absorbance of each sample was then measured at 652 nm. Three independent experiments were performed, each in triplicate, and results are given as mean ± standard deviation.
Truncated drug release experiments were preformed using LTbH-ibu in groups of four samples per experiment. Each sample was set up as described above, and designated to be terminated at one of the following time points: 15, 30, 60, or 270 minutes. The LTbH-ibu suspension was taken from the dialysis bag at the required time, and the supernatant of the suspension was removed immediately by centrifugation. The remaining solids were dried in an oven at 60 °C for 24 h, and subsequently analysed by solid state photoluminescence. Three independent experiments were performed.
In order to determine the extent of drug release for the truncated drug release experiments, emission spectra were first normalised to the intensity at 542 nm (arising from the 5D4 → 7F5 electronic transition in Tb3+). The intensity of each spectrum at 512 nm (a wavelength chosen because it shows a marked change in intensity before and after intercalation of ibuprofen) was then used to calculate the release percentage according to eqn (4):
 | (4) |
The negative control is the intensity (at 512 nm) of LTbH-Cl (which represents a theoretical cumulative release of 100%), and the positive control is the intensity (at 512 nm) of LTbH-ibu (which represents a theoretical cumulative release of 0%).
Results and discussion
SEM
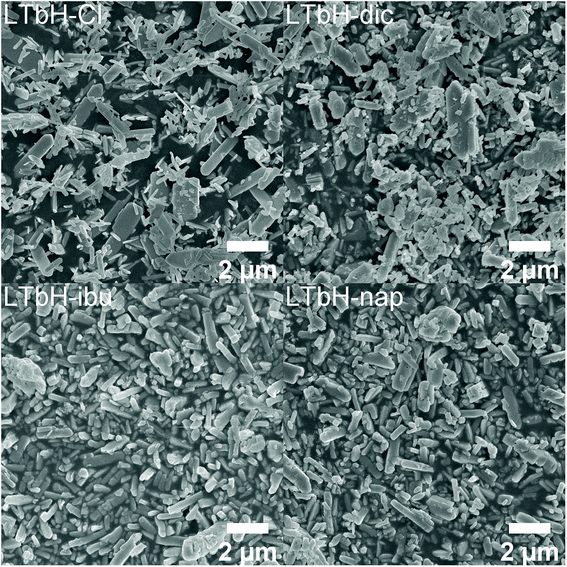
SEM images of LTbH-Cl and LTbH-drug intercalate particles are shown in Fig. 2. In all formulations, the particles exhibit rod and plate shaped morphologies, with individual particle size ranging from around 100 nm up to 4.5 μm (Fig. 2, Table 1). The average particle size measured for LTbH-Cl was 670 ± 564 nm. It can be seen that the morphology becomes less regular after intercalation. The particle sizes are similar to those previously reported for LGdH-Cl prepared using an identical synthetic protocol (which had sizes 100 nm–2 μm).2| Sample | Size from SEM (nm) | Intensity distribution size from DLS (nm) | Polydispersity index | Zeta potential (mV) |
|---|---|---|---|---|
| LTbH-Cl | 670 ± 564 | 754 ± 58 | 0.38 ± 0.08 | +28.7 ± 0.2 |
| LTbH-dic | 614 ± 480 | 903 ± 78 | 0.41 ± 0.07 | +8.0 ± 0.4 |
| LTbH-ibu | 753 ± 474 | 858 ± 66 | 0.45 ± 0.05 | +36.4 ± 0.4 |
| LTbH-nap | 730 ± 526 | 819 ± 40 | 0.49 ± 0.06 | +31.6 ± 0.4 |
The particles were seen to aggregate to some extent in all formulations, but this was particularly evident for LTbH-ibu and LTbH-nap, with aggregates as large as 15 μm (ESI, Fig. S1†). Statistical analysis indicated that there is no significant difference in the particle size before and after drug intercalation, except in the case of LTbH-ibu where average particle size appears to increase relative to LTbH-Cl. This is in contrast to what was reported for LGdH-Cl and its intercalation compounds, which were found to have decreased particle size after ion exchange.2 However, this difference is most likely to be a result of particle aggregation, which increases the average size of the particles seen in SEM images, rather than a true increase in the primary particle size.
XRD
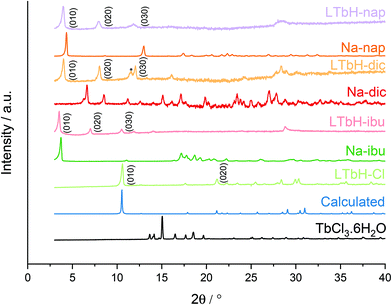
XRD patterns of the starting materials and the drug intercalation compounds of LTbH obtained by ion exchange are depicted in Fig. 3. For LTbH-Cl, the pattern contains no residual peaks from the parent terbium salt, showing that a full conversion has taken place. The pattern is consistent with the calculated pattern based on the analogous reported structure67 for an ytterbium based LRH. In all cases, the presence of strong basal reflections confirms the layered structure of LTbH. In the drug intercalation compounds, the basal reflections are broader and weaker compared to LTbH-Cl, indicating that a loss in crystallinity occurs as a result of the drug anion intercalation. Additionally, the reflections are seen to shift to lower angles, which is consistent with the layers moving farther apart to accommodate the larger drug anions.2,68 The reflections arising from LTbH-Cl and the drugs used for intercalation are not visible in the patterns for LTbH-dic, LTbH-ibu, and LTbH-nap, confirming that ion exchange was successful.All intercalation compounds appear to be phase pure. The interlayer spacing for LTbH-Cl, LTbH-dic, LTbH-ibu, and LTbH-nap was calculated to be 8.35, 22.01, 25.27 and 22.04 Å respectively. In the case of LTbH-dic and LTbH-nap, these values are consistent with previous reports for LTbH-dic65 and for similar LGdH systems.2 A previously reported LGdH-ibu2 material prepared by ion exchange revealed that two phases formed, with interlayer spacings of 23.46 and 20.73 Å. These are somewhat lower than the interlayer spacing found for LTbH-ibu (25.27 Å). All intercalates can be indexed to the orthorhombic Pca21 space group, and their refined unit cell parameters are summarised in Table 2.
| Material | (010) 2θ/° | a/Å | b/Å | c/Å |
|---|---|---|---|---|
| LTbH-Cl | 10.60 | 12.66 ± 0.01 | 8.33 ± 0.01 | 7.03 ± 0.01 |
| LTbH-dic | 4.00 | 12.37 ± 0.06 | 22.06 ± 0.07 | 7.04 ± 0.04 |
| LTbH-ibu | 3.52 | 12.37 ± 0.01 | 25.28 ± 0.03 | 7.01 ± 0.01 |
| LTbH-nap | 3.98 | 12.41 ± 0.02 | 22.04 ± 0.03 | 7.02 ± 0.01 |
Based on a model using the previously determined structure of an analogous ytterbium based LRH system,67 the single layer thickness of LTbH can be approximated as 6.0 Å. Using this value, the gallery heights in LTbH-dic, LTbH-ibu, and LTbH-nap are approximately 16.1, 19.1, and 16.2 Å respectively. These values are 1.3–1.4 times greater than the molecular dimensions of dic and nap (11.8 Å, 10.3 Å)2,69 and 1.9 times greater than that of ibu (12.9 Å).2 This strongly suggests that the anions within the interlayer space adopt an intertwined bilayer arrangement (Fig. 4), which has been previously posited for LRH systems.2,70 The greater interlayer distance noted with ibu is likely due to the amphipathic nature of the ibu molecule, which leads to a surfactant-like arrangement in which the hydrophobic hydrocarbon chains are clustered in the middle of the interlayer space while the hydrophilic anionic groups interact with the positive LRH layers above and below. In contrast, dic and nap have electronegative atoms at both ends of the molecule and are therefore able to adopt a more interdigitated arrangement, which results in a lower gallery height.
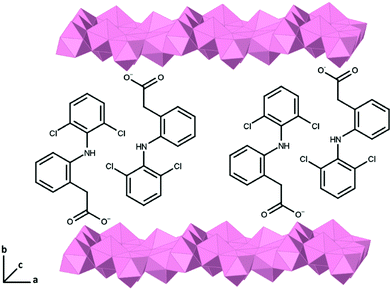 | ||
| Fig. 4 Schematic diagram illustrating the bilayer arrangement of intercalated diclofenac within the LTbH interlayer gallery. | ||
FTIR
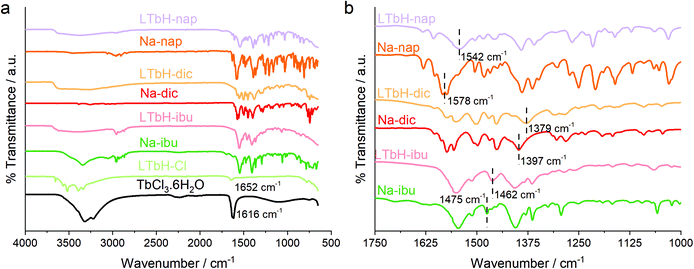
The FTIR spectra for all obtained intercalation compounds and reagents used are shown in Fig. 5. The precursor compound LTbH-Cl exhibits multiple broad stretches over the range 3652–3336 cm−1 due to O–H stretching vibrations arising from intercalated water molecules and hydroxide groups coordinated to Tb3+. An additional band at 1652 cm−1 is seen (Fig. 5a), which is attributed to O–H bending vibrations. This is consistent with values reported for a similar system based on gadolinium.2 In addition, the stretch at 1616 cm−1, associated with the O–H δ-bend in TbCl3·6H2O, is not seen, which confirms that no residual reagent is present.All drug intercalation compounds exhibit the broad O–H stretching seen in LTbH-Cl. Additionally, the intercalates show similar features to the pure drug spectra, particularly in the fingerprint region. In some cases, the band positions in the drug intercalates are shifted to lower wavenumbers. This is particularly evident in the LTbH-nap intercalate, where the 1578 cm−1 carboxylate band is seen to shift to 1542 cm−1 after intercalation (Fig. 5b). These shifts are a result of electrostatic interactions between the anionic carboxylate groups on the drug and the cationic LRH layers.68
Chemical formulae
Elemental analysis and TGA data (Table S1, Fig. S3†) were used to calculate formulae of the intercalation compounds (Table 3). It is presumed that residual Cl− anions are present in the structures of LTbH-dic and LTbH-nap, due to incomplete ion exchange. This leads to drug anions and Cl− anions being distributed within the same layers of LTbH,2 as there is no evidence of any remaining LTbH-Cl phase present in the respective XRD patterns. In addition, in the case of LTbH-Cl and LTbH-dic, the elemental analysis data indicate the presence of CO32− anions between the layers. This is believed to be due to the dissolution of atmospheric carbon dioxide into the solution during the synthetic or ion exchange process, which is a problem previously reported for LDH systems.71,72 The average drug loading in the formulations is approximately 33% by mass, which corresponds to 80–100% of the maximum capacity as determined by charge balance considerations.| Material | Formula | Drug loading/% |
|---|---|---|
| LTbH-Cl | [Tb2(OH)5]Cl0.9(CO3)0.05·1.5H2O | 0 |
| LTbH-dic | [Tb2(OH)5]Cl0.1(CO3)0.05(C14H10Cl2NO2)0.8·2H2O | 34.6 |
| LTbH-ibu | [Tb2(OH)5](C13H17O2)·1.5H2O | 32.3 |
| LTbH-nap | [Tb2(OH)5]Cl0.1(C14H13O3)0.9·1.5H2O | 32.2 |
Loading capacity of 33% w/w would be adequate to deliver single doses of dic, ibu, and nap (75 mg, 400 mg, and 500 mg respectively).73–75 In regards to intravenously delivered chemotherapeutic drugs such as doxorubicin or paclitaxel, which are usually administered at a minimum dosage of 60 mg and 135 mg per m2 of body surface area respectively,76,77 the loading capacity of LTbH is more than sufficient given that the effective dose for intratumoral delivery is expected to be lower than that for systemic delivery.
Cytotoxicity assay
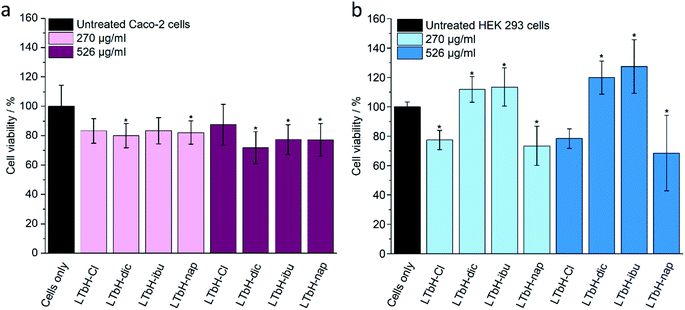
Cytotoxicity of the LTbH formulations was evaluated using in vitro cell viability experiments on Caco-2 and HEK 293 cell lines (Fig. 6). For the Caco-2 cell line, there is some cell death seen in all treatment groups as compared to the untreated cells control. At the higher concentration of 526 μg ml−1, all three drug intercalate formulations show statistically significant cytotoxicity, with the viability of cells treated with LTbH-dic decreasing the most to an average of 71%. LTbH-Cl does not appear to be significantly cytotoxic at either concentration. This suggests that the cytotoxicity seen arises from the intercalated drug anions. However, this contrasts with findings from a previous study on LGdH-Cl, LGdH-dic, and LGdH-ibu, which reported an increase in Caco-2 cell viability in the presence of these materials at a concentration of 270 μg ml−1.2 The precise source of this difference is not known, but it may be related to differences in cell uptake or drug release rate.For the HEK 293 cell line, a degree of cytotoxicity is seen in the LTbH-Cl and LTbH-nap treatment groups at both concentrations, which is comparable to the slight decrease in cell viability seen in the Caco-2 cell line. Conversely, the LTbH-dic and LTbH-ibu groups appear to encourage cell proliferation, even at the higher concentration of 526 μg ml−1, with average cell viabilities statistically higher than those of the untreated control. Overall, the biocompatibility of the formulations appears to be good even at high concentrations.
The treatment of cancer cell lines (HeLa, fibroblast, and rhabdomyosarcoma) with diclofenac has been reported to cause significant decreases in cell viability at a concentration of just 11 μM.82 Likewise, the cytotoxicity of ibuprofen has been previously studied using adenocarcinoma gastric cells, and cell viability found to decrease after 24 h exposure at a concentration of just 100 μM.83 Naproxen has been reported to cause significant cell death compared to untreated cells controls in urinary bladder cancer cell lines (UM-UC-5 and UM-UC-14) at a concentration of 500 μM.84 The findings of these studies therefore seem to support the assertion that the cytotoxicity exhibited by the LTbH-drug intercalates may in fact arise from the intercalated drug ions as opposed to the presence of the particles themselves.
To probe if this is the case, a further cytotoxicity experiment was conducted using pure drug solutions at a concentration approximately equivalent to the LTbH-drug intercalates (assuming 30% drug loading). The results of this experiment are shown in Fig. S4.† It was found that for Caco-2 cells, all three drugs exhibited a mild cytotoxic effect at the higher drug concentration of 158 μg ml−1, but cell viability was not significantly affected at the lower drug concentration of 81 μg ml−1. In the case of HEK 293 cells, ibuprofen was well tolerated and showed no cytotoxic effect at either concentration, whereas diclofenac and naproxen showed a statistically significant impact on viability. When taken together, the data seem to suggest any cytotoxic effects seen may be due to the presence of a relatively high concentration of LTbH particles which may interfere with the growth of cells, along with contributing effects arising from the presence of the pure drugs.
Haemolysis assay
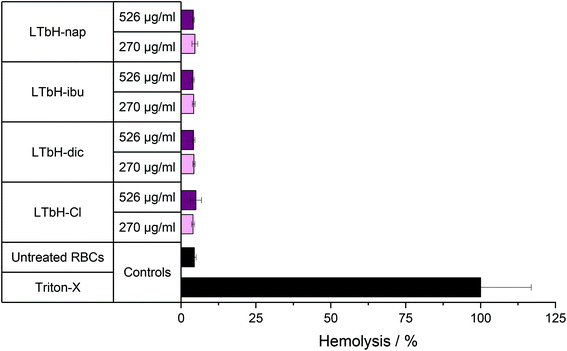
The haemolytic potential of the LTbH intercalates on red blood cells (RBCs) from rats was next studied (Fig. 7). It can be seen that the presence of LTbH-Cl or any of the LTbH-drug intercalates does not cause any substantial degree of haemolysis. This is the case at both concentrations of 270 and 526 μg ml−1. This indicates that LTbH particles do not disrupt the membrane of RBCs, and therefore supports the idea that formulations containing LTbH could be used for intravenous or intratumoral administration without haemotoxic effects.Stability assay
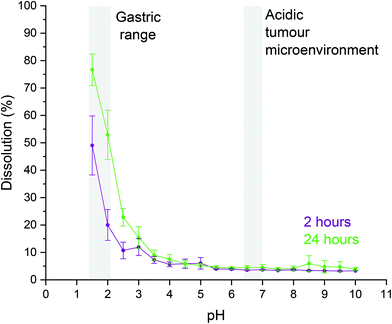
It is known that LDH materials are unstable in acidic suspensions,85 as metal hydroxides undergo acid hydrolysis which results in the dissolution of the LDH and the subsequent release of free metal ions into the solution. As LRH materials are analogous in structure, and by extension in chemistry, to LDH materials, it was of interest to establish the pH range over which LTbH-Cl is stable in aqueous suspension. This is particularly important because the toxicology of Tb3+ has not been evaluated in detail, but free Gd3+ ions are well known to be toxic to humans.86 For biomedical applications, it is necessary to minimise the release of free ions with potential toxicity issues. For this reason, a stability assay using arsenazo-3 (AS-3) was conducted on LTbH-Cl in aqueous suspensions at a range of pH values (pH = 1.5–10). The extent of dissolution of LTbH-Cl in each sample at 2 and 24 hours after immersion was then quantified using a colorimetric assay which tests for the presence of free Tb3+ ions. The results of this assay are given in Fig. 8.Significant dissolution of LTbH-Cl is seen in the pH range 1–3, which corresponds to the typical pH values seen in the gastric environment (pH = 1.0–2.0 in the fasted state, up to a median pH = 5.0 in the fed state).87 Therefore, formulations containing LTbH materials which are designed for oral delivery may require the use of an enteric coating to prevent degradation and the release of free Tb3+ ions. Above this pH range, however, the suspensions exhibit high stability with minimal dissolution (approximately 5%) seen after 24 hours. This includes the average physiological pH (7.4)88 as well as the slightly acidic extracellular environment often found in tumours (pH = 6.4–7.0).89 Assuming a theoretical LTbH-ibu dose of 1300 mg (which contains the equivalent of a single dose of ibuprofen), 5% dissolution would equate to 33 mg of free Tb3+ ions released. In a person weighing 60 kg, this is equivalent to 0.55 mg Tb3+ per kg body mass – several orders of magnitude below the reported LD50 for intravenously injected GdCl3 (100 mg per kg body mass in mice,90 equivalent to 60 mg of free Gd3+ ions per kg body mass). Whilst discussion of how Tb3+ ions may behave in vivo is beyond the scope of this study, the cytotoxicity studies and dissolution stability data seem to indicate that LTbH-based drug delivery systems may be safe to use for short-term treatments where accumulation of free lanthanide ions would be limited.
It is important to note that the AS-3 assay is known to be pH dependant, with the positions of absorbance peaks varying with pH.91 The characteristic absorbance peaks for both complexed and unbound AS-3 were seen to appear at a slightly lower wavelength at pH = 1.5 than at pH = 7.4 (Fig. S5†). However, this difference in absorbance maxima positions does not reduce the ability of the assay to qualitatively verify whether or not LTbH-Cl dissolves at a particular pH, and the absorbance at 652 nm is approximately constant across the pH range studied (see Fig. S6†). Therefore, for the purposes of quantifying the extent of dissolution of LTbH across this range of pH values, the performance of the AS-3 assay appears to be satisfactory.
Drug release
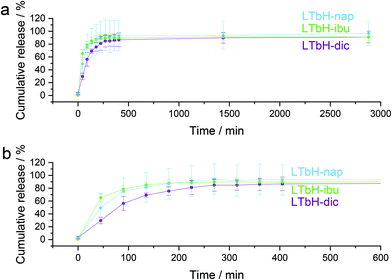
Drug release from LTbH-dic, LTbH-ibu, and LTbH-nap was studied using phosphate buffered saline (PBS, pH = 7.4) as the release medium (Fig. 9). It can be seen that the drug release profiles are very similar in the three formulations, with the majority of release occurring rapidly within the first 5 hours. Further release after around 6 hours is negligible. The mean final release percentage in all cases is between 91–96%.These release profiles are consistent with previous reports for LTbH-asa (approx. 85% release in 6 hours),63 and LEuH-nap (complete release within 200 minutes).64 However, previously reported release profiles for LTbH-dic and LTbH-imc (approx. 35% and 30% in 6 hours respectively)65 differ significantly. This may be related to the particle morphology of LTbH used in those studies – though no particle size analysis was presented in the previous study,65 SEM images showed large and clustered crystals which may introduce a longer diffusion path to the intercalated drug molecules and therefore lead to extended release kinetics.
The drug release data were fitted with the Bhaskar and Avrami models (eqn (5) and (6) respectively); α is extent of reaction, equivalent to the fraction of intercalated drug released, k is the rate constant, t is time, and n is a coefficient related to the reaction mechanism.
| ln(1 − α) = kt0.65 | (5) |
| ln(−ln(1 − α)) = nln(t) + ln(k) | (6) |
Fits of the Avrami and Bhaskar models to the LTbH-drug intercalates are shown in Fig. S7.† The Avrami equation can be used to describe a wide range of solid-state kinetic processes (usually involving the generation and growth of nuclei), and appears to be a good fit to the drug release data from LTbH. n values, derived from the slope of the line of best fit in the plots, are all close in value to 1. Whilst this does not definitely determine the precise release mechanism, it is consistent with a 2D diffusion controlled process in which the rate of nucleation is zero.2,92,93 In the context of the LTbH-drug intercalates, this is sensible because new nucleation sites (the positively charged layers with adsorbed drug molecules) are not generated during the course of the reaction. The rate of reaction is thus controlled by the diffusion of the drug ions between the layers (hence, 2D).
The Bhaskar model was originally developed to describe the diffusion of drug cations out of an ion exchangeable resin,94 and is therefore a good approximation for the diffusion of drug anions out of LRH particles. The model is based on the assumption that rate of release is controlled by diffusion of the drug through the particle, and the good fit of this model to the LTbH-drug release data strongly suggests that this is also the case in LTbH systems. These findings are in good agreement with those for LGdH-drug intercalates.2 If it was desired to increase the length of time over which sustained release occurs from LTbH, a possible approach would be to use a polymeric coating to increase the diffusion path for the drug molecule, as has been demonstrated on many occasions with other materials – including LDHs.95,96
Solid state photoluminescence
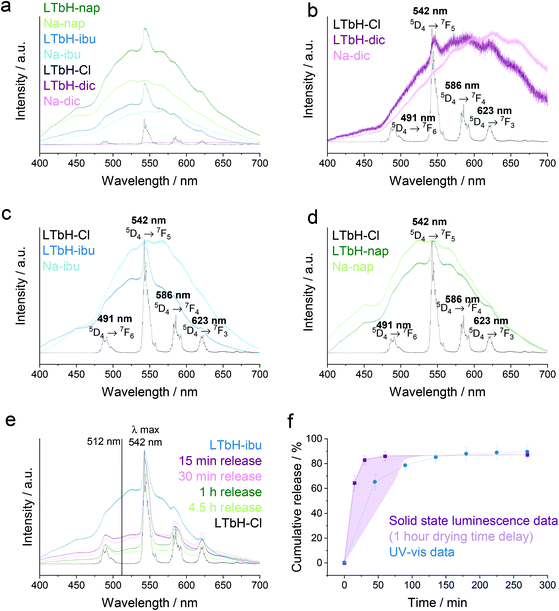
Solid state emission spectra of LTbH-Cl, the LTbH-drug intercalates, and the pure drug salts (Na-dic, Na-ibu, Na-nap) were measured at an excitation wavelength of λ = 325 nm (Fig. 10a–d). The photoluminescence emission spectrum of LTbH-Cl shows well resolved fine features and clear evidence of peak splitting arising from the low symmetry coordination environment67 of Tb3+.As it was not possible to control for the mass of sample used in each measurement (in each case, ca. 5 mg), the differences in intensity between samples cannot be quantified. However, it can be assumed that small differences in mass of sample would not fully account for the large difference in the magnitude of intensity between LTbH-ibu or LTbH-nap relative to LTbH-Cl or LTbH-dic in the data before normalisation (Fig. 10a). This indicates that the interaction between the LTbH matrix and dic differs in nature to that of LTbH with ibu or nap, leading to a different relaxation pathway. This is also supported by the significant shift in peaks arising from dic after intercalation, which can be seen in the spectra after normalisation (Fig. 10b), and the much reduced degree of peak shifting in LTbH-ibu and LTbH-nap (Fig. 10c–d). The decreased fluorescence intensity of LTbH-dic is in contrast with a previous study, which reported increased fluorescence intensity after intercalation of dic.65 However, the excitation wavelength used was 356 nm (as opposed to 325 nm), and therefore the emission spectra obtained in the previous study cannot be directly compared to those in the present work.
Since the spectra for the LTbH-drug intercalates show a combination of features from the pure drugs and a strong peak at 542 nm arising from Tb3+, it was thought that it may be possible to use the ratio between the height of the 542 nm peak and the height of the surrounding background to establish the extent of drug release. Presumably, as more drug is released from the formulation, the height of the peak arising from Tb3+ would increase relative to the signal arising from the drug, and the spectrum would become increasingly similar to the spectrum of LTbH-Cl. Similar real-time tracking of drug release has been reported before, for instance for doxorubicin release from silica nanoparticles (using fluorescence resonance energy transfer),97 or rhodamine release from a hydrogel (by multispectral fluorescence imaging on live mice).98
To test this hypothesis, further drug release experiments were conducted using LTbH-ibu, in which the experiment was terminated at specific time points and the solids recovered for photoluminescence analysis (see Fig. 10e). It can be seen that the spectra from samples that have the shortest release times (15 min, 30 min) are more similar in character to the spectrum of LTbH-ibu, whereas those with a longer release time (1 h, 4.5 h) more closely resemble that of LTbH-Cl. The halo-like intensity arising from the presence of the drug appears to decrease in magnitude with length of release time. This is particularly evident in the region between the first two Tb3+ transition peaks, and the intensity of each sample at 512 nm was chosen as a reference point for further calculations.
Assuming that the spectra of LTbH-ibu and LTbH-Cl represent the theoretical 0% and 100% release respectively, the cumulative release in each of the experimental samples was calculated using their intensity at 512 nm. The resultant drug release curve obtained is shown in Fig. 10f. It can be seen that this release curve closely resembles the one obtained by UV-vis, and therefore it is feasible to use the change in fluorescence emission to quantify drug release from LTbH-ibu. It should be noted that due to the nature of the experiment, it is not possible to truly terminate drug release at exactly the required time point: release will continue to some extent whilst the sample is wet. Therefore, the extent of release obtained in this manner is likely to be an overestimate of the true extent of release at a particular point. This is believed to be the reason why the release curve obtained from photoluminescence measurements appears to be shifted to the left relative to the release curve obtained by UV-vis. Nevertheless, it is clear that there is a high degree of correlation between the fluorescence properties and the extent of drug release, and thus the distinct possibility of using the LTbH formulations for theranostic applications.
Conclusions
This work considers the theranostic applications of the layered rare-earth hydroxide LTbH-Cl. We report the hydrothermal synthesis of LTbH-Cl and subsequent intercalation of the model drugs diclofenac, ibuprofen, and naproxen (dic, ibu, and nap) via ion exchange, as confirmed by XRD and FTIR characterisation. Elemental microanalysis and TGA experiments revealed high drug loadings of 80–100% based on charge balance considerations (or ca. 33 wt%). The majority of the drug cargo was released over approximately 5 h when the formulations were incubated in phosphate buffered saline at pH = 7.4. The haemo- and cytocompatibility of all formulations was found to be high, even at concentrations far exceeding those that would be required for therapeutic applications (up to 526 μg ml−1). Photoluminescence studies revealed characteristic peaks associated with Tb3+ and the presence of two different coordination environments in LTbH-Cl, consistent with previous reports in the literature. It was shown that intercalation of ibu and nap resulted in a significant increase in fluorescence intensity, whereas the intercalation of dic lead to the quenching of the fluorescence signal associated with Tb3+. These findings imply that the LTbH-intercalates could act as fluorophores for fluorescence imaging. Moreover, it was demonstrated using LTbH-ibu that it is feasible to use the changing fluorescence emission spectrum upon drug release to quantify the extent of drug which had de-intercalated. This property could provide a non-invasive way to quantify the real-time drug release kinetics in vivo, determine the precise location where drug release is taking place, or derive the required dosage frequency to maintain local therapeutic levels of drug. In particular, these systems could be useful for personalised cancer theranostics, where treatment efficacy may be greatly improved by using an image-guided, localised approach. The LTbH formulations developed in this work hence have potential for use as theranostic agents and bolster the recent interest in LRH materials towards personalised medicine applications.Conflicts of interest
There are no conflicts to declare.Acknowledgements
MS and CLGH kindly thank the Engineering and Physical Sciences Research Council (EPSRC) for PhD funding through the Centre for Doctoral Training in Advanced Therapeutics & Nanomedicines (EP/L01646X/1). YW would like to thank the China Scholarship Council for providing a scholarship to study at UCL.References
- P. Caravan, J. J. Ellison, T. J. McMurry and R. B. Lauffer, Gadolinium(III) chelates as MRI contrast agents: structure, dynamics, and applications, Chem. Rev., 1999, 99, 2293–2352 CrossRef CAS PubMed.
- Y. Xu, et al., Layered gadolinium hydroxides for simultaneous drug delivery and imaging, Dalton Trans., 2018, 47, 3166–3177 RSC.
- G. Huang, et al., Manganese-iron layered double hydroxide: a theranostic nanoplatform with pH-responsive MRI contrast enhancement and drug release, J. Mater. Chem. B, 2017, 5, 3629–3633 RSC.
- J. F. Keana and S. Pou, Nitroxide-doped liposomes containing entrapped oxidant: an approach to the ‘reduction problem’ of nitroxides as MRI contrast agents, Physiol. Chem. Phys. Med. NMR, 1985, 17, 235–240 CAS.
- H. V. T. Nguyen, et al., Nitroxide-based macromolecular contrast agents with unprecedented transverse relaxivity and stability for magnetic resonance imaging of tumors, ACS Cent. Sci., 2017, 3, 800–811 CrossRef CAS PubMed.
- H. V. T. Nguyen, et al., Pro-organic radical contrast agents (‘pro-ORCAs’) for real-time MRI of pro-drug activation in biological systems, Polym. Chem., 2020, 11, 4768–4779 RSC.
- A. V. Radha, P. Vishnu Kamath and C. Shivakumara, Mechanism of the anion exchange reactions of the layered double hydroxides (LDHs) of Ca and Mg with Al, Solid State Sci., 2005, 7, 1180–1187 CrossRef CAS.
- S. Ma, et al., Intercalation of macrocyclic crown ether into well-crystallized LDH: formation of staging structure and secondary host-guest reaction, Chem. Mater., 2009, 21, 3602–3610 CrossRef CAS.
- G. Choi, et al., Intercalative ion-exchange route to amino acid layered double hydroxide nanohybrids and their sorption properties, Eur. J. Inorg. Chem., 2015, 2015, 925–930 CrossRef CAS.
- J. H. Lee, S. W. Rhee and D. Y. Jung, Orientation-controlled assembly and solvothermal ion-exchange of layered double hydroxide nanocrystals, Chem. Commun., 2003, 2740–2741, 10.1039/b308269e.
- S. Aisawa, et al., Intercalation of nucleotides into layered double hydroxides by ion-exchange reaction, Appl. Clay Sci., 2005, 28, 137–145 CrossRef CAS.
- M. A. Djebbi, et al., Novel biohybrids of layered double hydroxide and lactate dehydrogenase enzyme: Synthesis, characterization and catalytic activity studies, J. Mol. Struct., 2016, 1105, 381–388 CrossRef CAS.
- S. Barkhordari and M. Yadollahi, Carboxymethyl cellulose capsulated layered double hydroxides/drug nanohybrids for cephalexin oral delivery, Appl. Clay Sci., 2016, 121–122, 77–85 CrossRef CAS.
- D. Capsoni, et al., Improving the carprofen solubility: Synthesis of the Zn2Al-LDH hybrid compound, J. Pharm. Sci., 2018, 107, 267–272 CrossRef CAS PubMed.
- R. Djaballah, A. Bentouami, A. Benhamou, B. Boury and E. H. Elandaloussi, The use of Zn-Ti layered double hydroxide interlayer spacing property for low-loading drug and low-dose therapy. Synthesis, characterization and release kinetics study, J. Alloys Compd., 2018, 739, 559–567 CrossRef CAS.
- M. Bini, et al., Hybrid compounds for improving drugs solubility: Synthesis, physico-chemical and pharmaceutical characterization of nimesulide-LDH, J. Solid State Chem., 2019, 272, 131–137 CrossRef CAS.
- F. Monteforte, et al., Meloxicam-LDH hybrid compound: A successful strategy to improve solubility, J. Inorg. Organomet. Polym. Mater., 2020, 30, 637–648 CrossRef CAS.
- S.-Q. Liu, S.-P. Li and X.-D. Li, Intercalation of methotrexatum into layered double hydroxides via exfoliation-reassembly process, Appl. Surf. Sci., 2015, 330, 253–261 CrossRef CAS.
- K. M. Ansy, J.-H. Lee, H. Piao, G. Choi and J.-H. Choy, Stabilization of antioxidant gallate in layered double hydroxide by exfoliation and reassembling reaction, Solid State Sci., 2018, 80, 65–71 CrossRef CAS.
- R. Uppuluri, A. Sen Gupta, A. S. Rosas and T. E. Mallouk, Soft chemistry of ion-exchangeable layered metal oxides, Chem. Soc. Rev., 2018, 47, 2401–2430 RSC.
- P. Olivera-Pastor, et al., Nanostructured inorganically pillared layered metal(IV) phosphates, Chem. Mater., 1996, 8, 1758–1769 CrossRef CAS.
- B. Kraushaar-Czarnetzki, W. H. J. Stork and R. J. Dogterom, Novel aluminophosphate-based compounds with a layered structure and intercalation behavior, Inorg. Chem., 1993, 32, 5029–5033 CrossRef CAS.
- T. Ban, S. Iriyama and Y. Ohya, Bottom-up synthesis of aluminophosphate nanosheets by hydrothermal process, Adv. Powder Technol., 2018, 29, 537–542 CrossRef CAS.
- B. Saifullah, et al., Antimycobacterial, antimicrobial, and biocompatibility properties of para-aminosalicylic acid with zinc layered hydroxide and Zn/Al layered double hydroxide nanocomposites, Drug Des. Devel. Ther., 2014, 8, 1029–1036 Search PubMed.
- V. R. R. Cunha, R. B. De Souza, A. M. C. R. P. da Fonseca Martins, I. H. J. Koh and V. R. L. Constantino, Accessing the biocompatibility of layered double hydroxide by intramuscular implantation: Histological and microcirculation evaluation, Sci. Rep., 2016, 6, 1–10 CrossRef.
- L. Perioli, M. Nocchetti, P. Giannelli, C. Pagano and M. Bastianini, Hydrotalcite composites for an effective fluoride buccal administration: A new technological approach, Int. J. Pharm., 2013, 454, 259–268 CrossRef CAS.
- S. J. Choi, J. M. Oh and J. H. Choy, Anticancer drug-layered hydroxide nanohybrids as potent cancer chemotherapy agents, J. Phys. Chem. Solids, 2008, 69, 1528–1532 CrossRef CAS.
- L. Li, W. Gu, J. Chen, W. Chen and Z. P. Xu, Co-delivery of siRNAs and anti-cancer drugs using layered double hydroxide nanoparticles, Biomaterials, 2014, 35, 3331–3339 CrossRef CAS PubMed.
- R. Zhu, et al., PH sensitive nano layered double hydroxides reduce the hematotoxicity and enhance the anticancer efficacy of etoposide on non-small cell lung cancer, Acta Biomater., 2016, 29, 320–332 CrossRef CAS PubMed.
- R. Ma, Z. Wang, L. Yan, X. Chen and G. Zhu, Novel Pt-loaded layered double hydroxide nanoparticles for efficient and cancer-cell specific delivery of a cisplatin prodrug, J. Mater. Chem. B, 2014, 2, 4868–4875 RSC.
- S. J. Ryu, H. Jung, J. M. Oh, J. K. Lee and J. H. Choy, Layered double hydroxide as novel antibacterial drug delivery system, J. Phys. Chem. Solids, 2010, 71, 685–688 CrossRef CAS.
- G. Mishra, B. Dash, S. Pandey, D. Sethi and C. G. Kumar, Comparative evaluation of synthetic routes and antibacterial/antifungal properties of Zn-Al layered double hydroxides containing benzoate anion, Environ. Eng. Sci., 2018, 35, 247–260 CrossRef CAS.
- X. Liu, et al., The synthesis of a DHAD/ZnAlTi-LDH composite with advanced UV blocking and antibacterial activity for skin protection, RSC Adv., 2020, 10, 9786–9790 RSC.
- X. Gao, et al., Intercalation and controlled release properties of vitamin C intercalated layered double hydroxide, J. Solid State Chem., 2013, 203, 174–180 CrossRef CAS.
- F. Fayyazbakhsh, et al., Release behavior and signaling effect of vitamin D3 in layered double hydroxides-hydroxyapatite/gelatin bone tissue engineering scaffold: An in vitro evaluation, Colloids Surf., B, 2017, 158, 697–708 CrossRef CAS PubMed.
- O. M. Gil, M. A. Rocha, V. R. L. Constantino, I. H. J. Koh and D. L. A. de Faria, Modified drug release system based on sulindac and layered double hydroxide: An in vivo Raman investigation, Vib. Spectrosc., 2016, 87, 60–66 CrossRef CAS.
- M. Delarco, A. Fernandez, C. Martin and V. Rivers, Release studies of different NSAIDs encapsulated in Mg,Al,Fe-hydrotalcites, Appl. Clay Sci., 2009, 42, 538–544 CrossRef CAS.
- R. Rojas, M. C. Palena, A. F. Jimenez-Kairuz, R. H. Manzo and C. E. Giacomelli, Modeling drug release from a layered double hydroxide-ibuprofen complex, Appl. Clay Sci., 2012, 62–63, 15–20 CrossRef CAS.
- H. Liang, et al., Hydrothermal continuous flow synthesis and exfoliation of NiCo layered double hydroxide nanosheets for enhanced oxygen evolution catalysis, Nano Lett., 2015, 15, 1421–1427 CrossRef CAS PubMed.
- X. Zou, A. Goswami and T. Asefa, Efficient noble metal-free (electro)catalysis of water and alcohol oxidations by zinc–cobalt layered double hydroxide, J. Am. Chem. Soc., 2013, 135, 17242–17245 CrossRef CAS PubMed.
- M. N. Sepehr, T. J. Al-Musawi, E. Ghahramani, H. Kazemian and M. Zarrabi, Adsorption performance of magnesium/aluminum layered double hydroxide nanoparticles for metronidazole from aqueous solution, Arabian J. Chem., 2017, 10, 611–623 CrossRef CAS.
- J. Inacio, C. Taviot-Guého, C. Forano and J. Besse, Adsorption of MCPA pesticide by MgAl-layered double hydroxides, Appl. Clay Sci., 2001, 18, 255–264 CrossRef CAS.
- Y. Seida and Y. Nakano, Removal of phosphate by layered double hydroxides containing iron, Water Res., 2002, 36, 1306–1312 CrossRef CAS PubMed.
- X. Cheng, et al., Phosphate adsorption from sewage sludge filtrate using zinc–aluminum layered double hydroxides, J. Hazard. Mater., 2009, 169, 958–964 CrossRef CAS PubMed.
- H. Chen, L. Hu, M. Chen, Y. Yan and L. Wu, Nickel-cobalt layered double hydroxide nanosheets for high-performance supercapacitor electrode materials, Adv. Funct. Mater., 2014, 24, 934–942 CrossRef CAS.
- L. Zhang, K. N. Hui, K. S. Hui and H. Lee, Facile synthesis of porous CoAl-layered double hydroxide/graphene composite with enhanced capacitive performance for supercapacitors, Electrochim. Acta, 2015, 186, 522–529 CrossRef CAS.
- F. Gándara, et al., Layered rare-earth hydroxides: A class of pillared crystalline compounds for intercalation chemistry, Angew. Chem., Int. Ed., 2006, 45, 7998–8001 CrossRef PubMed.
- M. S. Usman, M. Z. Hussein, S. Fakurazi, F. Fikri and A. Saad, Gadolinium-based layered double hydroxide and graphene oxide nano-carriers for magnetic resonance imaging and drug delivery, Chem. Cent. J., 2017, 11, 47 CrossRef CAS PubMed.
- Y. S. Yoon, et al., Surface modification of exfoliated layered gadolinium hydroxide for the development of multimodal contrast agents for MRI and fluorescence imaging, Adv. Funct. Mater., 2009, 19, 3375–3380 CrossRef CAS.
- Y. Xiang, et al., Synthesis of highly luminescent and anion-exchangeable cerium-doped layered yttrium hydroxides for sensing and photofunctional applications, Adv. Funct. Mater., 2011, 21, 4388–4396 CrossRef CAS.
- C. C. L. Pereira, J. C. Lima, A. J. Moro and B. Monteiro, Layered europium hydroxide system for phosphorous sensing and remediation, Appl. Clay Sci., 2017, 146, 216–222 CrossRef CAS.
- Q. Zhu, et al., Grafting of terbium(III) complexes onto layered rare-earth hydroxide nanosheets to fabricate novel optical fiber temperature sensors, Nanoscale, 2019, 11, 2795–2804 RSC.
- Q. Zhu, et al., Luminescent thermometry by a Y/Eu binary layered rare-earth hydroxide (LRH) via in situ intercalation with neutral terbium(III) complexes, Chem. – Asian J., 2018, 13, 3664–3669 CrossRef CAS PubMed.
- L. Liu, et al., Facile fabrication of color-tunable and white light emitting nano-composite films based on layered rare-earth hydroxides, J. Mater. Chem. C, 2015, 3, 2326–2333 RSC.
- L. Wu, G. Chen and Z. Li, Layered rare-earth hydroxide/polyacrylamide nanocomposite hydrogels with highly tunable photoluminescence, Small, 2017, 13, 1604070 CrossRef PubMed.
- W. Li, et al., Intercalation of azamacrocyclic crown ether into layered rare-earth hydroxide (LRH): Secondary host–guest reaction and efficient heavy metal removal, Inorg. Chem., 2013, 52, 14010–14017 CrossRef CAS PubMed.
- X. Wang, W. Chen and Y. F. Song, Directional self-assembly of exfoliated layered europium hydroxide nanosheets and Na9EuW10O36·32H2O for application in desulfurization, Eur. J. Inorg. Chem., 2014, 2014, 2779–2786 CrossRef CAS.
- L. Zhu, et al., Selenium sequestration in a cationic layered rare earth hydroxide: A combined batch experiments and EXAFS investigation, Environ. Sci. Technol., 2017, 51, 8606–8615 CrossRef CAS PubMed.
- F. Gándara, et al., Controlling the structure of arenedisulfonates toward catalytically active materials, Chem. Mater., 2009, 21, 655–661 CrossRef.
- D. Stefanakis and D. F. Ghanotakis, Synthesis and characterization of gadolinium nanostructured materials with potential applications in magnetic resonance imaging, neutron-capture therapy and targeted drug delivery, J. Nanopart. Res., 2010, 12, 1285–1297 CrossRef CAS.
- S. S. Yoo, et al., Layered gadolinium-based nanoparticle as a novel delivery platform for microRNA therapeutics, Nanotechnology, 2014, 25, 425102 CrossRef PubMed.
- Q. Gu, et al., Intercalation of amino acids into Eu3+ -doped layered gadolinium hydroxide and quenching of Eu3+ luminescence, Eur. J. Inorg. Chem., 2012, 2012, 4407–4412 CrossRef CAS.
- R. Ju and Q. Gu, Biohybrid based on layered terbium hydroxide and applications as drug carrier and biological fluorescence probe, Appl. Organomet. Chem., 2018, 32, e3926 CrossRef.
- Q. Gu, W. Chen, F. Duan and R. Ju, Fabrication of a nano-drug delivery system based on layered rare-earth hydroxides integrating drug-loading and fluorescence properties, Dalton Trans., 2016, 45, 12137–12143 RSC.
- Q.-Y. Gu, et al., Nanostructured layered terbium hydroxide containing NASIDs: in vitro physicochemical and biological evaluations, J. Nanosci. Nanotechnol., 2018, 18, 5320–5326 CrossRef CAS PubMed.
- Y. Ren and J. Feng, Skin-inspired multifunctional luminescent hydrogel containing layered rare-earth hydroxide with 3D printability for human motion sensing, ACS Appl. Mater. Interfaces, 2020, 12, 6797–6805 CrossRef CAS PubMed.
- F. Geng, et al., General synthesis and structural evolution of a layered family of Ln8(OH)20Cl4·nH2O (Ln = Nd, Sm, Eu, Gd, Tb, Dy, Ho, Er, Tm, and Y), J. Am. Chem. Soc., 2008, 130, 16344–16350 CrossRef CAS PubMed.
- Z. Gu, A. Wu, L. Li and Z. P. Xu, Influence of hydrothermal treatment on physicochemical properties and drug release of anti-inflammatory drugs of intercalated layered double hydroxide nanoparticles, Pharmaceutics, 2014, 6, 235–248 CrossRef PubMed.
- A. S. Mestre, J. Pires, J. M. F. Nogueira and A. P. Carvalho, Activated carbons for the adsorption of ibuprofen, Carbon, 2007, 45, 1979–1988 CrossRef CAS.
- N. Chu, et al., Intercalation of organic sensitisers into layered europium hydroxide and enhanced luminescence property, Dalton Trans., 2012, 41, 7409 RSC.
- F. Zhang, N. Du, S. Song, J. Liu and W. Hou, Mechano-hydrothermal synthesis of Mg2Al-NO3 layered double hydroxides, J. Solid State Chem., 2013, 206, 45–50 CrossRef CAS.
- A. N. Ay, B. Zümreoglu-Karan and A. Temel, Boron removal by hydrotalcite-like, carbonate-free Mg-Al-NO3-LDH and a rationale on the mechanism, Microporous Mesoporous Mater., 2007, 98, 1–5 CrossRef CAS.
- DICLOFENAC SODIUM | Drug | BNF content published by NICE. Available at: https://bnf.nice.org.uk/drug/diclofenac-sodium.html#indicationsAndDoses. (Accessed: 8th February 2021).
- IBUPROFEN | Drug | BNF content published by NICE. Available at: https://bnf.nice.org.uk/drug/ibuprofen.html#indicationsAndDoses. (Accessed: 8th February 2021).
- NAPROXEN | Drug | BNF content published by NICE. Available at: https://bnf.nice.org.uk/drug/naproxen.html#indicationsAndDoses. (Accessed: 8th February 2021).
- Doxorubicin solution for injection - summary of product characteristics (SmPC) - (emc). Available at: https://www.medicines.org.uk/emc/product/6184/smpc. (Accessed: 8th February 2021).
- Paclitaxel 6 mg/ml concentrate for solution for infusion - summary of product characteristics (SmPC) - (emc). Available at: https://www.medicines.org.uk/emc/product/3891/smpc. (Accessed: 8th February 2021).
- E. Kandare and J. M. Hossenlopp, Thermal degradation of acetate-intercalated hydroxy double and layered hydroxy salts, Inorg. Chem., 2006, 45, 3766–3773 CrossRef CAS PubMed.
- V. Rives, Characterisation of layered double hydroxides and their decomposition products, Mater. Chem. Phys., 2002, 75, 19–25 CrossRef CAS.
- F. Kovanda, et al., Mixed oxides obtained from Co and Mn containing layered double hydroxides: Preparation, characterization, and catalytic properties, J. Solid State Chem., 2006, 179, 812–823 CrossRef CAS.
- S.-S. Lee, B.-I. Lee, S.-J. Kim, S.-H. Byeon and J.-K. Kang, Thermal decomposition and recovery behaviors of layered gadolinium hydroxychloride, Inorg. Chem., 2012, 51, 10222–10232 CrossRef CAS PubMed.
- M. S. M. Al-Nimer, H. G. Hameed and M. M. Mahmood, Antiproliferative effects of aspirin and diclofenac against the growth of cancer and fibroblast cells: In vitro comparative study, Saudi Pharm. J., 2015, 23, 483–486 CrossRef PubMed.
- H. Akrami, S. Aminzadeh and H. Fallahi, Inhibitory effect of ibuprofen on tumor survival and angiogenesis in gastric cancer cell, Tumor Biol., 2015, 36, 3237–3243 CrossRef CAS PubMed.
- M. S. Kim, et al., Naproxen induces cell-cycle arrest and apoptosis in human urinary bladder cancer cell lines and chemically induced cancers by targeting PI3K, Cancer Prev. Res., 2014, 7, 236–245 CrossRef CAS PubMed.
- M. L. Parello, R. Rojas and C. E. Giacomelli, Dissolution kinetics and mechanism of Mg-Al layered double hydroxides: A simple approach to describe drug release in acid media, J. Colloid Interface Sci., 2010, 351, 134–139 CrossRef CAS PubMed.
- L. K. Young, S. Z. Matthew and J. G. Houston, Absence of potential gadolinium toxicity symptoms following 22,897 gadoteric acid (Dotarem®) examinations, including 3,209 performed on renally insufficient individuals, Eur. Radiol., 2019, 29, 1922–1930 CrossRef PubMed.
- J. B. Dressman, et al., Upper Gastrointestinal (GI) pH in Young, Healthy Men and Women, Pharm. Res., 1990, 7, 756–761 CrossRef CAS PubMed.
- E. Jalalvand, B. Robertson, H. Tostivint, P. Wallén and S. Grillner, The spinal cord has an intrinsic system for the control of pH, Curr. Biol., 2016, 26, 1346–1351 CrossRef CAS PubMed.
- J. Griffiths, Are cancer cells acidic?, Br. J. Cancer, 1991, 64, 425–427 CrossRef CAS PubMed.
- Gadolinium (III) chloride hexahydrate materials safety datasheet. Available at: https://datasheets.scbt.com/sc-202617.pdf. (Accessed: 17th May 2021).
- H. Rohwer and E. Hosten, pH dependence of the reactions of arsenazo III with the lanthanides, Anal. Chim. Acta, 1997, 339, 271–277 CrossRef CAS.
- D. W. Henderson, Experimental analysis of non-isothermal transformations involving nucleation and growth, J. Therm. Anal., 1979, 15, 325–331 CrossRef CAS.
- T. J. W. De Bruijn, D. Jong, W. A and P. J. Van Den Berg, Kinetic parameters in Avrami-Erofeev type reactions from isothermal and non-isothermal experiments, Thermochim. Acta, 1981, 45, 315–325 CrossRef CAS.
- R. Bhaskar, R. S. R. Murthy, B. D. Miglani and K. Viswanathan, Novel method to evaluate diffusion controlled release of drug from resinate, Int. J. Pharm., 1986, 28, 59–66 CrossRef CAS.
- M. S. Aw, K. Gulati and D. Losic, Controlling drug release from titania nanotube arrays using polymer nanocarriers and biopolymer coating, J. Biomater. Nanobiotechnol., 2011, 02, 477–484 CrossRef CAS.
- L. N. M. Ribeiro, et al., Pectin-coated chitosan-LDH bionanocomposite beads as potential systems for colon-targeted drug delivery, Int. J. Pharm., 2014, 463, 1–9 CrossRef CAS PubMed.
- J. Lai, B. P. Shah, E. Garfunkel and K. B. Lee, Versatile fluorescence resonance energy transfer-based mesoporous silica nanoparticles for real-time monitoring of drug release, ACS Nano, 2013, 7, 2741–2750 CrossRef CAS PubMed.
- X. Dong, C. Wei, T. Liu, F. Lv and Z. Qian, Real-time fluorescence tracking of protoporphyrin incorporated thermosensitive hydrogel and its drug release in vivo, ACS Appl. Mater. Interfaces, 2016, 8, 5104–5113 CrossRef CAS PubMed.
Footnote |
| † Electronic supplementary information (ESI) available. See DOI: 10.1039/d1dt01251g |
| This journal is © The Royal Society of Chemistry 2021 |

