 Open Access Article
Autocatalytic photodegradation of [Ru(II)(2,2′-bipyridine)2DAD]+ (DADH = 1,2-dihydroxyanthracene-9,10-dione) by hydrogen peroxide under acidic aqueous conditions†
Lingli
Zeng
a,
Dumitru
Sirbu
 b,
Nikolai V.
Tkachenko
 c and
Andrew C.
Benniston
 *a
*a
aMolecular Photonics Laboratory, Chemistry-School of Natural & Environmental Sciences, Newcastle University, Newcastle upon Tyne, NE1 7RU, UK. E-mail: andrew.benniston@ncl.ac.uk
bSchool of Mathematics, Statistics and Physics, Newcastle University, Newcastle upon Tyne, NE1 7RU, UK
cFaculty of Engineering and Natural Sciences, Tampere University, P.O. Box 541, FI-33014, Tampere, Finland
First published on 3rd May 2021
Abstract
As part of a continuing effort to identify ruthenium agents capable of the photorelease of anthraquinone-based ligands the complexes Δ/Λ-[Ru(bpy)2DAD]+ (bpy = 2,2′-bipyridine) were produced by the reaction of 1,2-dihydroxyanthracene-9,10-dione (DADH) with chirally pure Δ/Λ-[Ru(bpy)2(py)2][(+)-O,O′-dibenzoyl-D-tartrate]·12H2O (py = pyridine). A very subtle difference in the chemical shift of the hydroxyl proton in their high-field 1H NMR spectra was observed, supporting that the OH proton is susceptible to a small change in environment at the metal centre. The excited state lifetime of the complexes, as measured by femtosecond pump–probe spectroscopy, was 7.1 (±0.8) ps in water (pH 2) and 13 (±1) ps in MeCN. Illumination of a sample of Λ-[Ru(bpy)2DAD]+ in water (pH 2) in the presence of hydrogen peroxide resulted in decomposition of the complex. The decay profile, as monitored at several wavelengths, was sigmoidal indicating the reaction was autocatalytic, in which the product formed catalysed decomposition of the starting complex. A mechanism is proposed that relies on participation of the uncoordinated hydroxyl group on the anthraquinone ligand in promoting water loss and radical formation in the excited state. The radical is oxidised by peroxide to generate the ruthenium(III) complex, which behaves as an oxidant in the autocatalytic process.
Introduction
Anthraquinone and its derivatives are ubiquitous in nature especially in plants1 and serve several fundamentally important purposes.2 They are generally found attached to sugars (e.g., glycosides) in a living plant, and are often associated with electrochemical reactions by utilising the rich redox at the carbonyl sites. Anthraquinones play important roles in several types of medications and have been linked to benefits from their properties which include antibacterial, antifungal, antioxidant and antiviral. Within the plethora of anthraquinones is the compound 1,2-dihydoxyanthracene-9,10-dione (DADH), which is more commonly known as alizarin.3 The compound is interesting in that it is not only a paint pigment but it has also found applications as a drug for the treatment of tumors.4 Additionally, alizarin is important for its use as a staining agent in biological and geological research, specifically for colorimetric quantification of calcium.5 The presence of the three adjacent oxygen groups opens up the opportunity for the compound to coordinate metal ions, noting that linkage isomers are possible depending on which oxygen pair donate to the metal ion centre. Previous work by Lever et al.6 showed that linkage isomerization was pH dependent in the complex [Ru(II)(2,2′-bipyridine)2alizarin]+, which for simplicity is now referred to as RDAD. The interchange between the isomers results in a clear colour change. Despite the detailed redox chemistry of the complex, very little more is known about its photochemistry and stability. Our interest in the complex stemmed from previous work, which showed that the simpler version missing the 2-hydroxyl group could be decomposed in the presence of hydrogen peroxide and light.7 It was not evident if the additional hydroxyl group would serve to promote or retard any photochemical reaction.The current interest in photoactive complexes capable of releasing therapeutic8 or cytotoxic agents9 prompted the study of the complex RDAD (Scheme 1) under white light excitation in the presence of hydrogen peroxide. The primary focus was to elucidate if the alizarin was released from the complex, what other species would also be formed and the process for decomposition. As shown in our previous work, despite the extremely short excited state lifetime of ca. 7 ps the complex decomposed over some 100 minutes in acidic water containing peroxide under white light illumination. However, the reaction kinetics, as monitored by disappearance of the main absorption band at 580 nm, displayed behaviour typically observed for an autocatalytic process. This conduct was not observed previously, pointing to the fact that the hydroxyl group aids in the decomposition process. A simple mechanism is proposed based on participation of the 2-hydroxyl group, by elimination of water in the complex's excited state and oxidation by the peroxide present.
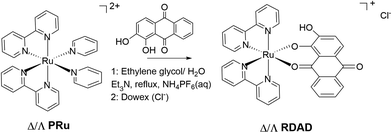 | ||
| Scheme 1 Preparation of the ruthenium(II) polypyridyl complex of 1,2-dihydroxyanthracene-9,10-dione (DADH), also commercially known as alizarin. | ||
Results and discussion
Synthesis and characterization
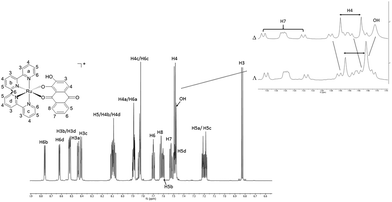
The racemic synthesis of RDAD was published previously,6 but not the corresponding chirally pure Δ and Λ forms. Although pure enantiomers are undoubtedly not critical for photodecomposition studies in achiral environments, they are potentially more interesting when bound in chiral environments; the obvious example being that of DNA and minor/major groove binding.10 Hence, for completeness the two pure enantiomers were produced using the simple method developed by von Zelewsky and co-workers.11The reflux of DADH in aqueous ethylene glycol with one equivalent of either Δ-PRu or Λ-PRu and triethylamine resulted in the formation of a purple solution. Dark purple solids were precipitated by the addition of KPF6 (aq) and obtained in good yields of ca. 60% and high purity, as per high-performance liquid chromatography (HPLC, see ESI†). The hexafluorophosphate complexes were typically soluble in polar solvents such as acetone, acetonitrile and dimethylsulfoxide. Water soluble versions of the complexes were obtained by chloride anion exchange using Dowex. A low-resolution 1H NMR spectrum for racemic RDAD was reported before,12 and so for completion a high-resolution (700 MHz) spectrum for Δ-RDAD in CD3CN is presented in Fig. 1. The assignment of the proton resonances was based on a 1H–1H COSY and HSQC spectra (see ESI†) and previous assignments in the literature. The complexity of the spectrum is partly a consequence of the low symmetry of the attached DAD ligand. The noted shifts of specific resonances are fully consistent with protons residing in close proximity to aromatic rings and their shielding ring currents. For instance, the protons H6a and H6c of the 2,2′-bipyridine ligands point towards aryl rings of the DAD ligand, whereas protons H6b and H6d point at pyridine groups. A significant difference is observed in the upfield chemical shifts between these two proton pairs. The proton H8 for DAD is shifted upfield because of its close proximity to a pyridine ring.
A cursory inspection of the 1H NMR spectra for Δ-RDAD and Λ-RDAD in CD3CN suggested that they were identical. However, a closer examination of specific resonances revealed subtle differences between the two spectra as illustrated in the Fig. 1 insert. The most discernible difference is observed around 7.5 ppm corresponding to a region where there is a broad resonance for the hydroxyl group. This proton resonance is shifted downfield in Λ-RDAD compared to the other isomer, which is in fitting with it interacting to a lesser extent to the pyridine π-system, or more strongly hydrogen bonding to the proximal oxygen atom.
For brevity only the properties of one isomer Λ-RDAD will be described in the following sections. Limited experiments performed using Δ-RDAD afforded essentially the same results as for the other isomer.
Photophysical properties
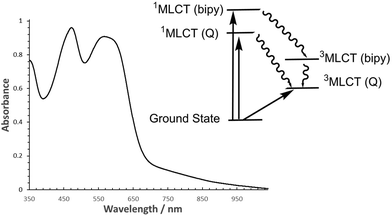
An absorption spectrum of the chloride salt of Λ-RDAD in H2O (pH = 2) is shown in Fig. 2. Based on earlier work the main absorption band located at λmax = 567 nm (εmax = 8990 M−1 cm−1) is assigned to a metal-to-ligand charge-transfer (1MLCT) band in which a single electron is promoted from the full t2g set to a π*-orbital located on the anthraquinone-based ligand.8 There is in addition a prominent long tail which stretches well into the red region, with contributions from the spin-forbidden singlet to triplet MLCT transition and intramolecular ligand–ligand charge transfer transition. The other major absorption profile located at λMAX = 472 nm (εmax = 9150 M−1 cm−1) is the 1MLCT correlated with an electronic transition from the ruthenium(II) centre to a 2,2′-bipyridine ligand. It should be noted that π–π* transitions for DADH also lie in the region between 400–500 nm. Within the pH range 2–10 the absorption spectrum for the complex did not change significantly. The observed modification in colour of the solution at high pH (>11) is consistent with deprotonation of the hydroxyl group as described previously in the literature (see ESI†).6Although the free ligand DADH is slightly fluorescent in an aqueous solution13 no reproducible emission could be seen for both isomers of RDAD, and as far as we are aware no room temperature phosphorescence was reported for the racemic complex. The excited state behaviour for ruthenium(II) polypyridyl complexes is well understood with the initially formed 1MLCT state rapidly converting in a few femtoseconds to the 3MLCT because of the heavy atom effect.14 Applying the same process to RDAD would essentially generate a low-energy triplet state which can be formerly written as [Ru(III)(bipy)2DAD˙−]+. As illustrated in the simplified picture in Fig. 2 it is reasonable to assume that formation of the bipyridine-based 1MLCT state ([Ru(III)(bipy)(bipy˙−)DAD]+) would also rapidly intersystem cross to its corresponding 3MLCT state. The lack of room temperature phosphorescence, even from the upper-lying 3MLCT state, would insinuate that internal conversion to the anthraquinone-based 3MLCT state is efficient. This interpretation is not too unreasonable since previous calculations have shown that the frontier molecular orbitals for RDAD are not “pure” and that there is a mixing of states.15
The what appeared to be fast excited state decay in Λ-RDAD was more comprehensively studied using femtosecond pump–probe spectroscopy. Excitation of a sample in MeCN with a 100 fs laser pulse delivered at 500 nm produced a series of temporal profiles, which were globally fitted to two exponentials to produce two clear transient differential spectra (Fig. 3). The shortest lifetime component (1.6 ps) contains a feature that maps to the ground-state absorption profile and a positive transient profile at long wavelength. The slightly longer-lived transient profile (13 ps) is more pronounced in the long-wavelength region. Using the model proposed in Fig. 2 the 1.6 ps transient is assigned to the 3MLCT (bipy) state and the 13 ps transient to the 3MLCT (Q) state. The ultrashort lifetime is a result of fast non-radiative decay of the low-energy anthraquinone-based triplet state as predicted by the energy gap law.16 Similar behaviour was previously reported for the analogous complex without the additional hydroxyl group.7
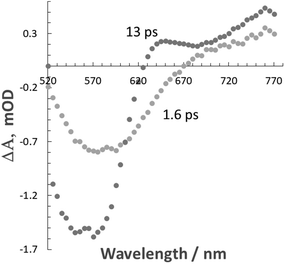 | ||
| Fig. 3 Differential transient absorption spectra obtained from a global fit to two exponentials to pump probe data recorded for Λ-RDAD in MeCN. | ||
Transient absorption data were also collected under different conditions including in water and in the presence of H2O2. The data are presented in Table 1. There is distinct decrease in the two recorded lifetimes in changing from MeCN to H2O, but the addition of hydrogen peroxide had no major affect.
Degradation studies
Given the ultrashort excited state lifetime for Λ-RDAD, and the lack of any sign of reaction with H2O2, the decomposition of the complex in water over some 100 minutes was unexpected but rewarding. As shown in Fig. 4 the irradiation of a dilute solution in water (pH 2) with white light resulted in clear alterations to the absorption spectrum. The absorption bands associated with both the 1MCLT states decreased over time and there was sign of a new weak absorption band at ca. 960 nm. A similar experiment performed in the dark showed no obvious alterations. The final spectrum closely resembled that produced by in situ oxidation of Λ-RDAD using PbO2 (see ESI†).17 The loss of the 1MLCT absorption band at 567 nm is consistent with formation of [Ru(III)(bipy)2DAD]2+ and eventually the removal of DAD from the coordination sphere.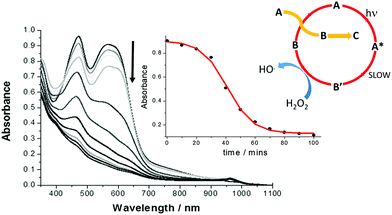 | ||
| Fig. 4 White light induced alterations to the absorption spectra of Λ-RDAD (conc. = 0.1 mM) in N2-purged deionised water (pH 2) containing H2O2 (0.4 M) over 100 minutes. The inserts show the change in absorbance monitored at 580 nm over time and the least-squares sigmoidal fit to the equation for an autocatalytic reaction and the proposed process where A, B′ and B are defined in Scheme 2. | ||
The decay of the complex as monitored at several wavelengths between 440–580 nm displayed a sigmoidal profile as shown in the insert of Fig. 4. This type of behaviour is typical for an autocatalytic process in which the product formed catalyses the starting material decomposition (eqn (1)), where k1 is the rate constant for the non-catalytic reaction and k2 is the rate constant for the catalytic reaction.18
| Rate = k1[Reactant] + k2[Reactant][Product] | (1) |
The sigmoidal plot was analysed using a least-squares fit to eqn (2) which represents the change in concentration of the reactant [R] over time (t) in terms of k1 and k2 and its initial concentration [R0].
 | (2) |
The average values from fits at the different wavelengths are k1 = 1.2 ± 0.1 × 10⁻³ min−1 and k2 = 1019 ± 200 M−1 min−1. By monitoring the absorption profile at longer wavelength (>600 nm) the initial slow induction period was far more obvious and almost constant, and the faster process displayed a decay which could be fitted to a single exponential. The average fitted lifetime τ2 = 19 ± 3 min, corresponding to a first-order rate constant of 52.6 × 10⁻³ min−1. Noting that 1/(τ2 × k2) has units of concentration this equates to ca. 5 × 10⁻⁵ M corresponding to half the concentration of the initial solution. A series of similar light-induced degradation experiments were also performed at different pH up to 7 (see ESI†) and the results from the analysis are collected in Table 2.
Proposed decay process
The catalytic reaction appears to be dominant at low pH and the rate constants tend toward a fixed value between pH 5–7. The pH trend observed for k1 is characteristic for an excited state process that relies on protonation, and from the pH dependence plot (see ESI†) the pKa is around 4.3. The protonated form of anthraquinone (AQH) has a pKa of around −8.5 in water19 whereas the pKa for the conjugate acid of AQ˙− is ca. 5.3.20 Given these values it is unlikely that the ground-state complex will be protonated, but it is more probable in the excited state since C–O˙− is formerly produced (Scheme 2). A further protonation at this site opens up a decay pathway which may help explain the catalytic reaction. A loss of a water molecule is feasible as promoted by electron pair donation from the distal hydroxyl group as shown. This process is not accessible in the similar ruthenium complex supporting the non-hydroxyl version of the ligand as reported previously.7 Deprotonation would leave a quinoid-based ligand as its radical, which can be oxidised by the peroxide present to form the ruthenium(III) complex which is itself an oxidant. It is worth mentioning that the one electron reduction of hydrogen peroxide would also create the strongly oxidising hydroxyl radical (eqn (3) & (4)).21 The participation of the hydroxyl radical in facilitating oxidation of the ground-state complex cannot be ruled out. | (3) |
| HO˙ + H+ + e− ⇌ H2O E° = +2.73 V (vs. NHE) | (4) |
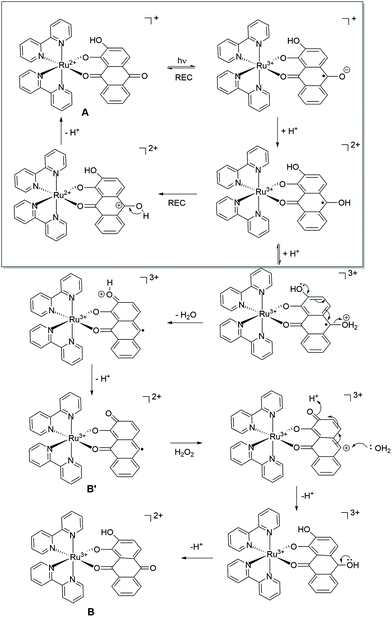 | ||
| Scheme 2 Proposed processes following excitation of Δ/Λ-RDAD in acidic water in the presence of hydrogen peroxide. The top part of the scheme depicts the dominant processes that occur within the several picoseconds time window. The bottom part is a minor pathway as promoted by protonation and water loss. The labels refer to the cyclic scheme shown in Fig. 4. | ||
It should be also mentioned that the dominant photoprocesses are illustrated in the top part of Scheme 2, and that the proposed peroxide-based reaction is a minor side reaction. This assumption appears reasonable since the proposed ruthenium(III) complex must firstly build-up to promote the autocatalytic reaction. The overall process is summarised in the insert of Fig. 4, where A is the starting complex and B′ and B are the ruthenium(III) complexes illustrated in Scheme 2. The redox reaction of A with B represents a self-exchange process, noting that cyclic nature of the reaction is broken when B further degrades by loss of the anthraquinone-based ligand.
Conclusions
Notwithstanding the ultrashort lifetime of RDAD the decomposition of the complex is achievable under white light excitation in the presence of hydrogen peroxide, releasing in the reaction the anthraquinone-based ligand. The autocatalytic process which facilitates the photoreaction would appear to be an advantageous way to enhance ligand loss, especially in quinone-based ligands that contain an additional OH group that is not employed in metal ion binding. This structure–reactivity relationship could be readily studied, especially focusing on the substitution position of the hydroxyl group and the autocatalytic behaviour. There are several anthraquinone compounds, such as emodin and chyrsophanol, which may display a similar release mechanism when complexed to a “Ru(II)(bipy)2” core. There is current interest in the photorelease of agents in cells and tumours for photodynamic therapy applications, and the release of anthraquinone compounds at specific sites may pave the way forward for targeted treatments. Alazarin, for example, is known to significantly and strongly impair both osteosarcoma and breast cancer tumorigenesis.22 The utilization of natural in situ oxidants (or reductants) coupled to autocatalysis in cells to enhance the photorelease of agents23 is a promising strategy that warrants further exploration.Experimental
All the chemicals were purchased from commercial sources and used as received without further purification. The complexes Δ/Λ-[Ru(bipy)2(py)2][(+)-O,O′-dibenzoyl-D-tartrate]·12H2O were prepared by the method of von Zelewsky.11 For the studies undertaken in water, ruthenium hexafluorophosphate salts were converted to chloride salts by using Amberlite® IRA-410 chloride form. Aqueous solutions were prepared using a PURELAB® Option-Q water purification system. High-field nuclear magnetic resonance (NMR) spectra including 1H-NMR, 13C-NMR, COSY, HSQC, HMBC were collected on a Bruker Advance III HD 700 MHz spectrometer. Chemical shifts for all complexes were reported relative to acetonitrile-d3 (Cambridge Isotope Laboratories, CD3CN, 99.8%) at δ = 1.940 ppm. FT-IR spectra were recorded on a PerkinElmer FT-IR Spectrum Two spectrometer. Chromatography experiments were performed on Agilent 1260 Infinity HPLC system equipped with Raptor C18 column (100 × 3 mm; 2.7 μm particle size) using water/acetonitrile 1/9 mixture as eluent (0.3 mL min−1) and compared to the solvent blank run. Diode Array Detector (1260 DAD VL+) was fixed in the spectral region of interest at 567 nm and at 250 nm to detect any non-photoactive impurities. High-resolution electron spin ionization (ESI) mass spectrometry was collected by National Mass Spectrometry Facility (NMSF) in Swansea.Preparation of Λ-RDAD
To a solution of Λ-[Ru(bipy)2(py)2][(−)-O,O′-dibenzoyl-L-tartrate]·12H2O (114.4 mg, 0.1 mmol, 1 eq.) in ethylene glycol![[thin space (1/6-em)]](https://www.rsc.org/images/entities/char_2009.gif) :
:![[thin space (1/6-em)]](https://www.rsc.org/images/entities/char_2009.gif) H2O (5
H2O (5![[thin space (1/6-em)]](https://www.rsc.org/images/entities/char_2009.gif) :
:![[thin space (1/6-em)]](https://www.rsc.org/images/entities/char_2009.gif) 1, 30 mL) was added alizarin (24 mg, 0.1 mmol, 1 eq.) and triethylamine (0.030 mL, 0.2 mmol, 2 eq.). The reaction mixture was shielded from light, stirred and heated at 120 °C under a nitrogen atmosphere for 4 h until all the starting material was consumed during which time the solution changed from orange to dark-red. The solution was cooled down to R.T. and Λ-RDAD was precipitated by addition of excess KPF6 from water. The black compound was collected by filtration and rinsed with distilled water and allowed to air dry overnight. 1H NMR (700 MHz, acetonitrile-d3) δ (ppm) = 8.76 (d, J = 5.3 Hz, 1H, 2,2′-bipyridyl), 8.62 (d, J = 5.8 Hz, 1H, 2,2′-bipyridyl), 8.52 (d, J = 8.2 Hz, 2H, 2,2′-bipyridyl), 8.42 (d, 1H, J = 8.4 Hz, 2,2′-bipyridyl), 8.41 (d, J = 8.5 Hz, 1H, 2,2′-bipyridyl), 8.14–8.02 (m, 3H, 2,2′-bipyridyl and alizarin ligand), 7.92–7.86 (m, 2H, 2,2′-bipyridyl), 7.86–7.78 (m, 2H, 2,2′-bipyridyl), 7.70 (t, 1H, J = 7.6 Hz, alizarin ligand), 7.62 (d, 1H, J = 8.2 Hz, alizarin ligand), 7.60 (t, 1H, J = 6.5 Hz, 2,2′-bipyridyl), 7.53 (t, 1H, J = 8.0 Hz, alizarin ligand), 7.51–7.45 (m, 3H, 2,2′-bipyridyl and alizarin ligand), 7.21 (t, 1H, J = 6.5 Hz, 2,2′-bipyridyl), 7.18 (t, 1H, J = 6.5 Hz, 2,2′-bipyridyl), 6.83 (d, 1H, J = 8.0 Hz, alizarin ligand). 13C NMR (176 MHz, acetonitrile-d3) δ 182.57, 180.06, 160.55, 159.89, 159.70, 159.07, 158.85, 158.60, 155.39, 155.01, 151.27, 151.08, 138.94, 138.50, 137.12, 136.77, 136.37, 134.89, 133.68, 133.06, 128.12, 127.91, 127.76, 127.74, 126.87, 126.68, 125.94, 124.68, 124.60, 124.59, 124.53, 122.38, 117.87, 112.90; FT-IR (cm−1) 431 w, 452 w, 556 s, 599 m, 648 w, 659 m, 668 w, 709 s, 728 s, 758 s, 831 vs, 877 w, 970 w, 1022 s, 1037 w, 1056 w, 1068 w, 1094 w, 1105 w, 1123 w, 1158 m, 1189 m, 1223 m, 1243 m, 1260 s, 1305 s, 1322 w, 1371 m, 1401 m, 1421 m, 1444 m, 1461 m, 1481 w, 1508 s, 1537 m, 1584 w, 1594 w, 1603 w, 1644 m, 1716 vw, 2853 w, 2924 w, 2955 w, 3075 w, 3357 vw br, 3585 vw, 3648 vw; NSI-FTMS (m/z): found [M − PF6+]: found 653.0745, calcd for C34H23N4O4Ru: 653.0767; HPLC (min): 9.25.
1, 30 mL) was added alizarin (24 mg, 0.1 mmol, 1 eq.) and triethylamine (0.030 mL, 0.2 mmol, 2 eq.). The reaction mixture was shielded from light, stirred and heated at 120 °C under a nitrogen atmosphere for 4 h until all the starting material was consumed during which time the solution changed from orange to dark-red. The solution was cooled down to R.T. and Λ-RDAD was precipitated by addition of excess KPF6 from water. The black compound was collected by filtration and rinsed with distilled water and allowed to air dry overnight. 1H NMR (700 MHz, acetonitrile-d3) δ (ppm) = 8.76 (d, J = 5.3 Hz, 1H, 2,2′-bipyridyl), 8.62 (d, J = 5.8 Hz, 1H, 2,2′-bipyridyl), 8.52 (d, J = 8.2 Hz, 2H, 2,2′-bipyridyl), 8.42 (d, 1H, J = 8.4 Hz, 2,2′-bipyridyl), 8.41 (d, J = 8.5 Hz, 1H, 2,2′-bipyridyl), 8.14–8.02 (m, 3H, 2,2′-bipyridyl and alizarin ligand), 7.92–7.86 (m, 2H, 2,2′-bipyridyl), 7.86–7.78 (m, 2H, 2,2′-bipyridyl), 7.70 (t, 1H, J = 7.6 Hz, alizarin ligand), 7.62 (d, 1H, J = 8.2 Hz, alizarin ligand), 7.60 (t, 1H, J = 6.5 Hz, 2,2′-bipyridyl), 7.53 (t, 1H, J = 8.0 Hz, alizarin ligand), 7.51–7.45 (m, 3H, 2,2′-bipyridyl and alizarin ligand), 7.21 (t, 1H, J = 6.5 Hz, 2,2′-bipyridyl), 7.18 (t, 1H, J = 6.5 Hz, 2,2′-bipyridyl), 6.83 (d, 1H, J = 8.0 Hz, alizarin ligand). 13C NMR (176 MHz, acetonitrile-d3) δ 182.57, 180.06, 160.55, 159.89, 159.70, 159.07, 158.85, 158.60, 155.39, 155.01, 151.27, 151.08, 138.94, 138.50, 137.12, 136.77, 136.37, 134.89, 133.68, 133.06, 128.12, 127.91, 127.76, 127.74, 126.87, 126.68, 125.94, 124.68, 124.60, 124.59, 124.53, 122.38, 117.87, 112.90; FT-IR (cm−1) 431 w, 452 w, 556 s, 599 m, 648 w, 659 m, 668 w, 709 s, 728 s, 758 s, 831 vs, 877 w, 970 w, 1022 s, 1037 w, 1056 w, 1068 w, 1094 w, 1105 w, 1123 w, 1158 m, 1189 m, 1223 m, 1243 m, 1260 s, 1305 s, 1322 w, 1371 m, 1401 m, 1421 m, 1444 m, 1461 m, 1481 w, 1508 s, 1537 m, 1584 w, 1594 w, 1603 w, 1644 m, 1716 vw, 2853 w, 2924 w, 2955 w, 3075 w, 3357 vw br, 3585 vw, 3648 vw; NSI-FTMS (m/z): found [M − PF6+]: found 653.0745, calcd for C34H23N4O4Ru: 653.0767; HPLC (min): 9.25.
Preparation of Δ-RDAD
This followed the preparation of Λ-RDAD but Δ-[Ru(bipy)2(py)2][(+)-O,O′-dibenzoyl-D-tartrate]·12H2O was used as the precursor. 1H NMR (700 MHz, acetonitrile-d3) δ (ppm) = 8.76 (d, J = 5.5 Hz, 1H, 2,2′-bipyridyl), 8.62 (d, J = 5.6 Hz, 1H, 2,2′-bipyridyl), 8.52 (d, J = 8.1 Hz, 2H, 2,2′-bipyridyl), 8.42 (d, J = 8.4 Hz, 1H, 2,2′-bipyridyl), 8.41 (d, J = 8.1 Hz, 1H, 2,2′-bipyridyl), 8.14–8.05 (m, 3H, 2,2′-bipyridyl and alizarin ligand), 7.95–7.87 (m, 2H, 2,2′-bipyridyl), 7.87–7.81 (m, 2H, 2,2′-bipyridyl), 7.70 (t, J = 7.6 Hz, 1H, alizarin ligand), 7.63 (d, J = 8.0 Hz, 1H, alizarin ligand), 7.61 (t, 1H, J = 6.5 Hz, 2,2′-bipyridyl), 7.55 (t, J = 7.6 Hz, 1H, alizarin ligand), 7.50–7.47 (m, 3H, 2,2′-bipyridyl and alizarin ligand), 7.21 (t, J = 7.6 Hz, 1H, 2,2′-bipyridyl), 7.19 (t, J = 6.8 Hz, 1H, 2,2′-bipyridyl), 6.83 (d, J = 7.9 Hz, 1H, alizarin ligand). 13C NMR (176 MHz, acetonitrile-d3) δ 182.12, 179.68, 160.15, 159.49, 159.29, 158.66, 158.44, 158.17, 154.99, 154.61, 150.88, 150.69, 138.52, 138.09, 136.66, 136.35, 135.96, 134.46, 133.31, 132.67, 127.72, 127.50, 127.36, 127.35, 126.45, 126.27, 125.54, 124.27, 124.19, 124.18, 124.11, 121.94, 117.46, 112.51; FT-IR (cm−1) 431 w, 452 w, 556 s, 599 m, 648 w, 659 m, 668 w, 709 s, 728 s, 758 s, 830 vs, 877 w, 970 w, 1022 s, 1037 w, 1056 w, 1068 w, 1094 w, 1105 w, 1123 w, 1158 m, 1188 m, 1223 m, 1243 m, 1260 s, 1305 s, 1322 w, 1371 m, 1401 m, 1421 m, 1444 m, 1461 m, 1481 w, 1508 s, 1537 m, 1584 w, 1594 w, 1603 w, 1644 m, 1732 vw, 2852 vw, 2922 vw, 2963 vw, 3075 vw, 3369 vw br, 3587 vw, 3648 vw; NSI-FTMS (m/z): found [M − PF6+]: found 653.0740, calcd for C34H23N4O4Ru: 653.0767; HPLC (min): 9.31.Photochemical kinetic experiments
UV–visible absorption properties under different conditions were collected on Shimadzu Spectrophotometer UV-1800 at a resolution of 0.5 nm with medium scan speed from range 300–1100 nm. For stability and photobleaching test, solar simulators calibrated with an AM 1.5G filter and equipped with a 150 W Xe lamp (SS-150 Series, Sciencetech Inc.) was used as the light source. A stability test of RDAD was carried out in CH3CN and distilled water (pH = 7) within few hours. The temperature of the cell was maintained constant at 20 °C.Photochemical degradation test
For the degradation kinetic studies, pH 2–13 aqueous solutions were used. The pH values were measured using a Jenway 3310 pH meter, utilizing a three point calibration with pH = 4.0, 7.0, and 10.0 buffer solutions. For all solutions the pH in time was measured and adjusted as necessary to keep it constant. The photochemical degradation reactions were initiated by adding freshly prepared 0.4 M H2O2 to 1 × 10⁻⁴ M RDAD aqueous solution with different pHs. The solution was bubbled with N2 for few minutes and irradiated under white light at R.T. At an appropriate time intervals, samples were taken and their UV-Vis absorption spectra were measured. All kinetic experiments were performed in duplicate.Transient absorption spectroscopy
Excited state dynamic processes in femtoseconds to nanoseconds timescales were studied using the pump–probe method as described in detail elsewhere.24 The fundamental light source at 800 nm was generated by a Ti:sapphire laser system (Libra F laser system, Coherent Inc.) which produced 1 mJ pulses with duration 100 fs at a 1 kHz repetition rate. Majority (∼90%) of the fundamental beam power was delivered to Optical Parametric Amplifier (OPA) (TOPAS C, Light Conversion Ltd) and was tuned to generate pump pulses at 410, 470 or 500 nm for RDAD. The pump beam diameter at the sample was around 0.5 mm and the power was attenuated by optical filters to excitation density at the sample <0.1 mJ cm−2. A small amount (∼10%) of the Libra-output light was delivered to the measurement system (ExiPro, CDP Inc.) which utilized a sapphire plate as a White Light Continuum (WLC) generator to produce the probe beam. The probe beam was then split into two parts: the probe signal and probe reference beams (∼0.1 mm diameter). The delay time limit for the machine is ∼6 ns. The signal and reference beams were passed through the sample and their spectra were measured by monochromator with a pair of array detectors. The gap between the wavelength ranges is due to strong WLC distortions caused by the fundamental (800 nm) pulse of the Libra laser. The transient absorption spectra were obtained by comparing responses with and without excitation using a chopper synchronized with the fundamental laser pulses and blocking every second pump pulse. ExiPro Program (CDP Corp.) was used to control the experiment and calculate the spectra. The sample solutions for pump–probe measurements were prepared to have absorbance between 0.2–0.8 optical densities (OD) in 2 mm cuvette used for the measurements and equipped with magnetic stirred bar. The optical scheme was aligned for maximum overlap of the pump and prove signal through the whole cuvette thickness. Zero reference time was found by looking for the start of signal build-up, with the delay line first set for the pump pulse hitting the sample after the probe pulse and moving the delay line so that pump started to overlap the probe in time. Steady-state absorption spectra were measured before and after the pump–probe measurement to confirm that the sample did not change during the measurement.Author contributions
In this paper, Dr Lingli Zeng took responsibility for designing this project, performing the experiments, data analysis, writing up the paper and the grant application. Dr Dumitru Sirbu took part in the experimental and data processing part. Prof. Nikolai Tkachenko from Tampere University of Technology is the collaborator and provided technical support for using the femtosecond pump probe spectroscopy. Prof. Andrew Benniston is the corresponding author in the project and applied for the RSC Researcher Mobility Grant.Conflicts of interest
There are no conflicts to declare.Acknowledgements
We thank the Royal Society of Chemistry Researcher Mobility Grant for financial support. The National Mass Spectrometry Facility at Swansea University is also thanked for collecting mass spectra.Notes and references
- (a) Y. Li and J.-G. Jiang, Food Funct., 2018, 9, 6063–6080 RSC; (b) S. Siddamurthi, G. Gutti, S. Jana, A. Kumar and S. K. Singh, Future Med. Chem., 2020, 12, 1037–1069 CAS; (c) W. Tian, C. Wang, D. Li and H. Hou, Future Med. Chem., 2020, 12, 627–644 CAS.
- (a) X. Dong, J. Fu, X. Yin, S. Cao, X. Li, L. Lin, Huyiligeqi and J. Ni, Phytother. Res., 2016, 30, 1207–1218 CrossRef CAS PubMed; (b) M. R. Gerhardt, L. Tong, R. Gómez-Bombarelli, Q. Chen, M. P. Marshak, C. J. Galvin, A. Aspuru-Guzik, R. G. Gordon and M. J. Aziz, Adv. Energy Mater., 2017, 7, 1601488 CrossRef; (c) B. Hu, J. Luo, M. Hu, B. Yuan and T. L. Liu, Angew. Chem., 2019, 131, 16782–16789 CrossRef.
- D. De Santis and M. Moresi, Ind. Crops Prod., 2007, 26, 151–162 CrossRef CAS.
- E. M. Malik and C. E. Müller, Med. Res. Rev., 2016, 36, 705–748 CrossRef CAS PubMed.
- L. Weisenthal, H. Liu and C. Rueff-Weisenthal, Nat. Preced., 2010, 1–1 Search PubMed.
- (a) A. DelMedico, P. R. Auburn, E. S. Dodsworth, A. B. P. Lever and W. J. Pietro, Inorg. Chem., 1994, 33, 1583–1584 CrossRef CAS; (b) A. DelMedico, S. S. Fielder, A. B. P. Lever and W. J. Pietro, Inorg. Chem., 1995, 34, 1507–1513 CrossRef CAS.
- L. Zeng, D. Sirbu, P. G. Waddell, N. V. Tkachenko, M. R. Probert and A. C. Benniston, Dalton Trans., 2020, 49, 13243–13252 RSC.
- (a) Z. Zhao, X. Zhang, C.-e. Li and T. Chen, Biomaterials, 2019, 192, 579–589 CrossRef CAS PubMed; (b) V. Ramu, S. Gautam, P. Kondaiah and A. R. Chakravarty, Inorg. Chem., 2019, 58, 9067–9075 CrossRef CAS PubMed; (c) P. Srivastava, K. Singh, M. Verma, S. Sivakumar and A. K. Patra, Eur. J. Med. Chem., 2018, 144, 243–254 CrossRef CAS PubMed.
- (a) H. Shi, T. Fang, Y. Tian, H. Huang and Y. Liu, J. Mater. Chem. B, 2016, 4, 4746–4753 RSC; (b) M. Mariappan, R. Alagarsamy, A. P. Panneerselvam, A. Veerappan, S. Rajendran and J. Arunachalam, J. Photochem. Photobiol., A, 2018, 356, 617–626 CrossRef CAS; (c) A. N. Hidayatullah, E. Wachter, D. K. Heidary, S. Parkin and E. C. Glazer, Inorg. Chem., 2014, 53, 10030–10032 CrossRef CAS PubMed.
- M. I. Sánchez, G. Rama, R. Calo-Lapido, K. Ucar, P. Lincoln, M. Melle-Franco, J. L. Mascareñas and M. Eugenio Vázquez, Chem. Sci., 2019, 10, 8668–8674 RSC.
- B. Kolp, H. Viebrock, A. von Zelewsky and D. Abeln, Inorg. Chem., 2001, 40, 1196–1198 CrossRef CAS PubMed.
- A. DelMedico, W. J. Pietro and A. B. P. Lever, Inorg. Chim. Acta, 1998, 281, 126–133 CrossRef CAS.
- S. Yoon, P. Kukura, C. M. Stuart and R. A. Mathies, Mol. Phys., 2006, 104, 1275–1282 CrossRef CAS.
- M. Taniguchi and J. S. Lindsey, Photochem. Photobiol., 2018, 94, 290–327 CrossRef CAS PubMed.
- A. DelMedico, E. S. Dodsworth, A. B. P. Lever and W. J. Pietro, Inorg. Chem., 2004, 43, 2654–2671 CrossRef CAS PubMed.
- R. Englman and J. Jortner, Mol. Phys., 1970, 18, 145–164 CrossRef CAS.
- C. Creutz and N. Sutin, Proc. Natl. Acad. Sci. U. S. A., 1975, 72, 2858–2862 CrossRef CAS PubMed.
- A. Kytsya, L. Bazylyak, Y. Hrynda, A. Horechyy and Y. Medvedevdkikh, Int. J. Chem. Kinet., 2015, 47, 351–360 CrossRef CAS.
- J. Hankache, D. Hanss and O. S. Wenger, J. Phys. Chem. A, 2012, 116, 3347–3358 CrossRef CAS PubMed.
- A. Babaei, P. A. Connor, A. J. McQuillan and S. Umapathy, J. Chem. Educ., 1997, 74, 1200–1204 CrossRef CAS.
- D. A. Armstrong, R. E. Huie, S. Lymar, W. H. Koppenol, G. Merényi, P. Neta, D. M. Stanbury, S. Steenken and P. Wardman, BioInorg. React. Mech., 2013, 9, 59–61 CAS.
- C. Fotia, S. Avnet, D. Granchi and N. Baldini, J. Orthop. Res., 2012, 30, 1486–1492 CrossRef CAS PubMed.
- D. Bartusik, M. Minnis, G. Ghosh and A. Greer, J. Org. Chem., 2013, 78, 8537–8544 CrossRef CAS PubMed.
- (a) F. Abou-Chahine, D. Fujii, H. Imahori, H. Nakano, N. V. Tkachenko, Y. Matano and H. Lemmetyinen, J. Phys. Chem. B, 2015, 119, 7328–7337 CrossRef CAS PubMed; (b) D. Sirbu, C. Turta, A. C. Benniston, F. Abou-Chahine, H. Lemmetyinen, N. V. Tkachenko, C. Wood and E. Gibson, RSC Adv., 2014, 4, 22733–22742 RSC.
Footnote |
| † Electronic supplementary information (ESI) available: NMR data, UV-vis decay data, pKa plot. See DOI: 10.1039/d1dt00952d |
| This journal is © The Royal Society of Chemistry 2021 |

