
 Open Access Article
 This Open Access Article is licensed under a
 Creative Commons Attribution 3.0 Unported Licence
Giant zirconium-bisphosphonate nano-ribbons and their liquid crystalline phase behaviour in water†
Dirk
Schmelter
a,
Rodolphe Nekui
Tagné
a,
Hector
Cortes-Sanchez
ba,
Jörn
Schmedt auf der Günne
 b,
Edmund
Welter
c and
Horst
Hintze-Bruening
*da
b,
Edmund
Welter
c and
Horst
Hintze-Bruening
*da
aBASF Coatings Division, Glasuritstr. 1, 48165 Münster, Germany
bInorganic Materials Chemistry, University of Siegen, Adolf-Reichwein-Str. 2, 57076 Siegen, Germany
cDeutsches Elektronen Synchrotron, A Research Centre of the Helmholtz Association, Notkestr. 85, 22607 Hamburg, Germany
dPaderborn University, Department of Chemistry, Warburger Str. 100, 33098 Paderborn, Germany. E-mail: hhb@mail.upb.de
First published on 6th May 2021
Abstract
In decimolar aqueous solutions, zirconium oxychloride octahydrate forms several micrometer long and approximately 15 nm wide thin ribbons through the reaction with excess amounts of the sodium salt of 1-hydroxyethane-1,1-diphosphonic acid (HEDP, known as etidronic acid). Primarily deduced from SAXS, TEM, EXAFS and solid-state NMR analyses, a consistent structural model enables congruous explanations for the colloidal behaviour of the purified ribbons as well as of their reaction products with ammonia and amines, respectively. Properties of the lyotropic, liquid crystalline phases are discussed in the light of potential applications in aqueous coatings.
Introduction
In the domain of metal phosphonates, zirconium monophosphonates are known to form low dimensional frameworks derived from the zirconium phosphates while the incorporation of bisphosphonates can be used to fabricate porous 3D materials.1The overwhelming part of the zirconium bibliography related to 1-hydroxyethane-1,1-diphosphonic acid (= HEDP or etidronic acid) which has been used in our group in the context of exfoliated α-zirconium phosphate (α-ZrP) platelets is covered by patents which represent 90% of 301 SciFinder references in February 2021. Products were claimed for the cleansing, polishing and pretreatment of metals as well as their application in adhesives, personal care products, pharmaceuticals, construction materials, fracturing fluids and dental implants. Furthermore, reaction products from zirconyl chloride with HEDP have been proposed as sorbents,2 ion exchangers,3,4 catalysts,5–7 proton conductors8 and recently as corrosion inhibitors for magnesium.9
The complexation of zirconium from ZrOCl2 with HEDP has been studied by Romanova et al. by using titration and 31P-NMR as a function of concentration, stoichiometry and pH.10,11 From the pH drifts, appearance of 31P NMR resonances and visual observations with regard to cloudiness, precipitation and viscosity as a function of KOH addition, the authors drew conclusions about the compositions and the nature of ligand bonding in the formed complexes. For a Zr![[thin space (1/6-em)]](https://www.rsc.org/images/entities/char_2009.gif) :HEDP ratio of one the authors speculated about a layered structure of a polynuclear 3:3 cluster in admixture with several other complexes. With excess ligand (Zr:HEDP = 0.5) they obtained a gel which liquifies upon the addition of excess base. Finally, Lytkin et al. have used HEDP for the study of other zirconium complex equilibria12 and Popov described how the formation of hydrated oxide nanoparticles from tri- versus tetravalent cations (Fe, Zr) can be modified through the stabilization of interfacial lattice planes by HEDP.13
:HEDP ratio of one the authors speculated about a layered structure of a polynuclear 3:3 cluster in admixture with several other complexes. With excess ligand (Zr:HEDP = 0.5) they obtained a gel which liquifies upon the addition of excess base. Finally, Lytkin et al. have used HEDP for the study of other zirconium complex equilibria12 and Popov described how the formation of hydrated oxide nanoparticles from tri- versus tetravalent cations (Fe, Zr) can be modified through the stabilization of interfacial lattice planes by HEDP.13
To the best of our knowledge, neither structural data for the Zr-HEDP complexes nor insights into their colloidal nature have been reported. This may inter alia be rooted in the reluctance of zirconium bisphosphonates to form crystalline compounds.14 Nevertheless, Zhang et al. obtained crystalline zirconium methylenebisphosphonate (Zr-MDP) via a solvothermal synthesis.15 It consists of chains of Zr octahedra with bridging mono- and bi-dentate HEDP ligands whereas Serre and Férey obtained a three-dimensional network by using hydrothermal conditions.16
Interestingly, Stavgianoudaki et al. were able to crystallize Ca-HEDP in the confined space of an alginate gel and reported its crystal structure.17 The eightfold coordination number (CN) of Ca in the layered structure involves both mono- and bidentate phosphonate groups as well as coordinated hydroxy ligands from HEDP. Ca2+ and Zr4+ both have a noble gas electron configuration and Zr4+ also forms complexes with a CN = 8 despite its 28 pm lower effective ionic radius.18
Here we describe the self-assembly of Zr-HEDP into nano-ribbons in the aqueous phase, give insights into the molecular structure of the amorphous material and highlight the role of the synthesis parameters, in particular the presence of different monovalent cations. The latter are known to interact with HEDP19 and their low dimensional reaction products with phenyl phosphonate20 as well as their three dimensional networks with ethylene bisphosphonate21 have been reported.
Experimental
Materials
Zirconium oxychloride ZrO(Cl)2·8H2O; CAS [13520-92-8] from Honeywell (≥99.5%), 1-hydroxyethane-1,1-diphosphonic acid (HEDP); CAS [2809-21-4] from Aldrich (60% in H2O) and 2-dimethylaminoethanol (DMEA); CAS [108-01-0] from BASF (≥99.6%) were used as supplied. LiOH powder (≥98%), NaOH pellets (≥98%), KOH powder (≥85%) and aqueous ammonia (25%) from Sigma-Aldrich were used as supplied. Deionized water was used for syntheses, purification and dissolution.Syntheses
If not noted otherwise a stock solution of HEDP (60 weight-%) is neutralized by the addition of the base solution (11, 17, 23 and 3 weight-% of LiOH, NaOH, KOH and NH4OH respectively) in amounts to formally neutralize 1.74 of the four P-OH protons of HEDP which raises the pH value of the solution to approximately 7. In a typical experiment 6.626 g of HEDP solution were mixed with 7.956 g of 5 M NaOH solution and subsequently 17.186 g of an 18.1 weight-% stock solution of zirconium oxychloride were added under magnetic stirring in air to yield a decimolar mixture with a solid content of 3.5% and a pH value of 2. For the hydrothermal syntheses such mixtures were placed in a 50 ml Teflon beaker which was heated for 72 h at 125 °C (if not noted otherwise) in a closed stainless steel vessel and retrieved under ambient conditions after a cooling phase with 5 K h−1.Purification
The crude gel obtained with Na-HEDP was diluted with deionized water (1:1 ratio) and the fluid was subjected to tangential flow fractionation over a polyethersulfone membrane (Biomax®, 1000 kDa equivalent pore size) using a Cogent μScale TFF system with a Pellicon XL module (Millipore, Burlington, MA, USA) until the filtrate was virtually free of chloride as suggested by the absence of visually detectable haze in a 3 ml sample laced with 50 μl of a 5 weight-% AgNO3 solution in dilute nitric acid (pH 1–2).
Colloidal processing
The TFF retentate (1 weight-%) was used tel quel or was freeze-dried: a 1–2 cm thick layer in a Petri dish was placed into a Christ Epsilon 2–4 LSC freeze drier (Christ GmbH, Osterode, Germany) and frozen at −85 °C before evacuation. Sublimation under 50 Pa was effectuated with shelf and ice-condenser temperatures of +20 °C and −20 °C respectively. For the final drying/desorption step the shelf temperature was raised to 40 °C and the pressure lowered to 1–10 Pa for approximately 1 h.Characterization
X-ray diffraction patterns were recorded on a SAXSess mc2 diffractometer (Anton-Paar, Graz, AT) using line collimation and Cu-Kα radiation. Small-angle X-ray scattering (SAXS) of the crude product and the TFF-purified reaction product was carried out on the ID02 high brilliance beamline of ESRF, Grenoble, France, using monochromatic radiation (λ = 0.1 nm), a source-sample distance of 65 m and sample–detector distances (31 m, 8 m and 1 m) to cover a typical q-range of 0.0025–11 nm−1. A RayoniX MX-170-HS CCD detector was used (89 μm effective pixel size, 1920 × 1920 px2). Intensities were corrected for empty glass capillaries. A further set of samples that comprised the dispersions of neutralized products was measured at the P12 beamline operated by EMBL Hamburg at the PETRA III storage ring (DESY, Hamburg, Germany). Samples were measured under flow within quartz capillaries of 0.9 mm inner diameter, a flow rate of 10 μl s−1 and taking 40 frames with an exposure time of 0.1 s. A Pilatus 6 M detector from DECTRIS (172 μm pixel size, 423.6 × 434.6 px2) was used at a fixed sample–detector distance of 4 m with an X-ray energy band of 10 to 20 keV.For transmission electron microscopy analysis, dispersions comprising between 1 and 5 weight-% of purified or the neutralized ribbons were diluted 50-fold with water and a 1 μl droplet was allowed to dry on a gold grid. Another drop of water was deposited on the dry sample and sucked off in order to remove soluble impurities. This process was repeated once. Alternatively, for crude reaction mixtures, the same dispersion volume was taken from a sediment phase after 30 min centrifugation at 6708 g. TEM was performed on a Tecnai G2 electron microscope (FEI, Hillsboro, NJ, USA) and a Helios G4 (Thermo Fisher Scientific) was used in low-dose scanning mode using a total 50 pA for HAADF detection. Selected area diffraction (SAD) was applied using an aperture of 2 μm. A direct electron detector Falcon (FEI, Hillsboro, NJ, USA) was used.
1H, 13C and 31P solid-state nuclear magnetic resonance (NMR) spectra of powders were measured on a Bruker Avance II spectrometer (magnetic flux density B0 = 7.05 T). Magic angle spinning (MAS) was performed using a Bruker 2.5 mm double resonance MAS probe at a sample spinning frequency of 20 kHz. The chemical shift scales of 1H, 13C and 31P refer to the IUPAC standards22 and were set using the frequencies of 1 weight-% Si(CH3)4 in CDCl3 and 85% H3PO4 as external references and the IUPAC Ξi values. Spin–lattice relaxation times and peak areas were determined by spectral deconvolution using deconv2Dxy.23
Zr K-edge extended X-ray absorption fine structure (EXAFS) spectra were measured in transmission mode at beamline P65 at the PETRA III storage ring (DESY, Hamburg). Spectra of solids were measured at 10 K using the Si 311 double crystal monochromator (DCM) while the spectra of the dispersed ribbons (w = 0.05) were measured at ambient temperature using the Si 111 DCM. Higher harmonics radiation was rejected using two Rh-coated plane mirrors at an angle of incidence of 2 mrad. The energy axis of the DCM was calibrated using the first inflection point in the X-ray absorption spectrum of a Zr foil (17998 eV). The beam size on the sample was 1.5 × 0.3 mm2 with a monochromatic X-ray flux of approx. 5 × 10¹¹ s−1. Continuous synchronised scans of DCM and undulator (5th harmonic) started 150 eV below the Zr K-edge and ended 1000 eV above the edge. EXAFS spectra were evaluated using the Demeter24 and Larch25 software packages following standard procedures. Theoretical scattering paths were calculated using FEFF 6.26 Detailed information about the EXAFS evaluation procedure can be found in the ESI.†
FEFF input files were either based on x/y/z coordinates of published bisphosphonate compounds or created from structural models by using the Avogadro 1.1.1 molecule designer.27 Angles and bond distances were measured in the molecules by exporting the molecules in the protein database format (pdb) and importing them into Vesta 3.4.6,28 a 3D visualization program which was also used to produce plots of the molecules.
Rheological characterization was performed on an Anton-Paar rheometer MCR302 with cone plate CP50-1-SN6017 at 23 °C using a cone plate distance of 0.05 mm at a constant frequency of 1 Hz.
Cross-polarized light microscopy was performed with an Olympus BX51 microscope (Olympus, Shinjuku, Tokyo, Japan) equipped with an UM Plan FI-lens and an XC10 digital camera. A droplet of the sample was deposited on a glass slide and optionally covered with a cover slip under ambient conditions.
Zr- and P-contents were determined by inductively coupled plasma optical emission spectrometry (ICP-OES) on an Ametek Spectroblue TI (Ametek Inc., Newark, DE, USA). 1 ml of sample solution was typically diluted with 49 ml of water and 1 ml of nitric acid (65%) was added before measurement. TGA was carried out using a Shimadzu DTG-60 (Shimadzu Corp., Kyoto, Japan) with an alumina cell at a heating rate of 10 K min−1 under a nitrogen atmosphere.
Results and discussion
A survey of effectuated syntheses is given in Table 1. Spurred by the findings of Romanova et al.10,11 and based on an own screening using Na-HEDP all experiments reported here were conducted with a fixed ratio of base to HEDP and an unchanged decimolar concentration of the latter (cf. experimental) due to the unique behaviour of the mixture Na-2. This system yields a translucent, strong gel overnight, whereas controls without a base or at centimolar concentration remain as low viscous liquids over at least 24 months. Under hydrothermal conditions (Na-2-ht), a clear, water thin liquid was obtained which contained several ≈20 μm thick and millimeter long fibres (Fig. SI 1†). In contrast, the equimolar precursor ratio causes quick precipitation of a coarse grainy matter (Na-1, Na-1-ht). Hydrothermal conditions, change of stoichiometry and alternative monovalent cations were used with the intention to obtain crystalline phases if not single crystals. However, X-ray diffraction (XRD) of powders and of the Na-2-ht fibres revealed that all obtained solids are amorphous materials (not shown). We note that variants of Na-2-ht with added fluoride or synthesized at higher temperature (200 °C, denoted as Na-2-ht-473) yielded either amorphous powder or zirconium phosphate crystals according to polarized optical microscopy and XRD, respectively (shown for NaZr2(PO4)3·H2O, Fig. SI 2†). Nevertheless, LiOH as well as NH4OH treated HEDP leads to slightly hazy, birefringent liquids (Fig. SI 3†). Transmission electron microscopy (TEM) analysis of Li-1-ht and A-1-ht reveals networks of amorphous, aggregated particles, whose size can only be estimated to be in the range of 2–5 nm (Fig. SI 4†). These are also found in the optically isotropic liquid that was obtained with KOH (K-2-ht, Fig. SI 4†).| Base | Process | HEDP:Zr |
Denom. | Colloidal state |
|---|---|---|---|---|
| LiOH | Ambient | 1 | Li-1 | Birefr. liquid |
| 2 | Li-2 | Birefr. liquid | ||
| Hydrothermal | 1 | Li-1-ht | Birefr. liquid | |
| 2 | Li-2-ht | Birefr. liquid | ||
| NaOH | Ambient | 1 | Na-1 | Precipitate |
| 2 | Na-2 | Transl. gel | ||
| Hydrothermal | 1 | Na-1-ht | Precipitate | |
| 2 | Na-2-ht | Fibres | ||
| KOH | Ambient | 1 | K-1 | Clear liquid |
| 2 | K-2 | Clear liquid | ||
| Hydrothermal | 1 | K-1-ht | Clear liquid | |
| 2 | K-2-ht | Clear liquid | ||
| NH3 | Ambient | 1 | A-1 | Birefr. liquid |
| 2 | A-2 | Birefr. liquid | ||
| Hydrothermal | 1 | A-1-ht | Birefr. liquid | |
| 2 | A-2-ht | Birefr. liquid |
Pristine Na-2 gel and its nano-ribbons
Small angle X-ray scattering (SAXS) shows that the gel – in contrast to the acidic reference without NaOH – has two neighboring linear scattering regimes of I(q) ∝ q−x with x = 2.4 (higher q-range) and x = 1.8 (lower q-range), both with R2 ≥ 0.9996 and a transition around q = 0.4 (d ≈ 15 nm) (Fig. 1). Both suggest low dimensional objects whereof those of lower dimension (x = 1.8) are extending into the micrometer range. Three harmonic peaks at larger q-values indicate lamellar stacking (q = 2.94 nm−1d = 2.1 nm). In conjunction with the second linear domain – a slope of −2 is expected for 2D objects – the scattering result suggests the presence of 2D objects like ribbons with a large aspect ratio (L/W) in the order of at least 200 (L ≥ 3000 nm, W ≈ 15 nm). These might be stacked or they are composed of regularly assembled building blocks (d = 2.1 nm). The second interpretation is supported by a Kratky plot (I(q) × q2 = f(q)) of the peak at q = 2.94 nm (Fig. SI 17†). The tailing and intensity increase at the larger q-value side can be attributed to periodicity along a very thin object in analogy to the unfolding of compact proteins.29 The slopes of the linear domains are larger than the theoretical ones for 1D and 2D particles of one and two, respectively. This is often associated with fractal like interfaces. Here, the interface might be covered by excess Na-HEDP (cf.Fig. 2a) and partial alignment of sections of the ribbons would add a structure contribution to the 1D scattering domain (cf.Fig. 2b and 3). | ||
| Fig. 1 SAXS of Na-2 (blue) versus a control batch without NaOH (red). The inset details the WAXS region with three harmonic peaks for Na-2. | ||
 | ||
| Fig. 2 High angle annular dark field (HAADF) TEM image of (a) Na-2 and (b) sediment phase of Na-2. Scale bars are 2 μm. | ||
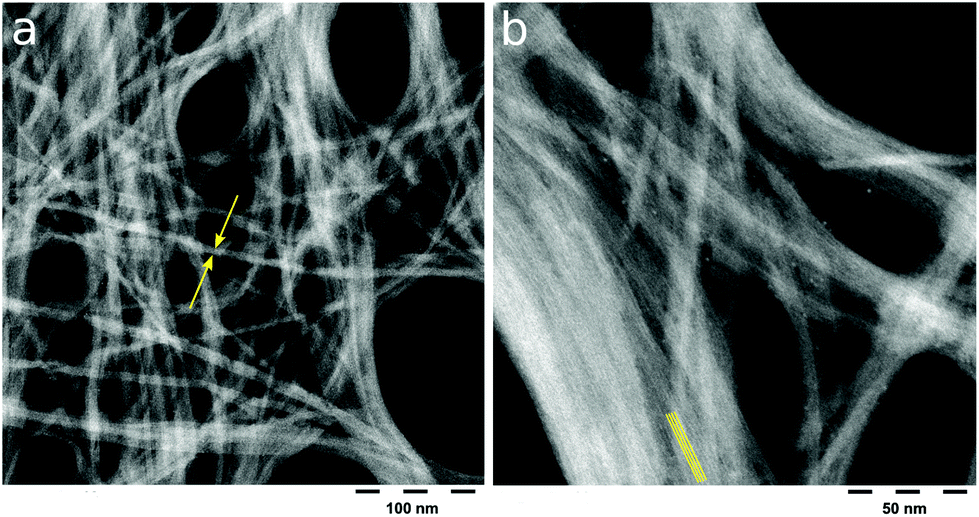 | ||
| Fig. 3 HAADF high-resolution TEM images of purified Na-2 nano-ribbons. (a) Scale bar 100 nm; arrows highlight the average width of 15 nm. (b) Scale bar 50 nm, lines are a guide for the eyes to the fine structure with 2 nm spacing. The latter is confirmed by fast Fourier transformation of the picture (Fig. SI 18†). | ||
Indeed, TEM analysis of the pristine gel as well as of a sediment phase from the diluted gel confirms the presence of extended 1D objects (Fig. 2) which were separated from excess HEDP-Na and NaCl through centrifugation. Under higher magnification the apparent wires emerge as nano-ribbons (Fig. 3) which display parallel lines with a spacing of approximately 2 nm which is in good agreement with the repeat distance measured by SAXS. Energy-dispersive X-ray spectroscopy (EDX) analysis of the ribbons from the sediment phase reveals a ratio of Zr:P:O = 1:2:13.4 and a varying sodium content (nota bene: Zr- and P-free background). Selected area diffraction (SAD) confirms a lack of order in the subnanometer range. Rings reveal atomic distances of 2.5, 3.2 and 3.8 Å and more diffuse zones indicate distances of around 4.5 and 6 Å (Fig. SI 5†).
Purified, freeze-dried Na-2 ribbons
Since centrifugation of Na-2 in reasonable dilutions failed to yield significant amounts of nano-ribbons within affordable times, tangential flow fractionation (TFF) over a polyethersulfone membrane was chosen for purification on a preparative scale (cf. experimental part). Virtually chloride-free retentates with a typical non-volatile content of 1 weight-% could be obtained within one working day.Freeze-drying of the purified dispersion yields a brittle, translucent film (Fig. SI 6†). When ground into a powder the material releases 11 ± 1 weight-% physisorbed water below 200 °C as shown by thermogravimetric analysis (TGA, Fig. SI 7†). The lack of a long-range order of the nano-ribbons, as suggested by SAD (vide supra), is confirmed by powder XRD (Fig. SI 8†). However, a hump at (2θ = 4.2°) corroborates the repeat distance of 2.1 nm detected with SAXS and HRTEM. Inductively coupled plasma optical emission spectrometry (ICP-OES) reveals a phosphorus to zirconium ratio of 2.67 and distinctly more sodium than chloride: 2100 ppm Zr, 1900 ppm P, 360 ppm Na, and <10 ppm Cl. The overall yield is 86% and 57% with respect to zirconium and HEDP, respectively, whereas 17% of sodium was retrieved. Such material was used for measuring the extended X-ray absorption fine structure (EXAFS) and to record solid state nuclear magnetic resonance (NMR) spectra.
Solid-state NMR
The 13C {1H} MAS NMR spectrum of purified Na-2 displays two signals at 17.3 ppm and 68.6 ppm which can be assigned to the methyl group and to the geminal carbon of P–C–P, respectively (Fig. 4a). Free HEDP gives rise to a basically identical spectrum with signals at 15.9 ppm and 68.9 ppm. This suggests that the integrity of the P–C–P group of HEDP persists in Zr-HEDP.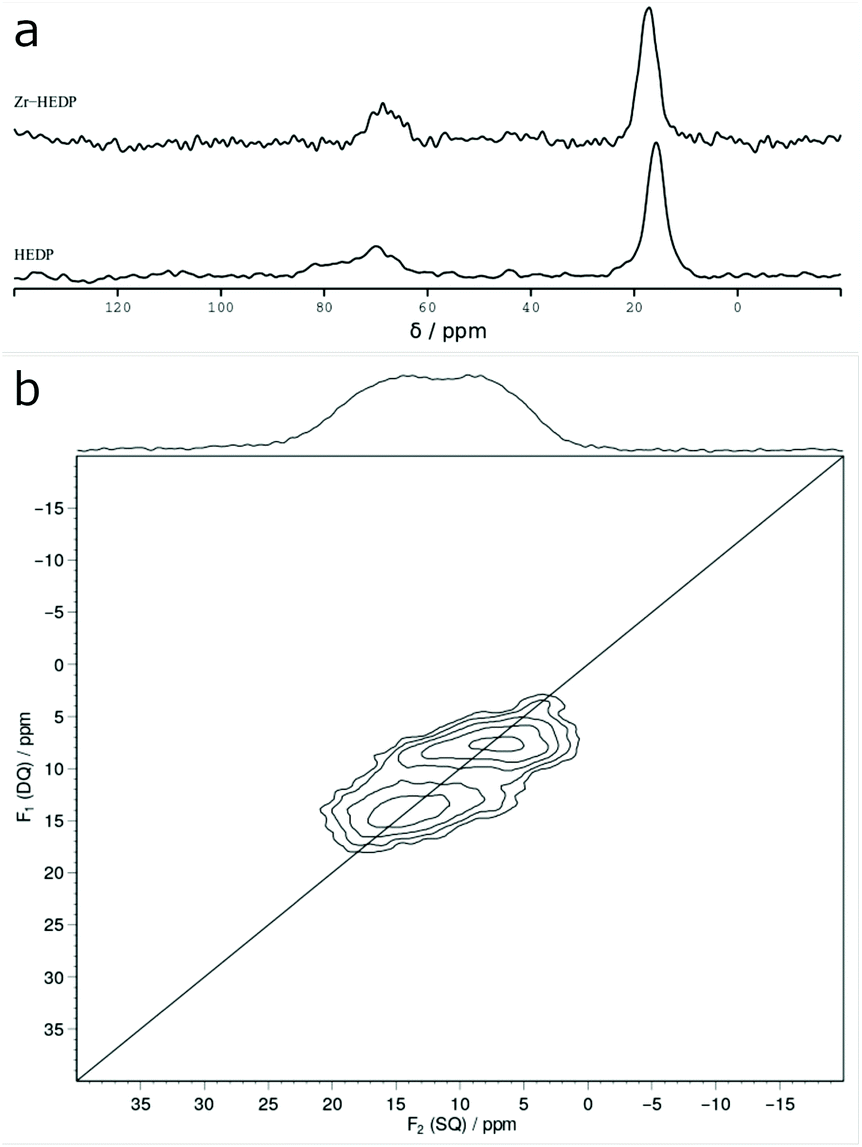 | ||
| Fig. 4 Solid state NMR analysis. (a) 13C {1H} cross-polarization MAS NMR spectra of HEDP and purified Na-2. (b) 31P MAS single-quantum (SQ) double-quantum (DQ) correlation 2D NMR spectrum of purified Na-2 obtained with a rotor-synchronized INADEQUATE experiment and an excitation period of 3 ms. | ||
Homonuclear 31P MAS single-quantum (SQ) double-quantum (DQ) correlation of Zr-HEDP (Fig. 4b) unravels the presence of two different phosphonic groups (δ = 8.8/13.2 ppm). The equivalent species correspond to different HEDP molecules which each feature a non-zero J(31P,31P) coupling that is required for the generation of double-quantum coherence intensity.
Extended X-ray absorption fine structure (EXAFS)
The Fourier transformed EXAFS spectra (measured at 10 K) of the purified, dried Na-2 ribbons and the poly-crystalline grains of Na-2-ht-473 are plotted in Fig. 5. The crystals from the hydrothermal synthesis have been identified with powder XRD analysis as NaZr2(PO4)3·H2O (Fig. SI 2†) where each Zr is surrounded by 6 oxygen atoms in the first shell (DOI: 10.17188/1280719). A simple first shell fit of this spectrum yields a value of S02 of 0.85 (±0.086). For Na-2, the almost congruent first shell peak indicates that the Zr absorber atoms in both samples have a similar ligand sphere. Nevertheless, a simple first shell fit using the value for S02 that was found for the Na-2-ht-473 sample and a simple model with just oxygen atoms in the nearest neighbourhood suggests a zirconium coordination number (CN) of 8 in Na-2 although with a significant uncertainty of approximately ±1 O-atom.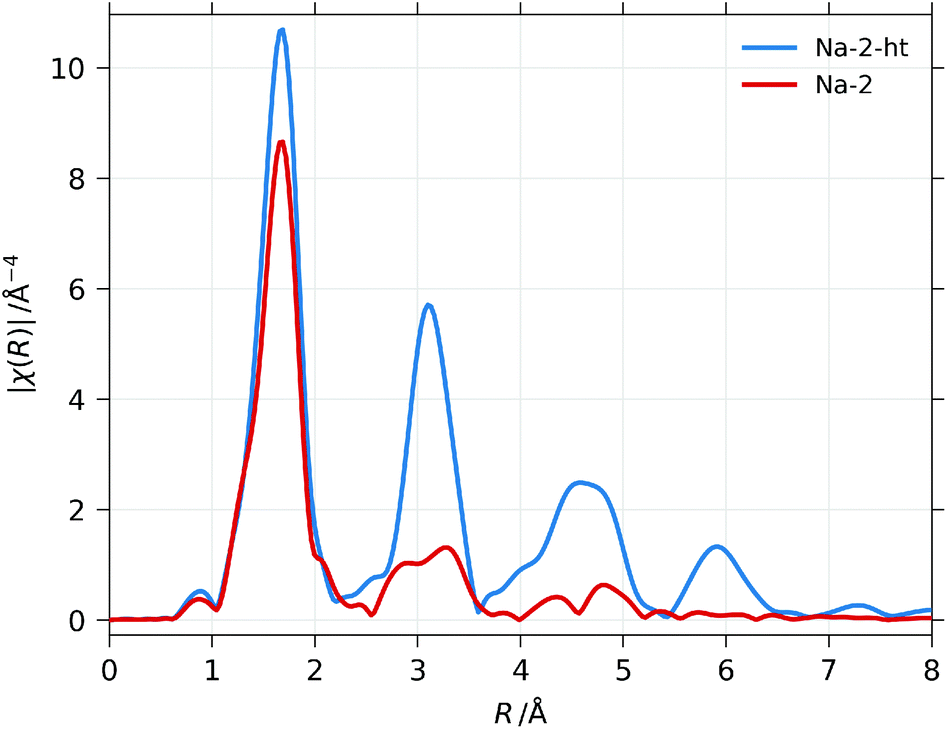 | ||
| Fig. 5 Fourier transformed k2χ3(k) EXAFS data of purified Na-2 (red) and of crystalline zirconium phosphate from Na-2-ht-473 (blue). | ||
However, it is evident that X-ray absorption of the second coordination sphere in the 3D structure of the phosphate (peaks around 3 Å) is almost absent in Na-2 which suggests a lower dimensional framework with a smaller number of Zr and/or P atoms at distances larger than 2 Å.
Structural model
A plausible structure for the Zr-HEDP ribbons has to fulfill the following criteria:• Atomic ratio P:Zr = 2 (Zr:HEDP = 1).
• Zirconium CN = 8 ± 1.
• Two phosphonate states, equivalent ones being proximate.
• 2D structure with d = 2.1 nm.
In addition, the model should consistently explain the observed colloidal properties of the purified ribbons as well as of their reaction products with ammonia or amine (cf. next chapter). Furthermore, with regard to the role of sodium and the stoichiometry which seem to be crucial for the formation of the nano-ribbons, we stipulate that preferential growth of Zr-HEDP nano-ribbons in one dimension depends on the presence of Na-HEDP as a template. The interaction of sodium cations with bisphosphonates had been studied as a function of the pH value and different substituents of the methylene group in 1,1-bisphosphonates.19,30 Furthermore, several crystalline sodium (bis)phosphonates have been reported20,21 and etidronate derived, Cu31,32 and Zn33 based products were obtained in the presence of amines or sodium salt.34
Finally, in order to cover the observed large spacing of 2.1 nm in the ribbons, we take into account the nature of the zirconium precursor. It consists of square tetranuclear clusters with each zirconium linked through two bridging hydroxyl ions with each of its neighbours. Four additional water ligands complete the coordination shell (CN = 8).35 Each zirconium may react with one HEDP molecule through mono-or bi-dentate phosphonate attachment liberating the equivalent amounts of former water ligands and NaCl.
Intact Zr4O24 clusters that are linked via four HEDP molecules, each of them bound to one zirconium and one sodium through their opposing –PO3 groups, allow for rather low stress bearing strips with a repeat distance of d = 2.1 nm (Fig. 6a) according to the universal force field optimization of the Avogadro analysis platform.27 Although we cannot exclude bi-dentate –PO3 attachment, this should impart higher strain. The low intensity and broadness of the peaks in SAXS (Fig. 1) may reflect a poor correlation length (low number of repeat units) and possibly distance fluctuations caused by a flexible L–Na–L conformation and a sodium hydronium equilibrium (pristine Na:HEDP = 1.75). In order to extend across the ribbons’ width the strips comprise seven repeat units. These are oriented and stacked transversely with respect to the ribbons’ growth direction, cohesively linked through van der Waals attraction and hydrogen bonding between adjacent methyl, hydroxyl and P–OH groups, respectively.
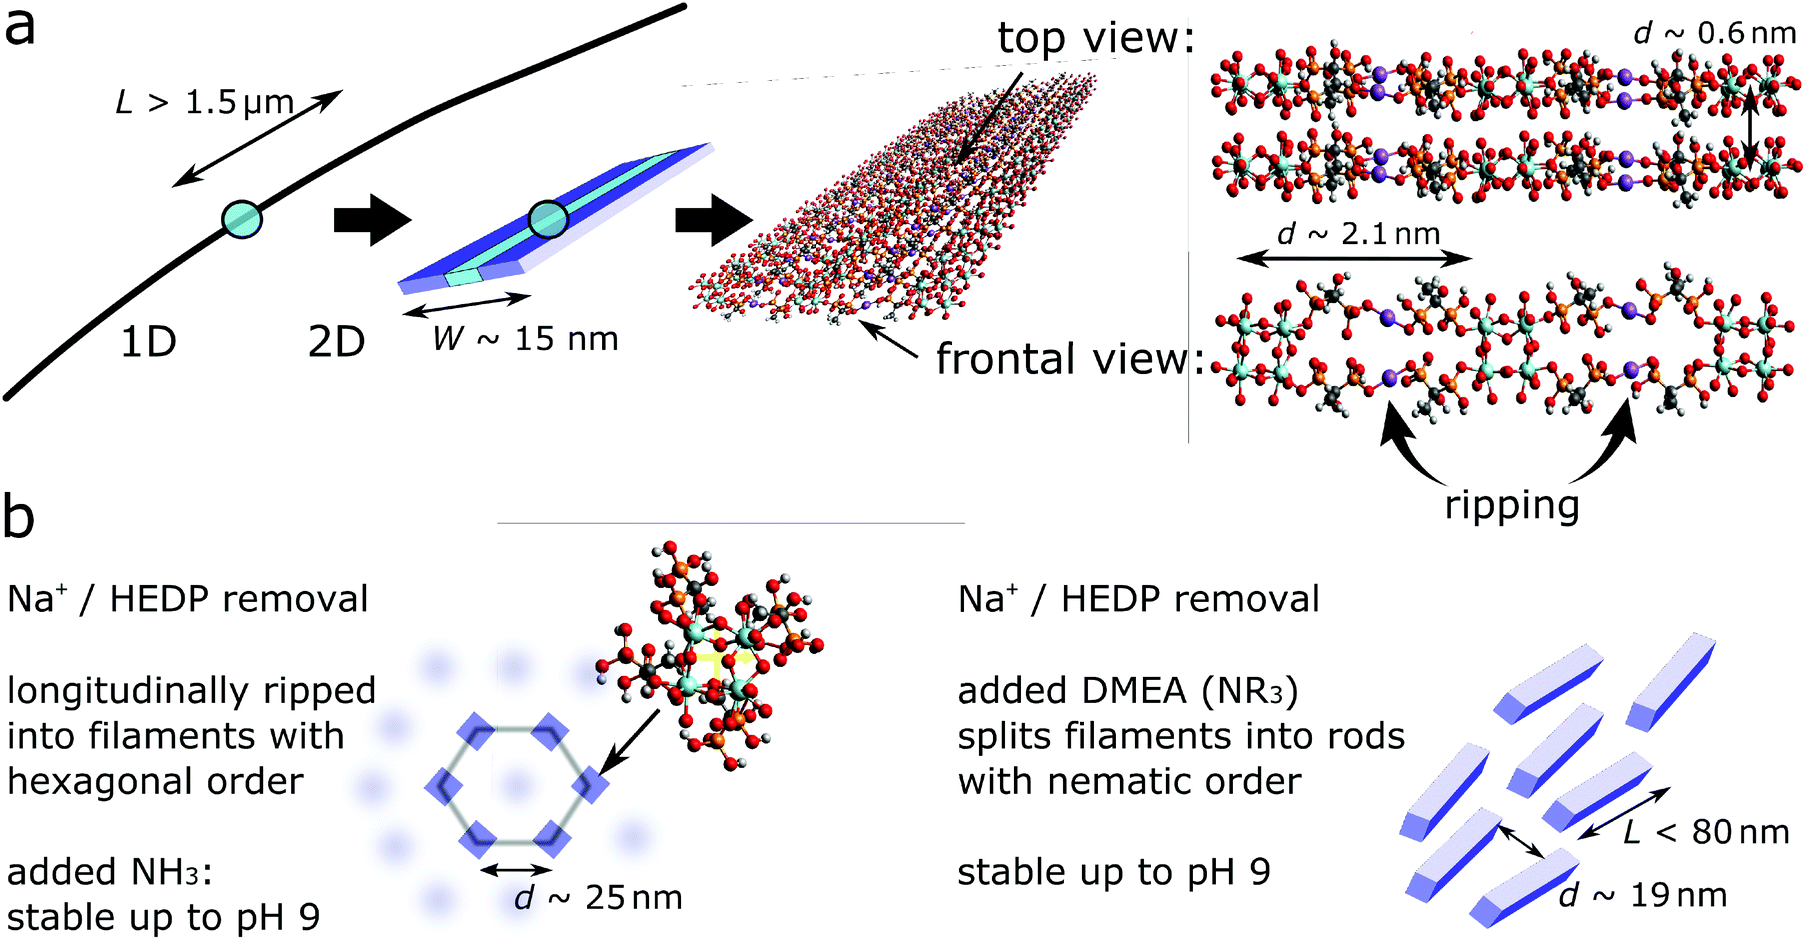 | ||
| Fig. 6 (a) Structural model of the nano-ribbon framework (Zr = blue, Na = purple, P = yellow, C = grey, O = red, H on ligands omitted). (b) Colloidal scenarios of nano-ribbons. Extraction of Na+ by TFF leads to ripping of the ribbons into filaments that adopt a hexagonal order. They are stable if neutralized with NH3 or they fall apart into short rods which align into nematic order if neutralized with amines like dimethyl ethanol amine. | ||
This model is supported by the findings of Singhal et al.36 and Cho et al.37 who studied the colloidal behaviour of ZrOCl2 in acidic solutions by means of SAXS and EXFAS, respectively. The scattering results revealed an equilibrium between monomeric and aligned Zr-tetramers (denoted as octamers). With increasing pH value, the latter dominate and form oligomers. The existence of larger colloidal species was confirmed by Cho et al. by means of the non-equilibrium LIBD technique. The authors interpreted their corresponding EXAFS results, in particular a faint peak for the Zr–Zr interaction with a radial distance around three Ångström, with the presence of Zr-tetramers that comprise a highly disordered Zr-sub-lattice and a distinct geometric variability of the primary Zr coordination sphere.
Indeed, trials to fit the experimental EXAFS curve of Na-2 with calculated EXAFS spectra for a number of different frameworks, including models with 6, 7 and 8 nearest oxygen neighbours, corroborate the proposed structure. In general, models with 8 oxygen neighbours in the first shell, 2 Zr and 1 P atom in the second shell turned out to work best. These shells cover a radius of 3.5 Å to 4.0 Å around the Zr-absorber atom. Furthermore, the most successful models always contained a Zr4O24 unit like that of ZrOCl2 octahydrate.
However, EXAFS fits of the measured spectra cannot provide structural information at larger distances from the Zr atoms, meaning the second P atom in the diphosphonic acid and the fourth Zr atom of the central Zr4O24 cluster and therefore a significant part of the proposed structure remains “invisible” to EXAFS. Nevertheless, the EXAFS data of Na-2 as well as those of its NH3 neutralized derivative (vide infra, Fig. 9a) could successfully be fitted by using a structural increment that consists of the Zr4O24 unit with one mono-dentate HEDP ligand attached to each zirconium (Fig. SI 10†). The results are shown in Fig. 9b for the neutralized dispersion and in Fig. SI 9b† for the parent Na-2 dispersion. Details about the procedure and the reasonably few fitting parameters which comprise single and multiple scattering paths are found in the ESI (Tables SI 1 and SI 2†). Whereas the EXAFS results support the proposed structural model they can exclude neither bi-dentate HEDP attachment nor the presence of an additional light back-scattering atom like O or N at a distance of 2.7 Å. These could be loosely bound water or ammonia in the case of the neutralized dispersion (cf. Tables SI 1 and SI 2†).
Finally, we note that the ribbon thickness (T) cannot be deduced unambiguously from the present results. Other techniques like atomic force microscopy (AFM) would be needed to reveal conceivable stacking of few ribbons. In this respect the repeat distance d = 2.1 nm, found with SAXS and TEM, across the ribbon width (W ≈ 15 nm) is not to be confounded with a 3D lamellar stacking of objects that are spanning into two dimensions.
Colloidal states of Na-2 ribbons
The removal of excess HEDP-Na and NaCl from Na-2 yields a slightly hazy, low viscous dispersion of nano-ribbons (1 weight-%) which are ordered in a lyotropic liquid crystalline phase as shown by birefringence in cross polarized light (Fig. 7a). The amplitude sweep of the purified nano-ribbon dispersion reveals three domains with increasing deformation (Fig. 7c). Slightly above a shear stress of 0.1 Pa the viscosity drops, which is predominantly caused by a decline of the storage modulus (G′). This can be attributed to macroscopic orientation of ordered domains in the shear field above a threshold stress. Subsequently, an apparent G′ plateau (actually a broad hump) is followed by a minimum of the loss modulus G” slightly above 1 Pa. This reflects disentanglement of the 1D nano-particles which eventually leads to vanishing G′ and friction in the flow field.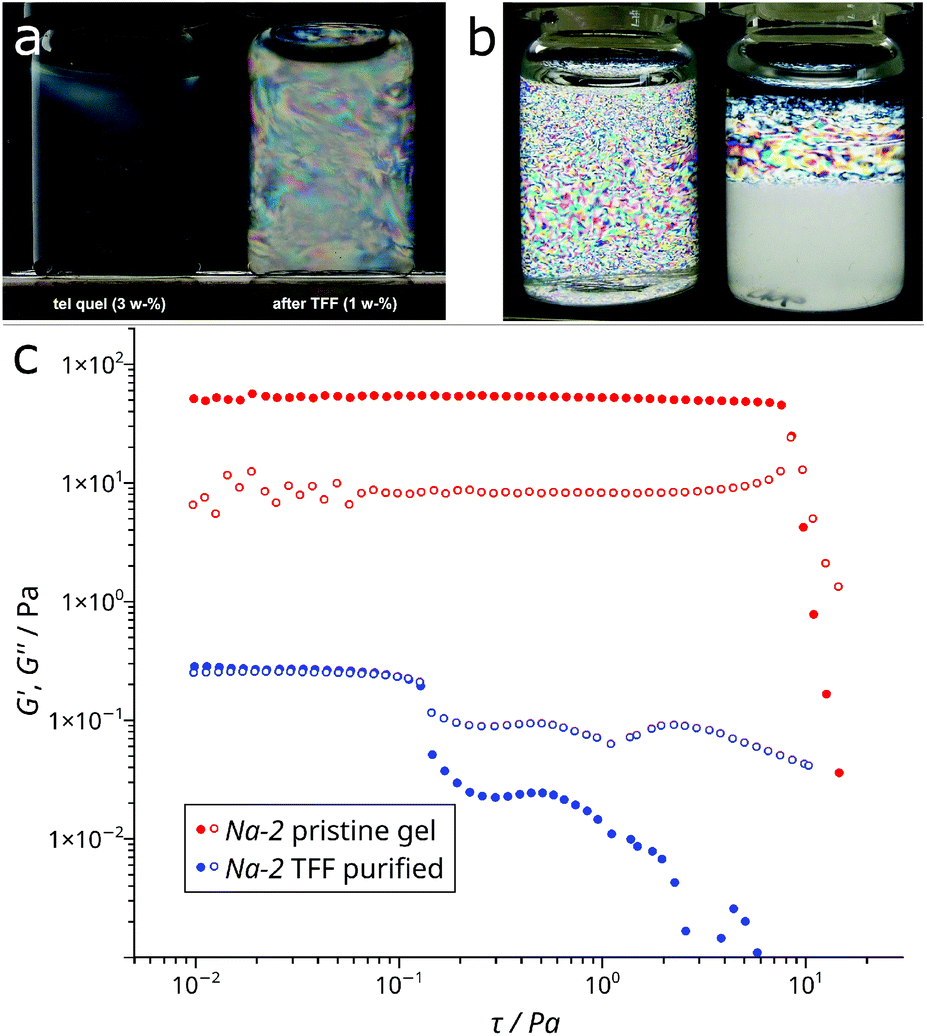 | ||
| Fig. 7 (a) Birefringence of the crude gel of Na-2 (left vial) and of the TFF purified Na-2 (right vial). (b) Birefringence of the DMEA (left) and of the NH3 (right) neutralized TFF purified dispersion of Na-2 (pH 8, aged for three months). (c) Amplitude sweeps (solid symbols = G′) reveal the fluidity of the purified ribbons under shear. All dispersions comprised 1 weight-% ribbons, in contrast to the solid contents of the pristine gel (3 weight-%). | ||
SAXS of the dispersion which was measured under flow confirms the colloidal order. It displays a set of peaks that are apparently caused by a lamellar phase (Fig. 8). However, its expected 2nd and 3rd harmonic peaks do not match the positions of found intensity maxima. These reflections can best be interpreted as overlapping peaks caused by hexagonally arranged objects with a mean spacing of d ≈ 26 nm. We note that the peak at q = 2.94 nm−1 for the Zr4O24 repeat distance, which is still detected in the diluted gel, is nearly absent in the curve of the purified ribbons. Only a faint, broad hump around q ≈ 2.7 nm−1 can be identified in the zoomed region (Fig. SI 11†).
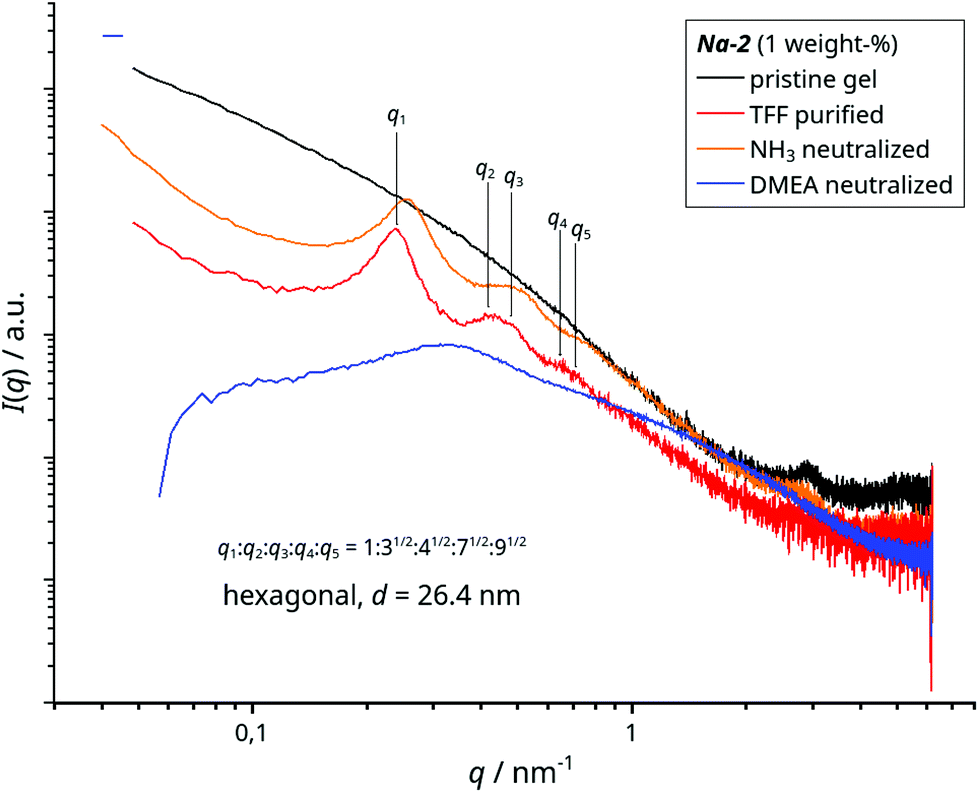 | ||
| Fig. 8 SAXS of Na-2, the pristine, diluted gel and of dispersions of the TFF-purified nano-ribbons: tel-quel as well as NH3 and DMEA neutralized (all 1 weight-%). | ||
Impact of base addition on the Na-2 ribbons
The proposed metal–organic framework of the Na-2 ribbons comprises acidic P–OH groups that do not coordinate zirconium and sodium, respectively. Since a pH value of 2.7 of its dispersion would not be suitable for coating application we neutralized them with ammonia and dimethylethanol amine (DMEA), respectively. Roughly 0.8 equivalents are consumed per Zr-HEDP unit (Fig. SI 12†) which is reasonable in the light of 1.26 “free” P–OH groups in the case of mono-dentate attachment (= 4–1.74–1). Either base clears the haze of the pristine dispersion, slightly increases its viscosity (not shown) and intensifies its birefringence in polarized light (Fig. 7b).However, the phase behaviour over time and the colloidal states differ, whether ammonia or DMEA is used for neutralization (Fig. 7b). We note that the purified, acidic nano-ribbons (1 weight-%, pH 2.7) also phase separate but at a distinctly lower rate than the ammonia treated ribbons. Nevertheless, in dilution the rate increases and snapshots of the phase separation show gradually coarsened birefringent textures in a fresh sample as well as in the prematurely separated supernatant and sediment (Fig. SI 13b†). Over time the birefringence in the sediment loses the texture (Fig. 7b, not shown for acidic ribbons) and SAXS reveals a shift of the peaks to higher q-values (Fig. SI 13c†) while peak shapes and q-ratios are identical to those of the original, acidic dispersion (Fig. 8). This proves that the neutralized ribbons keep the hexagonal order and that the inter-particle distance shrinks with the increasing volume fraction of the ribbons in the sedimenting phase. On the other hand the scattering curve that is caused by the DMEA treated nano-ribbons (Fig. 8) just forms a broad hump with a maximum at q = 0.33 nm−1 before the intensity vanishes around q ≈ 0.08 nm−1. This can be interpreted as a nematic phase of short 1D objects (L ≤ 80 nm) with an average distance of d = 19 nm−1 as visualized in Fig. 6b. TEM analysis supports the SAXS results. In contrast to NH3 neutralized nano-ribbons, their DMEA treated counterparts leave marginal amounts of narrow strings on the sample holder (Fig. SI 14†). It is reasonable to assume that the repeated washing in the sample preparation for TEM analysis removes the major part of dispersed matter in the form of the ribbons’ fragments.
The different colloidal behaviour between NH3 and DMEA neutralized Na-2 dispersions suggests chemical degradation of the nano-ribbons through DMEA. However, congruent curves of EXAFS data for the neutralized dispersions prove that the inner coordination sphere of zirconium stays intact throughout the different dispersions of Na-2 (vide supra, Fig. 9 and Fig. SI 9a, b†). Therefore we stipulate that the amphiphilic DMEA-H+ ions weaken the cohesive strength of the stacked Zr4O24 clusters through van der Waals attraction between methyl groups of DMEA-H+ with those of HEDP. Under mechanical stress, e.g. stirring, the more fragile framework falls apart into small fragments. Although not shown, we note that other amines yield basically the same results as DMEA with regard to phase behaviour, birefringence and SAXS: 2-propyl imidazole, tris-(2-hydroxypropyl)amine, tris(hydroxymethyl)aminomethane (TRIS), 1,4-diazabicyclo(2.2.2)octane (DABCO) and 1,5-diazabicyclo(4.3.0)non-5-ene (DBN).
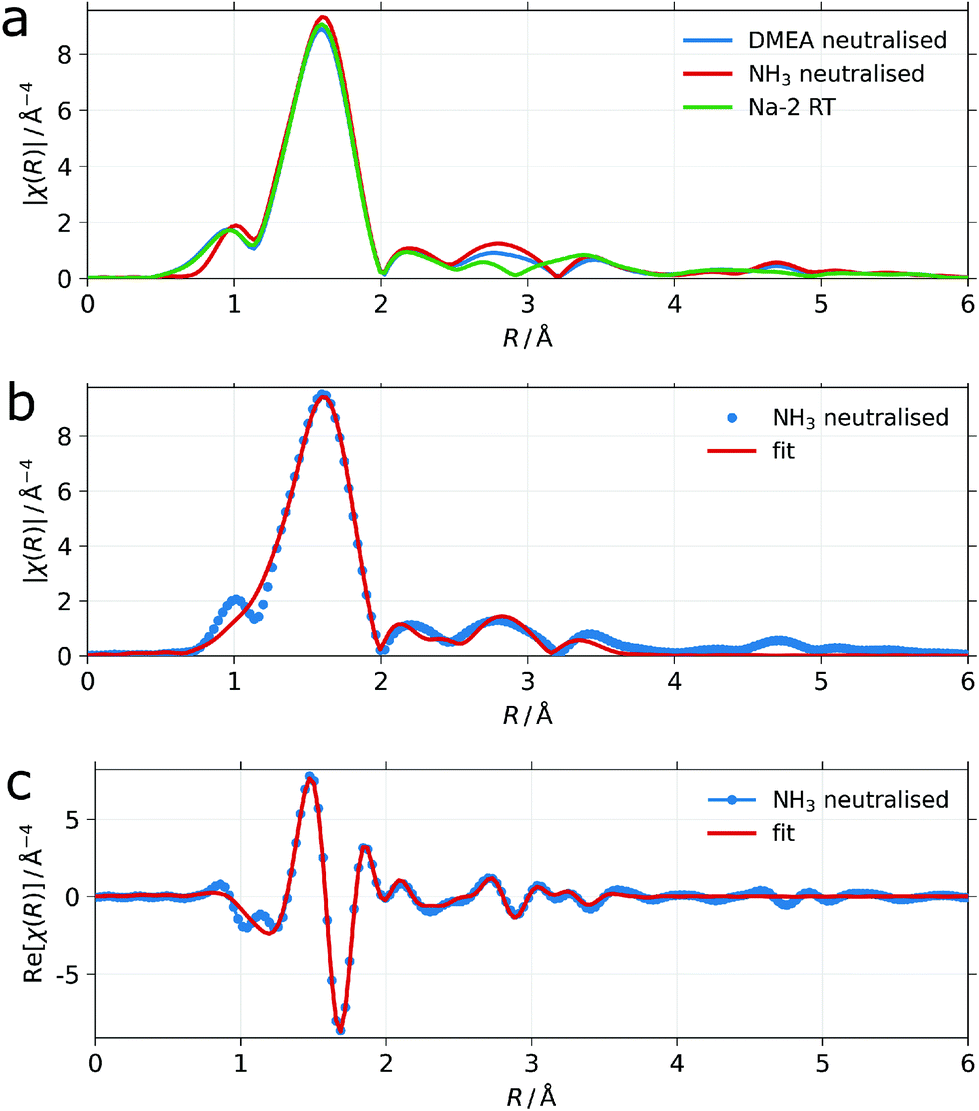 | ||
| Fig. 9 (a) Fourier transformed k2χ3(k) EXAFS data from dispersions of NH3 (red) and DMEA (blue) neutralized dispersions of purified Na-2 ribbons (w = 0.05) and the one from of the freeze-dried, purified ribbons of Na-2 (green). All measured in transmission at ambient temperature. (b) Overlay of the fitted magnitude and (c) the fitted real part of the Fourier transform (red lines) with the experimental data from the NH3 neutralized ribbons (blue dots). For simulation details see the chapters “characterization” and “structural model” with references to the ESI.† | ||
Higher magnification in TEM analysis also displays numerous single filaments for the NH3 treated dispersion (Fig. 10b). In sections of aligned filaments FFT analysis detects a distance of 2 nm (Fig. SI 16†) and selected area diffraction (SAD) unveils a hexagonal diffraction pattern (d = 4.2 Å) as shown in Fig. 10c. We note that such an order could not be observed in either sample of pristine ribbons or DMEA neutralized dispersions (cf.Fig. 10d). XRD corroborates a modest order in the dried dispersion which was treated with ammonia. Several broad humps for distances in the sub-nanometer range are resolved and a distinct peak at 2θ = 8.79° (d = 1.01 nm) points to a structural peculiarity that is caused by the action of ammonia (Fig. SI 15 vs. Fig. SI 8†). We note that this repeat distance is slightly beyond the measured SAXS q-range (qmax = 6.22 nm−1) and that the faint peak at 2θ = 4.53° (d = 1.95 nm) is in good agreement with the distance observed with TEM (Fig. SI 16†).
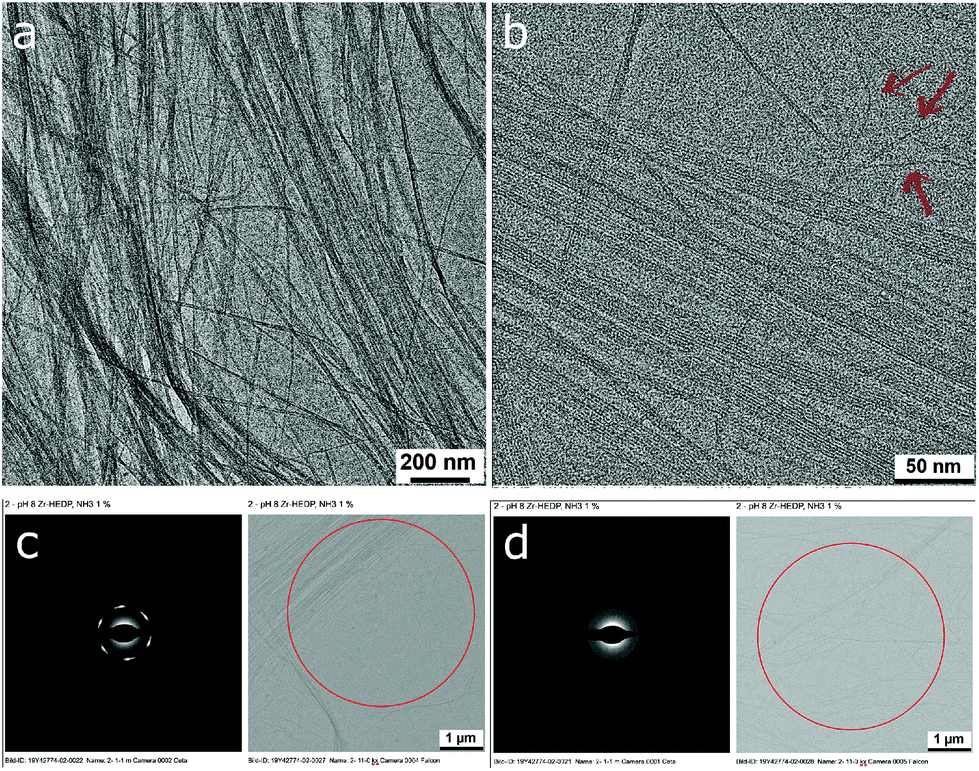 | ||
| Fig. 10 HRTEM of the purified Na-2 ribbons neutralized with NH3 to pH 8. (a and b) brightfield images, red arrows point to single filaments (scale bars 200 nm and 50 nm). (c) SAD obtained from the section in the red circle in comparison with (d) SAD from the DMEA neutralized purified Na-2 ribbons (pH 8). The solid content of all dispersions was 1 weight-%. | ||
The phase behaviour, hexagonal order in the colloidal state and the presence of single filaments in dried samples suggest that the removal of excess HEDP-Na and NaCl during the TFF process induces longitudinal ripping of the nano-ribbons along the sodium planes into individual filaments of stacked Zr4O24 slices (cf.Fig. 6). Charging each Zr-HEDP unit by neutralization of one P–OH group with ammonia or amine induces a change of the stacking mode. The HEDP moieties flip over from their initial lateral orientation, inherited from the ribbons’ strips, to a normal position relative to the Zr4O24 planes as shown in Fig. 11a. This leads to an increased spacing of one nanometer which allows for the accommodation of the methyl groups that are facing each other in the galleries whereas lateral ammonium phosphonate groups are forming the interface with water. During the drying process the filaments may align into ordered arrays within domains where the strings retain sufficient mobility. Based on the ratio of 6:4 for hexagonal assembly (SAD, Fig. 10c) and the number of PO3−NH4+ ion pairs per gallery, respectively, a conceivable tessellation is sketched in Fig. 11b. The lateral spacing of two nanometers between the filaments’ Zr4O24 moieties is in line with the distance detected by TEM and XRD (vide supra) whereas the distance between the pores (2θ = 2.2°) is beyond the range of XRD in order to be resolved. In contrast to the large coherence length of stacked Zr4O24 units, the supra-molecular assembly gives rise to much less intense XRD reflections due to a relatively modest electron contrast in the case of PO3−NH4+ and only minor fractions of filaments that were able to achieve ordered sections. As suggested by SAD which displayed hexagonal assembly only locally, it is reasonable to assume that a major part of the filaments are stuck by mechanic interlocking and steric hindrance as a result of their sheer length.
 | ||
| Fig. 11 (a) Repeat unit of an NH3 neutralized Na-2 filament (NH4+ and H of OH and H2O ligands omitted). Galleries between stacked Zr4O24 clusters host methyl groups from HEDP ligands, two each from opposing zirconium atoms are pointing down- and upwards, respectively. (b) Cross-sectional view of aligned filaments (blue squares = Zr4O24) with hexagonally arranged PO3−NH4+ ion pairs (blue dots). Yellow hexagons are a guidance for the eyes. | ||
Conclusion
The present work somehow revives early experiments which monitored the evolution of pH values and 31P NMR signals during the titration of mixed ZrOCl2/HEDP solutions with potassium hydroxide.10,11 However, the existence of Zr-HEDP nano-ribbons, found by serendipity and presented here, has never been reported to the best of our knowledge. This contrasts the number of scientific papers and in particular patents that are dedicated to applications of Zr-HEDP.The metal organic framework is transversely based on the dual coordination of Na and Zr through HEDP whereas its longitudinal cohesion relies on van der Waals attraction and hydrogen bonding between the HEDP moieties. Although the formation is found to be crucially dependent on the type of the mono-valent cation and the stoichiometry, the bisphosphonate might be varied with respect to the spacer length and the nature of substituents. In this way further supra-molecular assemblies with altered dimensions and properties can be expected. This would inter alia open alternative ways for the tuning of the assemblies’ colloidal behaviour in analogy to the interaction of the nano-ribbons with an organic base presented here.
The stability of the Zr-HEDP nano-ribbons over a broad pH range also opens perspectives for applications where the liquid crystalline phase behaviour of the supra-molecular framework enables novel property profiles. These span from the advantageous shear-thinning behaviour which allows for the formulation of waterborne, high-solid coatings to the beneficial effect of anisotropic dried films that keep the director field of the ordered liquid. The latter will impose improved pigment orientation which in turn widens the range of optical effects, ameliorates the diffusion barrier and enhances the mechanical properties, e.g. an improved impact resistance.
To summarize, low volume fractions of a highly anisotropic and stable Zr-HEDP framework provide a novel tool for the formulation of innovative and environmentally friendly waterborne products whereas the unveiled supra-molecular principle of the Zr-HEDP ribbons may spur the design of further, related architectures.
Conflicts of interest
There are no conflicts to declare.Acknowledgements
The authors thank Elke Austrup (BASF Coatings Division) for synthesis assistance, Regina Schroeder (BASF Coatings Division) for rheological measurements, and Martina Hillebrand (BASF Coatings Division) for cross polarized microscopy. The authors are grateful for the arrangement of SAXS measurements at the beamlines of ESRF and DESY by Volodymyr Boyko (BASF SE). The authors thank the beamline scientists Michael Sztucki (ESRF), Andrey Gruzinov und Haydyn Mertens (both DESY) for performing the small angle X-ray scattering experiments. The authors thank Matthias Surau (BASF SE) for performing transmission electron microscopy experiments and support with image selection. Finally, the authors appreciate valuable suggestions made by anonymous reviewers.References
- A. Clearfield and K. Demadis, Metal Phosphonate Chemistry: From Synthesis to Applications, Royal Society of Chemistry, 1st edn, 2012, pp. 279–316 Search PubMed.
- A. Jayswal and U. Chudasama, Acta Chim. Slov., 2007, 54, 654–660 CAS.
- I. Romanova, I. Farbun, V. Aleksandrova and S. Khainakov, Russ. J. Appl. Chem., 2003, 76, 731–735 CrossRef CAS.
- A. Jayswal and U. Chudasama, Turk. J. Chem., 2008, 32, 63–74 CAS.
- X.-Z. Lin and Z.-Y. Yuan, Eur. J. Inorg. Chem., 2012, 2012, 2661–2664 CrossRef CAS.
- X.-Z. Lin, Z.-Z. Yang, L.-N. He and Z.-Y. Yuan, Green Chem., 2015, 17, 795–798 RSC.
- X.-Z. Lin, T.-Z. Re and Z.-Y. Yuan, Catal. Sci. Technol., 2015, 5, 1485–1494 RSC.
- R. Thakkar and U. Chudasama, J. Iran. Chem. Soc., 2010, 7, 202–209 CrossRef CAS.
- S. Pu, M. Chen, Y. Chen, W. Zhang, H. Soliman, A. Qu, Q. Liu, X. Tang, N. Huang and G. Wan, Corros. Sci., 2018, 144, 277–287 CrossRef CAS.
- I. Romanova, V. Strelko, S. Khainakov and N. Kostromina, Ukr. Khim. Zh., 1997, 63, 77–82 CAS.
- I. Romanova, V. Trachevskii, N. Kostromina and V. Strelko, Ukr. Khim. Zh., 1998, 64, 83–89 CAS.
- A. Lytkin, V. Vasilev, A. Katrovtzeva and N. Chernyvskaya, J. Mol. Liq., 2001, 91, 231–235 CrossRef CAS.
- V. Popov, Russ. J. Inorg. Chem., 2015, 60, 420–427 CrossRef CAS.
- E. Matczak-Jon and V. Videnova-Adrabińska, Coord. Chem. Rev., 2005, 249, 2458–2488 CrossRef CAS.
- J. Zhang, L. Chen, D. Gui, H. Zhang, D. Zhang, W. Liu, G. Huang, J. Diwu, Z. Chaib and S. Wang, Dalton Trans., 2018, 47, 5161–5165 RSC.
- G. Serre and C. Férey, J. Mater. Chem., 2002, 12, 2367–2369 RSC.
- N. Stavgianoudaki, K. Papathanasiou, R. Colodrero, D. Choquesillo-Lazarte, J. Garcia-Ruiz, A. Cabeza, M. Aranda and K. Demadis, CrystEngComm, 2012, 14, 5385–5389 RSC.
- R. Shannon, Acta Crystallogr., Sect. A: Cryst. Phys., Diffr., Theor. Gen. Crystallogr., 1976, 32, 751–767 CrossRef.
- L. Robert and R. Irani, Inorg. Chem., 1967, 6, 1994–1998 CrossRef.
- K. Rao and K. Vidyasagar, Eur. J. Inorg. Chem., 2005, 4936–4943 CrossRef CAS.
- K. Rao and K. Vidyasagar, Eur. J. Inorg. Chem., 2006, 813–819 CrossRef.
- R. Harris, E. Becker, S. Cabral de Menezes, P. Granger, R. Hoffman and K. Zilm, Pure Appl. Chem., 2008, 80, 59–84 CAS.
- D. Jardón-Alvarez and J. Schmedt auf der Günne, Solid State Nucl. Magn. Reson., 2018, 94, 26–30 CrossRef PubMed.
- M. N. B. Ravel, J. Synchrotron Radiat., 2005, 12, 537–541 CrossRef PubMed.
- M. Newville, J. Phys.: Conf. Ser., 2005, 430, 012007 CrossRef.
- S. Zabinsky, J. Rehr, A. Ankudinov, R. Albers and M. Eller, Phys. Rev. B: Condens. Matter Mater. Phys., 1995, 52, 2995 CrossRef CAS PubMed.
- M. Hanwell, D. Curtis, D. Lonie, T. Vandermeersch, E. Zurek and G. Hutchison, J. Cheminf., 2012, 4, 17 CAS.
- F. I. K. Momma, J. Appl. Crystallogr., 2011, 44, 1272–1276 CrossRef.
- V. Burger, D. Arenas and C. Stultz, Sci. Rep., 2016, 6, 29040 CrossRef CAS PubMed.
- M. Nardelli and G. Pelizzi, Inorg. Chim. Acta, 1983, 80, 259–271 CrossRef CAS.
- L.-M. Zheng, H.-H. Song, C.-Y. Duan and X.-Q. Xin, Inorg. Chem., 1999, 38, 5061–5066 CrossRef CAS PubMed.
- H.-H. Song, L.-M. Zheng, Y.-J. Liu, X.-Q. Xin, A. Jacobson and S. Decurtins, J. Chem. Soc., Dalton Trans., 2001, 3274–3278 RSC.
- A.-Y. Ni, J. Pan, Z.-Z. Xue, S.-D. Han, J.-H. Li, G.-M. Wang and Z.-H. Wang, Solid State Sci., 2017, 70, 47–53 CrossRef CAS.
- L.-M. Zheng, C.-Y. Duan, X.-R. Ye, L.-Y. Zhang, C. Wang and X.-Q. Xin, J. Chem. Soc., Dalton Trans., 1998, 905–908 RSC.
- T. Mak, Can. J. Chem., 1968, 46, 3491–3497 CrossRef CAS.
- A. Singhal, L. Toth, J. Lin and K. Affholter, J. Am. Chem. Soc., 1996, 118, 11529–11534 CrossRef CAS.
- H.-Y. Cho, C. Walther, J. Rothe, V. Neck, M. Denecke, K. Dardenne and T. Fanghänel, Anal. Bioanal. Chem., 2005, 383, 28–40 CrossRef CAS PubMed.
Footnote |
| † Electronic supplementary information (ESI) available. See DOI: 10.1039/D1DT00736J |
| This journal is © The Royal Society of Chemistry 2021 |