
 Open Access Article
 This Open Access Article is licensed under a Creative Commons Attribution-Non Commercial 3.0 Unported Licence
Quinizarin: a large aromatic molecule well suited for atomic layer deposition†
Per-Anders
Hansen
 and
Ola
Nilsen
*
and
Ola
Nilsen
*
Department of Chemistry, University of Oslo, Oslo, Norway. E-mail: ola.nilsen@kjemi.uio.no
First published on 24th April 2021
Abstract
Atomic layer deposition (ALD) is a remarkable synthesis tool due to the vast array of materials that can be deposited and the complexity of structures that can be designed. The low-temperature layer-by-layer approach even allows organic and inorganic components to be combined as hybrid or composite materials. The technique is then called molecular layer deposition (MLD). This opens the door for deposition of advanced optical materials using highly absorbing aromatic molecules. Unfortunately, most large aromatic molecules are difficult to sublime or have insufficient reactivity. This is a major barrier for ALD when designing with the use of organic components for dye-sensitized solar cells, luminescence, visible light photochemistry, chemical sensors and organic electronics. In this work, we introduce a well-known orange dye molecule, quinizarin. This molecule has a large conjugated aromatic system with strong absorption of visible light and shows strong luminescence both in solutions and as a complex together with aluminium ions. Interestingly, quinizarin also shows surprisingly good properties for film deposition due to reactive –OH groups and low sublimation temperature (130 °C). Strongly coloured pink hybrid films were deposited with trimethylaluminium and quinizarin at 175 °C with a growth rate of 0.28 nm per cycle. These films were not luminescent although their optical absorption spectra are similar to those of the corresponding solution. An attempt was made to dilute quinizarin through partial replacement with pentaerythritol as a multilayer structure or simultaneous co-pulsing, although this also did not produce luminescent films. The low sublimation temperature, good reactivity and large conjugated system of quinizarin open the way for exploration of solid-state hybrid and organic films based on this molecule along many different technological pathways.
Introduction
Atomic layer deposition (ALD) is a remarkable synthesis tool capable of producing a vast array of materials from inorganic,1 quaternary2 and even quinary compounds,3 nanostructures,4 organic–inorganic hybrids,5 crystalline MOF films6 and pure organic compounds.7 ALD is also often named molecular layer deposition (MLD) when organic molecules are introduced as a building block into organic–inorganic hybrid or purely organic film materials. The low temperature and layer-by-layer approach limits the interdiffusion between layers and enables a wide range of combinations of different material classes at the sub-nanometer scale. This gives rise to completely new possibilities in designing with combinations of material properties8 and to control optical and electronic interactions.9 While ALD normally coats all surfaces similarly, area-selective deposition is possible and is an expanding field.10Due to this flexibility in material choices and design possibilities, it is not surprising that ALD has been explored for a wide range of advanced applications like optical temperature sensors,11 oxide electronics,12 and up13 and down14 conversions, in particular when the addition of organic building blocks opens up many new technological possibilities.15 However, the range of organic components to choose from as precursors in ALD has so far been limited to quite small molecules since they need to be delivered through the gas phase.
Reviews on ALD and MLD chemistries7,16 reveal that organic precursors are quite limited beyond a single aromatic ring or a short, conjugated chain. A few examples exist where larger conjugated systems like naphthalene and biphenyl6 are used, showing near-UV activity and even visible absorption.17 These optically absorbing dye precursors require sublimation temperatures of around 250 °C or above, approaching their thermal stability. This illustrates well the difficulty in balancing Vis and NIR active optical properties with ALD/MLD compatibility.
Quinizarin (1,4-dihydroxyanthraquinone) is a well-known dye molecule, but its excellent properties are less known as an ALD/MLD precursor. This molecule belongs to the anthraquinone class of organic dyes, which show a range of optical, electronic, photocatalytic18 and red-ox properties.19 Quinizarin shows both strong visible absorption, offering large possibilities for chemical modification, and, the key point in this work, exceptionally good properties as an ALD/MLD precursor: it sublimes well at 130 °C and has good reactivity with two hydroxyl groups, and it has a rather low cost. As a metal–organic hybrid, it is explored in supercapacitors as metal–organic frameworks20 and dye sensitization of TiO2![[thin space (1/6-em)]](https://www.rsc.org/images/entities/char_2009.gif) 21 and can couple to semiconducting nanoparticles to create new low-energy luminescent states.22 Anthraquinone, quinizarin and its derivatives have also been explored for a diverse range of uses such as eco-friendly replacement of cobalt in Li-ion batteries.23,24 In addition to red-ox activity, electronic properties and strong visible absorption, quinizarin and Al3+ ions form highly luminescent and strongly coloured complexes and polymeric structures in solutions.25 Similar properties are observed for Ga3+ and In3+.26 The flexibility in chemical modifications and suitability as an ALD/MLD precursor allow for many exciting new avenues to be explored in the design of hybrid, organic and nanocomposite materials.
21 and can couple to semiconducting nanoparticles to create new low-energy luminescent states.22 Anthraquinone, quinizarin and its derivatives have also been explored for a diverse range of uses such as eco-friendly replacement of cobalt in Li-ion batteries.23,24 In addition to red-ox activity, electronic properties and strong visible absorption, quinizarin and Al3+ ions form highly luminescent and strongly coloured complexes and polymeric structures in solutions.25 Similar properties are observed for Ga3+ and In3+.26 The flexibility in chemical modifications and suitability as an ALD/MLD precursor allow for many exciting new avenues to be explored in the design of hybrid, organic and nanocomposite materials.
In this work, we introduce quinizarin (H2Qz) as an organic precursor in ALD/MLD and describe the deposition of Al2Qz3 aluminium–quinizarin films. The growth, composition and long-term stability are explored, alongside their optical properties. Finally, as Al2Qz3 complexes in solution show strong visible luminescence while their dried powder counterparts do not, we attempted a “solid-state dilution” by replacing quinizarin with pentaerythritol (H4Pe), forming Al4Pe3. Al4Pe3 is optically passive and transparent, and its function is to increase the distance between the quinizarin molecules in the film material. With this in mind, the exploration of Al4Pe3 is limited to growth parameters and optical properties. The precursors used in this work and the parent anthraquinone is shown in Fig. 1.
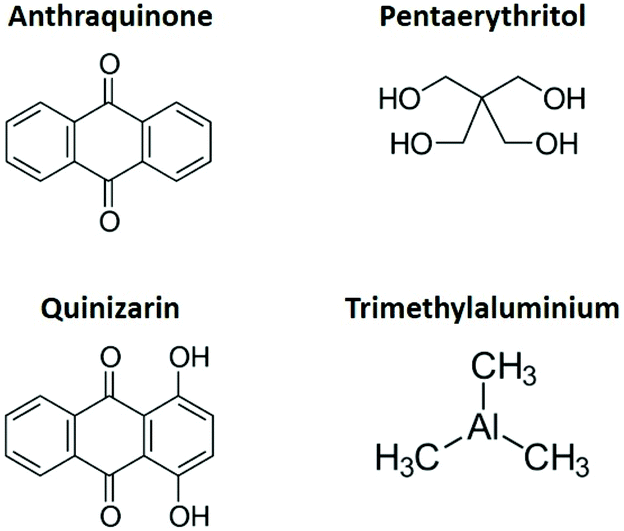 | ||
| Fig. 1 Anthraquinone, the parent molecule of quinizarin, and the three precursor molecules used in this work. | ||
Experimental
The films were deposited in an F-120 research-type ALD-reactor (ASM Microchemistry Ltd) at 175 °C. Trimethyl aluminium (TMA) (Witco GmbH, 98%), Al(acac)3 (Sigma Aldrich, 99.999%), quinizarin (Sigma Aldrich, 96%) and pentaerythritol (Sigma Aldrich, 98%) were used as precursors. TMA was introduced from an external bubbler kept at room temperature, while Al(acac)3, quinizarin and H4Pe were sublimed at 130, 130 and 160 °C, respectively. Pulse parameters (Al/purge/anion/purge) for TMA and H2Qz cycles were 1/1.5/3/1.5 s, for TMA and H4Pe were 1/1/5/1 s, and for Al(acac)3 and H2Qz were 2/1/2/1 s. For the Al(acac)3 and H2Qz depositions, both 175 and 225 °C were used as deposition temperatures. These parameters were used for the data presented in this work, while other parameters were explored.p-Type Si(100) substrates cut into 0.5 × 4 cm2 strips were used for all depositions. These were placed some 5 cm apart in the gas inlet and exhaust sides of the deposition chamber to monitor thickness gradients (see the photo in Fig. 6). The native oxide on the silicon substrates was not removed but was measured before deposition for every substrate. In addition, some depositions included polished steel substrates for reflection mode FTIR and amorphous silica substrates for UV-Vis measurements. All substrates were dry wiped, and dust was removed using pressurized air before deposition.
In situ quartz crystal microbalance (QCM) analyses were conducted using a 6 MHz AT-cut quartz crystal. The crystal was mounted in a home-made holder and was used to monitor the mass increase, which is proportional to the change in the frequency,27 during the deposition to determine saturation conditions for pulse and purge parameters. The signal was recorded using a Colnatec Eon-LT system and processed by averaging over 16 consecutive ALD cycles. The temperature was stabilized for 90 minutes before any experiments were conducted to ensure a stable temperature and response from the QCM crystals.
The crystallinity of the samples was determined with a Bruker D8 Discovery X-ray diffractometer, using CuKα1 radiation and a Ge(111) monochromator. Film thickness and refractive index were determined with a J. A. Woollam alpha-SE spectroscopic ellipsometer in the 380–900 nm range. The ellipsometry data were modelled using a Cauchy model. FTIR measurements were performed in the reflection mode at 75° incident angle using a Bruker Vertex 70 spectrometer equipped with a Pike VeeMAX III specular reflection accessory. All data were acquired using 64 scans in the wavenumber range of 4000–370 cm−1 and at 2 cm−1 resolution. A spectrum obtained from the uncoated electropolished steel substrate was used as the background during the measurements and subtracted from the spectra of the films. The FTIR spectra of the organic precursors quinizarin and pentaerythritol were obtained from the online database Wiley SpectraBase.28,29 UV-Vis transmittance and reflectance spectra were collected with a Shimadzu UV-3600 UV-Vis-NIR spectrophotometer. Absorbance spectra were calculated from transmittance and reflectance obtained while using an integrating sphere. Luminescence (PL) measurements were performed with a 280 nm diode and a UV lamp (254 and 365 nm) as the excitation source and a USB2000+ spectrometer from OceanOptics for detection.
X-ray photoelectron spectroscopy (XPS) was performed with a Thermo Scientific Theta Probe Angle-Resolved X-ray photoelectron spectrometer system using a standard monochromated Al Kα source (hv = 1486.6 eV). The spectra were acquired using a pass energy of 200 eV for survey spectra and 50 eV for detailed peak scans with an analysis spot of roughly 400 μm.
Results and discussion
Growth
The Al2Qz3 films showed a growth rate of around 0.28 nm per cycle. The films showed a thickness gradient of about 33% reduction in the growth rate over 5 cm. This gradient was reproducible and persisted when the pulse and purge times or the precursor temperature was changed. For Al4Pe3, the growth rate and gradient were 0.90 nm per cycle and 14.3%, respectively.Fig. 2 shows the QCM response as a function of pulsing times. The observed frequency change is proportional to the mass change of the deposited material. The TMA pulse saturates at 0.2 s. For the organic pulses, quinizarin does not show saturation even after 20 s pulses while pentaerythritol saturates at 10 s. During each precursor pulse, the expected byproduct is methane from reactions between aluminium's methyl groups and the organic precursors’ hydroxyl groups. For reference, the masses of the reactants and leaving molecule are: TMA = 144.18, quinizarin (H2Qz) = 240.21, pentaerythritol (H4Pe) = 136.15 and CH4 = 16.04 g mol−1.
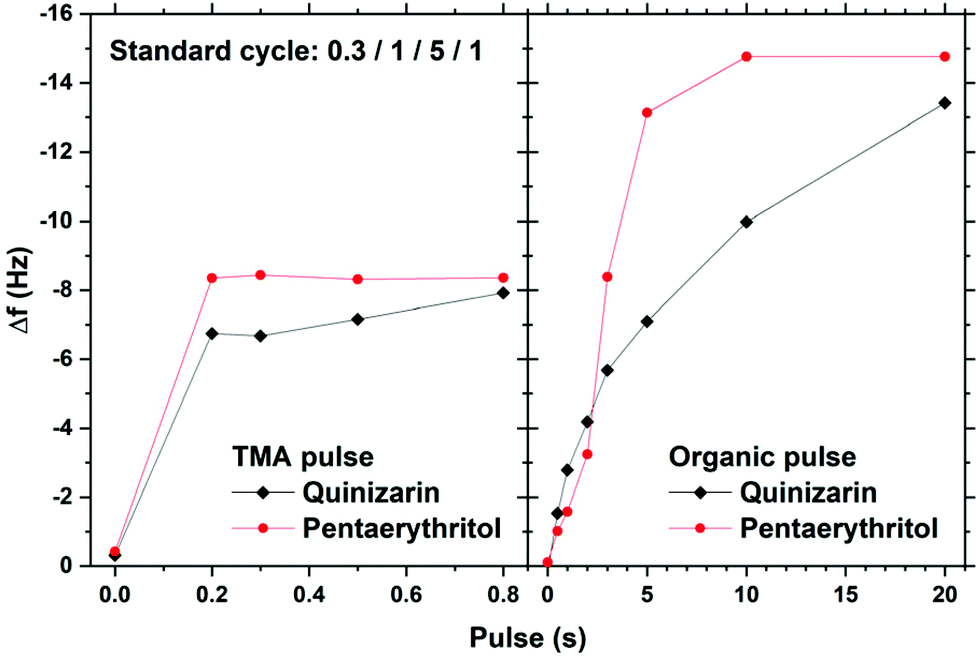 | ||
| Fig. 2 QCM characterization of growth saturation as a function of pulse durations for Al2Qz3 and Al4Pe3. | ||
Fig. 3 shows the frequency change during each pulse and purge step for rather long pulse and purge times (2.7 s/10 s/20 s/10 s for TMA/purge/organic/purge). The TMA pulse shows an immediate and rapid mass increase before reaching a plateau at about 1 s, while the organic precursors show a much slower and longer increase in addition to a short delay in the reaction. The mass gains during each half-cycle (pulse and purge) are ΔfAl = 7.39 Hz for TMA and ΔfQz = 10.38 Hz for H2Qz for Al2Qz3 growth, and ΔfAl = 2.16 Hz for TMA and ΔfPe = 12.27 Hz for H4Pe for Al4Pe3 growth.
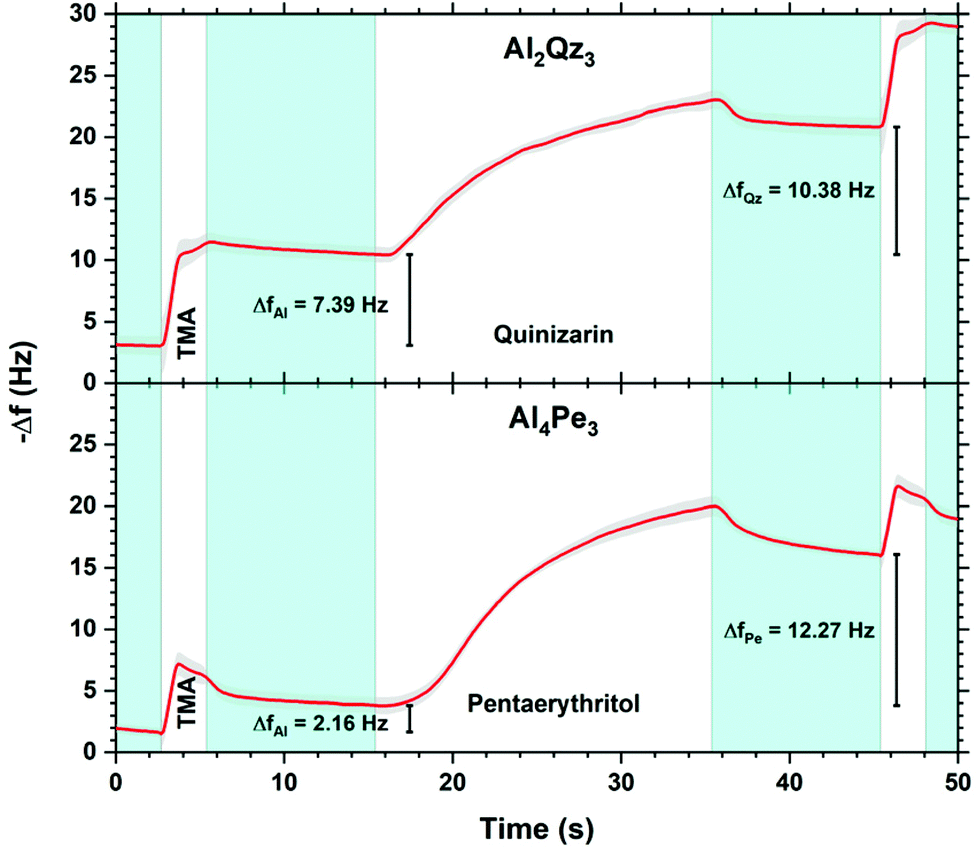 | ||
| Fig. 3 Detailed QCM characterization of the growth during pulsing and purging. Pulses are marked in white and named with each respective precursor while nitrogen purges are marked in blue. | ||
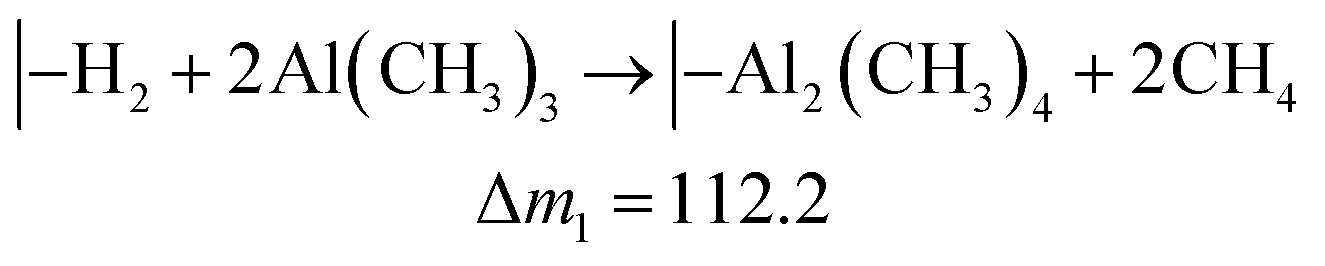
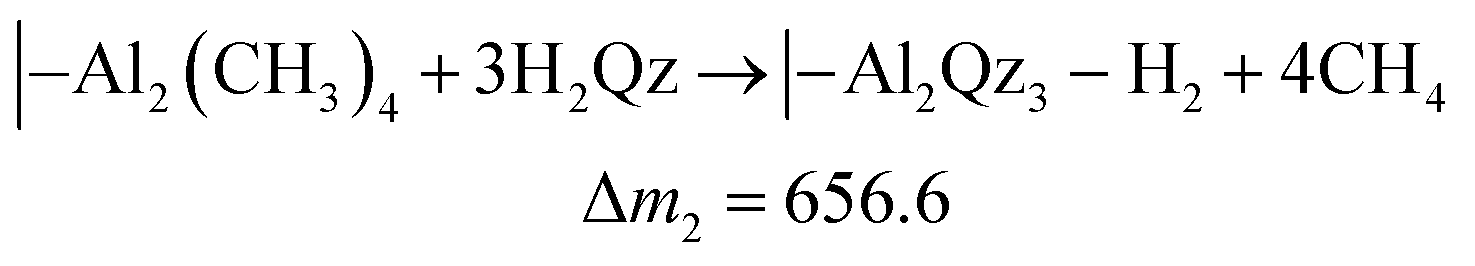
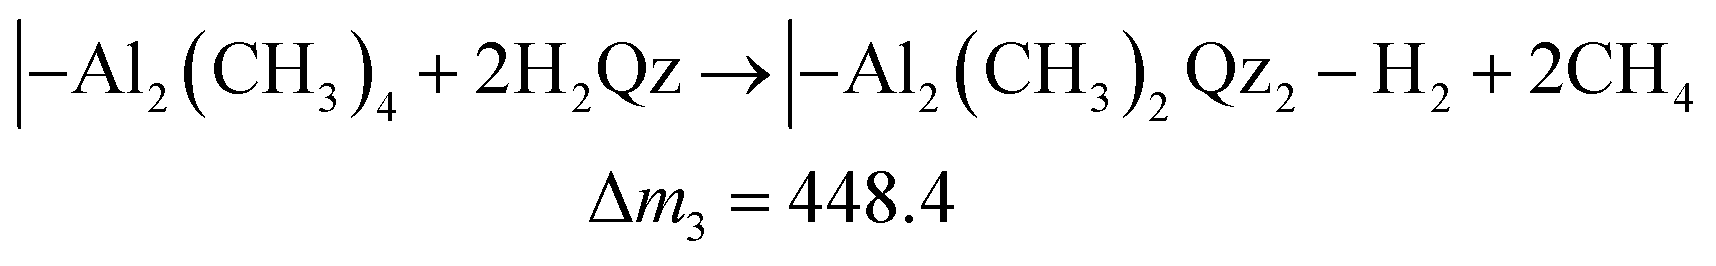
While the QCM signal does not directly reveal the chemistry taking place, it can be used to evaluate possible hypotheses. The TMA molecule should react with the Qz surface with at least one of its methyl groups. Likewise, H2Qz should react with at least one of TMA's remaining methyl groups. We use the term “should” because TMA is a strong Lewis acid, and can coordinate directly to Lewis bases without any reaction taking place, like in the pyridine–TMA complex. However, this is unlikely here due to the reactivity of the hydroxyl groups in Qz. Still, unreacted methyl groups may remain in our film after a complete cycle. If so, this will have a notable effect on the overall stoichiometry and we expect post-reactions with ambient air. If all methyl groups react, an overall stoichiometry of Al2Qz3 is expected, while Al(CH3)Qz should form if only two methyl groups react. The latter is expected to be converted to Al(OH)Qz upon reaction with moist air. These two products can be formed by combinations of the following three half-reactions:
 | (1) |
 | (2) |
 | (3) |
The mass gains during H2Qz exposure (eqn (2) and (3)) should be about 6 and 4 times larger than those during the TMA half-cycle (eqn (1)). The observed ratio in the frequency change is on the other hand closer to 1.4 (Fig. 3). This indicates that even less Qz is deposited per Al atom than what is expected from simply balancing the valency of Al3+ and Qz2−, and that neither of the most plausible reaction mechanisms are close to describing the real growth.
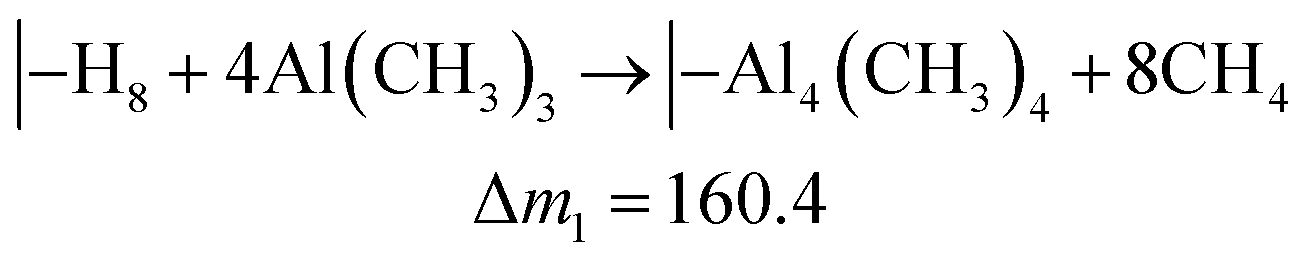
A similar analysis of the QCM results for the Al4Pe3 film gave ΔfAl = 2.16 Hz for TMA and ΔfPe = 12.27 Hz for H4Pe, resulting in an observed mass ratio of ca. 6 for ΔfPe/ΔfAl. On the basis of the overall stoichiometry of Al4Pe3, we combined the hypothetical reactions in eqn (4) and (5) and obtained an expected ΔfPe/ΔfAl value of 2.1. This indicates that a relatively large proportion of the –OH groups remains unreacted during growth, and hence, the film has an excess of HxPe. A large amount of –OH in the deposited films will also be shown by FTIR analysis later (Fig. 5).
 | (4) |
 | (5) |
An Al2Qz3 film was investigated with XPS to determine its chemical bonding and stoichiometry. The C 1s peak is shown in Fig. 4, while the survey scan and Al 2s and O 1s peaks are shown in ESI Fig. 4–6.†Fig. 4 shows 3 different carbon species, with a makeup of 75% C–C and about 12–13% each of C–O and C![[double bond, length as m-dash]](https://www.rsc.org/images/entities/char_e001.gif) O. This matches well with quinizarin, having 10 out of 14 carbon atoms that are not bonded to oxygen, ideally giving 71.4% C–C. As the film material shows distinct C–O and CO species, these two oxygen atoms must bond differently to Al3+. A bidentate binding to both oxygen atoms would show up as a single carbon species in XPS instead of two distinct species. The CO oxygen may still participate in coordinating Al3+. The Al 2p peak shows that there is only one major Al species, indicating that all Al atoms are bonded similarly. The single O 1s peak indicates that all oxygen atoms are bonded similarly as well, i.e. to both Al and C instead of only to Al as in Al2O3. The O 1s peak also does not have the discrete energy found for Al2O3. Thus, there is no indication of Al2O3 in the deposited material.
O. This matches well with quinizarin, having 10 out of 14 carbon atoms that are not bonded to oxygen, ideally giving 71.4% C–C. As the film material shows distinct C–O and CO species, these two oxygen atoms must bond differently to Al3+. A bidentate binding to both oxygen atoms would show up as a single carbon species in XPS instead of two distinct species. The CO oxygen may still participate in coordinating Al3+. The Al 2p peak shows that there is only one major Al species, indicating that all Al atoms are bonded similarly. The single O 1s peak indicates that all oxygen atoms are bonded similarly as well, i.e. to both Al and C instead of only to Al as in Al2O3. The O 1s peak also does not have the discrete energy found for Al2O3. Thus, there is no indication of Al2O3 in the deposited material.
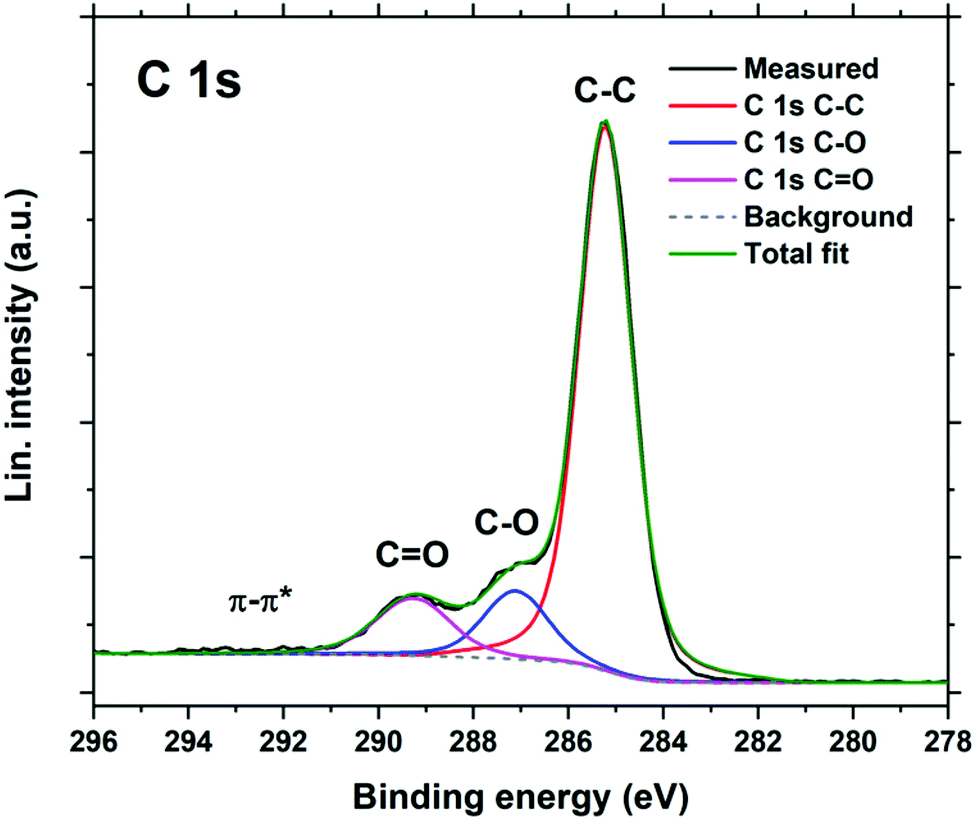 | ||
| Fig. 4 XPS C 1s peak, showing contributions from three types of carbon species: C–C, C–O and CO. | ||
The atomic ratios are determined to be 5.5% Al, 67% C, and 27.5% O, giving an overall stoichiometry of AlC12.2O5. The two ideal reactions eqn (1) + eqn (2) (Al2Qz3) and eqn (1) + eqn (3) (Al(CH3)Qz) give a stoichiometry of AlC21O6 and AlC15O4, respectively. The measured stoichiometry is close to Al(CH3)Qz, indicating a substantial amount of unreacted Al–CH3 groups. As mentioned, we expect that these methyl groups react with moisture upon air exposure to form Al–OH giving the composition Al(OH)Qz, or AlC14O5 which is fairly close to the measured value. Thus, both XPS and QCM indicate that substantial amounts of Al–CH3 groups stay unreacted during film growth.
Both QCM and XPS indicate an over-stoichiometry of Al, even compared to Al(OH)Qz/Al(CH3)Qz. XPS shows that the carbonyl CO bond is intact in the film. Given that Al3+ is bonded to the hydroxy group and possibly only coordinated to the carbonyl oxygen, there is a possibility that some of the carbonyl groups contribute by coordinating additional TMA molecules. TMA can both coordinate to and react with carbonyl groups.30 Dandley et al. found that TMA would interact with carbonyl groups to form both CO⋯Al(CH3)3 adduct structures and covalent Al–O bonds at different temperatures in ALD-like vapor phase chemistry.33 This can offer a potential explanation for the apparent over-stoichiometry of Al. However, it will require further work to elucidate this effect and the details of the growth mechanism in the TMA–H2Qz system.
Fig. 5 shows the FTIR reflectance spectra of the Al2Qz3 and Al4Pe3 films on polished steel substrates, in addition to the absorbance spectra of H2Qz and H4Pe powders in KBr pellets. The broad absorption band from the –OH groups at 3300 cm−1 is visible in all spectra. The two peaks around 1600 cm−1 can be assigned to the carbonyl CO stretching of quinizarin. Xuan et al. placed the carbonyl CO stretching mode at 1630 cm−1.31 ESI Fig. 3† shows these spectra zoomed in the 1800–500 cm−1 range. It is seen that the two carbonyl peaks are shifted to lower energies from 1630 and 1590 in the H2Qz powder to 1610 and 1580 cm−1 in the Al2Qz3 films.
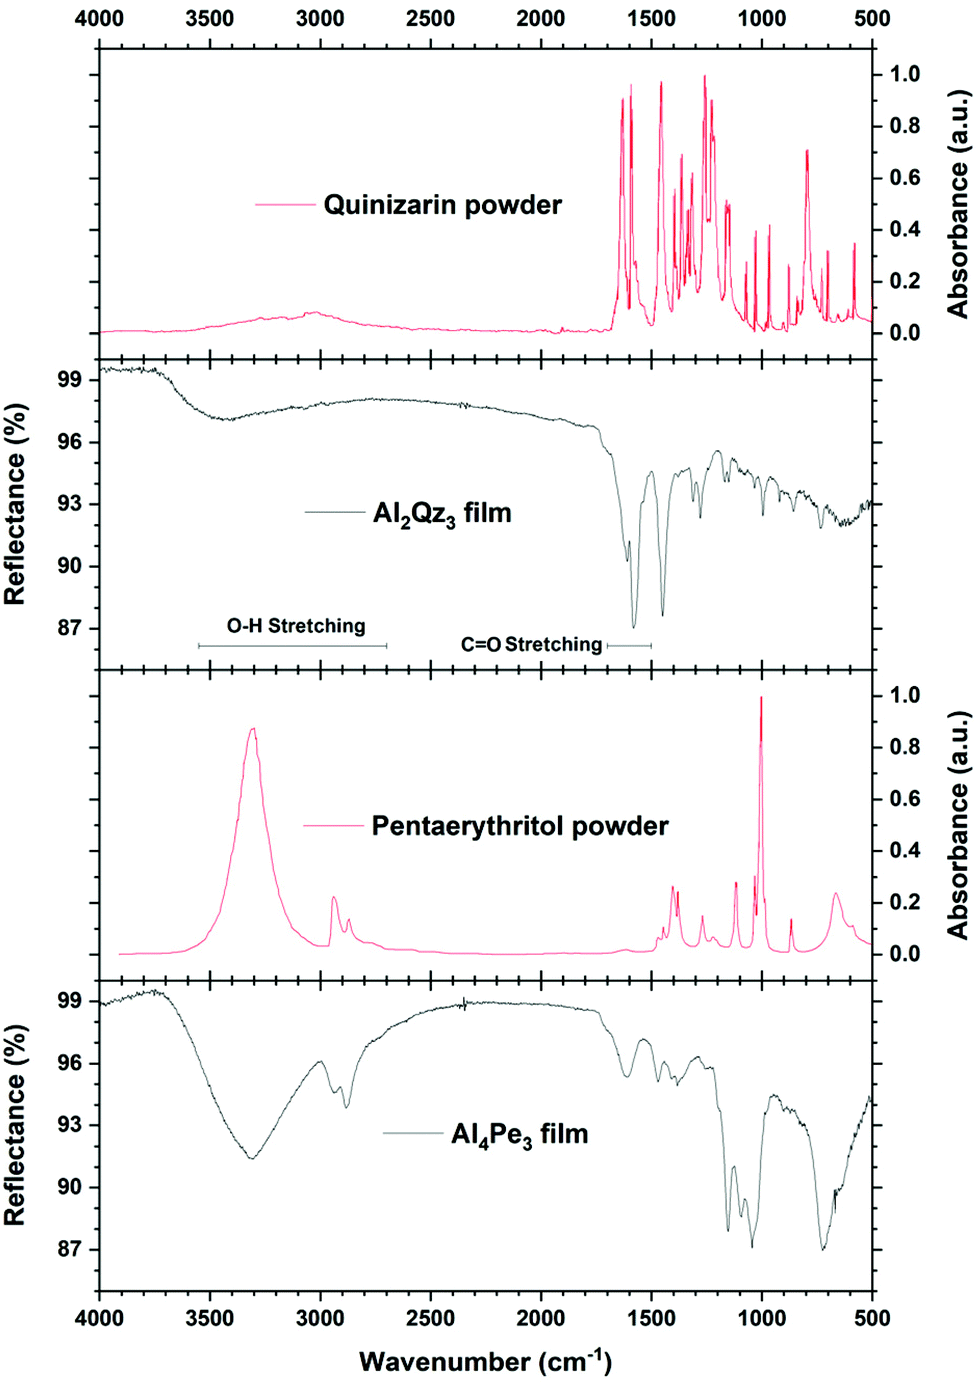 | ||
| Fig. 5 FTIR data of Al2Qz3 and Al4Pe3 films on steel substrates. Quinizarin (H2Qz) and pentaerythritol (H4Pe) powders in KBr pellets are shown for reference, obtained from the online database Wiley SpectraBase.28,29 | ||
Al2Qz3 from Al(acac)3
In an attempt to test an alternative Al-precursor, we used the same Al-source, Al(acac)3, used in the solution-based work by Quinti et al.25 Al(acac)3 has previously been used for ALD to grow Al2O3.32 Unfortunately, despite several attempts, we did not obtain any film when combined with H2Qz. There may be many reasons for this, one of which is that bidentate acac and bidentate Qz form nearly identical bonds with Al3+, giving very little energy incentive for a reaction. A statistical ligand exchange between two isoenergetic ligands should still be possible if the reaction energy barrier was low. However, it seems that a solvent is necessary for this exchange to take place.Optical properties
The Al2Qz3 films were deeply pink to the eye, similar to H2Qz–Al3+ solutions. Fig. 6 shows the UV-Vis transmission measurements of the Al2Qz3 and Al4Pe3 films on silica substrates, in addition to an ethanolic solution of AlCl3 and H2Qz for comparison of absorption peaks. The peak positions and shapes of Al2Qz3 are very similar to those of the solution, indicating that the film material is similar in optical properties to the complexes or polymeric structures formed in solution.25 These peaks are distinctly different from those of a solution containing only H2Qz without any Al3+ as shown in ESI Fig. 7.† The films show a blue shift in the UV range and a red shift in the visible range. The two strongest peaks in solution are shifted from 522.2 and 562.0 nm to 534.6 and 576.2 nm in the film, giving a red shift of the absorbance when Al is bonded to Qz. The Al4Pe3 film shows no absorption. Interference due to the thickness of the film is seen as waves, and the apparent drop in transparency below 240 nm is due to the silica substrate (Fig. 6).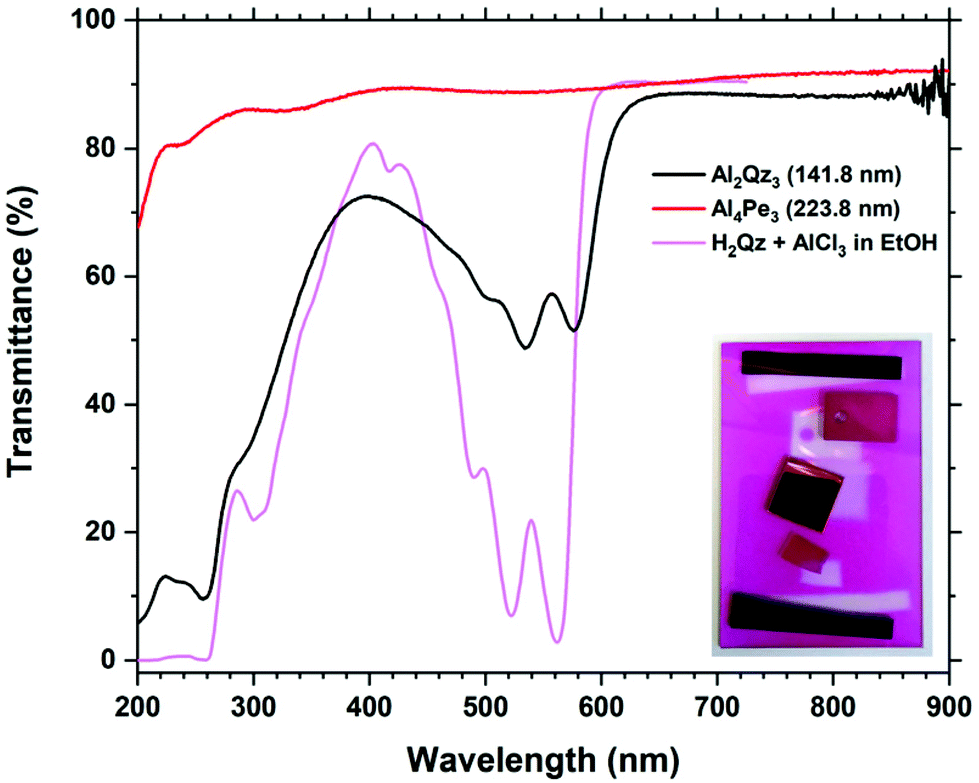 | ||
| Fig. 6 UV-Vis transmission measurements of Al2Qz3 and Al4Pe3 films, both on silica substrates, and a luminescent solution of H2Qz and AlCl3 in ethanol. The photo inset shows the samples for this deposition. The gas inlet and exhaust are at the bottom and top, respectively. From the bottom, the samples are Si, silica, steel, sintered alumina (not used in this article) and Si. | ||
Fig. 7 shows the absorbance and extinction coefficient obtained from the Al2Qz3 films. The optical model used for modelling the ellipsometry data is a general oscillator model with 5 Gaussian absorption peaks in the visible range. It is seen that the optical modelling fits very well with the measured absorption spectrum, showing the model's validity. The model fit to the ellipsometry data is very good, as can be seen in ESI Fig. 2.†
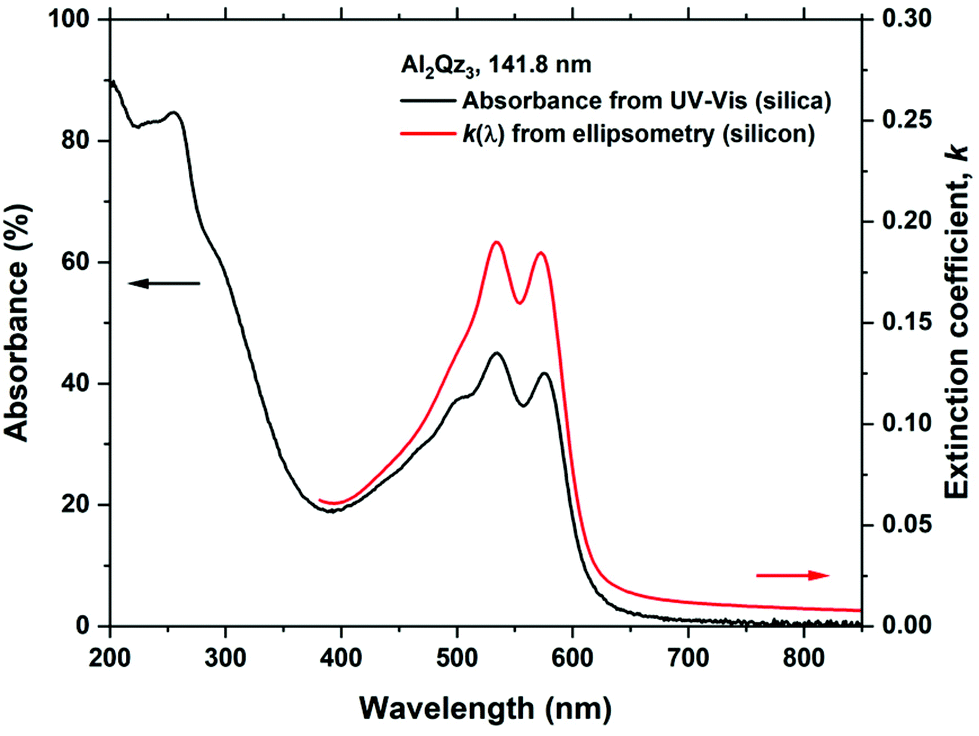 | ||
| Fig. 7 Comparison of absorbance, obtained from transmittance and reflectance measurements on silica substrates, and the general oscillator optical model of the film material based on 5 Gaussian absorption peaks in the visible range. | ||
Dilution with pentaerythritol
The films of Al2Qz3 were not luminescent as deposited. This is likely caused by concentration quenching, as also the dried powder from highly luminescent Al3+ + quinizarin solutions is non-luminescent. To overcome this, we alloyed Al2Qz3 with Al4Pe3 in 1:8 and 1:19 ratios, effectively diluting the concentration of quinizarin molecules, which are the only optically active species. Based on the growth rate of Al4Pe3, the separation of each Al2Qz3 cycle by 8 and 19 Al4Pe3 cycles leads to an approximate Qz–Qz layer separation of 7.2 and 17.1 nm, respectively. This should ensure that no Qz–Qz inter-layer interaction can cause luminescence quenching. Intra-layer or in-plane Qz–Qz interactions from Qz deposited during a single H2Qz pulse are still possible. Despite such layered dilution, these films were not luminescent.
As the in-plane concentration of quinizarin resulting from a single Al2Qz3 cycle may be high enough to cause concentration quenching, we attempted to reduce the in-plane concentration of Qz by pulsing in H4Pe just before the H2Qz pulse. The idea was to occupy some of the TMA-terminated surface sites with H4Pe, resulting in a reduced amount of Qz being deposited for each H2Qz pulse. The regular H2Qz pulse in Al2Qz3 depositions was replaced with an H4Pe pulse immediately followed by an H2Qz pulse in 3 s/1 s and 2 s/2 s ratios. The films resulted in strong gradients in colour, from pink to transparent. Although the gradients are usually not desired, this meant that the concentration of Qz gradually reduced to zero through the sample chamber, and this sample could thus be used in a combinatorial manner. Unfortunately, no part of these films showed any luminescence. A more in-depth investigation into controlling the in-plane and inter-plane concentration of Qz is outside the scope of this work. We believe that proper control of minimum Qz–Qz distances to avoid concentration quenching could lead to the formation of luminescent Al2Qz3 films. This path has previously been explored in other systems, like Al3+ doped ZnO. Learning from these prior works can be a way of finding a solution also for this hybrid system.
Stability
The rapidly increasing number of different hybrid materials that are being produced by ALD and MLD necessarily includes film materials that are air-stable, air-sensitive and anywhere in between. In this work, it is the optical properties which are in focus. Regarding stability in air, we investigated how around 7.5 months of air exposure affected the Al2Qz3 and Al4Pe3 film thicknesses in addition to the optical absorption and refractive index.The Al2Qz3 films show very good stability towards air exposure, with only a 6% increase in the film thickness after 239 days (7 months, 24 days). These materials’ n(λ) and k(λ) values were nearly unchanged as given in ESI Fig. 1,† apart from a slight reduction in n(λ) (n(632.8 nm) = 1.75→1.73) and a very slight sharpening of the visible absorption peaks in k(λ). Al4Pe3, on the other hand, showed more prominent swelling with a thickness increase of 22.5%. The reduction in n(λ) was similarly minute to that for Al2Qz3, n(632.8 nm) = 1.57→1.55. Neither the Al2Qz3 nor Al4Pe3-diluted films showed any evolving luminescence after this air exposure.
Conclusion
In this work, we have obtained deep pink coloured films from TMA and quinizarin with a stoichiometry close to that of Al(OH)Qz, in addition to transparent and optically inactive films from TMA and pentaerythritol by ALD/MLD. Both QCM and XPS show an under-stoichiometry from ideal Al2Qz3. This is interpreted as the presence of unreacted Al–CH3 groups that likely oxidize upon air exposure. An absorbance of 40% in the 500–600 nm range is obtained for a 140 nm thick film. Both Al2Qz3 and Al4Pe3 films are quite air-stable, showing only minor expansion and a slight reduction in the refractive index following long-term (>7 months) air exposure. Al4Pe3 shows clear saturation during both TMA and organic pulse, resulting in a growth rate of 0.90 nm per cycle. Al2Qz3, on the other hand, does not show complete saturation during the organic pulse even for 20 s pulses. When deposited without saturation conditions, Al2Qz3 and Al4Pe3 show gradients in the 14–33% range over a distance of 5 cm. The Al2Qz3 films are non-luminescent, even though similar Al–Qz complexes in solution are highly luminescent. Most likely, the high density of quinizarin in the solid films causes Qz–Qz interactions and concentration quenching. We attempted to “dilute” quinizarin with Al4Pe3 to mitigate such concentration quenching but unfortunately did not obtain luminescent films. This work establishes quinizarin and anthraquinone derivatives as strongly absorbing visible dyes that are surprisingly well suited for ALD/MLD. This class of dye molecules includes a large range of molecules that are quite similar to quinizarin which may be similarly suited, but with a vast range of different optical and electronic properties.Author contributions
Per-Anders Hansen: conceptualization, methodology, investigation, writing – original draft, visualization, and funding acquisition. Ola Nilsen: resources, writing – review & editing, supervision, and funding acquisition.Conflicts of interest
There are no conflicts to declare.Acknowledgements
This work was performed within “The Norwegian Research Centre for Solar Cell Technology” project number 193829, a Centre for Environment-friendly Energy Research co-sponsored by the Research Council of Norway and research and industry partners in Norway. The Research Council of Norway is also acknowledged for the research project “Transition metal and lanthanide based luminescent absorber layer by ALD” with project number 244087. We also acknowledge our colleague Dr Henrik Hovde Sønsteby for performing the XPS characterization and analysis.References
- V. Miikkulainen, M. Leskela, M. Ritala and R. L. Puurunen, J. Appl. Phys., 2013, 113, 021301 CrossRef.
- A. J. M. Mackus, J. R. Schneider, C. MacIsaac, J. G. Baker and S. F. Bent, Chem. Mater., 2019, 31, 1142–1183 CrossRef CAS.
- H. H. Sønsteby, O. Nilsen and H. Fjellvåg, J. Vac. Sci. Technol., A, 2016, 34, 041508 CrossRef.
- P.-A. Hansen, H. Fjellvåg, T. G. Finstad and O. Nilsen, Chem. Vap. Deposition, 2014, 20(7-8–9), 274–281 CrossRef CAS.
- K. B. Klepper, O. Nilsen, P.-A. Hansen and H. Fjellvåg, Dalton Trans., 2011, 40, 4636–4646 RSC.
- K. B. Lausund, M. S. Olsen, P.-A. Hansen, H. Valen and O. Nilsen, J. Mater. Chem. A, 2020, 8, 2539–2548 RSC.
- X. Meng, J. Mater. Chem. A, 2017, 5, 18326–18378 RSC.
- P.-A. Hansen, T. Zikmund, T. Yu, J. N. Kvalvik, T. Aarholt, Ø. Prytz, A. Meijerink and O. Nilsen, Commun. Chem., 2020, 3, 162 CrossRef CAS.
- P.-A. Hansen, C. S. Granerød, Ø. Prytz and O. Nilsen, J. Lumin., 2019, 215, 116618 CrossRef CAS.
- J. N. Kvalvik, J. Borgersen, P.-A. Hansen and O. Nilsen, J. Vac. Sci. Technol., A, 2020, 38, 042406 CrossRef CAS.
- M. N. Getz, O. Nilsen and P.-A. Hansen, Sci. Rep., 2019, 9, 10247 CrossRef PubMed.
- H. H. Sønsteby, E. Skaar, Ø. S. Fjellvåg, J. E. Bratvold, H. Fjellvåg and O. Nilsen, Nat. Commun., 2020, 11, 2872 CrossRef PubMed.
- Z. Giedraityte, M. Tuomisto, M. Lastusaari and M. Karppinen, ACS Appl. Mater. Interfaces, 2018, 10, 8845–8852 CrossRef CAS PubMed.
- M. N. Getz, P.-A. Hansen, O. S. Fjellvag, M. A. K. Ahmed, H. Fjellvag and O. Nilsen, J. Mater. Chem. C, 2017, 5, 8572–8578 RSC.
- H. Zhou and S. F. Bent, J. Vac. Sci. Technol., A, 2013, 31, 040801 CrossRef.
- P. Sundberg and M. Karppinen, Beilstein J. Nanotechnol., 2014, 5, 1104–1136 CrossRef PubMed.
- M. Tuomisto, Z. Giedraityte, L. Mai, A. Devi, V. Boiko, K. Grzeszkiewicz, D. Hreniak, M. Karppinen and M. Lastusaari, J. Lumin., 2019, 213, 310–315 CrossRef CAS.
- J. Cervantes-González, D. A. Vosburg, S. E. Mora-Rodriguez, M. A. Vázquez, L. G. Zepeda, C. Villegas Gómez and S. Lagunas-Rivera, ChemCatChem, 2020, 12, 3811–3827 CrossRef.
- D. K. Palit, H. Pal, T. Mukherjee and J. P. Mittal, J. Chem. Soc., Faraday Trans., 1990, 86, 3861–3869 RSC.
- S. Agrawal, S. M. Clarke, I. J. Vitorica-Yrezabal, C. Liu, W. Fang, P. T. Wood and D. Wright, Mol. Phys., 2019, 117, 3424–3433 CrossRef CAS.
- G. Ramakrishna, A. K. Singh, D. K. Palit and H. N. Ghosh, J. Phys. Chem. B, 2004, 108, 4775–4783 CrossRef CAS.
- S. Rawalekar, S. Verma, S. Kaniyankandy and H. N. Ghosh, Langmuir, 2009, 25, 3168–3172 CrossRef CAS.
- A. L. M. Reddy, S. Nagarajan, P. Chumyim, S. R. Gowda, P. Pradhan, S. R. Jadhav, M. Dubey, G. John and P. M. Ajayan, Sci. Rep., 2012, 2, 960 CrossRef.
- V. Rajshekar Shetty, S. S. Gurukar, R. Marriappa, M. M. Kittappa and D. H. Nagaraju, New J. Chem., 2015, 39, 8534–8544 RSC.
- L. Quinti, N. S. Allen, M. Edge, B. P. Murphy and A. Perotti, J. Photochem. Photobiol., A, 2003, 155, 79–91 CrossRef CAS.
- L. Quinti, N. S. Allen, M. Edge, B. P. Murphy and A. Perotti, J. Photochem. Photobiol., A, 2003, 155, 93–106 CrossRef CAS.
- G. Sauerbrey, Z. Phys., 1959, 155, 206–222 CrossRef CAS.
- http://spectrabase.com/spectrum/6bxGJZ9BHEf .
- http://spectrabase.com/spectrum/24A4lKktwTw .
- Y. Kwon, O. Scadeng, R. McDonald and F. G. West, Chem. Commun., 2014, 50, 5558–5560 RSC.
- X. Xuan, X. Wang and N. Wang, Spectrochim. Acta, Part A, 2011, 79, 1091–1098 CrossRef CAS PubMed.
- M. Nieminen, T. Sajavaara, E. Rauhala, M. Putkonen and L. Niinistö, J. Mater. Chem., 2001, 11, 2340–2345 RSC.
- E. C. Dandley, C. D. Needham, P. S. Williams, A. H. Brozena, C. J. Oldham and G. N. Parsons, J. Mater. Chem. C, 2014, 2(44), 9416–9424 RSC.
Footnote |
| † Electronic supplementary information (ESI) available. See DOI: 10.1039/d1dt00683e |
| This journal is © The Royal Society of Chemistry 2021 |