DOI:
10.1039/D0DT03828H
(Paper)
Dalton Trans., 2021,
50, 1206-1223
Tuning spin-crossover transition temperatures in non-symmetrical homoleptic meridional/facial [Fe(didentate)3]2+ complexes: what for and who cares about it?†
Received
6th November 2020
, Accepted 15th December 2020
First published on 6th January 2021
Abstract
The [FeN6] chromophores found in [Fe(didentate)3]2+ complexes, where didentate is a non-symmetrical 2-(6-membered-heterocyclic ring)-benzimidazole ligand (Lk), exist as mixtures of two geometrical mer (C1-symmetry) and fac (C3-symmetry) isomers. Specific alkyl-substituted six-membered heterocyclic rings connected to the benzimidazole unit (pyridines in ligands L1–L3, pyrazines in L4–L5 and pyrimidines in L6–L7) control the ligand field strength and the electron delocalization so that [FeII(Lk)3]2+ display tunable thermally-induced spin transitions in solution. Thermodynamic, spectroscopic (UV-Vis, NMR) and magnetic studies in solution demonstrate that [Fe(L6)3]2+ (L6 = 1-methyl-2-(pyrimidin-2-yl)-1H-benzo[d]imidazole) exhibits a close to room temperature spin transition (T1/2 = 273(3) K) combined with a high stability formation constant ( in acetonitrile), which makes this complex suitable for the potential modulation of lanthanide-based luminescence in polymetallic helicates. A novel method is proposed for assigning specific thermodynamic spin crossover parameters to fac-[Fe(L6)3]2+ and mer-[Fe(L6)3]2+ isomers in solution. The observed difference relies mainly on the entropic content ΔSmerSCO − ΔSfacSCO = 11(1) J mol−1 K−1, which favors the spin transition for the meridional isomer. Intermolecular interactions occurring in the crystalline state largely overcome minor thermodynamic trends operating in diluted solutions and a single configurational isomer is usually observed in the solid state. Among the thirteen solved crystal structures 1–13 containing the [M(Lk)3]2+ cations (M = Fe, Ni, Zn, Lk = L6–L7), pure meridional isomers are observed six times, pure facial isomers also six times and a mixture (44% mer and 56% fac) is detected only once. Solid-state magnetic data recorded for the FeII complexes show the operation of slightly cooperative spin transitions in 7 (fac-[Fe(L6)3]2+) and 12 (mer-[Fe(L7)3]2+). For the meridional isomer in 6, a two-step spin state transition curve, associated with two phase transitions, is detected.
Introduction
Faced with the duality of paramagnetism measured for [Fe(H2O)6]2+ and diamagnetism for [Fe(CN)6]4−, Pauling exploited valence bond theory in 1931 to develop the concept of ‘magnetic criterion of bond type’ (Scheme 1a).1,2 He also recognized that two molecular systems with different spin states could be present simultaneously at a given temperature, according that the energy difference between them is comparable with thermal energy (mRT with 1 ≤ m ≤ 10).3,4 The concomitant isolation by Cambi et al. of FeIII complexes with dithiocarbamate ligands displaying thermal spin-state equilibria are still considered as the first experimental demonstration of what is known as the spin crossover (SCO) phenomenon.5–7 The formulation of the crystal-field theory,8 further extended and improved by the ligand field theory,9–11 provided a better description of chemical bonding for open-shell transition metal complexes (Scheme 1b). The SCO phenomenon exhibited by d6 FeII in an octahedral environment could be then quantified as twice the difference between the ligand field strength Δoct and the spin pairing energy P, the latter being modeled with the help of the Racah parameters B and C to give P = 2B + 4C ≈ 19B (Scheme 1b).12 A complete ligand-field picture is provided by the relevant Tanabe–Sugano diagram, which displays the relative energies of all the Russell–Saunders multiplet terms arising from the d6 configuration as a function of the Δoct/B ratio (Scheme 1c).13
 |
| | Scheme 1 a) Illustration of early Pauling's magnetic criterion of bond type; (b) crystal field/ligand field approach to spin crossover phenomenon (P is the electron spin pairing energy); (c) Tanabe–Sugano diagram for a d6 metal ion completed with a central red domain, which corresponds to non-accessible ligand-field strengths and green domains where low-spin and high-spin complexes co-exist at accessible temperatures ( ). Adapted from ref. 16 and 17. ). Adapted from ref. 16 and 17. | |
The strict equality Δoct = P,  , leads to Δoct/B ≈ 19 and an equal population of 1A1 and 5T2 levels represented by a vertical dashed line (Scheme 1c). However, this approach is misleading and physically unsound since the vertical dashed line in the Tanabe–Sugano diagram (Scheme 1c) refers to a non-equilibrium geometry. Indeed, the population of the antibonding orbitals in high-spin FeII is accompanied by a 10% elongation of the Fe–N bond lengths14 together with minor geometrical distortions,15 which affect Δoct and P during the spin transition. Taking this into account, a domain in the Tanabe–Sugano diagram is no more accessible to coordination complexes (red surface in Scheme 1c), whereas two restricted domains (green surfaces in Scheme 1c) correspond to the limits 11
![[thin space (1/6-em)]](https://www.rsc.org/images/entities/char_2009.gif) 000 ≤ ΔHSoct ≤ 12500 cm−1 and 19000 ≤ ΔLSoct ≤ 22000 cm−1 for which the phenomenon of a thermal spin transition (
000 ≤ ΔHSoct ≤ 12500 cm−1 and 19000 ≤ ΔLSoct ≤ 22000 cm−1 for which the phenomenon of a thermal spin transition ( with 1 ≤ m ≤ 10) can be expected in FeII coordination complexes with standard Racah parameters.12,16 Consequently, an adequate modeling of SCO behaviors requires looking beyond ligand-field theory with the help of quantum chemistry for mapping quantitatively the energy surfaces at equilibrium geometries associated with the 1A1 and 5T2 terms.21 Although significant progress is being made along this line,18–23 reliable models for the prediction of molecular SCO systems are still limited because they involve open-shell species and small energy differences.24 The systematic exploration of classes of ligands is thus the rule for designing molecular SCO complexes in coordination chemistry. Myriads of six-coordinate SCO FeII complexes have been thus actively synthesized, characterized and a posteriori rationalized. This global effort has been regularly and extensively reviewed during the last two decades in specialized journals14,25–35 and in two comprehensive monographies.36,37 There is no doubt that the pseudo-octahedral [FeN6] chromophore, where N stands for a heterocyclic nitrogen donor atom, is one of the most studied and versatile unit for implementing FeII SCO properties in molecular complexes. Some ‘rules of thumb’ could be extracted from empirical analyses of structure–properties relationships. For instance, Shatruk and coworkers used the interatomic separation between the N-donor atoms in multidentate chelate ligands as a metric guide for programming SCO properties in FeII complexes,38 whereas Brooker, Garden and coworkers reported on more sophisticated density functional theory (DFT) calculations for predicting the 15N NMR shifts in 1,2,4-triazole ligands, which can be then used as a criterion for rationalizing SCO behaviors.24
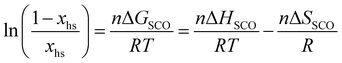
Short-range and long-range orders produced by packing interactions in solid state samples drastically complicate the situation because intermolecular energies usually dominate the minor energy changes accompanying the spin state transition at the molecular level,30,39–42 a phenomenon often at the origin of specific phase transitions accompanying the spin crossover process in the solid state.39,43 Whereas spin-state transitions implying solvated complexes in solution can be satisfyingly modeled with the standard entropy of mixing according to the simple chemical equilibrium (1) and associated stability constant KSCO,44,45 intermolecular communications produce some cooperative effects in the solid state, which can be implemented either by adding an interaction term Γ(xhs, T, P) = γ·xhs·(1 − xhs) to give eqn (2), where γ is an adjustable interaction parameter,43,46 or by considering non-randomly distributed domains containing n molecules of like spin in eqn (3) and (4), where Cp are the heat capacities at constant pressure.43,47
| |  | (1) |
| |  | (2) |
| |  | (3) |
with
| |  | (4) |
Since precise chemical programming of spin state transitions are not accessible in solution, there is much less chance to propose some reliable design in solids, and major interest in the SCO community moved toward the systematic structural exploration of classes of ligands and complexes for designing addressable (via temperature, pressure, light) switches implemented in various materials (solids, films, nanoparticles, liquid crystals, etc.).37,48–53 The deliberate combination of SCO properties with other physical or chemical properties in a synergetic fashion in molecular entities, summarized under the term of multifunctionality,54–56 remains in its infancy despite remarkable efforts focused on the modulation of magnetic communication57,58 and luminescence.59 For instance, the modulation of an emissive lanthanide by an adjacent SCO FeII metallic site in an isolated dimetallic complex has been recently attempted (Fig. 1), but it proved to depend crucially on some ultra-precise tuning of the spin state equilibrium, which is currently beyond rational chemical design.60
 |
| | Fig. 1 Molecular structure of the [EuFeL3]5+ helicate in which red luminescence (620 nm) is modulated via energy transfer (ET) to the adjacent SCO FeII unit.60 | |
Starting from the didentate 2-(α-methyl-substituted pyridine)-benzimidazole ligands L1–L3 (Scheme 2), which exactly model the didentate units bound to FeII in the [EuFeL3]5+ helicate, some systematic exploration of structurally related 2-(α-methyl-substituted pyrazine)-benzimidazole L4–L5 allowed some shifts of T1/2 in the mononuclear [Fe(didentate)3]2+ model complexes, but none of them improved the situation in the helicates.16,61 Moreover, simple mononuclear [Fe(didentate)3]2+ complexes exist as mixtures of meridional and facial isomers, for which only the latter one can be taken as a valuable model for the triple-stranded [EuFeL3]5+ helicates.61
 |
| | Scheme 2 Chemical structures of the didentate ligands L1–L7, together with the electronic properties of the associated pseudo-octahedral [Ni(Lk)3]2+ complexes and thermodynamic SCO properties of the pseudo-octahedral [Fe(Lk)3]2+ complexes in CD3CN solutions. | |
We report here the connection of a 2-pyrimidine ring (L6) or a 4-pyrimidine ring (L7) to the benzimidazole ring, which eventually provides [Fe(Lk)3]2+ complexes possessing lower transition temperatures compatible with luminescence modulation in triple-stranded helicates (Scheme 2). A novel approach for the estimation of specific thermodynamic SCO parameters for meridional and facial isomers in solution is described.
Results and discussion
Design, synthesis and characterization of the didentate pyrimidine–benzimidazole ligands L6 and L7
In an elegant contribution,24 Brooker, Garden and co-workers suggested that the 15N NMR chemical shifts recorded for the binding nitrogen atom of the azine ring in a series of didentate triazole–azine ligands (LAzine) can be taken as a valuable indicator for both the electronic density borne by the N-donor atoms and their capacity to control the critical temperature T1/2 of spin transitions for [Fe(LAzine)2(NCBH3)2] in solution. The decreasing order found for T1/2 (pyrazine > pyridine > pyrimidine) matches that reported in Scheme 2 for the two first related complexes [Fe(L4)3]2+ (pyrazine) > [Fe(L1)3]2+ (pyridine) and encourages us to prepare 2-pyrimidine (L6) and 4-pyrimidine (L7) analogues for (i) shifting T1/2 toward lower temperatures in [Fe(Lk)3]2+ and (ii) further exploring the effect of meridional ↔ facial isomerization on the SCO properties.
The ligands L6–L7 were thus synthesized (Scheme 3) using a well-established strategy based on modified Philips condensation reactions for the formation of benzimidazoles as key steps.62 Pyrimidine-carboxylic acids, contrary to pyrazine-2-carboxylic acid,16,62 could be activated in situ to pyrimidine-2-carbonyl chloride through standard reactions with either thionyl chloride or oxalyl chloride. The 1H NMR and 13C NMR spectra (Scheme 4a and Fig. S1–S12†) point to fast rotations around the inter-annular C–C bond leading to average Cs-symmetry on the NMR time scale. The lack of NOE effect between the protons of the methyl group of the benzimidazole and the pyrimidine proton at the 5-position of the pyrimidine in L7 suggests a preferred average planar conformation in solution with an anti location of the N-donor atoms in the free didentate ligand (shown in Schemes 3 and 4). These structural characteristics are supported by gas-phase energies computed as a function of the interplanar angle between the two aromatic rings (Fig. S13†). Finally, indirect 1H–15N detection (Fig. S6 and S12†)63 shows that the N-donor atom of 2-pyrimidine in L6 is less shielded than that in 4-pyridimidine in L7 (Scheme 4b), an experimental result which is confirmed by the larger negative charge computed for the azine donor group in L7 (Fig. S14†).
 |
| | Scheme 3 Multistep synthesis of the didentate ligands L6 (2-pyrimidine) and L7 (4-pyrimidine). | |
 |
| | Scheme 4 a) 1H NMR chemical shifts (with respect to tetramethylsilane at 0 ppm in CD3CN) and (b) 15N NMR chemical shifts (with respect to nitromethane at 381.7 ppm in CD2Cl2) observed for ligands L6 and L7. | |
Slow diffusion of n-hexane into concentrate solutions of L6 and L7 in dichloromethane yielded crystals suitable for X-ray diffraction analysis (Tables S1–S6 and Fig. S15–S20†). Each unit cell contains two slightly different molecules of the ligands, both confirming the formation of almost planar didentate aromatic units adopting anti arrangements of the N-donor atoms (Fig. 2).
 |
| | Fig. 2 Molecular structures of the two different molecules in the unit cells of the crystal structures of (a) L6 (interplanar angles 5.93(5)° and 9.71(5)°) and (b) L7 (interplanar angles 7.65(8)° and 12.73(8)°). The N-donor atoms are highlighted as blue spheres. | |
Complexation of the didentate pyrimidine–benzimidazole ligands L6 and L7 with ZnII, NiII and FeII in solution
Reactions of L6 or L7 with M(CF3SO3)2 (M = Zn, Fe) or Ni(BF4)2 in acetonitrile is characterized by a red-shift of the ligand-centered π* ← n,π electronic transitions (Fig. S21a–S24a†). Similar shifts were originally reported for 2,2′-bipyridine,64 and could be theoretically assigned to the anti → syn conformational change of the α,α′-diimine binding unit accompanying its chelate complexation to the metal.65,66 The spectrophotometric titrations of submillimolar concentrations of the ligands L6 and L7 in dry acetonitrile with Zn(CF3SO3)2 were therefore exploited for the quantitative analysis of the successive formation of three complexes, characterized by smooth endpoints at Zn/Lk = 1:3, Zn/Lk = 1:2, Zn/Lk = 1:1 (Fig. S21b–S22b†). This trend was further confirmed by factor analysis (Fig. S21c–S22c†), which suggested the existence of four individual absorbing eigenvectors Lk, ZnLk, Zn(Lk)2 and Zn(Lk)3 with satisfying re-constructed absorption spectra (Fig. S21d–S22d†).67–70 Non-linear least-squares fit to equilibria (5)–(7) provided satisfying estimates for the formation macroconstants  gathered in Table 1 (column 1, entries 1 and 2).71–73
| | 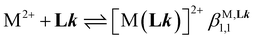 | (5) |
| |  | (6) |
| |  | (7) |
Table 1 Stability constants for the successive formation of [M(Lk)n]2+ (M = Zn, Ni, Fe, Lk = L6, L7, n = 1, 2, 3, non-coordinating anions: ClO4−, CF3SO3− or BF4−) in acetonitrile (293 K), metal–ligand interaction parameter (fM,Lk) and inter-ligand interaction parameter (uLk,Lk), and associated energies ΔGaffinity = −RTln(fM,Lk) and ΔEinteraction = −RTln(uLk,Lk)
| |
|
log(fM,L) |
ΔGaffinity/kJ mol−1 |
log(uL,L) |
ΔEinteraction/kJ mol−1 |
| [Zn(L6)n]2+ |
log(β1,1) = 7.02(4) |
6.0(4) |
−34.4(2.4) |
0.7(5) |
−3.6(2.8) |
|
|
log(β1,2) = 15.2(1) |
|
|
log(β1,3) = 21.8(1) |
| [Zn(L7)n]2+ |
log(β1,1) = 5.10(1) |
3.9(2) |
−22.1(9) |
0.2(2) |
−1.3(1.1) |
| log(β1,2) = 10.22(2) |
| log(β1,3) = 14.07(4) |
| [Fe(L6)n]2+ |
log(β1,1) = 5.0(1) |
4.1(5) |
−23.2(2.7) |
0.3(6) |
−1.6(3.2) |
| log(β1,2) = 10.95(1) |
| log(β1,3) = 15.70(1) |
| [Ni(L7)n]2+ |
log(β1,1) = 4.11(1) |
3.0(2) |
−16.8(1.3) |
1.0(3) |
−5.8(1.5) |
| log(β1,2) = 9.22(1) |
| log(β1,3) = 13.65(1) |
Taking the experimental 15N HMR chemical shifts (Scheme 4b) as a body of evidence for optimizing M-σL binding and stability upon coordination to spherical and ionic Zn2+, one can reasonably predict 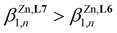 . However, the reverse situation holds with a cumulative constant log(
 ) = 14.07(4), found for [Zn(L7)3]2+, being almost 8 orders of magnitude smaller than log(
 ) = 21.8(1) (Table 1). Translated into ligand speciation,73 these thermodynamic constants imply that the target saturated complex [Zn(L6)3]2+ is quantitatively formed (>98%) in solution for a stoichiometric ratio Zn:L6 = 1:3 and a total ligand concentration of 10 mM (Fig. 3a). For [Zn(L7)3]2+, a maximum of 82% of this complex can be detected in acetonitrile for a total ligand concentration of 10 mM (Fig. 3b). Its quantitative formation (≥97%) requires a ten times larger total concentration of ligand L7 (100 mM, Fig. 3c).
 |
| | Fig. 3 Concentration profiles obtained using HySS2009 simulation73 and the formation constants collected in Table 1 for the complex species (a) [Zn(L6)n]2+ at |L6|tot = 10 mM, and (b and c) [Zn(L7)n]2+ at (b) |L7|tot = 10 mM and (c) |L7|tot = 100 mM (acetonitrile, 293 K). | |
We conclude that σ-donation from the bound ligand to Zn2+ is not the only important thermodynamic driving force. Comparison with the previous azine found in [Zn(L4)n]2+ (Table S7†)74 shows that L4 (2-pyrazine, pKa = 0.65), which is a much weaker σ-donor but a stronger π-acceptor than L7, indeed provides stability constants up to three orders of magnitude larger than those observed for [Zn(L7)n]2+ (4-pyrimidine, pKa = 1.23). Surprisingly, the stability constants of [Zn(L6)n]2+ (2-pyrimidine, pKa = 1.23) largely overcome those of its azine analogues with L4 and L7, and can be only compared with that produced by the more basic 2-pyridine ring (pKa = 5.2) in [Zn(L1)n]2+ (Table S7†). In fact, the complexation of L1, L4 and L7 with the entering cation is limited by some considerable energetic penalties accompanying the anti → syn conformational change of the chelate α,α′-diimine unit. On the contrary, L6 is ‘symmetrically preorganized’ and no ligand reorganization is required. This beneficial effect is reminiscent to the gain of four orders of magnitude in stability observed in going from [Zn(2,2′-bipyridine)3]2+ (log(β1,3) = 13.2(2)) to [Zn(1,10-phenanthroline)3]2+ (log(β1,3) = 17.1(1)) in water.75
A deeper and quantitative analysis relies on the site binding model (eqn (8)),76–78 which combines a statistical factor Kstat1,n (related to the contribution produced by the change in rotational entropy between the reactants and products and to the entropy of mixing of enantiomers),79–81 with a chemical contribution Kchem1,n made up of two microscopic chemical parameters  and
and  . The first term
  stands for the intermolecular microscopic affinities (including desolvation) characterizing the free energy of inner sphere connection of the didentate binding site in Lk to MII (
 ) and
) and 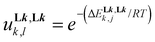 accounts for the free energy of interligand interactions (
 ), which operate when two ligands are bound to the same metallic centre.
| |  | (8) |
Application of eqn (8) to all possible geometric isomers of pseudo-octahedral [Zn(Lk)(S)4]2+ (one isomer, S = solvent), [Zn(Lk)2(S)2]2+ (five stereoisomers) and [Zn(Lk)3]2+ (two stereoisomers) has been previously detailed (Fig. S25†)74 and provides eight micro-constants which can be combined to give a global model (eqn (9)–(11)) for the three macro-constants characterizing equilibria (5)–(7).
| |  | (9) |
| |  | (10) |
| |  | (11) |
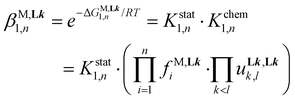
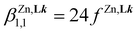
Assuming the operation of a single average intermetallic interaction  reduces the number microscopic descriptors to fZn,Lk and uLk,Lk for modelling the three macroscopic constants obtained by spectrophotometry (eqn (9), (12) and (13)).
| |  | (12) |
| |  | (13) |
Linear least-squares fits of the logarithmic forms provide the affinity parameters  and interligand interactions
  gathered in Table 1 (columns 3–6), which satisfyingly reproduce the experimental data. Altogether, this rough thermodynamic model establishes that (i) the affinity of the selected didentate ligands for spherical Zn2+ (
 ) follows the trend L1 (2-pyridine) ≈ L6 (2-pyrimidine) > L4 (2-pyrazine) ≫ L7 (4-pyrimidine) and (ii) the successive binding of ligands leading to [Zn(Lk)3]2+ follows a weakly cooperative procedure (
 ).
).
Repeating the spectrophotometric titrations for submillimolar concentrations of the ligands L6 and L7 in dry acetonitrile with Fe(CF3SO3)2 lead to smoother endpoints for L6 (Fig. S23†) and to only poor drifts for L7. Satisfying factor analysis and non-linear least-squares fit using equilibria (5)–(7) could be obtained for L6. The associated macro-constants  are however drastically reduced by two to five orders of magnitude in going from Zn2+/L6 (Table 1, entry 1) to Fe2+/L6 (Table 1, entry 3). Though less pronounced, the same trend was previously reported for 2-pyrazine-benzimidazole L4 ligands in going from Zn2+ to Fe2+ (Table S7†).61 The replacement of ligand L6 with L7 leads to
  , a trend which strictly mirrors that previously observed for Zn2+. Finally, titrations of L7 with analogous Ni2+ cations (Fig. S24†) additionally fixes
  in line with the well-known Irving–Williams series (Table 1, entry 4).16,82,83 Consequently, the speciation profiles computed for Fe2+/L6 (Fig. S26†) mirror those highlighted for Zn2+/L7 (Fig. 4b and c), which possess similar stability constants, but the Fe2+/L7 system is expected to produce much smaller quantities of [Fe(L7)3]2+, which are overcome by those computed for [Ni(L7)3]2+ (Fig. S27†).
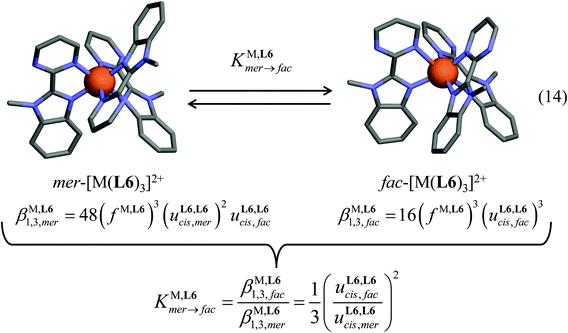 |
| | Fig. 4 Meridional to facial isomerization process operating in [M(Lk)3]2+ complexes (eqn (14)) together with its modeling with the help of the site binding model. The molecular structures are those found in the crystal structures of [Zn(L6)3](ClO4)2 (CH3CN)2.5 (1). | |
Meridional to facial isomerization process operating for [Zn(Lk)3]2+ (Lk = L6 and L7) in solution
A focus on the target [M(Lk)3]2+ complexes requires the variable-temperature analysis of the thermodynamic equilibrium (14) linking the meridional and facial isomers (Fig. 4). This challenge can be addressed for diamagnetic closed-shell [Zn(Lk)3]2+ cations with the help of variable-temperature 1H NMR spectra.
At room temperature in CD3CN and CD3OD, both [Zn(L6)3]2+ (10 mM) and [Zn(L7)3]2+ (0.1 M) are quantitatively (>95%) formed and display dynamically average C3-symmetrical symmetries on the NMR time scale (Fig. S28 and S29†). Upon stepwise decrease of the temperature, the dynamic exchange process slows down so that the 1H NMR spectra display two series of resolved signals, which can be assigned to a mixture of mer-[Zn(Lk)3]2+ (C1 symmetry, three signals for a given proton) and fac-[Zn(Lk)3]2+ (C3 symmetry, one signal for a given proton, Fig. S28 and S29†). Integration of low temperature 1H NMR data provides the experimental ratio of the concentrations mer-[Zn(Lk)3]2+/fac-[Zn(Lk)3]2+, from which  can be estimated at different temperatures. Van't Hoff plots display linear correlations (Fig. S30†) and lead to enthalpic and entropic contributions collected in Table 2 together with speciations highlighted in Fig. 5. As previously reported for mer-[Zn(Lk)3]2+ → fac-[Zn(Lk)3]2+ equilibria with L1 (2-pyridine) and L4 (2 pyrazine, Table S8†),74 the latter mer → fac isomerization process for L6 and L7 is solvent dependent and deviates from a pure statistical behavior (
 and
and  = −RT·ln(1/3) = 2.7 kJ mol−1 at 298 K).
 |
| | Fig. 5 Reconstruction of the mole fractions of the meridional and facial isomers for the complex [Zn(L6)3]2+ in (a) CD3CN and (b) CD3OD, and (c) for the complex [Zn(L7)3]2+ in CD3OD as a function of temperature. The circles represent the accessible experimental data for which the dynamic of mer ↔ fac isomerization is slow on the 1H NMR time scale. | |
Table 2 Thermodynamic enthalpic ( ) and entropic (
 ) contributions to equilibrium (14) in solution
The enthalpic preference for the facial isomer (−7.3 ≤  ≤ −2.8 kJ mol−1, Table 2), in which each benzimidazole N-donor atom is bound trans to the N-atom of the pyridimidine ring, is reminiscent of the thermodynamic trans influence.74,84 The opposite entropic preference for the meridional isomer (4.8 ≤
  ≤ 11.3 kJ mol−1 at 298 K, Table 2), which is significantly larger than the pure statistical contribution of 2.7 kJ mol−1 at 298 K, has been previously attributed to the larger relaxation of the solvent organization around the meridional isomer which possesses a smaller dipole moment.74
Due to the remarkable stability found for [Zn(L6)3]2+ in solution, the kinetic rate constant of the mer ↔ fac isomerization process (eqn (14)) is small enough to give resolved 1H NMR spectra for each isomer on the NMR time scale in acetonitrile prior to reach its freezing point (233 ≤ T ≤ 258 K, Fig. 6a and S28†). The situation changes with the less stable [Zn(L7)3]2+ complex, and the coalescence temperature for the 1H NMR signals lie below the freezing point of CD3CN (228 K). In deuterated methanol, some resolved 1H NMR signals can be obtained for T < 228 K (Fig. S29†) for both [Zn(L6)3]2+ (Fig. 5b) and [Zn(L7)3]2+ (Fig. 5c).
 |
| | Fig. 6 Plot of molar paramagnetic magnetic susceptibility (χparaMT) versus temperature (T) for a 10.2 mM solution of the complex [Fe(L6)3]2+ in CD3CN (green), and a 21.3 mM solution of the complex [Fe(L7)3]2+ in CD3CN (orange). The black dashed curves represent the best fit obtained by using eqn (20) and the thermodynamic and magnetic parameters collected in Table 3. | |
Electronic and spin crossover properties of [Fe(L6)3]2+ and [Fe(L7)3]2+ in solution
According to Busch and co-workers,85 the easily accessible ligand field strengths measured for the pseudo-octahedral [Ni(Lk)3]2+ complexes can be used as a reliable benchmark (11200 ≤ Δoct(NiII) ≤ 12400 cm−1) for predicting and rationalizing spin-crossover operative in the related FeII complexes. The absorption spectra recorded for 0.1 M acetonitrile solution of [Ni(Lk)3]2+ (Lk = L6, L7, Fig. S31 and S32†) display Ni(3T2 ← 3A2) transitions at 11079 cm−1 for L6 and 11237 cm−1 for L7, which can be used as estimates for Δoct (Table S9†).61,86–88 Altogether, the four [Ni(Lk)3]2+ complexes (Lk = L1, L4, L6 and L7) possess very similar electronic properties with an average value of Δoct/B = 13.2(2) compatible with SCO behavior around room temperature for the related [Fe(Lk)3]2+ complexes (Scheme 2).61,85 Variable temperature 1H NMR spectra recorded for 0.1 mM solution of [Fe(L6)3]2+ in acetonitrile (233–298 K) indeed unambiguously demonstrate the existence of temperature-dependent paramagnetic shifts which are diagnostic for the formation of increasing amounts of fast-relaxing high-spin FeII (S = 2) at high temperature (Fig. S33†). However, the broadening of the signals due to the combination of low-spin to high-spin transformation with thermally-activated mer ↔ fac isomerization prevents the change in chemical shifts to be exploited for extracting reliable speciation in solution and associated spin state equilibria.89,90
Alternatively, the total magnetic susceptibility of a paramagnetic solute χparaM (cm3 mol−1) can be obtained with the help of Evans’ method,45,91–93 adapted for the temperature dependence of solvent density94 and for an adequate treatment of the various diamagnetic corrections (eqn (15); Sf = 4π/3 is the shape factor of the superconducting magnet, ν0 is the Larmor frequency of the spectrometer in Hz, Δv = vref − vint is the difference in Hz between the frequency of the standard (tert-butanol) in contact with the complex of interest (vref = δref·vo) and that of the standard (vint = δint·vo) placed in the coaxial tube in absence of complex, M is the molecular weight in g·mol−1 of the paramagnetic complex or of its diamagnetic analogue when FeII is replaced with ZnII, and m is the concentration of the pertinent complex in g cm−3, Fig. S34†).95,96
| |  | (15) |
Application of eqn (15) for the variable-temperature shifts of the 1H-NMR signals recorded for tert-butanol in acetonitrile solutions of [Fe(L6)3]2+ (10.2 mM, Fig. S34†) and [Fe(L7)3]2+ (21.3 mM), while using [Zn(L6)3]2+ (13 mM) as the diamagnetic reference, eventually gave plots of χparaMT versus T, which are diagnostic for the operation of spin crossover in solution (Fig. 6).
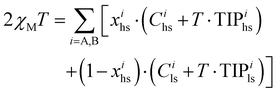
The general expression of the Curie law, corrected for diamagnetism, for a mixture containing high-spin (mole fraction xhs) and low-spin (mole fraction xls) complexes is given in eqn (16), where Chs and Cls are the Curie constants for the high-spin and low-spin forms (C = (g2/8)S(S + 1) within the frame of the spin-only approximation) and TIPhs and TIPls are the temperature-independent paramagnetic contributions.39,45
| | | χparaMT = xhs·(Chs + T·TIPhs) + xls·(Cls + T·TIPls) | (16) |
The introduction of mass balance (xls + xhs = 1) gives a straightforward access to the speciation (eqn (17) and Fig. 7). The consideration of spin-state eqn (1) eventually transforms eqn (16) into eqn (18) (see ESI Appendix 1†).61
| |  | (17) |
| |  | (18) |
 |
| | Fig. 7 Plot of high-spin mole fraction (estimated from χparaMT by using eqn (17)) versus temperature (T) for a 10.2 mM solution of the complex [Fe(L6)3]2+ in CD3CN (green circles) and its analysis using eqn (20) as originating from fac-[Fe(L6)3]2+ (blue trace) and mer-[Fe(L6)3]2+ (red trace) controlled by the isomerization constant  . . | |
The non-linear least-square fits of the experimental paramagnetic data depicted in Fig. 6 for [Fe(L6)3]2+ and [Fe(L7)3]2+ by using eqn (18) provides Curie constants, TIP and thermodynamic parameters ΔHSCO and ΔSSCO for the spin crossover equilibrium gathered in Table 3 (see ESI Appendix 1 for details†).
Table 3 Magnetic and thermodynamic parameters obtained from the non-linear least square fits of χparaMT vs. T plots recorded for [Fe(Lk)3]2+ complexes in solution (CD3CN)
| Complex |
Anion |
C
hs/cm3 K mol−1 |
TIPhs× 10−6/cm3 mol−1 |
C
ls/cm3 K mol−1 |
TIPls× 10−6/cm3 mol−1 |
ΔHsco/kJ mol−1 |
ΔSsco/J mol−1 K−1 |
T
1/2/K |
Ref. |
|
100% low-spin at all studied temperatures.
100% high-spin at all studied temperatures.
C
ls and TIPls found for [Fe(bipy)3]2+ and Chs and TIPhs found for [Fe(L2)3]2+ have been used in ref. 65 for fitting the SCO behaviors.
|
| [Fe(bipy)3]2+a |
CF3SO3− |
— |
— |
0.00(8) |
351(55) |
— |
— |
— |
61
|
| [Fe(L2)3]2+b |
PF6− |
3.44(2) |
358(57) |
— |
— |
— |
— |
— |
61
|
| [Fe(L1)3]2+ |
PF6− |
3.44c |
358c |
0.00c |
351c |
28.6(3) |
91.5(8) |
313(4) |
61
|
| [Fe(L4)3]2+ |
CF3SO3− |
3.44c |
358c |
0.00c |
351c |
35.7(3) |
101(1) |
351(5) |
61
|
| [Fe(L6)3]2+ |
BF4− |
4.10(3) |
369(3) |
0.00 |
342(3) |
19.5(2) |
71.3(6) |
273(3) |
This work |
| [Fe(L7)3]2+ |
PF6− |
3.595(3) |
368.8(2) |
0.00 |
346.2(3) |
23.01(2) |
82.5(1) |
279(1) |
This work |
The Curie constants C and TIP values found for [Fe(L6)3]2+ and [Fe(L7)3]2+ (Table 3, entries 5–6) are typical for the [FeN6] chromophores previously investigated in [Fe(didentate)3] complexes.16,61,97–102 One notes that CHS > 3.00 cm3 K mol−1 (spin only value) can be taken as the signature of some partially unquenched orbital momentum in this pseudo-octahedral environment. The thermodynamic parameters 19.5 ≤ ΔHSCO ≤ 23 kJ mol−1 and 71 ≤ ΔSSCO ≤ 83 J mol−1 K−1 measured for [Fe(L6)3]2+ and [Fe(L7)3]2+ also match the usual range found for similar complexes in solution.45,97,98 Interestingly, the pyrimidine rings in ligands L6 and L7 produce the weakest enthalpic change accompanying the spin crossover process in solution compared with pyridine in L1 and pyrazine in L4. Due to partial H/S compensation101–105 established for SCO processes,105 a satisfying ΔHSCO = α·ΔSSCO + β linear correlation is observed for the series of [Fe(Lk)3]2+ complexes with α = 601(103) K and β = −24936(9020) J mol−1 (Fig. S35†). Consequently, the transition temperature T1/2 = ΔHSCO/ΔSSCO = α + (β/ΔSSCO) in CD3CN decreases with ΔSSCO (since β < 0) and reaches its lowest value for [Fe(L6)3]2+ (273 K) followed by [Fe(L7)3]2+ (279 K), [Fe(L1)3]2+ (313 K) and [Fe(L4)3]2+ (351 K, Table 3, column 9).
However, the unavoidable mer ↔ fac equilibrium (14) depicted in Fig. 4 implies that the above rough analysis of the SCO processes operating in [Fe(didentate)3]2+ complexes in solution is of limited pertinence when the didentate ligand is non-symmetrical.33,61 A pioneering attempt to obtain specific SCO thermodynamic contributions for fac-[Fe(Lk)3]2+ and mer-[Fe(Lk)3]2+ isomers used non-covalent lanthanide tripods to force facial arrangement around FeII as illustrated in the dimetallic triple-stranded helicate (Fig. 1). The associated thermodynamic data recorded in solution for the SCO processes occurring in LaFe-helicates, where the didentate units bound to FeII mirrors ligands L1 and L4, were taken as valuable models for fac-[Fe(Lk)3]2+ complexes. The thermodynamic characteristics of mer-[Fe(Lk)3]2+ could be then deduced from the χparaMT versus T plots recorded for standard solution mixtures according that  are at hand at each temperature.61 We propose here a parallel approach which takes reasonably for granted that the Curie constants C and the TIP contributions are identical for the fac and mer isomers of the same complex. Moreover, one also assumes (still reasonably) that the thermodynamic data extracted from VT-NMR analysis for the isomerization process operating in [Zn(Lk)3]2+ holds true for [Fe(Lk)3]2+ (in other words
  ). With this in mind, eqn (16) can re-written as eqn (19) and the introduction of the thermodynamic constants Kmer→fac and KSCO finally yields eqn (20) (see ESI Appendix 2 for details†).61
| | | χparaMT = (xfachs + xmerhs)·(Chs + T·TIPhs) + (xfacls + xmerls)·(Cls + T·TIPls) | (19) |
| |  | (20) |
The systematic application of the van't Hoff relationship ΔG° = –RTln(K) = ΔH° − TΔS° for estimating the various stability constants together with (i) the use of  and
and  gathered in Table 2 for L6 in CD3CN and (ii)
  , allows the satisfying non-linear least-square fits with eqn (20) of χparaMT versus T plots for fac-[Fe(L6)3]2+ and mer-[Fe(L6)3]2+ (Fig. 7). In complete agreement with the previous analysis using a loosely constrained triple-stranded LaFe helicate for modeling fac-[Fe(Lk)2]2+ (Lk = L1, L4),61 this alternative approach avoids the synthesis of the related helicates and confirms that the SCO enthalpies are only marginally larger for the facial isomer (≈1 kJ mol−1). However, the SCO entropy is systematically more favorable for the meridional isomer mer-[Fe(L6)3]2+ by ΔSmerSCO− ΔSfacSCO = 11(1) J mol−1 K−1, a value mirroring those previously reported for mer-[Fe(L1)3]2+ (14(2) J mol−1 K−1) and mer-[Fe(L4)3]2+, (11(1) J mol−1 K−1).61 In going from facial to meridional isomer in [Fe(Lk)3]2+, H/S anti-compensation seems to be the rule since the spin transitions, which occur in mer-[Fe(Lk)3]2+ are concomitantly favored over fac-[Fe(Lk)3]2+ by (i) a lower enthalpy cost and a (ii) larger entropic gain (see Fig. 7).
The different enthalpic contributions are reminiscent of the concept of trans influence which is thought to strengthen Fe–N bonds in the facial isomer. The entropic preference exhibited by the meridional isomer might be relevant to solvation effects. Indeed, the primary change in solvation energy accompanying the low-spin to high-spin transition is produced by the expansion of [Fe(Lk)3]2+ considered as a charged monopole.106,107 The associated endergonic change ΔΔsolvGmonopole ∝ −(z2hs/Rhs − zls2/Rls) modeled with Born equation106 is expected to be very similar for both meridional and facial isomers since their cationic charges are identical (zmerhs = zfachs = zmerls = zfacls = 2) and their ionic radii are very close (Rfac ≈ Rmer since Vfac ≈ Vmer). The minor, but non-negligible additional dipolar contribution to the solvation energy can be estimated with the help of Onsager equation to give ΔΔsolvGdipole ∝ −(μhs2/Ri,hs3 − μls2/Ri,ls3).108–111 Again, the radius of the spherical cavity Ri cut from the dielectric when the solute, taken as spherical, is immersed into the solvent, is similar for both isomers (Ri,fac ≈ Ri,mer), but the magnitude of the dipole moments are different with μfac2 > μmer2.112 Since Ri,hs > Ri,ls, then ΔΔsolvGdipole > 0 and the contribution of dipole solvation disfavors the low-spin to high-spin spin transition more strongly for the facial isomer than for the meridional isomer as measured by ΔSmerSCO > ΔSfacSCO.
Isolation, structures and magnetic properties of [M(L6)3]X2 and [M(L7)3]X2 in the solid state (M = Fe, Ni, Zn and X = CF3SO3−, BF4−, PF6−, ClO4−)
Stoichiometric M:Lk = 1:3 mixtures of L6 or L7 (10 mM) with Ni(BF4)2·6H2O or Zn(CF3SO3)2 or Fe(ClO4)2·xH2O or Fe(BF4)2·6H2O in acetonitrile were evaporated to dryness. The resulting microcrystalline powders were re-dissolved in acetonitrile or methanol and allowed to crystallize by evaporation, or by diffusion of tert-butyl methyl ether after metathesis in presence of a large excess (10 eq.) of (nBu)4NClO4 or (nBu)4NBF4 or (nBu)4NPF6 to give primary salts [Ni(L6)3](BF4)2·1.55CH3CN·0.4H2O, [Zn(L6)3](CF3SO3)2·0.6H2O, [Fe(L6)3](BF4)2·0.15CH3CN·1.2H2O, [Ni(L7)3](BF4)2·0.85H2O, [Zn(L7)3](PF6)2·1.25H2O, and [Fe(L7)3](PF6)1.76(BF4)0.24·0.6H2O complexes in 46–72% yield (Table S10†). Single crystals of sufficient quality for X-ray diffraction studies could be obtained for complexes 1–13 gathered in Fig. 8 (Tables S11–S40 and Fig. S36–S48†). Reminiscent to the empirical isolation of either pure facial or meridional isomers reported for [Fe(imidazolylimine)3](Cl)(PF6) salts with different solvent contents,113,114 the thirteen crystal structures 1–13, which incorporate similar [M(Lk)3]2+ cations with various poorly coordinating anions and solvent molecules, are statistically partitioned between six pure facial isomers (2, 4, 5, 7, 8, 9), six pure meridional isomers (3, 6, 10, 11, 12, 13) and one mixture of meridional/facial (44/56%) isomers (1, Fig. 8 and Tables S41 and S42†). All complexes display poorly distorted octahedral [MN6] chromophores115 with bond lengths within the expected range.116,117 The Fe–N bond lengths measured for [Fe(L6)3](ClO4)2 (6), and [Fe(L6)3](BF4)2·(C5H12O)0.5·(C2H5N)0.5 (7) at 180 K (2.03 to 2.15 Å, Table S41†) are longer than standard Fels–N bonds26,38 found in [Fe(L7)3](PF6)(BF4)·CH3OH (12) and [Fe(L7)3](PF6)1.72(ClO4)0.28·CH3OH (13) at 150 K (1.98–1.99 Å. Table S42†). This suggests that the iron complexes with ligands L6 exists as mixtures of low-spin and high-spin in 6 and 7 at 180 K, while those with L7 in 12 and 13 are mainly low-spin at 150 K.
 |
| | Fig. 8 Molecular structures of the [M(Lk)3]2+ cations in the crystal structures of [Zn(L6)3](ClO4)2(C2H3N)2.5 (1), [Zn(L6)3](BF4)2·(CH3CN)2 (2), [Ni(L6)3](ClO4)2 (3), [Ni(L6)3](ClO4)2·C2H3N (4), [Ni(L6)3](BF4)2·C2H3N (5), [Fe(L6)3](ClO4)2 (6), [Fe(L6)3](BF4)2·(C5H12O)0.5·(C2H5N)0.5 (7), [Zn(L7)3](ClO4)2 (8) [Zn(L7)3](PF6)2 (9) [Ni(L7)3](ClO4)1.48(PF6)0.52·CH3CN (10), [Ni(L7)3](BF4)2·CH3OH·(CH3CN)0.5 (11), [Fe(L7)3](PF6)(BF4)·CH3OH (12) and [Fe(L7)3](PF6)1.72(ClO4)0.28·CH3OH (13). | |
A second collection of X-ray diffraction data at 100 K for complexes [Fe(L6)3](ClO4)2 (6, meridional isomer) and [Fe(L6)3](BF4)2·(C5H12O)0.5 (7, facial isomer) indeed showed a significant decrease of the Fe–N bond length, which converged to 1.99 Å at low temperature as expected for pure low-spin [FeN6] units (Table S43†). Interestingly, complex 6 at 100 K adopts the monoclinic crystal system with one meridional isomer per asymmetric unit, and transforms into a triclinic system with two different meridional complexes (noted as Fe–A and Fe–B) per unit cell at 180 K. A careful look at the bond lengths measured in the crystal structure at 180 K (Table S25†) indeed shows different average bond lengths with 2.01(1) Å for Fe–A and 2.08(3) Å for Fe–B units. A detailed variable-temperature X-ray diffraction analysis of mer-[Fe(L6)3]2+ in 6 revealed two successive phase transitions,  , accompanied by a two-steps spin crossover transition (Table S44†).
Complexes Fe–B (50% of total iron content) undergo the low-spin to high-spin transition within the 165–210 K range (Fig. 9a). The remaining Fe–A sites see their coordination spheres to be slightly shrunk when low-spin Fe–B is transformed into high-spin Fe–B. Then the Fe–A sites undergo their own spin transition in the 220–250 K range (Fig. 9a). As expected, this extension of the Fe–N bond lengths is accompanied by a rather regular increase of the volume of the unit cell with small bumps at 170 and 240 K (Fig. 9b), which are confirmed by differential scanning calorimetry (Fig. S49†).
 |
| | Fig. 9 Evolution of (a) Fe−N bond lengths in the monoclinic phases (green) and in the triclinic phase with Fe−A (red) and Fe−B (blue) and (b) cell volumes of [Fe(L6)3](ClO4)2 (6) in its crystalline state as a function of temperature during heating. | |
The distinction between two complex molecules with the same chemical formula, but exhibiting specific transitions in the same solid is not unprecedented and was theoretically rationalized by Sasaki and Kambara.118 Related experimental observations of this phenomenon within the SCO topics have been reported for both FeIII complexes119 and FeII complexes,120 which displayed an ‘intermediate-phase’ (IP) ordering phenomenon leading to a two-step spin-crossover behavior. The IP is defined by the limiting temperatures of the two-phase transitions and is usually formed of approximately equal proportions of LS and HS states. It is therefore not so surprising that paramagnetic χparaMT versus T plot obtained by SQUID measurements for [Fe(L6)3](ClO4)2 (6, meridional isomers) in the solid state display two-successive spin transitions in the 100–300 K range (Fig. 10a). On the other side, [Fe(L6)3](BF4)2·(C5H12O)0.5 (7, facial isomers) and [Fe(L7)3](PF6)(BF4)·CH3OH (12, meridional isomers) exhibit regular one-step spin transitions (Fig. 10b and c). Interestingly, [Fe(L6)3](BF4)2·(C5H12O)0.5·(C2H5N)0.5 (7) exhibits a complete and abrupt spin transition, which allows the reliable estimation of a Curie constant Cls = 0.0080(3) cm3 K mol−1 and temperature-independent paramagnetism TIPls = 387(14) × 10−6 cm3 mol−1 in the pure low-spin state and Chs = 3.53(13) cm3 K mol−1 TIPhs = 494(18) × 10−6 cm3 mol−1 in the pure high-spin state. Taking these values as reasonable approximations for all low-spin, respectively high-spin FeII complexes with ligands L6 and L7, it is possible to apply eqn (17) for transforming the plots of the molar paramagnetic susceptibility (χMT) versus temperature (T) collected in Fig. 10 into plots of high-spin mole fractions (xhs) as a function of temperature (Fig. S50†).
 |
| | Fig. 10 Plots of molar paramagnetic susceptibility (χMT) versus temperature (T) collected with increments of 1 K min−1 in a constant magnetic field of 5000 Oe between 5–300 K for (a) [Fe(L6)3](ClO4)2 (6, meridional isomers) and 4–400 K for (b) [Fe(L6)3](BF4)2·(C5H12O)0.5 (7, facial isomers) and (c) [Fe(L7)3](PF6)(BF4)·CH3OH (12, meridional isomers). The red points represents the experimental data while the dashed black traces are built by using the fitted values of ΔHsco, ΔSsco, and γ (Table 4, see text). | |
According to the various shapes observed for xhsversus T plots (Fig. S50†), the simple van't Hoff relationship (eqn (1)) is not adequate and should be replaced with eqn (2) where the adjustable interaction parameter γ takes into account intermolecular interactions.43,46 However, xhs cannot be expressed analytically as a function of T with eqn (2), but the temperature can be expressed as a function of xhs in eqn (21).
| |  | (21) |
Non-linear least squares fits using eqn (21) for the experimental 〈T; xhs〉 couples measured for [Fe(L6)3](BF4)2·(C5H12O)0.5 (7, facial) and [Fe(L7)3](PF6)(BF4)·CH3OH (12, meridional) yield the thermodynamic constants ΔHsco and ΔSsco and the cooperativity factor γ collected in Table 4 (columns 4 and 5) and which satisfyingly reproduce the experimental data (Fig. 10b, c and S50b, c†).
Table 4 Thermodynamic parameters (ΔHsco, ΔSsco, and γ) associated with the SCO process in [Fe(L6)3](ClO4)2 (6), and [Fe(L6)3](BF4)2·(C5H12O)0.5·(C2H5N)0.5 (7), and [Fe(L7)3](PF6)(BF4)·CH3OH (12)
| Complex |
[Fe(L6)3]2+ (6) |
[Fe(L6)3]2+ (7) |
[Fe(L7)3]2+ (12) |
| Fe–A |
Fe–B |
Agreement factor  . .
|
| Isomer |
Meridional |
Meridional |
Facial |
Meridional |
| ΔHSCO/kJ mol−1 |
10.6(4) |
3.58(6) |
15.5(9) |
13.45(1) |
| ΔSSCO/J mol−1 K−1 |
42(2) |
20.1(3) |
75(4) |
39.5(4) |
|
T
1/2/K |
251(12) |
178(4) |
207(16) |
341(3) |
|
γ/kJ mol−1 |
2.54(9) |
2.12(3) |
3.7(2) |
1.71(2) |
| AFa |
4.61 × 10⁻³ |
5.01 × 10⁻⁴ |
8.51 × 10⁻³ |
Since the energies of intermolecular interactions overpass those induced by the molecular SCO processes, ΔHsco, ΔSsco observed in the solid state for [Fe(L6)3](BF4)2·(C5H12O)0.5·(C2H5N)0.5 (7), and [Fe(L7)3](PF6)(BF4)·CH3OH (12, Table 4) significantly deviate from those recorded in solution (Table 3). Consequently, the transition temperature found for fac-[Fe(L6)]2+ in acetonitrile (T1/2 = 309(23) K in Fig. 7) does not match that found in the crystal structure of 7 (T1/2 = 207(16) K). The systematic operation of positive cooperativity observed for [Fe(L6)3](BF4)2·(C5H12O)0.5 (7, γ = 3.7(2) kJ mol−1), and [Fe(L7)3](PF6)(BF4)·CH3OH (12, γ = 1.71(2) kJ mol−1) in the solid state is more instructive and suggests that these crystal lattices are well-adapted for accommodating the larger high-spin form. The value of γ found for 7 in the solid state is slightly larger than 2RT1/2 (γ > 2RT1/2 = 3.4 kJ mol−1) and we must consider the possibility that the latter complex might undergo a hysteretic transition between the low-spin and the high-spin states.39,40 However, the record of magnetic susceptibility along a complete heating and cooling cycle showed no interpretable hysteresis, but some drift resulting from the evaporation of volatile interstitial solvent molecules (Fig. S51†).
Finally, molar magnetic susceptibilities (χparaM) recorded for mer-[Fe(L6)3](ClO4)2 (6) at variable temperatures between 5–300 K indeed confirmed the crystallographic studies and the operation of two successive SCO transitions, each affecting 50% of the total iron complexes (Fig. 10a). The magnetic data could be rationalized with eqn (22), which considers an equimolar mixture of two complexes Fe–A (T1/2 at high temperature) and Fe–B (T1/2 at low temperature) in the solid state.
| |  | (22) |
Introducing the single set of magnetic parameter Cls = 0.008 cm3 K mol−1, Chs = 3.53 cm3 K mol−1, TIPls = 387 × 10−6 cm3 mol−1 and TIPhs = 494 × 10−6 cm3 mol−1 into eqn (22) transforms the experimental χMT values recorded for mer-[Fe(L6)3](ClO4)2 (6, Fig. 10a) into total high-spin mole fractions xtoths = xAhs + xBhs (Fig. S50a†). Assuming that the growth of high-spin fraction is solely assigned to xBhs in the 140–200 K range and to xAhs in the 225–300 K domain allows two separated non-linear least-square fits of the 〈T; xhs〉 couples with eqn (21) for the two successive transitions detected in mer-[Fe(L6)3](ClO4)2 (6, Fig. 10a). The associated approximated thermodynamic parameters are collected in Table 4 (columns 2 and 3) and show transition temperatures T1/2(Fe–B) = 178(4) K and T1/2(Fe–A) = 251(12) K in line with the phase transition observed by DSC (Fig. S48,†T1/2 = 167 K and 241 K). Some slight positive cooperativity 2.1 ≤ γ ≤ 2.5 kJ mol−1 operates within each spin state transition in mer-[Fe(L6)3](ClO4)2 (6) and, as expected from the very limited cooperativity factors, the χparaMT versus T plots recorded for 6 and 12 for heating–cooling cycles show no hysteresis.
Conclusion
Even if it may appear tedious, there is currently no more efficient method to tune SCO properties of a [FeN6] unit than the use of some semi-empirical trial/analysis/optimization procedures within a family of closely related complexes as proposed for the L1–L7 series. In this context, [Fe(L6)3]2+ emerges to be the best candidate in term of both stability and spin transition temperature in solution, to be connected to luminescent lanthanide stains in metallosupramolecular architectures. These systematic studies (i) confirmed the unpredictability of SCO behaviors and associated thermodynamic parameters observed in solid state materials, and (ii) allowed us to focus our attention on the effect of mer ↔ facial isomerization on the spin state transitions operating for [Fe(didentate)3]2+ in solution (didentate stands for a non-symmetrical diimine ligand). As expected from the minor thermodynamic trans influence reported for the formation of pseudo-octahedral complexes along the 3d series,74,84 ΔHSCO are slightly more positive, and thus unfavourable, for the facial isomers (ΔHfacSCO − ΔHmerSCO ≈ 1 kJ mol−1). This trend is amplified by a larger drift originating from an entropic preference for SCO operating in the meridional isomers in solution ΔSmerSCO − ΔSfacSCO ≈ 11 J mol−1 K−1. Since the same entropic gap has been previously reported in triple-stranded FeLn helicates, where the facial isomer is prevented to transform into meridional isomer by the non-covalent lanthanide tripod,61 we conclude that, in solution, mer-[Fehs(didentate)3]2+ is systematically entropically favored over fac-[Fehs(didentate)3]2+ by dipolar solvation effects. With the [Fe(2-pyrimidine-benzimidazole)3] units as programmed in [Fe(L6)3]2+, we are now equipped for the exploration of dinuclear FeII–LnIII complexes, the lanthanide-based luminescence of which could be modulated by FeII spin crossover at the molecular level.
Experimental section
General
Chemicals were purchased from Sigma-Aldrich and Acros and used without further purification unless otherwise stated. Dichloromethane, 1,2-dichloroethane, tert-butyl methyl ether and N,N-dimethylformamide were dried through an alumina cartridge. Silica-gel plates (Merck, 60 F254) were used for thin-layer chromatography, SiliaFlash® silica gel P60 (0.04–0.063 mm), and Acros silica gel 60 (0.035–0.07 mm) were used for preparative column chromatography.
Preparation of pyrimidine-2-carboxylic acid (1)
Pyrimidine-2-carboxylic acid was synthesized according to a slightly modified reported procedure.121 Pyrimidine-2-carbonitrile (5.02 g, 47.76 mmol, 1 eq.) was stirred with 5 M NaOH (35 mL) at 55 °C for 3 h. The solution was neutralized (pH 2.0) with diluted aqueous HCl and evaporated to dryness. The resulting solid was suspended in acetonitrile, refluxed for 1 h, and filtered when hot to remove the insoluble salts. The filtrate was evaporated under vacuum to dryness. The resulting solid was re-dissolved in methanol and crystallized to give 3.21 g of pyrimidine-2-carboxylic acid (2, 25.8 mmol, yield 54%) as colourless thin needles. 1H NMR (CDCl3, 400 MHz, 298 K) δ/ppm: 7.61 (1H, t, 3J = 4.9 Hz), 9.00 (2H, d, 3J = 4.9 Hz), 10.62 (br).
Preparation of N-methyl-2-nitroaniline (2)
1-Chloro-2-nitrobenzene (30 g, 190.4 mmol, 1 eq.) and methylamine (197.7 mL 40% wt. in water, 2.28 mol, 12 eq.) were introduced into a Carius tube equipped with a magnetic stirrer and heated at 120 °C for 48 h. The excess of methylamine was rotary evaporated, and the residual brown oil was partitioned between CH2Cl2 (300 mL) and half-saturated aqueous NH4Cl (300 mL). The organic layer was separated and the aqueous phase was further extracted with CH2Cl2 (3 × 150 mL). The combined organic extracts were dried over anhydrous Na2SO4, filtered and the solvent evaporated to dryness. The resulting red oil was purified by column chromatography (silica, CH2Cl2) to give N-methyl-2-nitroaniline (1, 178.57 mmol, yield 94%) as a deep red/orange oil, which was crystallized upon trituration. 1H NMR (CDCl3, 400 MHz, 298 K) δ/ppm = 8.13 (1 H, dd, 3J = 8.8 Hz, 4J = 1.6 Hz), 8.00 (1 H, bs), 7.43 (1 H, ddd, 3J = 8.8 Hz, 3J = 7.2 Hz, 4J = 1.6 Hz), 6.81 (1 H, dd, 3J = 8.6 Hz, 4J = 1.0 Hz), 6.62 (1 H, ddd, 3J = 8.4 Hz, 3J = 7.2 Hz, 4J = 1.2 Hz), 2.99 (3 H, s).
Preparation of N-methyl-N-(2-nitrophenyl)pyrimidine-2-carboxamide (3)
Thionyl chloride (7.41 mL, 12.15 g, 102.14 mmol, 9.26 eq.) was added dropwise to the mixture of pyrimidine-2-carboxylic acid (1, 1.37 g, 11.03 mmol, 1 eq.) dissolved dry 1,2-dichloroethane (35 mL). Dimethylformamide (300 μL) was added to the reaction mixture. The solution was refluxed for 5 h under an inert atmosphere of nitrogen, then cooled and evaporated to dryness. The residue was dissolved in 40 mL of dry 1,2-dichloroethane. N-Methyl-2-nitroaniline (2, 4.19 g, 27.57 mmol, 2.5 eq.) dissolved in 10 mL 1,2-dichloroethane was added dropwise to the solution. The solution was refluxed 15 h during which two portions of (iPr)2NEt (Hünig's base, 3.5 mL, 20.09 mmol, 1.82 eq.) were added after 30 min and 12 h. The solution was concentrated under vacuum to afford a solid residue which was partitioned between CH2Cl2 (400 mL) and half saturated aqueous NH4Cl (4 × 120 mL). The aqueous phase was further extracted with CH2Cl2 (3 × 50 mL). The combined organic phase was dried over anhydrous Na2SO4, concentrated under vacuum and purified by column chromatography (silica, CH2Cl2/MeOH 99.2:0.8) to give 2.62 g of N-methyl-N-(2-nitrophenyl)pyrimidine-2-carboxamide (3, 10.14 mmol, yield 92%) as a beige solid. 1H NMR (CDCl3, 400 MHz, 298 K) δ/ppm: mixture of rotamers A (86.5%) and B (13.5%): 3.41 (3H, s, B), 3.55 (3H, s, A), 7.08–7.75 (4H, m, A and B), 7.95 (1H, dd, 3J = 8.4 Hz, A), 8.10 (1H, dd, 3J = 8.6 Hz, B), 8.53 (2H, d, 3J = 4.8 Hz, A), 8.91 (2H, d, 3J = 4.9 Hz, B). ESI-MS (soft positive mode – MeOH + CHCl3 + HCOOH)- [3 + H]+ = 259.3 (exp.) 259.3 (calc.), [3 + Na]+ = 281.4 (exp.) 281.2 (calc.), 213.4, 136.4, 119.3, 107.3 (fragments).
Preparation of 1-methyl-2-(pyrimidin-2-yl)-1H-benzo[d]imidazole (L6)
N-Methyl-N-(2-nitrophenyl)pyrimidine-2-carboxamide (3, 2.60 g, 10.06 mmol, 1 eq.) was dissolved in a mixture of EtOH:DMF (20 mL:25 mL). Sodium dithionite (7 g, 40.20 mmol, 3.97 eq.) was added to the solution and the temperature of the mixture was raised to 60 °C when 20 mL of distilled water was added. After refluxing for 24 h, the mixture was neutralized using aqueous ammonia and the solvents were removed in vacuo. The concentrate was dissolved in CH2Cl2 (50 mL) and washed with water (3 × 200 mL). The aqueous layers were collectively re-extracted with CH2Cl2 (3 × 50 mL). The combined organic fractions were then concentrated under vacuum and purified by column chromatography (silica, CH2Cl2/MeOH 98:2) to yield L6 (5.86 mmol, yield 58%). The compound was crystallized as needles by slow diffusion of n-hexane into CH2Cl2. 1H-NMR (CD3CN, 400 MHz, 298 K) δ/ppm; 4.175 (3H, s), 7.29–7.33 (1H, ddd, 3J = 5.4–8.1 Hz, 4J = 1.2 Hz), 7.37–7.41 (1H, ddd, 3J = 6.8–8.2 Hz, 4J = 1.2 Hz), 7.47 (1 H, t, 3J = 4.8 Hz), 7.57 (1 H, ddd, 3J = 8.1 Hz, 4J = 0.9 Hz), 7.78 (1 H, ddd, 3J = 8.0 Hz, 4J = 0.8 Hz), 8.95 (2 H, d, 3J = 4.8 Hz). 13C-NMR (CD3CN, 101 MHz, 298 K) δ/ppm; 159.59 (Cq), 158.48 (CH), 150.33 (Cq), 143.59 (Cq), 138.12 (Cq), 124.72 (CH), 123.46 (CH), 121.81 (CH), 121.27 (CH), 111.67 (CH), 33.28 (CH3). ESI-MS (soft positive mode – MeOH + CHCl3 + HCOOH): [L6 + H]+ = 211.3 (exp.) 211.09 (calc.), [L6 + Na]+ = 233.1 (exp.) 233.08 (calc.), 170.3 (fragments). Elemental analysis: calculated (%): C 68.56, H 4.79, N 26.65; found (%): C 68.39, H 4.69, N 26.82.
Preparation of N-methyl-N-(2-nitrophenyl)pyrimidine-4-carboxamide (4)
Oxalyl chloride (55.33 mL, 14.0 g, 110.3 mmol, 10 eq.) was added dropwise to a mixture of pyrimidine-2-carboxylic acid (1.37 g, 11.03 mmol, 1 eq.) dissolved in dry dichloromethane (35 mL). Dimethylformamide (300 μL) was added to the mixture to catalyze the reaction. The solution was refluxed for 2 h under an inert atmosphere of nitrogen, then cooled and evaporated to dryness. The residue was dissolved in 40 mL of dry dichloromethane. N-Methyl-2-nitroaniline (2, 4.19 g, 27.57 mmol, 2.5 eq.) dissolved in 10 mL dichloromethane was added dropwise to the solution. The solution was refluxed for 15 h during which two portions of (iPr)2NEt (Hünig's base, 3.5 mL, 20.09 mmol, 1.82 eq.) were added after 30 min and 12 h. The solution was concentrated under vacuum to afford a solid residue which was partitioned between CH2Cl2 (400 mL) and half saturated aqueous NH4Cl (4 × 120 mL). The aqueous phase was further extracted with CH2Cl2 (3 × 50 mL). The combined organic phase was dried over anhydrous Na2SO4, concentrated under vacuum and purified by column chromatography (silica, CH2Cl2/MeOH 99:1) to give 2.62 g of N-methyl-N-(2-nitrophenyl)pyrimidine-4-carboxamide (4, 8.34 mmol, yield 76%) as a brown viscous liquid. 1H NMR (CDCl3, 400 MHz, 298 K) δ/ppm: mixture of rotamers A (15.1%) and B (84.9%): 3.49 (3H, s, B), 3.52 (3H, s, A), 7.34–7.77 (4H, m, A and B), 7.95 (1H, dd, 3J = 8.2 Hz, 4J = 1.4 Hz, B), 8.11 (1H, dd, 3J = 8.1 Hz, 4J = 1.1 Hz, A), 8.75 (1H, d, 3J = 5.1 Hz, B), 8.95 (1H, d, 3J = 5.0 Hz, A), 8.78 (1H, d, 3J = 1.2 Hz, B), 9.33 (1H, A). ESI-MS (soft positive mode – MeOH + CHCl3 + HCOOH): [4 + H]+ = 259.3 (exp.) 259.3 (calc.), [4 + Na]+ = 281.3 (exp.) 281.2 (calc.), 213.4, 184.3, 136.3, 119.3, 108.3 (fragments).
Preparation of 1-methyl-2-(pyrimidin-4-yl)-1H-benzo[d]imidazole (L7)
N-Methyl-N-(2-nitrophenyl)pyrimidine-4-carboxamide (4, 2.60 g, 10.06 mmol, 1 eq.) was dissolved in EtOH:DMF (20 mL:25 mL). Sodium dithionite (7 g, 40.20 mmol, 3.97 eq.) was added to the solution and the temperature of the mixture was raised to 60 °C when 20 mL of distilled water was added. After refluxing for 24 h, the mixture was neutralized using aqueous ammonia and the solvents were removed in vacuo. The concentrate was dissolved in CH2Cl2 (50 mL) and washed with water (3 × 200 mL). The combined aqueous layers were extracted with CH2Cl2 (3 × 50 mL). The organic fraction was then concentrated under vacuum and purified by column chromatography (silica, CH2Cl2/MeOH 98.5:1.5) to yield L7 (5.21 mmol, yield 52%). The compound was crystallized as needles by slow diffusion of n-hexane into CH2Cl2. 1H-NMR (CD3CN, 400 MHz, 298 K) δ/ppm; 4.31 (3H, s), 7.33 (1H, ddd, 4J = 1.2 Hz, 3J = 7.9 Hz), 7.41 (1H, ddd, 4J = 1.2 Hz, 3J = 8.0 Hz), 7.59 (1H, dt, 4J = 1 Hz, 3J = 8.2 Hz), 7.76 (1H, dt, 4J = 1 Hz, 3J = 8.1 Hz), 8.32 (1H, dd, 4J = 1.6 Hz, 3J = 5.2 Hz), 8.89 (1H, d, 3J = 5.2 Hz), 9.28 (1H, d, 4J = 1.6 Hz). 13C-NMR (CD3CN, 101 MHz, 298 K) δ/ppm; 158.99 (CH), 158.38 (Cq), 148.79 (Cq), 143.51 (Cq), 138.73 (Cq), 125.13 (CH), 123.82 (CH), 121.38 (CH), 121.03 (CH), 111.78 (CH), 33.54 (CH3). ESI-MS (soft positive mode – MeOH + CHCl3 + HCOOH) [L7 + H]+ = 210.6 (exp.) 211.09 (calc.), [L7 + Na]+ = 233.1 (exp.) 233.08 (calc.), 82.4 (fragments). Elemental analysis: calculated (%): C 68.56, H 4.79, N 26.65; found (%): C 68.32, H 4.72, N 27.00.
Preparation [M(L6)3]X2 and [M(L7)3]X2 complexes (M = Fe, Ni, Zn and X = CF3SO3−, BF4−, PF6−, ClO4−)
In a typical synthesis, 0.3 mmol (3 eq.) of the ligand L6 or ligand L7 dissolved in 2 mL of acetonitrile was added to 0.1 mmol (1 eq.) of Ni(BF4)2·6H2O or Zn(CF3SO3)2 or Fe(ClO4)2·xH2O or Fe(BF4)2·6H2O in 2 mL acetonitrile. The resulting mixtures were stirred under an inert atmosphere for 3 h for ensuring complete dissolution of all components and then evaporated to dryness to yield microcrystalline powders of the respective complexes. The powders were re-dissolved in acetonitrile or methanol and allowed to crystallize by evaporation, or diffusion of tert-butyl methyl ether into acetonitrile or methanol after metathesis in presence of a large excess (10 eq.) of (nBu)4NClO4, (nBu)4NBF4 or (nBu)4NPF6, respectively, to give primary salts [Ni(L6)3](BF4)2·1.55CH3CN·0.4H2O, [Zn(L6)3](CF3SO3)2·0.6H2O, [Fe(L6)3](BF4)2·0.15CH3CN·1.2H2O, [Ni(L7)3](BF4)2·0.85H2O, [Zn(L7)3](PF6)2·1.25H2O, [Fe(L7)3](PF6)1.76(BF4)0.24·0.6H2O complexes in 46–72% yield. Only non-perchlorate complexes were characterized by elemental analyses (Table S10†). Single crystals of sufficient quality for X-ray diffraction studies could be obtained and X-ray crystal structures could be solved for [Zn(L6)3](ClO4)2(C2H3N)2.5 (1), [Zn(L6)3](BF4)2·(CH3CN)2 (2), [Ni(L6)3](ClO4)2 (3), [Ni(L6)3](ClO4)2·C2H3N (4), [Ni(L6)3](BF4)2·C2H3N (5), [Fe(L6)3](ClO4)2 (6), [Fe(L6)3](BF4)2·(C5H12O)0.5·(C2H5N)0.5 (7), [Zn(L7)3](ClO4)2 (8) [Zn(L7)3](PF6)2 (9) [Ni(L7)3](ClO4)1.48(PF6)0.52·CH3CN (10), [Ni(L7)3](BF4)2·CH3OH·(CH3CN)0.5 (11), [Fe(L7)3](PF6)(BF4)·CH3OH (12) and [Fe(L7)3](PF6)1.72(ClO4)0.28·CH3OH (13).
Caution! Dry perchlorates may explode and should be handled in small quantities and with the necessary precautions.122,123
Spectroscopic and analytical measurements
1H, 13C NMR and 1H–15N HMBC spectra were recorded at 298 K on a Bruker Avance 400 MHz spectrometer. Chemical shifts are given in ppm with respect to TMS for 1H and 13C and nitromethane for 15N. Spectrophotometric titrations were performed with a J&M diode array spectrometer (Tidas series) connected to an external computer. In a typical experiment, 25 cm3 of ligand L6 or ligand L7 in acetonitrile (∼2 × 10⁻⁴ M) was titrated at 298 K with a solution of Fe(CF3SO3)2 and Ni(BF4)2·6H2O or Zn(CF3SO3)2 (∼2 × 10⁻³ M) in acetonitrile under an inert atmosphere. After each addition of 33 μL, the absorbance was recorded using Hellma optrodes (optical path length 0.1 cm) immersed in the thermostated titration vessel and connected to the spectrometer. Mathematical treatment of the spectrophotometric titrations was performed with factor analysis67–69 and with ReactLab™ Equilibria (previously Specfit/32).69,71,72 Pneumatically-assisted electrospray (ESI-MS) mass spectra were recorded from ∼1 × 10⁻⁴ M (ligands) and ∼1 × 10⁻³ M (complexes) solutions on an Applied Biosystems API 150EX LC/MS System equipped with a Turbo Ionspray source. Elemental analyses were performed by K. L. Paglia from the Microchemical Laboratory of the University of Geneva. Electronic spectra in the UV-Vis region were recorded at 293 K from solutions in CH3CN with a PerkinElmer Lambda 1050 using quartz cells of 0.1 or 1.0 mm path length. Solid-state absorption spectra were recorded with a PerkinElmer Lambda 900 using capillaries. Solid-state magnetic data were recorded on MPMS 3 QUANTUM DESIGN magnetometers using magnetic fields of 1000–5000 Oe and at 1 K min−1 rates within the 5–400 K range (5–300 K range for perchlorate containing complexes). The magnetic susceptibilities were corrected for the magnetic response of the sample holder and the diamagnetism of the compounds by using the approximation  .124
.124
X-ray crystallography
Summary of crystal data, intensity measurements and structure refinements for ligands L6, L7 and complexes [Zn(L6)3](ClO4)2(C2H3N)2.5 (1), [Zn(L6)3](BF4)2·(CH3CN)2 (2), [Ni(L6)3](ClO4)2 (3), [Ni(L6)3](ClO4)2·C2H3N (4), [Ni(L6)3](BF4)2·C2H3N (5), [Fe(L6)3](ClO4)2 (6), and [Fe(L6)3](BF4)2·(C5H12O)0.5·(C2H5N)0.5 (7), [Zn(L7)3](ClO4)2 (8) [Zn(L7)3](PF6)2 (9) and [Ni(L7)3](ClO4)1.48(PF6)0.52·CH3CN (10), [Ni(L7)3](BF4)2·CH3OH·(CH3CN)0.5 (11), [Fe(L7)3](PF6)(BF4)·CH3OH (12) and [Fe(L7)3](PF6)1.72(ClO4)0.28·CH3OH (13) were collected in Tables S1, S4 and S8–S11.† Pertinent bond lengths, bond angles and interplanar angles were collected in Tables S2, S3, S5, S6, S15–S40† together with ORTEP views and the pertinent numbering schemes and intermolecular interactions gathered in Fig. S15–S20 and S36–S48.† The crystals were mounted on Hampton cryoloops with protection oil. X-ray data collections were performed with an Agilent SuperNova Dual diffractometer equipped with a CCD Atlas detector (Cu[Kα] radiation) or a XtaLAB Synergy-S diffractometer equipped with an hybrid pixel hypix arc 150 detector. The structures were solved by using direct methods.125,126 Full-matrix least-square refinements on F2 were performed with SHELX2014.127 CCDC 2041614–2041630† contain the supplementary crystallographic data.
Conflicts of interest
There are no conflicts to declare.
Acknowledgements
Financial support from the Swiss National Science Foundation is gratefully acknowledged (grant numbers: 200020_178758 and 206021_183324).
References
- L. Pauling, J. Am. Chem. Soc., 1931, 53, 1367–1400 CrossRef CAS.
- L. Pauling, Phys. Rev., 1931, 37, 1185–1186 CrossRef CAS.
- L. Pauling, J. Am. Chem. Soc., 1932, 54, 988–1003 CrossRef CAS.
- C. D. Corryell, F. Stittand and L. Pauling, J. Am. Chem. Soc., 1937, 59, 633–642 CrossRef.
- L. Cambi and L. Szego, Ber. Dtsch. Chem. Ges., 1931, 64, 2591–2598 CrossRef.
- L. Cambi, L. Szego and A. Cagnasso, Atti Accad. Lincei, 1932, 15, 266–271 CAS.
- L. Cambi, L. Szego and A. Cagnasso, Atti Accad. Lincei, 1932, 15, 329–335 CAS.
- H. Bethe, Ann. Phys., 1929, 3, 133–208 CrossRef CAS.
-
C. K. Jorgensen, Modern Aspects of Ligand Field Theory, North Holland Publishing Company, Amsterdam-London, 1971 Search PubMed.
-
B. N. Figgis and M. A. Hitchman, Ligand Field Theory and Its Applications, Wiley-VCH, New York, Chichester, Weiheim, Brisbane, Singapore, Toronto, 2000 Search PubMed.
- D. M. P. Mingos, Struct. Bonding, 2016, 172, 1–18 Search PubMed.
- A. Hauser, Top. Curr. Chem., 2004, 233, 49–58 CrossRef CAS.
- Y. Tanabe and S. Sugano, J. Phys. Soc. Jpn., 1954, 9, 766–779 CrossRef CAS.
- P. Gütlich, Y. Garcia and H. A. Goodwin, Chem. Soc. Rev., 2000, 29, 419–427 RSC.
- S. Alvarez, J. Am. Chem. Soc., 2003, 125, 6795–6802 CrossRef CAS.
- N. Deorukhkar, T. Lathion, L. Guénée, C. Besnard and C. Piguet, Chemistry, 2020, 2, 231–252 CrossRef.
-
R. J. Deeth, C. M. Handley and B. J. Houghton, in Spin-Crossover Materials, ed. M. A. Halcrow, Wiley, Chichester, 2013, vol. 17, pp. 443–454 Search PubMed.
- F. Neese, Coord. Chem. Rev., 2009, 253, 526–563 CrossRef CAS.
- C. J. Cramer and D. G. Truhlar, Phys. Chem. Chem. Phys., 2009, 11, 10757–10816 RSC.
- S. Rackwitz, W. Klopper, V. Schünemann and J. A. Wolny, Phys. Chem. Chem. Phys., 2013, 15, 15450–15458 RSC.
- L. J. K. Cook, R. Kulmaczewski, R. Mohammed, S. Dudley, S. A. Barrett, M. A. Little, R. J. Deeth and M. A. Halcrow, Angew. Chem., Int. Ed., 2016, 55, 4327–4331 CrossRef.
- K. P. Kepp, Inorg. Chem., 2016, 55, 2717–2727 CrossRef CAS.
- M. Swart and M. Gruden, Acc. Chem. Res., 2016, 49, 2690–2697 CrossRef CAS.
- S. Rodriguez-Jimenez, M. Yang, I. Stewart, A. L. Garden and S. Brooker, J. Am. Chem. Soc., 2017, 139, 18392–18396 CrossRef CAS.
- P. Gütlich and H. A. Goodwin, Top. Curr. Chem., 2004, 233, 1–47 CrossRef.
- M. A. Halcrow, Polyhedron, 2007, 26, 3523–3576 CrossRef CAS.
-
B. Weber, in Spin-Crossover Materials, ed. M. A. Halcrow, Wiley, Chichester, 2013, vol. 2, pp. 55–76 Search PubMed.
-
J. Olguin and S. Brooker, in Spin-Crossover Materials, ed. M. A. Halcrow, Wiley, Chichester, 2013, vol. 3, pp. 77–120 Search PubMed.
- J. Olguin and S. Brooker, Coord. Chem. Rev., 2011, 255, 203–240 CrossRef CAS.
- S. Brooker, Chem. Soc. Rev., 2015, 44, 2880–2892 RSC.
- H. L. C. Feltham, A. S. Barltrop and S. Brooker, Coord. Chem. Rev., 2016, 344, 26–53 CrossRef.
- R. W. Hogue, S. Singh and S. Brooker, Chem. Soc. Rev., 2018, 47, 7303–7338 RSC.
- H. S. Scott, R. W. Staniland and P. E. Kruger, Coord. Chem. Rev., 2018, 362, 24–43 CrossRef CAS.
- K. S. Kumar, Y. Bayeh, T. Gebretsadik, F. Elemo, M. Gebrezgiabher, M. Thomas and M. Ruben, Dalton Trans., 2019, 48, 15321–15337 RSC.
- J. Olguin, Coord. Chem. Rev., 2020, 407, 213148 CrossRef CAS.
-
Spin Crossover in Transition Metal Compounds I-III, in Topics in Current Chemistry, ed. P. Gütlich and H. A. Goodwin, Springer-Verlag, Berlin-Heidelberg-New York, 2004, vol. 233–235 Search PubMed.
-
M. A. Halcrow, Spin-Crossover Materials, John Wiley & Sons, Ltd, Chichester, United Kingdom, 2013 Search PubMed.
- H. Phan, J. J. Hrudka, D. Igimbayeva, L. M. L. Daku and M. Shatruk, J. Am. Chem. Soc., 2017, 139, 6437–6447 CrossRef CAS.
-
O. Kahn, Molecular Magnetism, VCH Publishers, Weinheim, 1993, pp. 59–69 Search PubMed.
- P. Guionneau, J.-F. Létard, D. S. Yufit, D. Chasseau, G. Bravic, A. E. Goeta, J. A. K. Howard and O. Kahn, J. Mater. Chem., 1999, 9, 985–994 RSC.
- M. Mikolasek, G. Félix, W. Nicolazzi, G. Molnar, L. Salmon and A. Bousseksou, New J. Chem., 2014, 38, 1834–1839 RSC.
-
C. Enachescu, C. M. Nishino and S. Miyashita, in Spin-Crossover Materials, ed. M. A. Halcrow, Wiley, Chichester, 2013, vol. 18, pp. 455–474 Search PubMed.
- M. Sorai, Bull. Chem. Soc. Jpn., 2001, 74, 2223–2253 CrossRef CAS.
- B. Weber and F. A. Walker, Inorg. Chem., 2007, 46, 6794–6803 CrossRef CAS.
-
M. P. Shores, C. M. Klug and S. R. Fiedler, in Spin-Crossover Materials, ed. M. A. Halcrow, Wiley, Chichester, 2013, vol. 10, pp. 281–302 Search PubMed.
- C. P. Slichter and H. G. Drickamer, J. Chem. Phys., 1972, 56, 2142–2160 CrossRef CAS.
- M. Sorai and S. Seki, J. Phys. Chem. Solids, 1974, 35, 555–570 CrossRef CAS.
- A. Bousseksou, G. Molnar and G. Matouzenko, Eur. J. Inorg. Chem., 2004, 4353–4369 CrossRef CAS.
- A. Bousseksou, G. Molnar, L. Salmon and W. Nicolazzi, Chem. Soc. Rev., 2011, 40, 3313–3335 RSC.
- P. Gutlich, A. B. Gaspar and Y. Garcia, Beilstein J. Org. Chem., 2013, 9, 342–391 CrossRef.
- G. Molnar, L. Salmon, W. Nicolazzi, F. Terki and A. Bousseksou, J. Mater. Chem. C, 2014, 2, 1360–1366 RSC.
- M. D. Manrique-Juarez, S. Rat, L. Salmon, G. Molnar, C. M. Quintero, L. Nicu, H. J. Shepherd and A. Bousseksou, Coord. Chem. Rev., 2016, 308, 395–408 CrossRef CAS.
- A. B. Gaspar and M. Seredyuk, Coord. Chem. Rev., 2014, 268, 41–58 CrossRef CAS.
- A. B. Gaspar, V. Ksenovontov, M. Seredyuk and P. Gütlich, Coord. Chem. Rev., 2005, 249, 2661–2676 CrossRef CAS.
- K. S. Kumar and M. Ruben, Coord. Chem. Rev., 2017, 346, 176–205 CrossRef.
- Y. S. Meng and T. Liu, Acc. Chem. Res., 2019, 52, 1369–1379 CAS.
- M. Darawsheh, L. A. Barrios, O. Roubeau, S. J. Teat and G. Aromi, Angew. Chem., Int. Ed., 2018, 57, 13509–13513 CrossRef CAS.
- A. Kawamura, J. Xie, J. N. Boyn, K. A. Jesse, A. J. McNeece, E. A. Hill, K. A. Collins, J. A. Valdez-Moreira, A. S. Filatov, J. W. Kurutz, D. A. Mazziotti and J. S. Anderson, J. Am. Chem. Soc., 2020, 142, 17670–17680 CrossRef CAS.
-
H. J. Shepherd, C. M. Quintero, G. Molnar, L. Salmon and A. Bousseksou, in Spin-Crossover Materials, ed. M. A. Halcrow, Wiley, Chichester, 2013, vol. 13, pp. 347–373 Search PubMed.
- T. Lathion, A. Furstenberg, C. Besnard, A. Hauser, A. Bousseksou and C. Piguet, Inorg. Chem., 2020, 59, 1091–1103 CrossRef CAS.
- T. Lathion, L. Guénée, C. Besnard, A. Bousseksou and C. Piguet, Chem. – Eur. J., 2018, 24, 16873–16888 CrossRef CAS.
- C. Piguet, B. Bocquet and G. Hopfgartner, Helv. Chim. Acta, 1994, 77, 931–942 CrossRef CAS.
- C. E. Hadden, Magn. Reson. Chem., 2005, 43, 330–333 CrossRef CAS.
- K. Nakamoto, J. Phys. Chem., 1960, 64, 1420–1425 CrossRef CAS.
- C. Piguet, J.-C. G. Bünzli, G. Bernardinelli, C. G. Bochet and P. Froidevaux, J. Chem. Soc., Dalton Trans., 1995, 83–97 RSC.
- S. Xu, J. E. T. Smith and J. M. Weber, Inorg. Chem., 2016, 55, 11937–11943 CrossRef CAS.
-
E. R. Malinowski and D. G. Howery, Factor Analysis in Chemistry, Wiley, New York, Chichester, 1980 Search PubMed.
- H. Gampp, M. Maeder, C. J. Meyer and A. D. Zuberbuehler, Talanta, 1985, 32, 1133–1139 CrossRef CAS.
- H. Gampp, M. Maeder, C. J. Meyer and A. D. Zuberbuehler, Talanta, 1986, 33, 943–951 CrossRef CAS.
- B. R. Hall, L. E. Manck, I. S. Tidmarsh, A. Stephenson, B. F. Taylor, E. J. Blaikie, D. A. Vander Griend and M. D. Ward, Dalton Trans., 2011, 40, 12132–12145 RSC.
-
M. Maeder and P. King, Analysis of Chemical Processes, Determination of the Reaction Mechanism and Fitting of Equilibrium and Rate Constants, in Chemometrics in Practical Applications, ed. K. Varmuza, InTech., 2012, ISBN: 978-953-51-0438-4, DOI:10.5772/31896.
-
ReactLab™ Equilibria (previously Specfit/32), Jplus Consulting Pty. Ltd., Palmyra WA 6957, Australia: http://jplusconsulting.com/products/reactlab-equilibria/.
- L. Alderighi, P. Gans, A. Ienco, D. Peters, A. Sabatini and A. Vacca, Coord. Chem. Rev., 1999, 184, 311–318 CrossRef CAS , http://www.hyperquad.co.uk/hyss.htm.
- L. Aboshyan-Sorgho, T. Lathion, L. Guénée, C. Besnard and C. Piguet, Inorg. Chem., 2014, 53, 13093–13104 CrossRef CAS.
-
R. M. Smith and A. E. Martell, Critical Stability Constants, Plenum, New York, 1982, vol. 5, pp. 235–253 Search PubMed.
- M. Borkovec, J. Hamacek and C. Piguet, Dalton Trans., 2004, 4096–4105 RSC.
- J. Hamacek, M. Borkovec and C. Piguet, Dalton Trans., 2006, 1473–1490 RSC.
- C. Piguet, Chem. Commun., 2010, 46, 6209–6231 RSC.
- S. W. Benson, J. Am. Chem. Soc., 1958, 80, 5151–5154 CrossRef CAS.
- G. Ercolani, C. Piguet, M. Borkovec and J. Hamacek, J. Phys. Chem. B, 2007, 111, 12195–12203 CrossRef CAS.
- G. Calzaferri, Phys. Chem. Chem. Phys., 2017, 19, 10611–10621 RSC.
- H. Irving and R. J. P. Williams, J. Chem. Soc., 1953, 3192–3210 RSC.
- P. W. Dimmock, P. Warwick and R. A. Robbins, Analyst, 1995, 120, 2159–2170 RSC.
- B. J. Coe and S. J. Glenwright, Coord. Chem. Rev., 2000, 203, 5–80 CrossRef CAS.
- M. A. Robinson, D. H. Busch and J. D. Curry, Inorg. Chem., 1963, 2, 1178–1181 CrossRef CAS.
-
A. B. P. Lever, Inorganic Electronic Spectroscopy, Elsevier, Amsterdam-Oxford-New York-Tokyo, 1984, p. 126 Search PubMed.
- S. M. Hart, J. C. A. Boeyens and R. D. Hancock, Inorg. Chem., 1983, 22, 982–986 CrossRef CAS.
-
B. N. Figgis and M. A. Hitchman, Ligand Field Theory and its Applications, Wiley-VCH, New York, NY, USA, 2000 Search PubMed.
- B. Weber and F. A. Walker, Inorg. Chem., 2007, 46, 6794–6803 CrossRef CAS.
- A. A. Pavlov, G. L. Denisov, M. A. Kiskin, Y. V. Nelyubina and V. V. Novikov, Inorg. Chem., 2017, 56, 14759–14762 CrossRef CAS.
- D. F. Evans, J. Chem. Soc., 1959, 2003–2005 RSC.
- T. H. Crawford and J. Swanson, J. Chem. Educ., 1971, 48, 382–386 CrossRef CAS.
- J. Löliger and R. Scheffold, J. Chem. Educ., 1972, 49, 646–647 CrossRef.
- D. Ostfeld and I. A. Cohen, J. Chem. Educ., 1972, 49, 829 CrossRef CAS.
- D. H. Grant, J. Chem. Educ., 1995, 72, 39–40 CrossRef CAS.
- C. Piguet, J. Chem. Educ., 1997, 74, 815–816 CrossRef CAS.
- H. Toftlund, Coord. Chem. Rev., 1989, 94, 67–108 CrossRef CAS.
- H. Toftlund, Monatsh. Chem., 2001, 132, 1269–1277 CrossRef CAS.
- S. Rodriguez-Jimenez, A. S. Barltrop, N. G. White, H. L. C. Feltham and S. Brooker, Inorg. Chem., 2018, 57, 6266–6282 CrossRef CAS.
- S. Singh and S. Brooker, Inorg. Chem., 2020, 59, 1265–1273 CrossRef CAS.
- C. Piguet, Dalton Trans., 2011, 40, 8059–8071 RSC.
- D. M. Ford, J. Am. Chem. Soc., 2005, 127, 16167–16170 CrossRef CAS.
- E. B. Starikov, J. Appl. Solution Chem. Model., 2013, 2, 240–245 Search PubMed.
- O. A. Khakhel and T. P. Romashko, J. Phys. Chem. A, 2016, 120, 2035–2040 CrossRef CAS.
- K. P. Kepp, Inorg. Chem., 2016, 55, 2717–2727 CrossRef CAS.
- P. W. Atkins and A. J. MacDermott, J. Chem. Educ., 1982, 59, 359–360 CrossRef CAS.
- G. Schreckenbach, Chem. – Eur. J., 2017, 23, 3797–3803 CrossRef CAS.
- L. Onsager, J. Am. Chem. Soc., 1936, 58, 1486–1492 CrossRef CAS.
- D. V. Matyushov, J. Chem. Phys., 2004, 120, 1375–1382 CrossRef CAS.
- C. J. Cramer and D. G. Truhlar, Acc. Chem. Res., 2008, 41, 760–768 CrossRef CAS.
- L. E. Johnson, S. J. Benight, R. Barnes and B. H. Robinson, J. Phys. Chem. B, 2015, 119, 5240–5250 CrossRef CAS.
- L. Babel, T. N. Y. Hoang, L. Guénée, C. Besnard, T. A. Wesolowski, M. Humbert-Droz and C. Piguet, Chem. – Eur. J., 2016, 22, 8113–8123 CrossRef CAS.
- Y. Furusho, H. Goto, K. Itomi, H. Katagiri, T. Miyagawa and E. Yashima, Chem. Commun., 2011, 47, 9795–9797 RSC.
- D. Furushou, T. Hashibe, T. Fujinami, K. Nishi, H. Hagiwara, N. Matsumoto, Y. Sunatsuki, M. Kojima and S. Iijima, Polyhedron, 2013, 52, 1489–1498 CrossRef.
- SHAPE is a free software developed by M. Llunell, D. Casanova, J. Cirera, P. Alemany and S. Alvarez, and available online at http://www.ee.ub.edu/.
- A. G. Orpen, L. Brammer, F. H. Allen, O. Kennard, D. G. Watson and R. Taylor, J. Chem. Soc., Dalton Trans., 1989, S1–S83 RSC.
- F. H. Allen, O. Kennard, D. G. Watson, L. Brammer, A. G. Orpen and R. Taylor, J. Chem. Soc., Perkin Trans. 2, 1987, S1–S19 RSC.
- N. Sasaki and T. Kambara, Phys. Rev. B: Condens. Matter Mater. Phys., 1989, 40, 2442–2449 CrossRef.
- B. J. C. Vieira, J. T. Coutinho, I. C. Santos, L. C. J. Pereira, J. C. Waerenborgh and V. da Gama, Inorg. Chem., 2013, 52, 3845–3850 CrossRef CAS.
- D. Chernyshov, M. Hostettler, K. W. Tornroos and H. B. Burgi, Angew. Chem., Int. Ed., 2003, 42, 3825–3830 CrossRef CAS.
- P. Lian, H. Wei, C. Zheng, Y. Nie, J. Bian, Z. Bian and C. Huang, Dalton Trans., 2011, 40, 5476–5482 RSC.
- W. C. Wolsey, J. Chem. Educ., 1973, 50, A335–A337 CrossRef CAS.
- J.-L. Pascal and F. Favier, Coord. Chem. Rev., 1998, 178–180, 865–902 CrossRef CAS.
- G. A. Bain and J. F. Berry, J. Chem. Educ., 2008, 85, 532 CrossRef CAS.
- G. M. Sheldrick, Acta Crystallogr., Sect. A: Found. Crystallogr., 2008, 64, 112–122 CrossRef CAS.
- M. C. Burla, M. Camalli, B. Carrozzini, G. L. Cascarano, C. Giacovazzo, G. Polidori and R. Spagna, Acta Crystallogr., Sect. A: Found. Crystallogr., 1999, 55, 991–999 CrossRef.
- G. M. Sheldrick, Acta Crystallogr., Sect. C: Struct. Chem., 2015, 71, 3–8 Search PubMed.
Footnote |
| † Electronic supplementary information (ESI) available. CCDC 2041614–2041630. For ESI and crystallographic data in CIF or other electronic format see DOI: 10.1039/d0dt03828h |
|
| This journal is © The Royal Society of Chemistry 2021 |
Click here to see how this site uses Cookies. View our privacy policy here. 
 Open Access Article
 This Open Access Article is licensed under a Creative Commons Attribution-Non Commercial 3.0 Unported Licence
 b,
Laure
Guénée
b and
Claude
Piguet
b,
Laure
Guénée
b and
Claude
Piguet
 in acetonitrile), which makes this complex suitable for the potential modulation of lanthanide-based luminescence in polymetallic helicates. A novel method is proposed for assigning specific thermodynamic spin crossover parameters to fac-[Fe(L6)3]2+ and mer-[Fe(L6)3]2+ isomers in solution. The observed difference relies mainly on the entropic content ΔSmerSCO − ΔSfacSCO = 11(1) J mol−1 K−1, which favors the spin transition for the meridional isomer. Intermolecular interactions occurring in the crystalline state largely overcome minor thermodynamic trends operating in diluted solutions and a single configurational isomer is usually observed in the solid state. Among the thirteen solved crystal structures 1–13 containing the [M(Lk)3]2+ cations (M = Fe, Ni, Zn, Lk = L6–L7), pure meridional isomers are observed six times, pure facial isomers also six times and a mixture (44% mer and 56% fac) is detected only once. Solid-state magnetic data recorded for the FeII complexes show the operation of slightly cooperative spin transitions in 7 (fac-[Fe(L6)3]2+) and 12 (mer-[Fe(L7)3]2+). For the meridional isomer in 6, a two-step spin state transition curve, associated with two phase transitions, is detected.
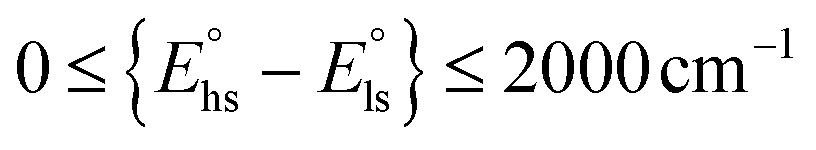 ). Adapted from ref. 16 and 17.
 , leads to Δoct/B ≈ 19 and an equal population of 1A1 and 5T2 levels represented by a vertical dashed line (Scheme 1c). However, this approach is misleading and physically unsound since the vertical dashed line in the Tanabe–Sugano diagram (Scheme 1c) refers to a non-equilibrium geometry. Indeed, the population of the antibonding orbitals in high-spin FeII is accompanied by a 10% elongation of the Fe–N bond lengths14 together with minor geometrical distortions,15 which affect Δoct and P during the spin transition. Taking this into account, a domain in the Tanabe–Sugano diagram is no more accessible to coordination complexes (red surface in Scheme 1c), whereas two restricted domains (green surfaces in Scheme 1c) correspond to the limits 11
 with 1 ≤ m ≤ 10) can be expected in FeII coordination complexes with standard Racah parameters.12,16 Consequently, an adequate modeling of SCO behaviors requires looking beyond ligand-field theory with the help of quantum chemistry for mapping quantitatively the energy surfaces at equilibrium geometries associated with the 1A1 and 5T2 terms.21 Although significant progress is being made along this line,18–23 reliable models for the prediction of molecular SCO systems are still limited because they involve open-shell species and small energy differences.24 The systematic exploration of classes of ligands is thus the rule for designing molecular SCO complexes in coordination chemistry. Myriads of six-coordinate SCO FeII complexes have been thus actively synthesized, characterized and a posteriori rationalized. This global effort has been regularly and extensively reviewed during the last two decades in specialized journals14,25–35 and in two comprehensive monographies.36,37 There is no doubt that the pseudo-octahedral [FeN6] chromophore, where N stands for a heterocyclic nitrogen donor atom, is one of the most studied and versatile unit for implementing FeII SCO properties in molecular complexes. Some ‘rules of thumb’ could be extracted from empirical analyses of structure–properties relationships. For instance, Shatruk and coworkers used the interatomic separation between the N-donor atoms in multidentate chelate ligands as a metric guide for programming SCO properties in FeII complexes,38 whereas Brooker, Garden and coworkers reported on more sophisticated density functional theory (DFT) calculations for predicting the 15N NMR shifts in 1,2,4-triazole ligands, which can be then used as a criterion for rationalizing SCO behaviors.24
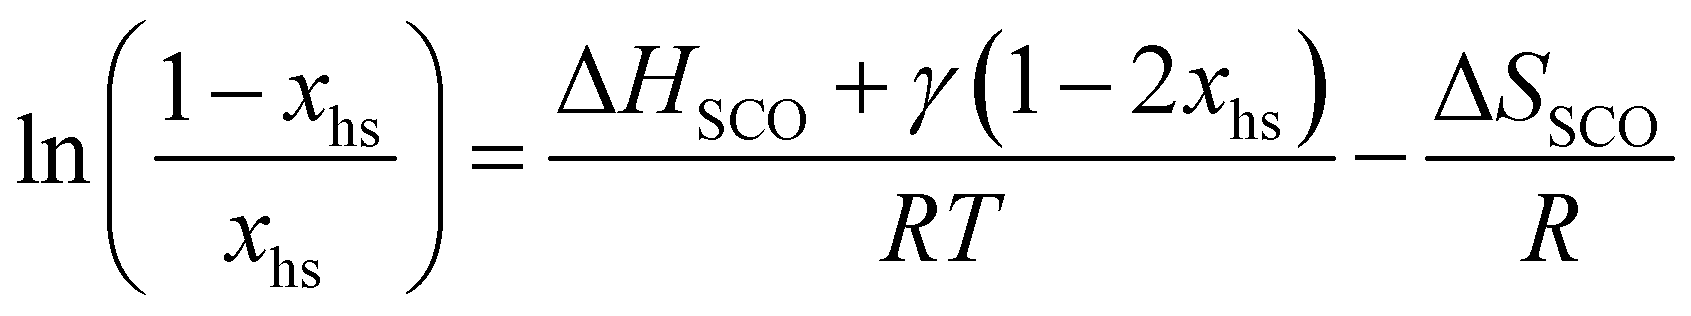


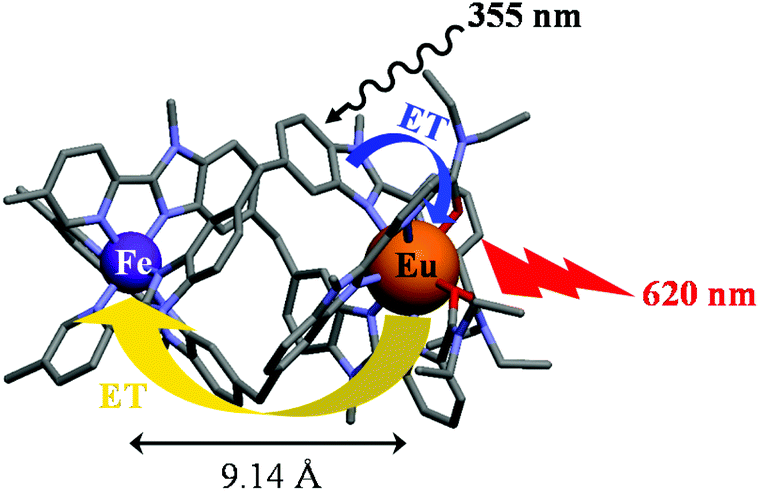
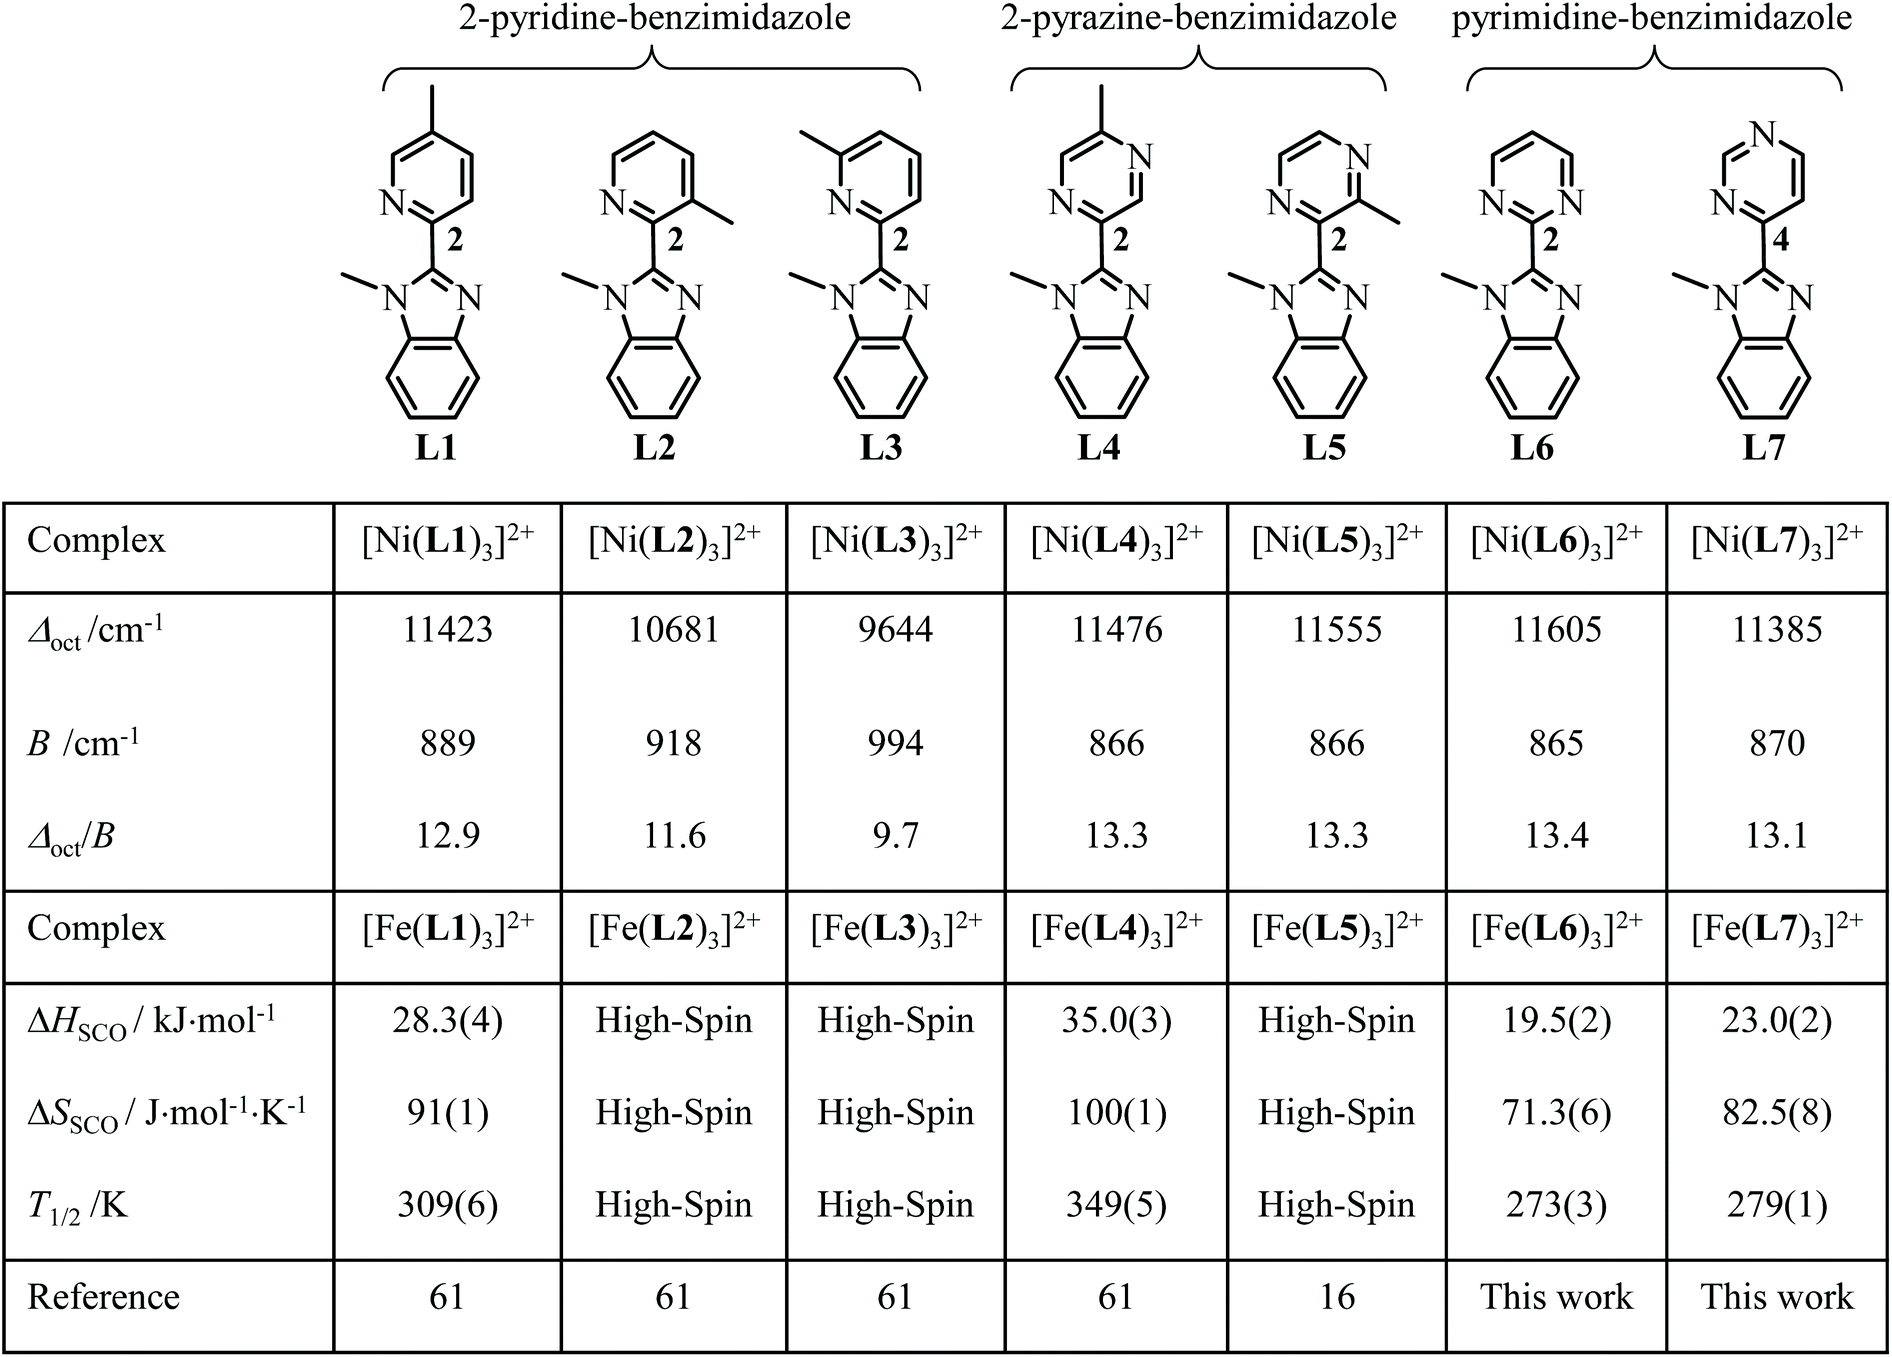


 gathered in Table 1 (column 1, entries 1 and 2).71–73
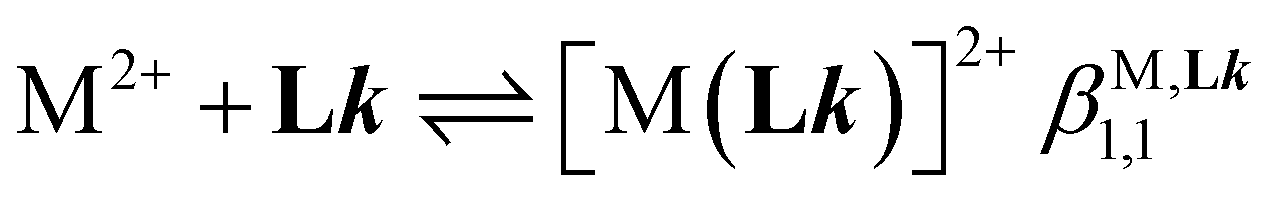


 . However, the reverse situation holds with a cumulative constant log(
 ) = 14.07(4), found for [Zn(L7)3]2+, being almost 8 orders of magnitude smaller than log(
 ) = 21.8(1) (Table 1). Translated into ligand speciation,73 these thermodynamic constants imply that the target saturated complex [Zn(L6)3]2+ is quantitatively formed (>98%) in solution for a stoichiometric ratio Zn
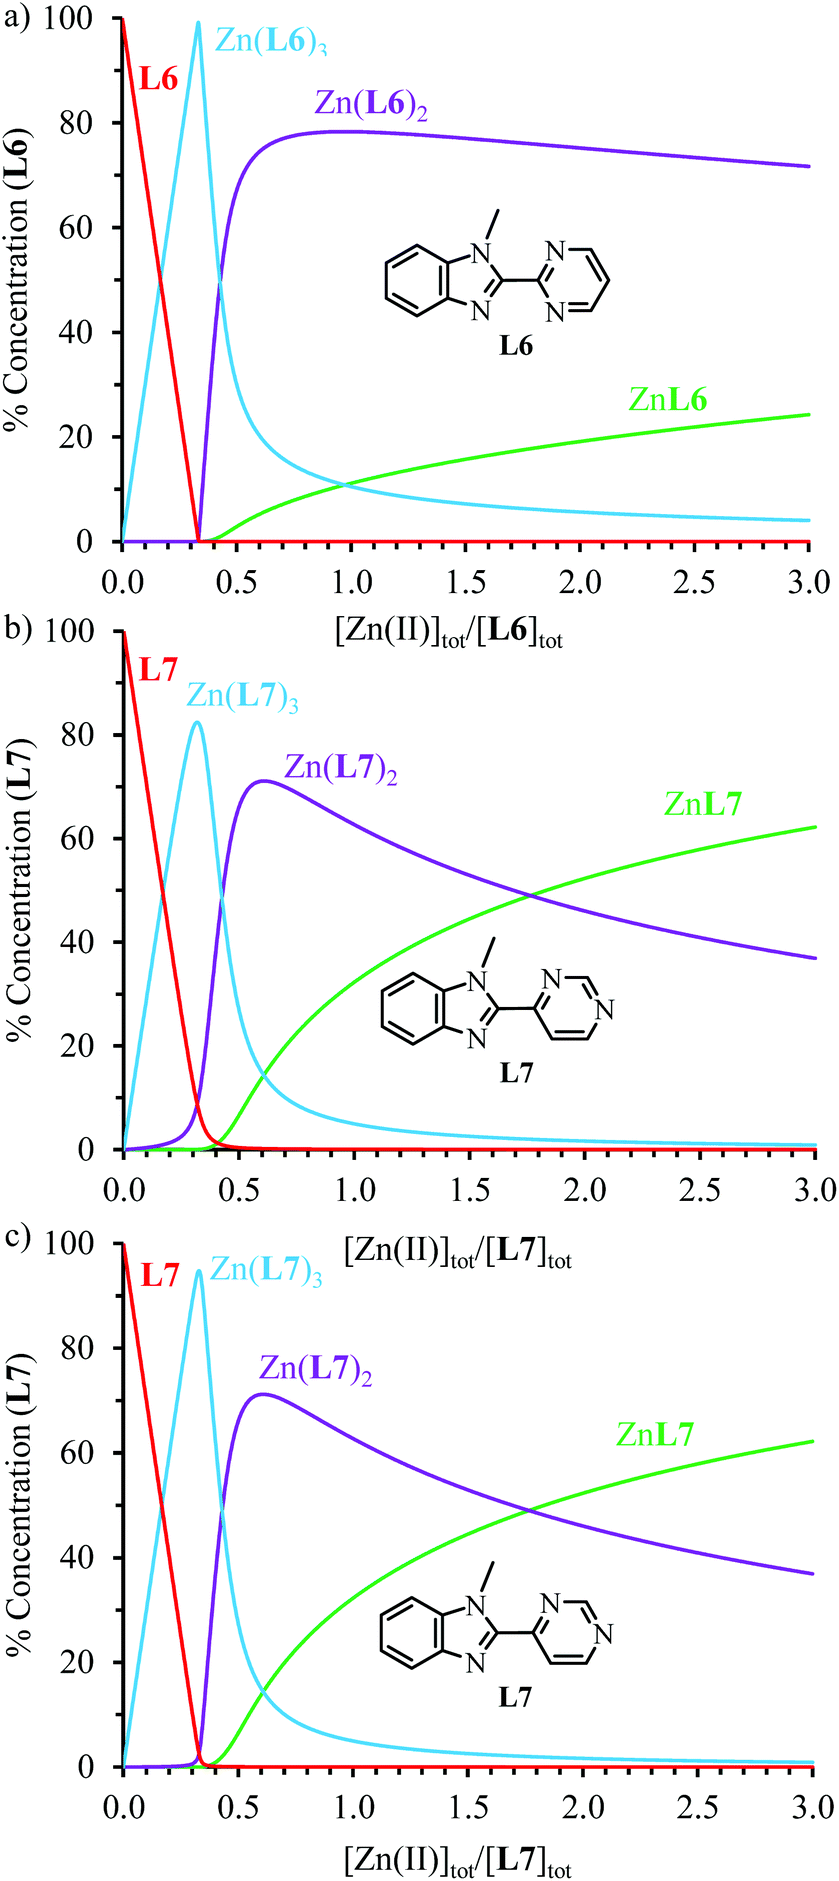
 and
and  . The first term
  stands for the intermolecular microscopic affinities (including desolvation) characterizing the free energy of inner sphere connection of the didentate binding site in Lk to MII (
 ) and
) and  accounts for the free energy of interligand interactions (
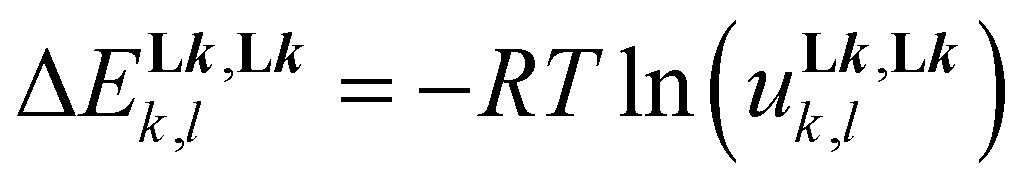 ), which operate when two ligands are bound to the same metallic centre.


 reduces the number microscopic descriptors to fZn,Lk and uLk,Lk for modelling the three macroscopic constants obtained by spectrophotometry (eqn (9), (12) and (13)).
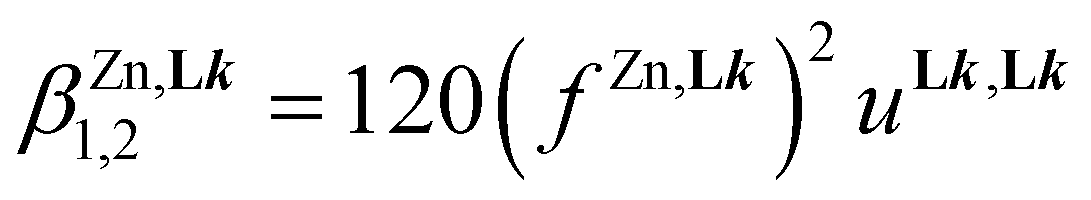

 and interligand interactions
  gathered in Table 1 (columns 3–6), which satisfyingly reproduce the experimental data. Altogether, this rough thermodynamic model establishes that (i) the affinity of the selected didentate ligands for spherical Zn2+ (
 ) follows the trend L1 (2-pyridine) ≈ L6 (2-pyrimidine) > L4 (2-pyrazine) ≫ L7 (4-pyrimidine) and (ii) the successive binding of ligands leading to [Zn(Lk)3]2+ follows a weakly cooperative procedure (
 ).
). are however drastically reduced by two to five orders of magnitude in going from Zn2+/L6 (Table 1, entry 1) to Fe2+/L6 (Table 1, entry 3). Though less pronounced, the same trend was previously reported for 2-pyrazine-benzimidazole L4 ligands in going from Zn2+ to Fe2+ (Table S7†).61 The replacement of ligand L6 with L7 leads to
  , a trend which strictly mirrors that previously observed for Zn2+. Finally, titrations of L7 with analogous Ni2+ cations (Fig. S24†) additionally fixes
  in line with the well-known Irving–Williams series (Table 1, entry 4).16,82,83 Consequently, the speciation profiles computed for Fe2+/L6 (Fig. S26†) mirror those highlighted for Zn2+/L7 (Fig. 4b and c), which possess similar stability constants, but the Fe2+/L7 system is expected to produce much smaller quantities of [Fe(L7)3]2+, which are overcome by those computed for [Ni(L7)3]2+ (Fig. S27†).
 can be estimated at different temperatures. Van't Hoff plots display linear correlations (Fig. S30†) and lead to enthalpic and entropic contributions collected in Table 2 together with speciations highlighted in Fig. 5. As previously reported for mer-[Zn(Lk)3]2+ → fac-[Zn(Lk)3]2+ equilibria with L1 (2-pyridine) and L4 (2 pyrazine, Table S8†),74 the latter mer → fac isomerization process for L6 and L7 is solvent dependent and deviates from a pure statistical behavior (
 and
and  = −RT·ln(1/3) = 2.7 kJ mol−1 at 298 K).
 ) and entropic (
 ) contributions to equilibrium (14) in solution


 ≤ −2.8 kJ mol−1, Table 2), in which each benzimidazole N-donor atom is bound trans to the N-atom of the pyridimidine ring, is reminiscent of the thermodynamic trans influence.74,84 The opposite entropic preference for the meridional isomer (4.8 ≤
  ≤ 11.3 kJ mol−1 at 298 K, Table 2), which is significantly larger than the pure statistical contribution of 2.7 kJ mol−1 at 298 K, has been previously attributed to the larger relaxation of the solvent organization around the meridional isomer which possesses a smaller dipole moment.74
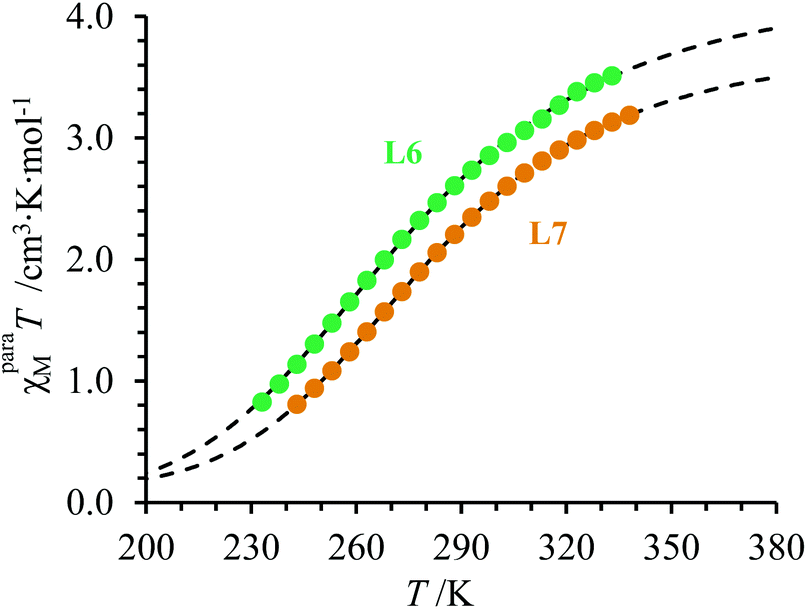


 .
. are at hand at each temperature.61 We propose here a parallel approach which takes reasonably for granted that the Curie constants C and the TIP contributions are identical for the fac and mer isomers of the same complex. Moreover, one also assumes (still reasonably) that the thermodynamic data extracted from VT-NMR analysis for the isomerization process operating in [Zn(Lk)3]2+ holds true for [Fe(Lk)3]2+ (in other words
  ). With this in mind, eqn (16) can re-written as eqn (19) and the introduction of the thermodynamic constants Kmer→fac and KSCO finally yields eqn (20) (see ESI Appendix 2 for details†).61
 and
and  gathered in Table 2 for L6 in CD3CN and (ii)
  , allows the satisfying non-linear least-square fits with eqn (20) of χparaMT versus T plots for fac-[Fe(L6)3]2+ and mer-[Fe(L6)3]2+ (Fig. 7). In complete agreement with the previous analysis using a loosely constrained triple-stranded LaFe helicate for modeling fac-[Fe(Lk)2]2+ (Lk = L1, L4),61 this alternative approach avoids the synthesis of the related helicates and confirms that the SCO enthalpies are only marginally larger for the facial isomer (≈1 kJ mol−1). However, the SCO entropy is systematically more favorable for the meridional isomer mer-[Fe(L6)3]2+ by ΔSmerSCO− ΔSfacSCO = 11(1) J mol−1 K−1, a value mirroring those previously reported for mer-[Fe(L1)3]2+ (14(2) J mol−1 K−1) and mer-[Fe(L4)3]2+, (11(1) J mol−1 K−1).61 In going from facial to meridional isomer in [Fe(Lk)3]2+, H/S anti-compensation seems to be the rule since the spin transitions, which occur in mer-[Fe(Lk)3]2+ are concomitantly favored over fac-[Fe(Lk)3]2+ by (i) a lower enthalpy cost and a (ii) larger entropic gain (see Fig. 7).
 , accompanied by a two-steps spin crossover transition (Table S44†).
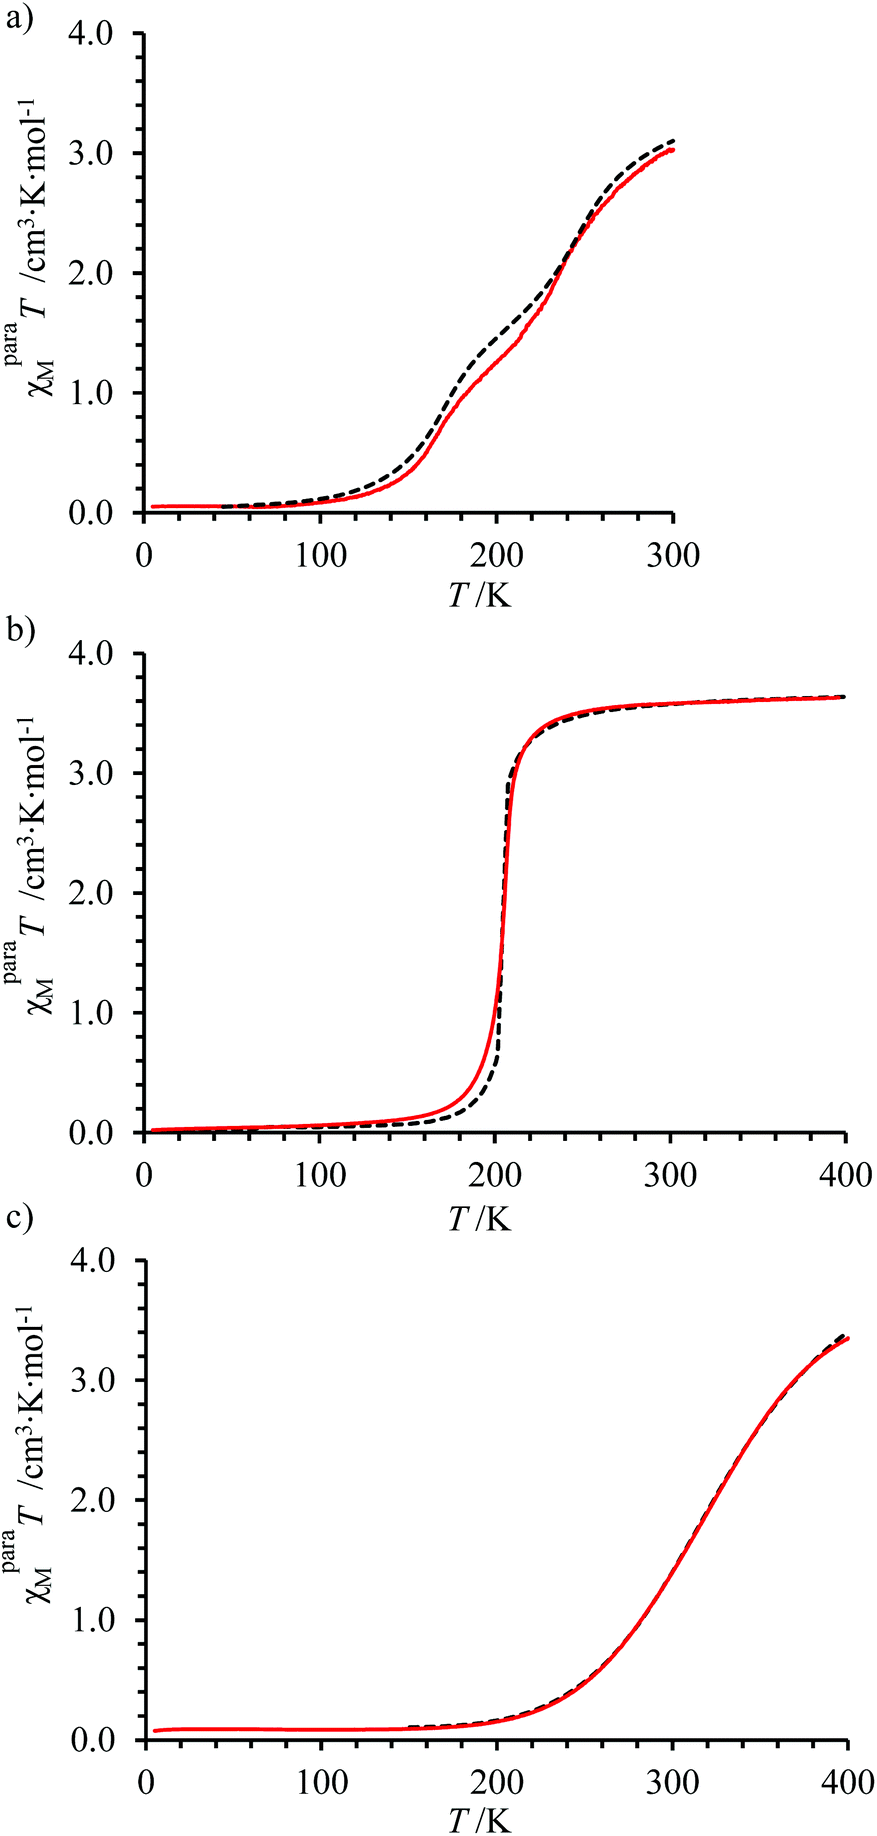

 .
.

 .124
.124