
 Open Access Article
 This Open Access Article is licensed under a Creative Commons Attribution-Non Commercial 3.0 Unported Licence
Boronate-appended polymers with diol-functionalized ferrocene: an effective and selective method for voltammetric glucose sensing†
Jakub P.
Sęk
a,
Sabina
Kaczmarczyk
a,
Katarzyna
Guńka
b,
Agata
Kowalczyk
 *a,
Krzysztof M.
Borys
b,
Artur
Kasprzak
*b and
Anna M.
Nowicka
*a
*a,
Krzysztof M.
Borys
b,
Artur
Kasprzak
*b and
Anna M.
Nowicka
*a
aFaculty of Chemistry, University of Warsaw, Pasteura 1 Str., PL-02-093 Warsaw, Poland. E-mail: akowalczyk@chem.uw.edu.pl; anowicka@chem.uw.edu.pl
bFaculty of Chemistry, Warsaw University of Technology, Noakowskiego 3 Str., PL-00-664 Warsaw, Poland. E-mail: akasprzak@ch.pw.edu.pl
First published on 26th November 2020
Abstract
In this research, three types of poly(amidoamine) dendrimers doped with a phenylboronic derivative at different ratios of –B(OH)2 groups to amino groups (–NH2) and one polyethyleneimine (PEI) polymer doped with a phenylboronic acid derivative were used as molecular receptors. The voltammetric glucose detection was based on the difference in the affinity of the tested systems in relation to 2-((ferrocenylmethyl)amino)propane-1,3-diol (Fc-1,3-diol) and glucose. Polymeric phenylboronic compounds were introduced to the electrode surface through an electrodeposition process at a constant potential. The obtained calibration curves were characterized by a wide range of linearity (0.005–100 μM) and low values of the limit of detection reaching even 0.0012 μM. Moreover, the influence of interferents (ascorbic acid, uric acid and fructose) was investigated at two different concentrations. Only fructose had a significant influence on the oxidation signal of ferrocene units, but solely in the case of R-Ph-B(OH)2 (where R = PEI or PAMAM; Ph – phenyl ring) systems with a low content of boron groups, and these systems form complexes with glucose in a stoichiometric ratio of 1![[thin space (1/6-em)]](https://www.rsc.org/images/entities/char_2009.gif) :1. The reliability of the results was confirmed by determining the percentage of recovery (added glucose vs. labeled glucose). Most of the results met the acceptance criteria (95%–105%), allowing the developed electrochemical sensors to be successfully used for the analysis of real-life samples.
:1. The reliability of the results was confirmed by determining the percentage of recovery (added glucose vs. labeled glucose). Most of the results met the acceptance criteria (95%–105%), allowing the developed electrochemical sensors to be successfully used for the analysis of real-life samples.
Introduction
The biological significance of glucose has continuously been the driving force behind the development of faster, stable and precise devices for its detection. Monitoring glucose levels is of utmost importance in the diagnostics and treatment of diabetes – one of the most challenging lifestyle diseases of our times.1 However, the applicability of glucose sensors is by no means limited to medicine, as they have been successfully employed in many fields, e.g. the food industry.2,3 In practice, three major analytical approaches have been employed to measure glucose levels.4,5 The first one involves chemical reactions in which glucose is oxidized; such reactions primarily comprising the oxidation of glucose to gluconic acid are catalyzed by a glucose oxidase enzyme and occur with the co-formation of hydrogen peroxide. The glucose concentration can be determined in such a setting by tracking the oxidation process, e.g. by means of electrochemical6 or optical7 methods. The second way of sensing is based on measuring the change in the fluorescence of the enzymes upon sugar binding. One example of such enzymes is hexokinase, which catalyzes the transformation of glucose to glucose-6-phosphate. The decrease in the fluorescence intensity upon hexose binding (glucose included) by immobilized hexokinase allowed for the determination of the hexose concentration.8 The third approach makes use of molecular receptors – most commonly small organic molecules – able to selectively bind the molecules of analytical interest. In the recent few years, the appealing groups of molecular receptors applied for glucose sensing have been boronic acids (R-B(OH)2) and their derivatives.9–12 The recognition step in such cases is based on the ability of boronic acids to form boronate esters with 1,2- and 1,3-diols in a reversible manner.13 Such diol systems possess structural features not only in glucose but also in numerous biologically and medically relevant binding targets like other saccharides (e.g. fructose, galactose, and cancer-related sialic acids), polysaccharides, glycopeptides, glycoproteins and catecholamine neurotransmitters (e.g. dopamine).14–16The covalent binding of diols with boronic acids can be tracked by utilizing different analytical methods, the major one being fluorescence spectroscopy.16,17 To apply voltammetric detectors in boronic-acid-based sensors, the introduction of a redox probe to the analytically active layer is necessary. Such a redox probe is mainly introduced into the layer, which is a conductive polymer layer, as an integral part of the boronic acid derivative.12 The interaction of glucose with boronic groups caused changes in the current signal of the polymer. The application of ferrocene derivatives as redox labels requires a completely different approach, since glucose does not interact specifically with ferrocene. To achieve the best sensitivity, the redox probe should not constitute an integral part of the analytically active layer. Considering this, in the present work we propose a sensor, in which a redox probe is introduced to the analytically active layer via the covalent interaction between the diol derivative of the layer and boronic acid. The recognition of glucose was based on the higher binding affinity between boronic acid and glucose rather than that with the redox probe diol. The following criteria were applied in the process of the selection of appropriate electrochemically active labels: (i) the redox probe should exhibit a lower affinity to R-Ph-B(OH)2 than to glucose, and (ii) the electrode process should be fast and simple. We expected that the above-mentioned criteria could be fully met by a 1,3-diol-functionalized ferrocene. The recognition process could be monitored by the quenching of the current signal of the redox probe upon displacement by glucose. The proposed sensors have been characterized using various techniques. To the best of our knowledge, this is the first report on such sensors where the redox probe is not an integral part of the analytically active layer.
Experimental setup
Chemicals
All the chemicals were of the highest quality available. KH2PO4 (Sigma Aldrich), Na2HPO4 (Sigma Aldrich), KCl (p.a., POCH, Poland), NaCl (p.a., POCH, Poland), rat serum (Sigma Aldrich) and D-(+)-glucose (Sigma Aldrich) were used as provided by manufacturers. A 1 mM glucose solution was prepared at least 24 h before the experiments. All the solutions were prepared in 0.02 M PBS buffer (150 mM NaCl, 2 mM KCl) of pH 7.4. The redox probe (Fc-1,3-diol; 2-((ferrocenylmethyl)-amino)propane-1,3-diol), polyethylenimine (PEI; Mw = 25 kDa) and poly(amidoamine) (PAMAM; G2 or G3) dendrimers doped with phenylboronic acid residues were synthesized as described in the next subsection.Synthesis of PEI and PAMAM dendrimers doped with phenylboronic acid
The synthesis design was based on the reductive amination approach in which the formyl groups of 4-formylphenylboronic acid (4-FPBA) and primary amino groups of PEI or PAMAM (G2, G3) were reacted. In general, the reactions were conducted in MeOH with sodium borohydride as the reducing agent. For the reactions with PAMAM dendrimers, the following molar ratios were used: PAMAM G2 (bearing 16 NH2 groups) – 8 amino groups were reacted (8 amino groups remained unfunctionalized; PAMAM-1-B(OH)2), PAMAM G2 (bearing 16 NH2 groups) – 2 amino groups were reacted (14 amino groups remained unfunctionalized; PAMAM-2-B(OH)2), and PAMAM G3 (bearing 32 NH2 groups) – 4 amino groups were reacted (28 amino groups remained unfunctionalized; PAMAM-3-B(OH)2). The experimental procedure is described for the synthesis of PEI and PAMAM derivatives, i.e., poly(ethylenimine) doped with phenylboronic acid residues (PEI-B(OH)2), PAMAM G2 doped with phenylboronic acid residues, bearing 8 free NH2 groups (PAMAM-1-B(OH)2), PAMAM G2 doped with phenylboronic acid residues, bearing 14 free NH2 groups (PAMAM-2-B(OH)2), and PAMAM G2 doped with phenylboronic acid residues, bearing 28 free NH2 groups (PAMAM-3-B(OH)2). The quantities of the reagents were denoted as (1), (2), (3), (4) and (5), and along with the dialysis time (6), the type of dialysis sack (7) and the mass of the product (8) are presented in Tables S1 and S2 in the ESI.† The NMR data of the synthesized PEI and PAMAM dendrimers doped with phenylboronic acid are presented in Section 1 in the ESI.†

PEI/PAMAM (1) was added to a 50 mL round bottomed flask which was subsequently closed with a septum. In the case of dendrimers, the PAMAM solution in methanol was weighed, following which the solvent was evaporated, and the sample was lyophilized to obtain the pure dendrimer. The flask was connected to a vacuum line and purged with argon three times. Next, degassed and dried methanol (2) was added, and PEI/PAMAM was dissolved using a magnetic stirrer for ca. 10 minutes. Then, 4-FPBA (3) was added to the flask in one portion, and the solution turned turbid. The reaction was carried out for 24 hours at room temperature under an argon atmosphere with the flask protected from exposure to light. Afterwards, the solution turned cloudy and white-yellow. Sodium borohydride (4) was added to the mixture in four-fold molar excess with respect to 4-FPBA. An intense evolution of hydrogen was observed, and a syringe needle was placed in the septum to remove the hydrogen from the reaction mixture. The flask contents were mixed using a magnetic stirrer for 2 hours at rt under an argon atmosphere. The solution first became clear and then turned light yellow. The flask was then connected to a rotary evaporator to evaporate most of the methanol, and the residue was dissolved completely in distilled water (5). The flask contents were placed in a dialysis sack (6) after they had been concentrated. The sack was placed in a 2 L beaker filled with distilled water. Water was replaced twice during the dialysis. The contents of the dialysis sack were transferred to a flask to evaporate water using the rotary evaporator. The flask was then placed at −24 °C for 24 h, and the product was then lyophilized over 24 h.

Synthesis of redox probe Fc-1,3-diol
The redox probe (Fc-1,3-diol) was obtained by the treatment of ferrocenecarboxaldehyde with serinol (2-amino-1,3-propanediol; the reductive amination approach). A solution of ferrocenecarboxaldehyde (42.8 mg, 0.20 mmol, 1.0 equiv.) and serinol (21.9 mg, 0.24 mmol, 1.2 equiv.) in MeOH (6 mL) was refluxed for 5 hours under an argon atmosphere. Sodium borohydride (30.4 mg, 0.80 mmol, 4.0 equiv.) was added, and the resulting mixture was further refluxed for 1 hour. The reaction mixture was diluted with CH2Cl2 (30 mL), washed with water (10 mL) and brine (5 mL), dried over MgSO4, filtered and evaporated. The crude solid was purified by column chromatography (SiO2, 10% MeOH/CH2Cl2; Rf = 0.90) to yield pure Fc-1,3-diol (52.0 mg; 90% yield) as a yellow solid. The 1H NMR and 13C NMR spectra of Fc-1,3-diol are shown in Fig. S11 and S12 in the ESI.†1H NMR δH (500 MHz, DMSO-d6, ppm): 4.43 (t, 2H), 4.19 (t, 2H), 4.15 (s, 5H), 4.08 (t, 2H), 3.43 (s, 2H), 3.40–3.34 (m, 4H,), 2.60 (q, 1H), 1.84 (bs, 1H); 13C NMR δC (125 MHz, DMSO-d6, ppm): 86.6; 68.8; 68.4; 68.1; 67.9; 62.1; 59.2; 46.3; TOF-HRMS (ESI): calcd for C14H20FeNO2 [M + H]+ = 290.1765, found: m/z 290.1751.
Voltammetric measurements
Cyclic voltammetry (CV) was performed using an Autolab model PGSTAT 12 potentiostat equipped with an ECD amplifier module (RC time settings: 0.0 s for scan rates >10 mV s−1 and 0.1 s for scan rates <10 mV s−1). The voltammetric measurements were performed in a three-electrode system consisting of a working electrode (glassy carbon electrode, GCE; ϕ = 3 mm; BAS Instruments), a reference electrode (Ag/AgCl/3 M KCl) and a platinum wire as the auxiliary electrode. Before each experiment, the surface of the working electrode was polished with 1 μm Al2O3 powder on a wet pad. After each polishing procedure, to remove alumina completely from the electrode surface, the surface was rinsed with a direct stream of ultrapure water (Hydrolab; conductivity of 0.056 μS cm−1). To minimize the electric noise, all the voltammetric experiments were performed in a Faraday cage.Spectroscopic measurements of the boronate esters of glucose
Spectral titration measurements of the tested boronic acid polymer derivative solutions were carried out at room temperature using glucose and ferrocene-1,3-diol. The formation of the R-Ph-B-(Fc-1,3-diol) and R-Ph-B-glucose complexes was monitored spectrophotometrically within the absorption region characteristic of Fc-1,3-diol and R-Ph-B(OH)2, using a PerkinElmer Lambda 25 spectrophotometer. Before the experiments, each solution was stirred for at least 12 h in a ThermoMixer (Eppendorf).The 1H NMR experiments for the investigation of Fc-1,3-diol binding with phenylboronic acid were carried out in DMSO-d6 using a Varian VNMRS 500 MHz spectrometer (1H NMR at 500 MHz) equipped with a multinuclear z-gradient inverse probe head. Unless otherwise stated, the spectra were recorded at 25 °C. Standard 5 mm NMR tubes were used. The 1H chemical shifts (δ) were reported in parts per million (ppm), relative to the solvent signal: DMSO-d6, δH (residual DMSO) 2.50 ppm. The parameters of the NMR spectra were given as follows: temperature = 25 °C, 1H NMR: sweep width: sw = 8000 Hz, acquisition time: at = 4 s, relaxation delay: d1 = 0 s, scans: nt = 16, 13C NMR: sweep width: sw = 32000 Hz, acquisition time: at = 1 s, relaxation delay: d1 = 0 s, scans: nt = 6000.
Glucose sensor preparation
In the first step, a polymeric modifier doped with boronic acid was electrodeposited onto a glassy carbon surface. The freshly polished glassy carbon electrode was immersed in a 0.25 mg mL−1 R-Ph-B(OH)2 solution in 0.5 M NaCl (pH 5.0). Under such conditions, the applied polymers (PEI, PAMAM) existed in the form of polycations. Upon applying a potential of −50 mV for over 20 minutes, an R-Ph-B(OH)2 film was formed on the electrode surface. Then, the electrode was slowly rinsed with distilled water, and the polymeric layer was stabilized in a 0.02 M PBS buffer during continuous cyclization in the potential range from 0 to 0.8 V at a scan rate of 100 mV s−1 until a stable voltammogram was observed. Next, the modified electrode (GC/R-Ph-B(OH)2) was incubated in a 0.5 mM Fc-1,3-diol solution for 3 h. The presence of two –OH groups in the redox probe structure allowed for its covalent conjugation with boronic acid, and the sensor was ready to use. The working principle of the glucose-sensor is shown in Scheme 1. | ||
| Scheme 1 Scheme of the working principle of the glucose-sensor. | ||
Results and discussion
Affinities of phenylboronic systems to Fc-1,3-diol and glucose
The affinities of phenylboronic compounds to 1,2-diols and 1,3-diols can be characterized quantitatively based on the determination of a constant value (K). It should be stressed, however, that this constant cannot be treated as the traditionally understood equilibrium constant, also called the binding or association constant, due to the complexity of the composition of the reaction system and the coexistence of many forms in solution. Therefore, the determined constants are conditional (apparent) constants, as their values strictly depend on the measurement conditions such as pH or the type and concentration of the buffer used. Since the recognition process of glucose was based on the displacement of the redox probe molecules from the analytically active layer by sugar molecules, the key step was the determination of the values of the conditional constants of glucose-B(OH)2 and Fc-1,3-diol-B(OH)2. Only the polymers doped with phenylboronic acids characterized by a higher affinity to glucose than to the redox probe (Fc-1,3-diol) can be successfully used to analyse real-life samples. The formation of boronate ester with Fc-1,3-diol has been confirmed by 1H NMR spectroscopy (see Fig. S13 in the ESI†). Due to the fact that the used redox probe was poorly soluble in water but very well soluble in DMSO, the measurements of the conditional constants for glucose and Fc-1,3-diol were performed in a 0.02 M PBS buffer of pH 7.4 with the addition of 5% DMSO. The UV-vis spectra recorded for pure Fc-1,3-diol and its complexes with R-Ph-B(OH)2 receptors are shown in Fig. S14 in the ESI.† Ferrocene and its derivatives form colored solutions, and therefore their UV-vis spectra in the visible light range show a characteristic absorption band at a wavelength of about 430 nm. The intensity of this band increased in the presence of the phenylboronic derivatives. Based on the variation in the absorbance intensities, the conditional constants (Kcond) of glucose and Fc-1,3-diol with R-Ph-B(OH)2 receptors were determined according to the Benesi–Hildebrand equation as follows:18,19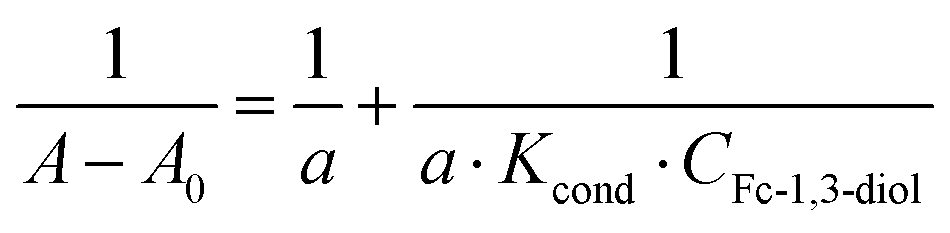 | (1) |
| Linear regression equations | R 2 | K cond. [M−1] |
|---|---|---|
| A: R-Ph-B(OH) 2 complexes with Fc-1,3-diol | ||
| PEI-Ph-B(OH)2 | ||

|
0.983 | (0.13 ± 0.04) × 104 |
| PAMAM-1-Ph-B(OH)2 | ||

|
0.989 | (0.11 ± 0.03) × 104 |
| PAMAM-2-Ph-B(OH)2 | ||

|
0.987 | (0.07 ± 0.01) × 104 |
| PAMAM-3-Ph-B(OH)2 | ||

|
0.989 | (0.06 ± 0.6) × 104 |
| B: R-Ph-B(OH) 2 complexes with glucose | ||
| PEI-Ph-B(OH)2 | ||
|
0.998 | (2.01 ± 0.02) × 104 |
| PAMAM-1-Ph-B(OH)2 | ||

|
0.998 | (2.70 ± 0.05) × 104 |
| PAMAM-2-Ph-B(OH)2 | ||

|
0.965 | (0.31 ± 0.02) × 104 |
| PAMAM-3-Ph-B(OH)2 | ||
|
0.997 | (0.35 ± 0.01) × 104 |
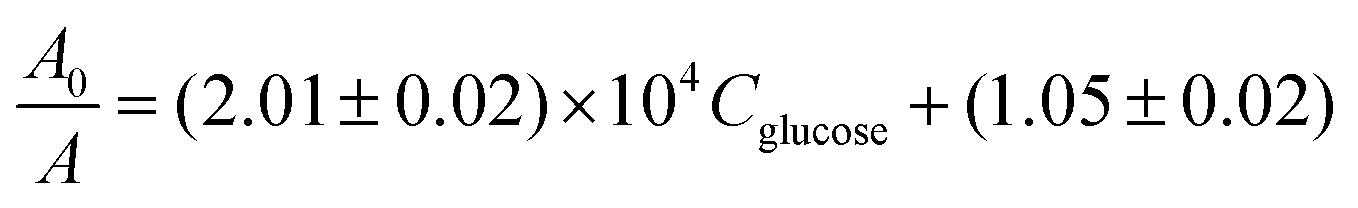
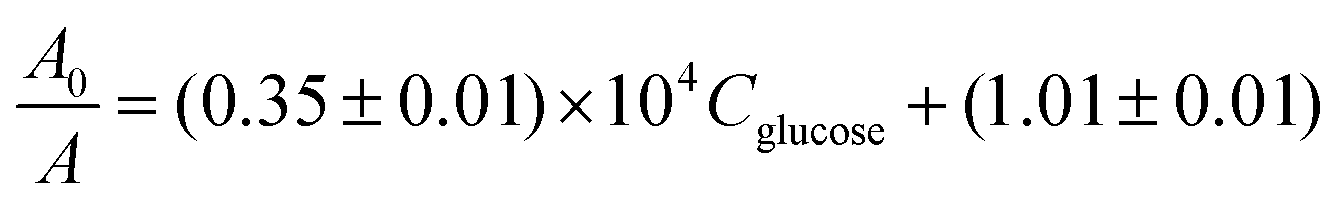
Similarly to the case of Fc-1,3-diol, in order to determine the conditional constant equilibrium of glucose complexing reactions, UV-vis spectra were recorded for solutions with a constant concentration of the phenylboronic acid derivative (0.25 mg mL−1) and various glucose concentrations in the range of 1–100 μM (see Fig. S16 in the ESI†). The formation of the R-Ph-B(OH)2-glucose ester caused a decrease in the intensity of the characteristic band (at ca. 330 nm) of the phenylboronic derivative. This decrease was greater when the glucose concentration was higher. Such behavior is typical of Stern–Volmer dependence.
Based on the changes in the absorbance intensity of the band at ca. 330 nm in the presence20 of glucose, a conditional constant was determined according to the Stern–Volmer equation as follows:
 | (2) |
:1 – two boronic groups bound to one glucose molecule. It has been shown that such binding might be involved in sugar complexing.5,21–23
It is worth noting that the presence of amino groups in the backbones of the described polymers may positively affect their receptor activities towards saccharides.24 The strategy of incorporating amino groups was reported to improve the glucose sensitivity and selectivity in saccharide-responsive boronic-functionalized polymers.25 As an example, phenylboronic acid copolymers with an amine component had a higher proportion of phenylboronic groups complexed with glucose versus the total amount of phenylboronic groups when compared to their amine-lacking counterparts.26 Interestingly, an increased glucose response associated with the presence of amino groups was observed at a pH as low as the physiological pH of 7.4.26,27 These phenomena have been ascribed to boron–nitrogen interactions, i.e., the formation of B–N dative bonds. The formation of these bonds was shown to decrease the pKa value of boronic species, increasing the diol affinity at lower pH values.28
Analytical characteristics of the sensor
The glucose recognition process was based on the stronger affinity of the R-Ph-B(OH)2 receptors to glucose than that to the redox probe (Fc-1,3-diol). As a result of the contact between the receptor layer (R-Ph-B-(Fc-1,3-diol)) and glucose solution, the ferrocene derivative was substituted with glucose in accordance with the reaction shown in Fig. 1. The effectiveness of this process was increased due to the higher difference between the conditional constants of the esters: R-Ph-B-(glucose) and R-Ph-B-(Fc-1,3-diol). As a result of the substitution of Fc-1,3-diol with glucose in the sensing layer, the current signal corresponding to the Fc redox process was gradually quenched. Fig. 1 shows the cyclic voltammograms recorded for the studied phenylboronic derivatives as a function of changing glucose concentration in a 0.02 M PBS buffer of pH 7.4. For all the studied sensors, the recorded cyclic voltammograms were characterized by a reversible pair of current signals corresponding to the electrochemical processes of ferrocene. In addition, the current signals recorded for PEI-Ph-B-(Fc-1,3-diol) were of 10 times higher intensity, and this may be associated with a greater number of Fc-1,3-diol molecules bound to the polymer network. Regardless of the type of the receptor layer, along with the increase in the glucose concentration in the analyzed solution, a significantly more intense quenching of the current signals was observed. It should be noted that even at a high concentration of glucose, not all the ferrocene molecules were replaced. The process of redox probe release from the receptor layer strongly depends on the polymer layer thickness, its structure, and the steric arrangement of reactive moieties within the polymeric network. | ||
| Fig. 1 Cyclic voltammograms of R-Ph-B-(Fc-1,3-diol) before (red dashed lines) and after interaction with glucose (solid black lines). Experimental conditions: 0.02 M PBS buffer of pH 7.4, with the addition of 5% DMSO; Cglucose = 1–100 μM; scan rate: 0.1 V s−1. | ||
To obtain information about the quality of the R-Ph-B(OH)2 layer, the quartz crystal microbalance with dissipation (QCM-D) measurements were performed. The typical QCM-D spectra of the frequency changes (Δf) during the formation of the R-Ph-B(OH)2 layers for one of the selected overtones are shown in Fig. S17 in the ESI.† The addition of the R-Ph-B(OH)2 receptor to the reaction chamber caused a rapid and significant drop in Δf. This decrease was a consequence of the formation of the R-Ph-B(OH)2 layer on the electrode surface. The frequency shift reached a stable value after ca. 15 minutes.
Moreover, for all the studied layers the frequency changes for different overtones (7–11) were practically identical, and the scatter of the results was less than 5%, so it can be assumed that the formed R-Ph-B(OH)2 layers were homogeneous and well packed. Moreover, the low value of ΔD/Δf proved that the formed receptor layers were well organized and very tight. Probably the compact structure of the polymer network prevented the release of the Fc-1,3-diol molecules deeply embedded in its structure.
The difference in the intensities of the current signals of the ferrocene units in the receptor layers before and after interaction with glucose (ΔI = IR-Ph-B-(Fc-1,3-diol) − IR-Ph-B-(glucose)) as a function of the glucose concentration was applied to the construction of the calibration curves; see Fig. 2. Based on these plots, analytical parameters such as linear regression equations, detection limits and relative standard deviations (RSD) were determined and are presented in Table 2A. The detection limits were estimated from the low concentration linearity range according to the following equation:
 | (3) |
 | ||
| Fig. 2 Calibration curves of the sensors GC/R-Ph-B-(Fc-1,3-diol). Experimental conditions: 0.02 M PBS buffer of pH 7.4, with the addition of 5% DMSO; Cglucose = 1–100 μM; scan rate = 0.1 V s−1. | ||
| A: Analytical parameters of the R-Ph-B-(Fc-1,3-diol) sensors. | ||||
|---|---|---|---|---|
| Linear regression equation | R 2 | Analytical range [μM] | LOD [μM] | RSD [%] |
| GC/PEI-Ph-B-(Fc-1,3-diol) | ||||
| ΔI = 1.20log(Cglucose) + 10.81 | 0.997 | 0.005–100 | 0.0029 | 3.7 |
| GC/PAMAM-1-Ph-B-(Fc-1,3-diol) | ||||
| ΔI = 0.15log(Cglucose) + 1.31 | 0.999 | 0.005–100 | 0.0012 | 3.4 |
| GC/PAMAM-2-Ph-B-(Fc-1,3-diol) | ||||
| ΔI = 0.08log(Cglucose) + 0.70 | 0.995 | 0.05–100 | 0.036 | 4.9 |
| GC/PAMAM-3-Ph-B-(Fc-1,3-diol) | ||||
| ΔI = 0.09log(Cglucose) + 0.72 | 0.998 | 0.05–100 | 0.035 | 4.5 |
| B: Other electrochemical approaches for glucose detection. | ||||
|---|---|---|---|---|
| Receptor layer | Detection method | Analytical range [μM] | LOD [μM] | Ref. |
| APBA: 3-aminophenylboronic acid; Au NPs: gold nanoparticles; ChA: chronoamperometry; CV: cyclic voltammetry; cys: L-cysteine; DPV: differential pulse voltammetry; GA: glutaraldehyde; GCE: glassy carbon electrode; GIP: glucose-imprinted polymer; MPBA: 4-mercaptophenylboronic acid; PAA: poly(azure A); PAPBAOT: poly(3-aminophenylboronic acid-co-3-octylthiophene); PABA: poly(aniline boronic acid); PB: Prussian blue; pDA: polydopamine; PEI: polyethyleneimine; SPCE: screen-printed carbon electrode. | ||||
| Au/bis-boronic acid | CV (Fe(CN)63−/4−) | 0–10 | — | 29 |
| Au/Au-PB/pDA/Au NPs/MPBA | DPV (Fe(CN)63−/4−) | 0.1–13.5 | 0.05 | 30 |
| GCE/Au NPs-PEI/GA/APBA | Potentiometry | 500–5000 | 25 | 31 |
| Au/PABA nanotubes | Potentiometry | 2000–14000 |
500 | 32 |
| GCE/PAPBAOT | Potentiometry | 5000–50000 |
500 | 33 |
| GCE/PAA-Au NPs-MPBA(cys) | CV (Fe(CN)63−/4−) | 0.01–10 | 0.004 | 34 |
| SPCE/CuCo/GIP/APBA | ChA | 1 000–25000 |
0.65 | 35 |
The developed sensors showed high stability in a significant time interval. After the preparation, the sensor (GC/R-Ph-B-(Fc-1,3-diol)) was kept at room temperature under a cover. Over 2 months, no significant changes (RSD ≤ 4%) were observed in the sensor current response. Moreover, the reproducibility of the sensors was tested with three different glassy carbon electrodes at four concentrations of glucose within the linear range of the calibration curves. The relative standard deviations were less than 3.5% at all the tested glucose concentrations.
Next to the analytical range and detection limit, one of the most important analytical parameters of each sensor is its selectivity. This parameter determines the effect of other matrix components, sometimes structurally similar to the analyte, on the effectiveness of the recognition process. Selectivity studies were performed for compounds – fructose, ascorbic acid and uric acid – which, according to the literature, may interfere the most with glucose determination in blood samples36 and soft drinks.37 The measurements were performed at two different concentrations of the interferents: 5 μM and 100 μM. Based on the obtained results (Fig. 3), it can be stated that among the tested interfering species, only fructose can interfere with glucose determination, but solely in the case of GC/PAMAM-2-Ph-B-(Fc-1,3-diol) and GC/PAMAM-3-Ph-B-(Fc-1,3-diol) sensors, which are characteristic of similar conditional constants versus Fc-1,3-diol and glucose. In the case of ascorbic and uric acids, the differences in the signals were within the statistical error limits for both analyzed interferent concentrations regardless of the type of receptor. The high selectivity towards glucose in the presence of fructose of the sensors based on the polymers with a high number of the –B(OH)2 groups (PEI and PAMAM-1) is a consequence of the possibility to form the bis(boronate) ester of glucose rather than the monoboronate glucose ester. It should be highlighted that glucose, most simple sugars and many of their derivatives exist in solution in specific equilibria of α-pyranose, β-pyranose, α-furanose, β-furanose and acyclic (open chain) forms. In general the acyclic form is only present in a trace amount (<0.03%) like the furanose form (<0.5% of α-furanose and 0.5% of β-furanose). The dominant form of glucose is pyranose (64% of β-pyranose and 36% of α-pyranose).38Fig. 4 shows the scheme of possible bis(boronate) and monoboronate esters of glucose in different forms. However, taking into account the structural stresses, the most favourable bisester is between the boronate groups and α-pyranose.
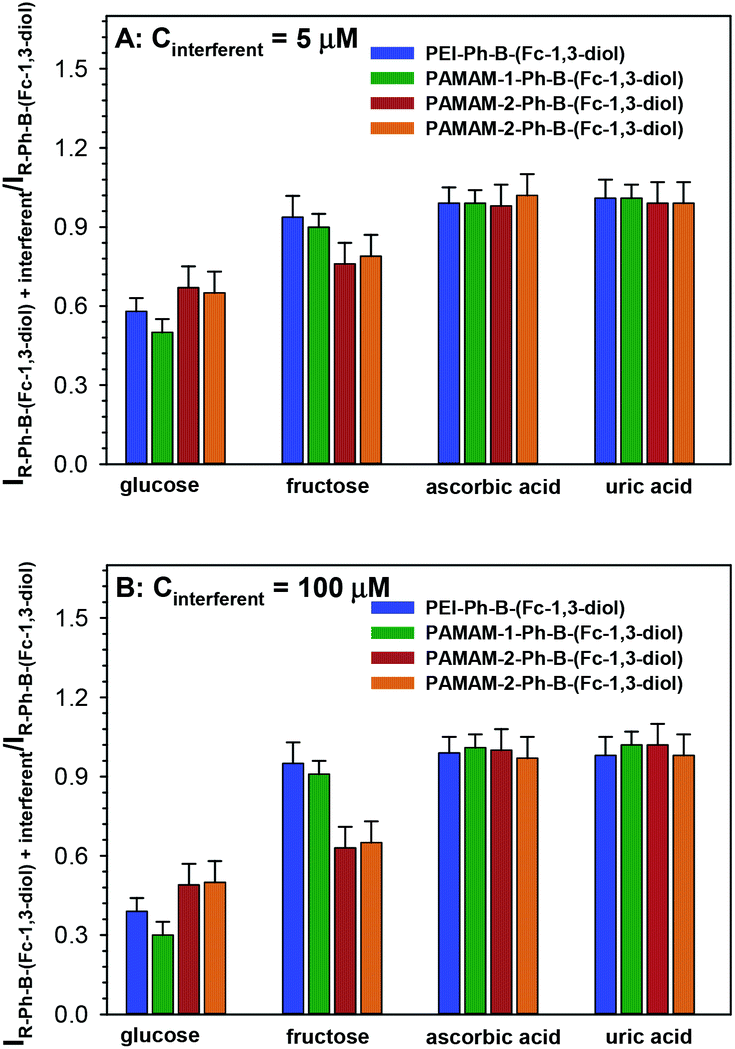 | ||
| Fig. 3 Effect of interfering species on the oxidation current of Fc (A and B). | ||
 | ||
| Fig. 4 Chemical structure of the bis(boronate) and monoboronate esters of glucose. | ||
Regeneration of the receptor layer
Due to the fact that the glucose recognition process is based on the ability of boronic acids to form boronate esters with 1,2- and 1,3-diols in a reversible manner, the receptor layer of the sensor can be regenerated through a hydrolysis process. In this experiment, the sensor was immersed and inclubated in water for 2 hours. During this step, the water was used to wash off glucose from the sensor. The washing protocol was repeated 5 times. After that the glucose was removed from the recognition layer, and the modified electrode (GC/R-Ph-B(OH)2) was again incubated in a 0.5 mM Fc-1,3-diol solution for 3 h to form the recognition layer. Next, the sensor was placed in a 0.02 M PBS buffer of pH 7.4, with the addition of 5% DMSO for voltammetric examination. Then the sensor was again immersed in the glucose solution at the same concentration (100 μM) for 3 h. After that the voltammetric curve in 0.02 M PBS buffer of pH 7.4, with the addition of 5% DMSO was recorded.The difference in the intensities of the current signals of the ferrocene units in the receptor layers before and after interaction with glucose (ΔI = IR-Ph-B-(Fc-1,3-diol) − IR-Ph-B-(glucose)) was almost unchanged, and the RSD value was equal to 2.5%; see Fig. 5. Regeneration experiments were performed only for the sensors characterized with the highest conditional constant values of R-Ph-B(OH)2-glucose esters.
 | ||
| Fig. 5 Cyclic voltammograms of PEI-Ph-B-(Fc-1,3-diol) (A) and PAMAM-1-Ph-B-(Fc-1,3-diol) (B) before (dashed lines) and after interaction with glucose (solid lines) recorded after the first use and few regenerations of the recognition layer. Experimental conditions: 0.02 M PBS buffer of pH 7.4, with the addition of 5% DMSO; Cglucose = 100 μM; scan rate = 0.1 V s−1. | ||
Functionality of the sensor versus soft drinks
Two of the proposed sensors that exhibited a high glucose selectivity in the presence of fructose – GC/PEI-Ph-B-(Fc-1,3-diol) and GC/PAMAM-1-Ph-B(Fc-1,3-diol) – were tested for the analysis of real-life samples: soft drinks. Soft drinks, including flavored drinks/juices, non-sparkling and sparkling flavored waters, cola, orangeade, drinks, and isotonic and energy drinks, are one of the widest and most popular groups of offered food products.39 Most of these types of drinks contain added sugars or artificial sweeteners, improving their taste.40,41 In accordance with the applicable European Union and national laws, producers of non-alcoholic beverages are required to disclose the composition of the drink on its label, and in the case of added sugars, the net sugar content should be provided if the sugar quantity in the package exceeds 20 g.42 In this study, six soft drinks containing both glucose and fructose were investigated.To minimize the process of blocking the receptor layer by other chemical species present in the analyzed sample, the samples were diluted 104-fold (PBS buffer) before measurements. The determined glucose content was in a very good agreement with the values declared by manufacturers, as presented in Table 3. The high consistency of the results shows that the sensors developed in this work are of sufficient selectivity to be successfully used to detect glucose in real-life samples in the presence of fructose.
| Soft drink | Sugar content declared by the manufacturer | Glucose content found [M] | |
|---|---|---|---|
| Glucose [M] | Fructose [M] | ||
| Orange juice 1 | 0.061 | 0.083 | 0.064 |
| Orange juice 2 | 0.090 | 0.121 | 0.088 |
| Sparkling flavored Water 1 | 0.091 | 0.082 | 0.095 |
| Sparkling flavored Water 2 | 0.113 | 0.112 | 0.110 |
| Energy drink 1 | 0.271 | 0.270 | 0.278 |
| Energy drink 2 | 0.302 | 0.151 | 0.310 |
Conclusions
In this study, we demonstrated a new approach for glucose determination using newly synthesized boronate-appended polymers. The key-process of the proposed method was the displacement of a redox probe (diol-functionalized ferrocene) with an analyte (glucose). This process was monitored electrochemically and also by the QCM-D technique. Importantly, this innovative method was found to be remarkably effective and selective, achieving amazingly low limit of detection values, even as low as 0.0012 μM. What is more, the functionality of the proposed sensors was tested versus real-life samples, namely, several types of soft drinks. The obtained results clearly showed that the proposed method was sufficiently selective and could be successfully used for the determination of glucose in real-life samples. We believe that our simple approach, combining excellent sensitivity and specificity, might be a promising alternative to enzymatic detection, widely employed in glucose biosensors.Conflicts of interest
There are no conflicts to declare.Acknowledgements
This work was supported by the National Science Center Poland under Grant No. 2015/19/D/ST5/02770. A. Kasprzak acknowledges financial support from the Warsaw University of Technology.Notes and references
- A. T. Kharroubi and H. M. Darwish, Diabetes mellitus: The epidemic of the century, World J. Diabetes, 2015, 6(6), 850 CrossRef.
- C. C. Adley, Past, present and future of sensors in food production, Foods, 2014, 3(3), 491 CrossRef.
- F. Mustafa and S. Andreescu, Chemical and biological sensors for food-quality monitoring and smart packaging, Foods, 2018, 7(10), 168 CrossRef CAS.
- M.-S. Steiner, A. Duerkopa and O. S. Wolfbeis, Optical methods for sensing glucose, Chem. Soc. Rev., 2011, 40, 4805 RSC.
- X. Sun and T. D. James, Glucose sensing in supramolecular chemistry, Chem. Rev., 2015, 115, 8001 CrossRef CAS.
- M. Li, W. Zhu, F. Marken and T. D. James, Electrochemical sensing using boronic acids, Chem. Commun., 2015, 51, 14562 RSC.
- X. Wu, X.-X. Chen and Y.-B. Jiang, Recent advances in boronic acid-based optical chemosensors, Analyst, 2017, 142, 1403 RSC.
- F. Hussain, D. J. S. Birch and J. C. Pickup, Glucose sensing based on the intrinsic fluorescence of sol-gel immobilized yeast hexokinase, Anal. Biochem., 2005, 339, 137 CrossRef CAS.
- R. Nishiyabu, Y. Kubo, T. D. James and J. S. Fossey, Boronic acid building blocks: tools for sensing and separation, Chem. Commun., 2011, 47, 1106 RSC.
- X. Wu, Z. Li, X.-X. Chen, J. S. Fossey, T. D. Jamesc and Y.-B. Jiang, Selective sensing of saccharides using simple boronic acids and their aggregates, Chem. Soc. Rev., 2013, 42, 8032 RSC.
- W. Zhai, X. Sun, T. D. James and J. S. Fossey, Boronic acid–based carbohydrate sensing, Chem. – Asian J., 2015, 10, 1836 CrossRef CAS.
- W. L. A. Brooks and B. S. Sumerlin, Synthesis and applications of boronic acid-containing polymers: from materials to medicine, Chem. Rev., 2016, 116, 1375 CrossRef CAS.
- S. D. Bull, M. G. Davidson, J. M. H. van den Elsen, J. S. Fossey, A. T. A. Jenkins, Y.-B. Jiang, Y. Kubo, F. Marken, K. Sakurai, J. Zhao and T. D. James, Exploiting the reversible covalent bonding of boronic acids: recognition, sensing, and assembly, Acc. Chem. Res., 2013, 46, 312 CrossRef CAS.
- J. N. Cambre and B. S. Sumerlin, Biomedical applications of boronic acid polymers, Polymer, 2011, 52, 4631 CrossRef CAS.
- X. Wang, N. Xia and L. Liu, Boronic acid-based approach for separation and immobilization of glycoproteins and its application in sensing, Int. J. Mol. Sci., 2013, 14(10), 20890 CrossRef.
- G. Fang, H. Wang, Z. Bian, J. Sun, A. Liu, H. Fang, B. Liu, Q. Yao and Z. Wu, Recent development of boronic acid-based fluorescent sensors, RSC Adv., 2018, 8, 29400 RSC.
- G. Kaur, N. Lin, H. Fang and B. Wang, Boronic acid-based fluorescence sensors for glucose monitoring, in ed. C. D. Geddes and J. R. Lakowicz, Glucose Sensing. Topics in Fluorescence Spectroscopy, Springer, Boston, 2006, vol. 11, pp. 377–397 Search PubMed.
- H. A. Benesi and J. H. Hildebrand, A Spectrophotometric investigation of the interaction of iodine with aromatic hydrocarbons, J. Am. Chem. Soc., 1949, 71, 2703 CrossRef CAS.
- M. J. Yuan, W. D. Zhou, X. F. Liu, M. Zhu, J. B. Li, X. D. Yin, H. Y. Zheng, Z. C. Zuo, C. B. Ouyang, H. B. Liu, Y. L. Li and D. B. Zhu, A multianalyte chemosensor on a single molecule: promising structure for an integrated logic gate, J. Org. Chem., 2008, 73, 5008 CrossRef CAS.
- A. M. Pyle, J. P. Rehmann, R. Meshoyrer, C. V. Kumar, N. J. Turro and J. K. Barton, Mixed-ligand complexes of ruthenium(II): factors governing binding to DNA, J. Am. Chem. Soc., 1989, 111, 3051 CrossRef CAS.
- J. S. Hansen and J. B. Christensen, Recent advances in fluorescent arylboronic acids for glucose sensing, Biosensors, 2013, 3, 400 CrossRef CAS.
- K. Caoa, X. Jiang, S. Yan, L. Zhang and W. Wu, Phenylboronic acid modified silver nanoparticles for colorimetric dynamic analysis of glucose, Biosens. Bioelectron., 2014, 52, 188 CrossRef.
- Z. Tang, Y. Guan and Y. Zhang, Contraction-type glucose-sensitive microgel functionalized with a 2-substituted phenylboronic acid ligand, Polym. Chem., 2014, 5, 1782 RSC.
- S. Kitano, I. Hisamitsu, Y. Koyama, K. Kataoka, T. Okano and Y. Sakurai, Effect of the incorporation of amino groups in a glucose–responsive polymer complex having phenylboronic acid moieties, Polym. Adv. Technol., 1991, 2, 261 CrossRef CAS.
- A. Kim, S. K. Mujumdar and R. A. Siegel, Swelling properties of hydrogels containing phenylboronic acids, Chemosensors, 2014, 2, 1 CrossRef.
- D. Shno, A. Kubo, Y. Murata, Y. Koyama, K. Kataoka, A. Kikuchi, Y. Sakurai and T. Okano, Amine effect on phenylboronic acid complex with glucose under physiological pH in aqueous solution, J. Biomater. Sci., Polym. Ed., 1996, 7, 697 CrossRef.
- I. Hisamitsu, K. Kataoka, T. Okano and Y. Sakurai, Glucose-responsive gel from phenylborate polymer and poly (vinyl alcohol): prompt response at physiological ph through the interaction of borate with amino group in the gel, Pharm. Res., 1997, 14, 289 CrossRef CAS.
- S. L. Wiskur, J. J. Lavigne, H. Ait-Haddou, V. Lynch, Y. H. Chiu, J. W. Canary and E. V. Anslyn, pKa values and geometries of secondary and tertiary amines complexed to boronic acidsimplications for sensor design, Org. Lett., 2001, 3, 1311 CrossRef CAS.
- H. Wang, H. Zhou, B. Chen, P. M. Mendes, J. S. Fossey, T. D. James and Y. Long, A bis-boronic acid modified electrode for the sensitive and selective determination of glucose concentrations, Analyst, 2013, 138, 7146 RSC.
- J. Li, Z. Wang, P. Li, N. Zong and F. Li, A sensitive non-enzyme sensing platform for glucose based on boronic acid-diol binding, Sens. Actuators, B, 2012, 161, 832 CrossRef CAS.
- H. Çiftçi, E. Alver, F. Çelik, A.Ü. Metin and U. Tamer, Non-enzymatic sensing of glucose using a glassy carbon electrode modified with gold nanoparticles coated with polyethyleneimine and 3-aminophenylboronic acid, Microchim. Acta, 2016, 183, 1479 CrossRef.
- J. Li, L. Liu, P. Wang and J. Zheng, Potentiometric detection of saccharides based on highly ordered poly(aniline boronic acid) nanotubes, Electrochim. Acta, 2014, 121, 369 CrossRef CAS.
- H. Çiftçi, U. Tamer, M. S. Teker and N.Ö. Pekmez, An enzyme free potentiometric detection of glucose based on a conducting polymer poly (3-aminophenyl boronic acid-co-3-octylthiophene), Electrochim. Acta, 2013, 90, 358 CrossRef.
- W. Wang, L. Kong, J. Zhu and L. Tan, One-pot preparation of conductive composite containing boronic acid derivative for non-enzymatic glucose detection, J. Colloid Interface Sci., 2017, 498, 1 CrossRef CAS.
- S. Cho, H. Noh, M. Won, C. Cho, K. Kim and Y. Shim, A selective glucose sensor based on direct oxidation on a bimetal catalyst with a molecular imprinted polymer, Biosens. Bioelectron., 2018, 99, 471 CrossRef CAS.
- A. Szczeklik and P. Gajewski, Interna Szczeklika, Kraków, MP, 2014 Search PubMed.
- E. E. Ventura, J. N. Davis and M. I. Goran, Sugar content of popular sweetened beverages based on objective laboratory analysis: focus on fructose content, Obesity, 2011, 19, 868 CrossRef CAS.
- L. Oliva, J. A. Fernández-López, X. Remesar and M. Alemany, The anomeric nature of glucose and its implications on its analyses and the influence of diet: are routine glycaemia measurements reliable enough?, J. Endocrinol. Metab., 2019, 9(3), 63 CAS.
- P. R. Ashurst, Chemistry and Technology of Soft Drinks and Fruit Juices, Wiley-Blackwell, 3rd edn, 2016 Search PubMed.
- L. J. M. Rao and K. Ramalakshmi, Recent Trends in Soft Beverages, Woodhead Publishing India, 2011 Search PubMed.
- S. Chattopadhyay, U. Raychaudhuri and R. Chakraborty, Artificial sweeteners – a review, J. Food Sci. Technol., 2014, 51, 611 CrossRef CAS.
- Food Labelling for Consumers EU Law, Regulation and Policy Options, Policy Department for Citizens’ Rights and Constitutional Affairs Directorate General for Internal Policies of the Union PE 608.871 – April 2019.
Footnote |
| † Electronic supplementary information (ESI) available: NMR data; interactions between phenylboronic acid and Fc-1,3-diol; affinity of phenylboronic systems to Fc-1,3-diol and glucose. See DOI: 10.1039/d0dt03776a |
| This journal is © The Royal Society of Chemistry 2021 |