 Open Access Article
Creative Commons Attribution 3.0 Unported Licence
Covalency in AnCl3 (An = Th–No)†
Sophie
Cooper
 and
Nikolas
Kaltsoyannis
 *
*
Department of Chemistry, School of Natural Sciences, The University of Manchester, Oxford Road, Manchester, M13 9PL, UK. E-mail: nikolas.kaltsoyannis@manchester.ac.uk
First published on 8th January 2021
Abstract
The geometric and electronic structures of AnCl3 are studied computationally using scalar relativistic, hybrid density functional theory (PBE0). The An–Cl bond lengths generally decrease across the 5f series, although there is a slight lengthening from Fm–Cl to No–Cl as the metal ions display increasing M(II) character. Covalency in the An–Cl bond is studied using a wide range of metrics drawn from the Natural Bond Orbital, Natural Resonance Theory and Quantum Theory of Atoms-in-Molecules (QTAIM) methods, including bond order, orbital composition, orbital overlap and electron density topology data. Most metrics agree that the later An–Cl bonds are less ionic than might be anticipated on the basis of trends in the first half of the series, due to energy degeneracy-driven covalency in the β spin manifold; for example, the An–Cl QTAIM delocalisation index (bond order) for MdCl3 (0.88) is almost exactly the same as for NpCl3 (0.89). By contrast, the ratio of the kinetic to potential energy densities at the An–Cl bond critical points indicates that ionicity increases across the series, suggesting that the delocalisation index measures both orbital overlap and energy degeneracy-based covalency, while the bond critical point metric gauges only the former. Recalculation of all the data using the generalised gradient approximation PBE functional finds larger energy degeneracy-driven covalency in the later actinides than using hybrid DFT. Hence, we find that conclusions concerning the covalency of the An–Cl bond are dependent not only on the metric used to evaluate it, but also on the underlying electronic structure method.
Introduction
A succinct summary of the chemical behaviour of the actinide elements might be that while the early members of the series display properties characteristic of the d transition elements (e.g. variable oxidation state, some degree of covalent bonding) the later actinides are lanthanide like, with a dominant trivalent oxidation state and ionic bonding. For a long time, the second part of this statement was moot, as the radioactivity and scarcity of the later actinides precluded experimental study. However, thanks to the heroic recent efforts of a number of researchers,1–5 we are now beginning to explore the chemistry of the later actinides, including the nature of the metal–ligand bonding.6–9An interesting subtlety of the bonding in the actinide series concerns the nature of any covalent bonding present. In the early part of the series, the 5f orbitals are relatively diffuse, and can overlap spatially with the valence orbitals of ligating atoms. As the series is crossed, the 5f orbitals stabilise and contract, reducing spatial overlap with the ligands. The stabilisation can bring the 5f orbitals into closer energy proximity with ligand orbitals, however, which can result in significant metal/ligand atomic orbital mixing in molecular orbitals, without there being significant spatial overlap. One can therefore distinguish between two forms of covalency; orbital overlap driven and orbital energy driven, and unpicking the relative roles of these effects can be challenging.10–17 Experimental techniques to measure covalency in actinide–ligand bonds include electron paramagnetic resonance spectroscopy, photoelectron spectroscopy and X-ray absorption spectroscopy.18–20 These methods provide metal and ligand orbital contributions to bonding, but differentiating the type of covalency as overlap-driven or degeneracy-driven is not possible with these approaches. Thus, computational tools have a crucial role to play in assessing and classifying bonding interactions in the actinide series.
In this contribution, we use computational quantum chemistry to study the bonding in AnCl3, surveying the actinide series from Th to No. Very little is known about these systems experimentally (the geometry of UCl3 is an exception21), although Kovács et al. have studied them computationally,22,23 and there have been other investigations of actinide halides. In 2013, Kovács et al. used density functional theory (DFT) to study the geometries and vibrational frequencies of AnCl3 (An = Th–Cm), and CASPT2 calculations to examine their ground and low-lying excited states,22 and used solely DFT to study the later AnCl3 (An = Bk–Lr) the following year.23 Here we also use DFT to study AnCl3 (An = Th–No), focusing on Natural Bond Orbital (NBO) and Quantum Theory of Atoms in Molecules (QTAIM) analysis of metal–chlorine covalency. These tools have been extensively employed by us13,14,24–30 and others,31–35 in the 5f series, especially to probe covalency. We here use these approaches to assess the relative roles of overlap-driven and degeneracy-driven covalency in the An–Cl bond, separating this analysis further into the σ and π type interactions in the α and β spin manifolds. As may be expected, the answer to the question “are the later actinides more or less covalent than their earlier congeners?” is rather subtle.
Computational details
Density functional theory was employed throughout this study using the Gaussian 16 software package, revision A.03.36 The PBE0 hybrid functional37 was used, with comparative PBE38 calculations, as discussed in the main text. For all geometry optimizations the actinide metals were treated with relativistic effective core potentials (ECPs) developed by the Stuttgart-Dresden group,39 in conjunction with the associated segmented contracted valence basis sets. For geometry optimisations, both large and small core relativistic ECPs were used. Large cores restrict all bar 10 electrons to the core; any electron with principal quantum number greater than 5 is treated explicitly, while for small cores 60 electrons are treated as core, with any electron with principal quantum number greater than 4 being explicitly considered. Chlorine atoms were treated with the cc-pVDZ basis set.40 The SCF = XQC keyword was applied for all molecules, along with the superfine integration grid and opt = verytight, with the exception of FmCl3 which used opt = tight, due to difficulties with convergence with opt = verytight. Harmonic vibrational frequencies were calculated to ensure the optimised geometries were true energetic minima. Spin–orbit coupling has not been included.Single point all-electron calculations were performed at the small-core ECP optimised geometries using the DKH2 Hamiltonian and SARC basis sets designed by Schuchardt et al.,41 with the addition of extra g polarization functions designed by Pantazis and Neese.42 As with the ECP calculations, the chlorine atoms were treated with the cc-pVDZ basis set and the keyword SCF = XQC was included. As shown in Table SI1 in the ESI,† spin contamination was minimal, with AmCl3 having the largest difference (0.034) between the calculated and formal values of 〈S2〉 at the PBE0 all electron level. Table SI1† also collects the 5f electronic configurations, electronic states and point groups.
Quantum Theory of Atoms-in-Molecules calculations were performed using the AIMALL 17.11.14 software package,43 with the standard integration method and basin quadrature, on .wfx files generated from the all electron single point calculations. Natural Population Analysis, Natural Bond Orbital and Natural Resonance Theory calculations were also performed on the all electron single point electronic structures, using the NBO7 package.44 For NBO analysis the CHOOSE option was used to define all the metal–chlorine bonds as double bonds, as explained the main text. Fig. 10 was produced using Chemcraft 1.8, with an isovalue of 0.04 for the orbitals.
Results and discussion
The geometries of AnCl3 (An = Th–No) have been optimized using the PBE0 functional in conjunction with both small and large core ECPs and associated basis sets. Across the 5f series the lowest energy large core ECP optimised geometries are all trigonal pyramidal. This is also true for the small core optimised geometries for all cases bar ThCl3 and NoCl3, which are trigonal planar. As discussed in the Introduction, AnCl3 (An = Th–Lr) have been computationally studied previously by Kovács et al. in 2013 and 2014;22,23 at the B3LYP level, they find ThCl3 to be trigonal planar and AnCl3 (An = Pa–No) to be trigonal pyramidal.Our An–Cl bond length data are presented in Table SI2† and in Fig. 1. The large core values decrease monotonically across the actinide series, with a Th–No contraction of 0.176 Å. Also shown is the trend in Shannon's 6 co-ordinate An(III) ionic radii (An = Pa–Cf),45 which matches the change in the large core An–Cl distances well. The small core bond lengths also, in general, decrease across the series from Th–Fm, albeit at a smaller rate than their large core counterparts. Until the very end of the series, the small core bond lengths are smaller than the large core but, after Fm, there is an increase in the small core An–Cl distances, with a marked jump for NoCl3 such that it is larger than its large core equivalent. This is likely due to the lure of the full 5f shell; natural population analysis (NPA, Table SI3†) of small core NoCl3, formally 5f13, reveals a 5f population of 13.62.
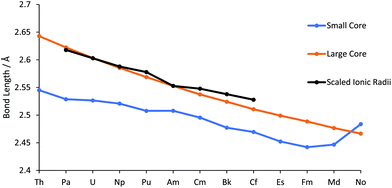 | ||
| Fig. 1 An–Cl bond lengths in AnCl3, calculated with the small and large core ECPs. Also shown are the 6 co-ordinate An(III) radii,45 normalised to the large core Am–Cl bond length with a scaling factor of 1.58. | ||
Good agreement is found between our data and Kovács et al.'s B3LYP/small core ECP An–Cl bond lengths, with a mean absolute deviation of 0.028 Å and maximum difference of −0.043 Å for the small core, and 0.031 Å and −0.074 Å for the large core. Across the series, our PBE0 bond lengths are consistently shorter than those predicted by Kovács et al., e.g. for UCl3 we find 2.527 Å vs. 2.567 Å for B3LYP (Table SI2†). UCl3 is the only AnCl3 for which there is an experimental bond length; 2.549 Å.21 As with our small core data, Kovács et al. find that MdCl3 and NoCl3 have longer bond lengths than the preceding chlorides, attributed in part to enhanced 5f populations.
We now turn to the results of our NBO calculations, performed on the all-electron electronic structures at the small core ECP geometries. The default NBO options produced a rather varied picture across the series. ThCl3 and PaCl3 had triple bonds between the An and chlorine. By contrast, double bonds were found for UCl3 and NpCl3, while for PuCl3 and AmCl3 double bonds were found in the α manifold and single in the β. For CmCl3 and BkCl3 single An–Cl bonds were found, but CfCl3 onwards had a single α spin An–Cl bond, but a double β. Thus to facilitate a consistent comparison across the period, double bonds were imposed via the CHOOSE option, leading to all molecules having a σ type NBO and a π type NBO for both the α and β orbitals.‡ Note that in all cases these NBOs are heavily localised on the chlorine atoms; An contributions range from 8.8–12.8% for the σ type NBO and 5.7–8.5% for the π type NBO. Fig. 2 plots the metal contribution to the An–Cl NBOs, averaged across α and β, and σ and π, and the data are also collected in Table SI4.† There is a gradual decrease towards the centre of the series, and a plateau from Cm–Md, with AmCl3 and CfCl3 lying slightly below these trends due to modest decreases in metal content to two of the four contributing orbitals (σ α and σ β). This is discussed further on page 5 of the ESI.†
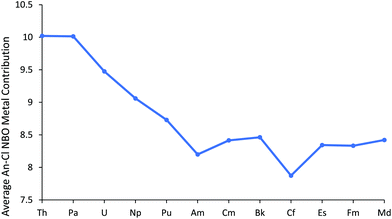 | ||
| Fig. 2 Average metal contribution (%) to the metal–chlorine NBOs in AnCl3. NoCl3 is omitted as it did not converge on σ type + π type NBOs for all three An–Cl bonds. | ||
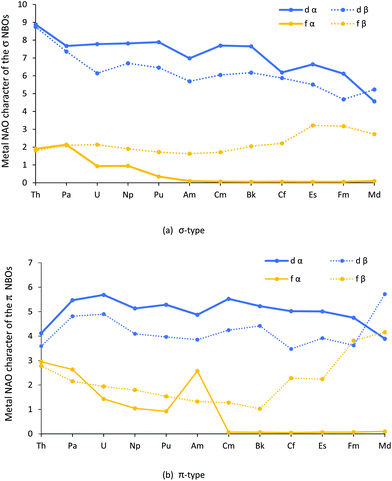
The contribution (%) of each metal natural atomic orbital (NAO) to each An–Cl α and β spin NBO was calculated by multiplying the NBO occupancy by its total percent metal contribution and dividing by 100, then multiplying this value by the percent contribution from a given metal NAO. The results for the metal d and f orbitals are shown in Fig. 3a and b, and collected in Tables SI5–8.†
Turning first to Fig. 3a, it can be seen that the metal d contribution to the σ type orbitals is larger than the f, and that both the d and f contributions generally decrease across the series; the f α contribution, modest to start with, becomes almost zero by AmCl3, and remains so from then on. The exception to the general decrease is the f β contribution, which is little changed from Th to Cm before rising towards the end of the series. As with the σ type, the d contributions to the π type orbitals, seen in Fig. 3b, are generally larger than the f and, broadly speaking, are constant across the series. The fall off in f α contribution is similar to that for the σ type, bar a jump at Am. By contrast, the f β contribution decreases from Th–Bk before increasing significantly towards the end of the series; it is striking that the f β contribution rises for the later AnCl3 for both types of orbitals. We return to these features later in the paper.
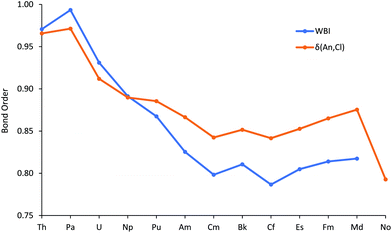
Fig. 4 plots the An–Cl Wiberg Bond Index (WBI), an NBO measure of bond order, and the data are also collected in Table SI9.† These fall from just below 1 at the start of the series to about 0.8 at Cm, then are little changed to the end of the series, a trend rather similar to the average metal contribution to the NBOs (Fig. 2).
To further explore the An–Cl bond order, and in particular to gauge the relative roles of covalent vs. ionic bonding, we performed a Natural Resonance Theory (NRT) analysis. NRT analyses molecular electronic structure in terms of resonance structures and their weights, including bond orders and their breakdown into covalent and ionic contributions.46,47 This breakdown is plotted, separately for α and β spins, in Fig. 5, as the ionic/covalent ratio (the data for the separate components are collected in Table SI10†). All the ratios are >1, highlighting that the An–Cl bonds are primarily ionic in nature. For most of the series, the ratio for the α manifold is a little smaller than for the β, but there is a significant change in behaviour for the later actinides, with the α ratio increasing significantly and the β decreasing by an approximately similar amount, indicating greater ionicity in the α manifold but larger covalency in the β. This divergence of α/β behaviour is reminiscent of that in the f atomic orbital contributions to the σ and π type NBOs shown in Fig. 3a and b.
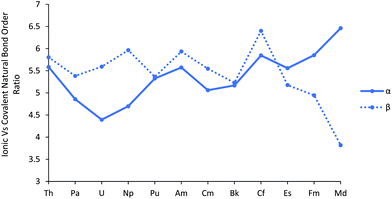 | ||
| Fig. 5 The ratio of the ionic to covalent contributions to the α and β natural bond order in AnCl3. NoCl3 is excluded, as it did not converge on a resonance structure for the β orbitals. | ||
The QTAIM has been extensively used, by us and others, to study the bonding in actinide molecules.31–35 A wide range of metrics has been employed, including both critical point properties and so-called integrated properties, which are not evaluated at a single point in space, but between atomic basins. Recently, we reported QTAIM analysis of the M–O bonding in M(OC6H5)4 (M = Ti, Zr, Hf, Ce, Th, Pa, U and Np),29,30 with focus on, amongst other metrics, the metal–oxygen delocalisation index (a QTAIM measure of bond order, an integrated property) and the ratio of the kinetic to potential energy densities at the metal–oxygen bond critical point (−G/V)BCP. The An–Cl delocalisation indices δ(An,Cl) are shown in Fig. 4, alongside the WBIs, and are collected in Table SI9.† Despite being calculated in rather different ways, the two bond order metrics are similar to one another, both in absolute values and in trend (R2 = 0.950 for correlation of WBI with δ(An,Cl)) for Th–Md. The marked decrease at No is probably a reflection of its longer metal–chlorine distances. As with WBI and the average metal contribution to the NBOs, δ(An,Cl) initially decreases before plateauing for the middle-late actinides, with a slight rise to Md. This recurring theme suggests that the trend of decreasing An–Cl covalency in the first half of the actinide series is arrested for the heavier 5f elements.
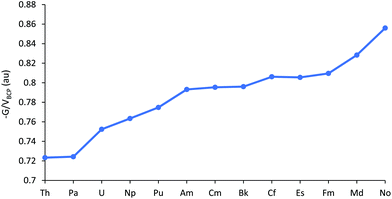
(−G/V)BCP at the An–Cl bond critical points are plotted in Fig. 6, and tabulated in Table SI9.† Values >1 indicate ionic bonding, in which the local kinetic energy dominates the potential, while values between 0.5 and 1 suggest partial covalency;48 AnCl3 fall into this latter category by this metric. As with the other data considered thus far, (−G/V)BCP suggests decreasing covalency for the first part of the 5f series. This trend is then paused between Am–Bk, before increasing again towards the end of the series, i.e. the behaviour of (−G/V)BCP for the later actinides is a little different from the other metrics considered.
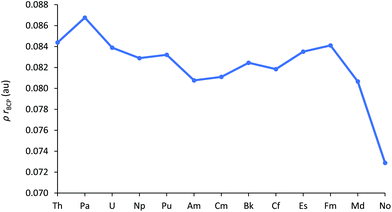
A widely used QTAIM metric is ρBCP, the electron density at the bond critical point. Values in excess of 0.2 au are typical of covalent bonds, whereas those under 0.1 au indicate more ionic bonding.49 The An–Cl ρBCP data are shown in Fig. 7 (and collected in Table SI9†), and evidence the largely ionic bonding in AnCl3. Ionicity increases towards the middle of the series but, once again, this trend is then arrested for the later 5f elements; there is a gradual rise from Am to Fm then a pronounced decrease for Md and No, a reflection of their greater An–Cl bond lengths.
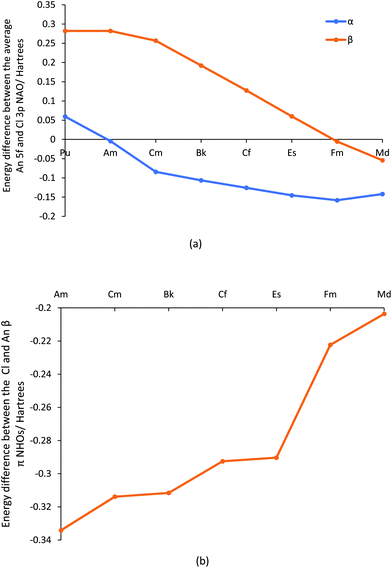
Overall, the metrics presented suggest that the initial trend to decreased bond order and covalency in the first part of the actinide series changes in the second half, with a general levelling off and even a small rise in some data. In our previous studies of AnCp3 and AnCp4 (Cp = η5-C5H5),3,14 we saw how the metals’ 5f α orbitals stabilise across the first half of the actinide series, coming into close energy match with the highest lying Cp orbitals by the centre of the series and producing Kohn–Sham orbitals which feature large contributions from both metal and ligand but with small spatial overlap. We therefore wondered if the present behaviour of the later AnCl3 is due to a similar effect, and have examined the energies of the metal 5f and chlorine 3p natural atomic orbitals. The energy differences between these are plotted in Fig. 8a, and collected in Table SI11,† from which it can be seen that the α spin Am 5f/Cl 3p NAOs are essentially degenerate (energy difference = 0.0043 H, 0.12 eV, 11.3 kJ mol−1), and that the later actinide β spin 5f/3p NAO energy difference becomes gradually smaller, minimising at 0.0054 H (0.15 eV, 14.2 kJ mol−1) for Fm. It is noticeable that in Fig. 3b there is a peak in the f α character of the π-type NBOs at Am, and a rise in f β character towards the end of the series.
NBOs are not formed directly from NAOs, but rather from Natural Hybrid Orbitals (NHOs) which are themselves formed from the NAOs. The energy differences between the later actinide and chlorine NHOs that form the β spin π-type NBOs are plotted in Fig. 8b, and reveal a gradual and significant reduction from Am to Md. This trend is very similar to that shown in Fig. 3b for the f contribution to the β spin π type NBOs; indeed, across the whole actinide series the two datasets are correlated with R2 = 0.931, rising to 0.998 when focusing solely on the elements Cf–Md. Note that the major component of the actinide NHOs are d NAOs (with an average of 66.2% of d character vs. 17.4% f character), and hence the actinide NHOs are higher in energy than the chloride NHOs in all cases. This is why the NHO energy difference in Fig. 8b remains significant, even at Md. However, it is the f contribution to the metal NHO which drives the metal/Cl NHO energy difference.
In addition to their energies, we have also analysed the overlap of the NHOs, and these are shown in Fig. 9 (and reported in Table SI12†). There is a clear difference between the σ and π NHO overlaps; the former are either approximately constant across the series (α spin) or decrease gently (β spin), whereas while both the α and β spin π orbital overlaps behave similarly in the first half of the series, decreasing more sharply than the σ, they diverge significantly in the later actinides. π α overlap recovers, whereas π β continues to decrease. We attribute this α/β difference in late An π overlaps to the composition of the metal-based NHOs, which are very 6d NAO-based for the α spin, but which feature more 5f character in the β orbitals. The 6d orbitals are, of course, less radially contracted than the 5f, especially towards the end of the series. Notably, the difference between the σ and π overlaps in the β manifold maximises at FmCl3.
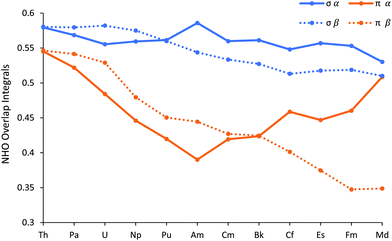 | ||
| Fig. 9 The overlap of the metal and chlorine Natural Hybrid Orbitals in AnCl3 (An = Th–Md). NoCl3 is omitted as it did not converge on σ type + π type NBO for all three An–Cl bonds. | ||
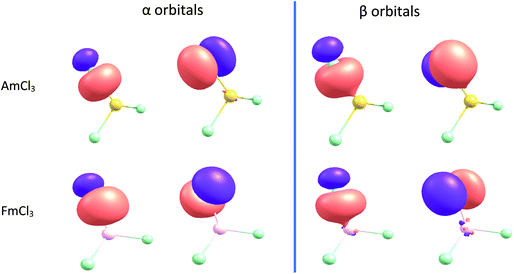
NBOs of AmCl3 and FmCl3 are shown in Fig. 10. The π α orbital of the former and the π β of the latter show energy degeneracy-driven covalency; as noted above, the 5f/Cl 3p NAO energy difference is very small in both cases, and the NHO overlaps are also small. The σ β NBO of FmCl3 has significantly better NHO overlap than the π, and the orbital image indeed suggests some overlap-driven covalency. There is also a hint of Am–Cl spatial overlap in the σ β NBO.
To examine the effects of density functional on our conclusions, we have repeated our calculations using the PBE functional, and the PBE equivalents of the PBE0 data tables are collected in Tables SI13–SI23.† We will not repeat all of the above discussion at the PBE level, but instead focus on some key comparative points. Fig. SI2† is the PBE equivalent of Fig. 2, plotting the metal contribution to the An–Cl NBOs, averaged across α and β, and σ and π. The values are all larger for PBE than PBE0, and the difference between the later and early actinides is smaller. This ties in with the energy difference between the An 5f and Cl 3p β NAOs being significantly smaller for the later AnCl3 at the PBE level than PBE0, and the β NHO energy gaps are also smaller. Furthermore, the PBE NHO overlaps behave differently from the PBE0; specifically, there is a much more pronounced decrease in the σ β overlaps than shown for PBE0 in Fig. 9 (Table SI23†). Thus, at the PBE level there is evidence for larger energy degeneracy-driven covalency in the β spin manifolds of the later AnCl3. This is reflected in the QTAIM delocalisation indices (Fig. SI3†) which are larger for all AnCl3 at the PBE level vs. PBE0, but particularly so for the later part of the series.
Fig. SI4† plots the PBE values of the (−G/V)BCP QTAIM metric. As with the PBE0 (Fig. 6, and reproduced in Fig. SI4†) these data suggest that the An–Cl bond becomes consistently less covalent across the series; there is no halting, or even reversing, of this trend for the later An as shown in many of the other covalency metrics. The reduction in kinetic energy which accompanies overlap-driven covalency requires spatial delocalisation of electrons, suggesting that (−G/V)BCP will not reflect energy degeneracy-driven covalency. Interestingly, the PBE values of (−G/V)BCP are larger for the later AnCl3 than the PBE0 suggesting that, by this metric, the later PBE An–Cl bonds are less covalent than at the hybrid DFT level. This may well be why, up to CfCl3, the PBE An–Cl bond lengths are very similar to the PBE0, but there are larger differences towards the end of the 5f series, with the PBE bond lengths being longer (Fig. SI5†).
Conclusions
We began with the generally accepted wisdom that the later actinides are less covalent than their earlier congeners, but does the wide range of hybrid DFT-based data presented here support this? Certainly, the An–Cl QTAIM delocalisation indices and NBO Wiberg bond indices indicate a general decrease in bond order through the first half of the 5f series, but then level off and even show a small rise to Md. Analysis of the α and β spin manifolds using Natural Resonance Theory indicates that the ratio of covalent to ionic bond order in the two manifolds is significantly different for the later actinides, with the α bonds becoming increasingly ionic but the β set more covalent. The overlaps of the metal and Cl β spin σ and π natural hybrid orbitals decrease across the 5f series, more rapidly for the π than the σ. Simultaneously, the difference in energy between the β spin later actinide 5f and Cl 3p natural atomic orbitals decreases, as does that between the β spin actinide and Cl natural hybrid orbitals. Hence, we see energy degeneracy-driven covalency in the β spin manifold of the later AnCl3, nicely illustrated by the β π NBO of FmCl3 in Fig. 10. Note, however, that because the overlap of the σ natural hybrids is much larger than that of the π, this molecule also shows some overlap-driven covalency in the σ β NBO, i.e. we find evidence for different types of covalency in different orbitals of the same molecule.The (−G/V)BCP QTAIM metric differs from the other metrics considered in predicting a gradual decrease in covalency across the 5f series, which we attribute to it assessing only overlap-driven covalency. By contrast, the QTAIM delocalisation (bond order) index for Md–Cl (0.88) is essentially the same as for Np–Cl and Pu–Cl (0.89), suggesting that this metric picks up both overlap-driven and energy degeneracy-driven covalency.
Recalculation of all our data using the generalised gradient approximation PBE functional finds larger energy degeneracy-driven covalency in the later actinides than using hybrid DFT, as a result both of smaller An/Cl orbital energy gaps and smaller NHO overlaps.
One of the more interesting aspects of the recent forays into the experimental chemistry of the later actinides has been the intriguing suggestion that the divalent state may be favoured for, especially, californium.6 Building on the work presented in the present contribution, we are currently exploring covalency in AnCl2, and the stability of the dichlorides vs. the trichlorides. This work will be reported in a forthcoming paper.
Conflicts of interest
There are no conflicts to declare.Acknowledgements
We are grateful to The University of Manchester for a PhD studentship to SC, and to its Computational Shared Facility and associated support services.References
- L. J. Nugent, J. Inorg. Nucl. Chem., 1975, 37, 1767–1770 CrossRef CAS.
- J. Diwu, D. J. Grant, S. Wang, L. Gagliardi and T. E. Albrecht-Schmitt, Inorg. Chem., 2012, 51, 6906–6915 CrossRef CAS.
- S. Heathman, T. Le Bihan, S. Yagoubi, B. Johansson and R. Ahuja, Phys. Rev. B: Condens. Matter Mater. Phys., 2013, 87, 1–8 CrossRef.
- P. D. Dau, D. K. Shuh, M. Sturzbecher-Hoehne, R. J. Abergel and J. K. Gibson, Dalton Trans., 2016, 45, 12338–12345 RSC.
- M. L. Marsh, F. D. White, D. S. Meeker, C. D. McKinley, D. Dan, C. Van Alstine, T. N. Poe, D. L. Gray, D. E. Hobart and T. E. Albrecht-Schmitt, Inorg. Chem., 2019, 58, 9602–9612 CrossRef CAS.
- M. J. Polinski, E. B. Garner, R. Maurice, N. Planas, J. T. Stritzinger, T. G. Parker, J. N. Cross, T. D. Green, E. V. Alekseev, S. M. Van Cleve, W. Depmeier, L. Gagliardi, M. Shatruk, K. L. Knappenberger, G. Liu, S. Skanthakumar, L. Soderholm, D. A. Dixon and T. E. Albrecht-Schmitt, Nat. Chem., 2014, 6, 387–392 CrossRef CAS.
- S. K. Cary, M. Vasiliu, R. E. Baumbach, J. T. Stritzinger, T. D. Green, K. Diefenbach, J. N. Cross, K. L. Knappenberger, G. Liu, M. A. Silver, A. E. Deprince, M. J. Polinski, S. M. Van Cleve, J. H. House, N. Kikugawa, A. Gallagher, A. A. Arico, D. A. Dixon and T. E. Albrecht-Schmitt, Nat. Commun., 2015, 6, 1–8 Search PubMed.
- M. A. Silver, S. K. Cary, J. A. Johnson, R. E. Baumbach, A. A. Arico, M. Luckey, M. Urban, J. C. Wang, M. J. Polinski, A. Chemey, G. Liu, K. W. Chen, S. M. Van Cleve, M. L. Marsh, T. M. Eaton, L. J. Van De Burgt, A. L. Gray, D. E. Hobart, K. Hanson, L. Maron, F. Gendron, J. Autschbach, M. Speldrich, P. Kögerler, P. Yang, J. Braley and T. E. Albrecht-Schmitt, Science, 2016, 353, 888 CrossRef CAS.
- M. P. Kelley, N. P. Bessen, J. Su, M. Urban, S. I. Sinkov, G. J. Lumetta, E. R. Batista, P. Yang and J. C. Shafer, Chem. Commun., 2018, 54, 10578–10581 RSC.
- M. L. Neidig, D. L. Clark and R. L. Martin, Coord. Chem. Rev., 2013, 257, 394–406 CrossRef CAS.
- B. Sadhu and M. Dolg, Inorg. Chem., 2019, 58, 9738–9748 CrossRef CAS.
- J. Tanti, M. Lincoln and A. Kerridge, Inorganics, 2018, 6, 88 CrossRef.
- M. J. Tassell and N. Kaltsoyannis, Dalton Trans., 2010, 39, 6719–6725 RSC.
- I. Kirker and N. Kaltsoyannis, Dalton Trans., 2011, 40, 124–131 RSC.
- J. Su, E. R. Batista, K. S. Boland, S. E. Bone, J. A. Bradley, S. K. Cary, D. L. Clark, S. D. Conradson, A. S. Ditter, N. Kaltsoyannis, J. M. Keith, A. Kerridge, S. A. Kozimor, M. W. Löble, R. L. Martin, S. G. Minasian, V. Mocko, H. S. La Pierre, G. T. Seidler, D. K. Shuh, M. P. Wilkerson, L. E. Wolfsberg and P. Yang, J. Am. Chem. Soc., 2018, 140, 17977–17984 CrossRef CAS.
- N. Kaltsoyannis, Inorg. Chem., 2013, 52, 3407–3413 CrossRef CAS.
- M. P. Kelley, J. Su, M. Urban, M. Luckey, E. R. Batista, P. Yang and J. C. Shafer, J. Am. Chem. Soc., 2017, 139, 9901–9908 CrossRef CAS.
- T. Glaser, B. Hedman, K. O. Hodgson and E. I. Solomon, Acc. Chem. Res., 2000, 33, 859–868 CrossRef.
- S. G. Minasian, J. M. Keith, E. R. Batista, K. S. Boland, D. L. Clark, S. A. Kozimor, R. L. Martin, D. K. Shuh and T. Tyliszczak, Chem. Sci., 2014, 5, 351–359 RSC.
- A. Formanuik, A. M. Ariciu, F. Ortu, R. Beekmeyer, A. Kerridge, F. Tuna, E. J. McInnes and D. P. Mills, Nat. Chem., 2017, 9, 578–583 CrossRef CAS.
- V. Bazhanov, Y. Ezhov and S. Komarov, J. Struct. Chem., 1990, 31, 986–987 CrossRef.
- A. Kovács, R. J. Konings, Z. Varga and D. Szieberth, J. Phys. Chem. A, 2013, 117, 11357–11363 CrossRef.
- A. Kovács, R. J. Konings, D. Szieberth and B. Krámos, Struct. Chem., 2014, 25, 991–996 CrossRef.
- D. E. Smiles, G. Wu, N. Kaltsoyannis and T. W. Hayton, Chem. Sci., 2015, 6, 3891–3899 RSC.
- P. L. Arnold, A. Prescimone, J. H. Farnaby, S. M. Mansell, S. Parsons and N. Kaltsoyannis, Angew. Chem., Int. Ed., 2015, 54, 6735–6739 CrossRef CAS.
- M. S. Dutkiewicz, J. H. Farnaby, C. Apostolidis, E. Colineau, O. Walter, N. Magnani, M. G. Gardiner, J. B. Love, N. Kaltsoyannis, R. Caciuffo and P. L. Arnold, Nat. Chem., 2016, 8, 797–802 CrossRef CAS.
- S. S. Galley, A. A. Arico, T.-H. Lee, X. Deng, Y.-X. Yao, J. M. Sperling, V. Proust, J. S. Storbeck, V. Dobrosavljevic, J. N. Neu, T. Siegrist, R. E. Baumbach, T. E. Albrecht-Schmitt, N. Kaltsoyannis and N. Lanatà, J. Am. Chem. Soc., 2018, 140, 1674–1685 CrossRef CAS.
- E. Lu, S. Sajjad, V. E. Berryman, A. J. Wooles, N. Kaltsoyannis and S. T. Liddle, Nat. Commun., 2019, 10, 1–10 CrossRef.
- V. E. Berryman, Z. J. Whalley, J. J. Shephard, T. Ochiai, A. N. Price, P. L. Arnold, S. Parsons and N. Kaltsoyannis, Dalton Trans., 2019, 48, 2939–2947 RSC.
- V. E. J. Berryman, J. J. Shephard, T. Ochiai, A. N. Price, P. L. Arnold, S. Parsons and N. Kaltsoyannis, Phys. Chem. Chem. Phys., 2020, 22, 16804–16812 RSC.
- A. Kerridge, RSC Adv., 2014, 4, 12078–12086 RSC.
- C.-Y. Wang, C. Cheng, J. Su and P. Huai, Mol. Phys., 2015, 113, 3450–3458 CrossRef CAS.
- Q. R. Huang, J. R. Kingham and N. Kaltsoyannis, Dalton Trans., 2015, 44, 2554–2566 RSC.
- R. Beekmeyer and A. Kerridge, Inorganics, 2015, 3, 482–499 CrossRef CAS.
- J. A. Platts and R. J. Baker, Dalton Trans., 2020, 49, 1077–1088 RSC.
- C. Adamo and V. Barone, J. Chem. Phys., 1999, 110, 6158–6170 CrossRef CAS.
- M. J. Frisch, G. W. Trucks, H. B. Schlegel, G. E. Scuseria, M. A. Robb, J. R. Cheeseman, G. Scalmani, V. Barone, G. A. Petersson, H. Nakat-suji, X. Li, M. Caricato, A. V. Marenich, J. Bloino, B. G. Janesko, R. Gomperts, B. Mennucci, H. P. Hratchian, J. V. Ortiz, A. F. Izmaylov, J. L. Sonnenberg, D. Williams-Young, F. Ding, F. Lipparini, F. Egidi, J. Goings, B. Peng, A. Petrone, T. Henderson, D. Ranasinghe, V. G. Zakrzewski, J. Gao, N. Rega, G. Zheng, W. Liang, M. Hada, M. Ehara, K. Toyota, R. Fukuda, J. Hasegawa, M. Ishida, T. Nakajima, Y. Honda, O. Kitao, H. Nakai, T. Vreven, K. Throssell, J. A. Montgomery Jr., J. E. Peralta, F. Ogliaro, M. J. Bearpark, J. J. Heyd, E. N. Brothers, K. N. Kudin, V. N. Staroverov, T. A. Keith, R. Kobayashi, J. Normand, K. Raghavachari, A. P. Rendell, J. C. Burant, S. S. Iyengar, J. Tomasi, M. Cossi, J. M. Millam, M. Klene, C. Adamo, R. Cammi, J. W. Ochter-ski, R. L. Martin, K. Morokuma, O. Farkas, J. B. Foresman and D. J. Fox, Gaussian 16 Revision A.03, Gaussian Inc., Wallingford CT, 2016 Search PubMed.
- J. P. Perdew, K. Burke and M. Ernzerhof, Phys. Rev. Lett., 1996, 77, 3865–3868 CrossRef CAS.
- X. Cao, M. Dolg and H. Stoll, J. Chem. Phys., 2003, 118, 487–496 CrossRef CAS.
- T. H. Dunning, J. Chem. Phys., 1989, 90, 1007–1023 CrossRef CAS.
- K. L. Schuchardt, B. T. Didier, T. Elsethagen, L. Sun, V. Gurumoorthi, J. Chase, J. Li and T. L. Windus, J. Chem. Inf. Model., 2007, 47, 1045–1052 CrossRef CAS.
- D. A. Pantazis and F. Neese, J. Chem. Theory Comput., 2011, 7, 677–684 CrossRef CAS.
- T. A. Keith, TK Gristmill Software, Overland Park KS, USA, 2019 Search PubMed.
- E. D. Glendening, J. K. Badenhoop, A. E. Reed, J. E. Carpenter, J. A. Bohmann, C. M. Morales, P. Karafiloglou, C. R. Landis and F. Weinhold, NBO 7.0, Theoretical Chemistry Institute, University of Wisconsin, Madison, WI, 2018 Search PubMed.
- R. D. Shannon, Acta Crystallogr., Sect. A: Cryst. Phys., Diffr., Theor. Gen. Crystallogr., 1976, 32, 751 CrossRef.
- E. Glendening and F. Weinhold, J. Comput. Chem., 1998, 19, 593–609 CrossRef CAS.
- E. D. Glendening and F. Weinhold, J. Comput. Chem., 1998, 19, 610–627 CrossRef CAS.
- M. Ziółkowski, S. J. Grabowski and J. Leszczynski, J. Phys. Chem. A, 2006, 110, 6514–6521 CrossRef.
- A. Kerridge, Chem. Commun., 2017, 53, 6685–6695 RSC.
Footnotes |
| † Electronic supplementary information (ESI) available. See DOI: 10.1039/d0dt03699d |
| ‡ The only exception to this was NoCl3, which converged with two No–Cl represented by just one σ NBO for both the α and β spin orbitals and the third represented by one σ α spin NBO and a σ and π β spin NBO, i.e. two single bonds and one partial double bond. |
| This journal is © The Royal Society of Chemistry 2021 |

