
 Open Access Article
 This Open Access Article is licensed under a
 Creative Commons Attribution 3.0 Unported Licence
Selectivity of the Lindlar catalyst in alkyne semi-hydrogenation: a direct liquid-phase adsorption study†
Nikolay
Cherkasov
 *ab,
Dmitry Yu.
Murzin
c,
C. Richard A.
Catlow
de and
Arunabhiram
Chutia
f
*ab,
Dmitry Yu.
Murzin
c,
C. Richard A.
Catlow
de and
Arunabhiram
Chutia
f
aSchool of Engineering, University of Warwick, Coventry, CV4 7AL, UK. E-mail: n.cherkasov@warwick.ac.uk
bStoli Catalysts Ltd, Wellesbourne Campus, Wellesbourne, Coventry, CV35 9EF, UK
cLaboratory of Industrial Chemistry and Reaction Engineering, Process Chemistry Centre, Åbo Akademi University, FI-20500, Turku/Åbo, Finland
dSchool of Chemistry, Cardiff University, Main Building, Park Place, Cardiff, Wales, UK
eDepartment of Chemistry, University College London, 20 Gordon Street, London, WC1 HOAJ, UK
fSchool of Chemistry, University of Lincoln, Brayford Pool, Lincoln, LN6 7TS, UK
First published on 16th July 2021
Abstract
We study the alkyne semi-hydrogenation selectivity over Pd and Lindlar catalyst with liquid phase adsorption. The results indicate that there are strongly-adsorbing alkyne and alkene sites; alkenes react non-selectively over the alkene adsorption sites. DFT studies indicate that the non-selective sites are low-coordination Pd atoms in the nanoparticles.
Introduction
Selectivity is a cornerstone problem of chemistry, a determining factor for economic and environmental performance. Selective processes generate few by-products, require no separation, and use natural resources sustainably; yet fully selective processes are exceedingly rare. Semi-hydrogenation (a reaction where several hydrogenations are possible and only one is desired) exemplifies a reaction where selectivity could be improved.1–4 Alkyne semi-hydrogenation is used in both polymer and fine chemical industries. Gas-phase semi-hydrogenation removes ethyne from ethene to prevent poisoning of the Ziegler–Natta polymerisation catalysts.5 Liquid-phase semi-hydrogenation of alkyne to alkene is the key step in the synthesis of vitamins A and E.1,6Commercial catalysts for alkyne semi-hydrogenation are based on Pd. Gas-phase ethyne semi-hydrogenation is carried out industrially using a Pd–Ag alloy catalyst.5,7,8 Liquid-phase semi-hydrogenation is performed using a Lindlar catalyst, Pd poisoned with Pb and often nitrogen-containing heterocycles such as quinoline.1,4,6 There is a debate, though, on the mechanistic origins of selectivity and on how the catalysts can be improved.
The common explanations of the selectivity of these catalysts focus on both “thermodynamic” and “kinetic” factors. “Thermodynamic” factors describe selectivity via preferential adsorption of alkynes on the catalyst surface. The catalyst surface occupied with alkyne molecules does not adsorb alkenes. Hence, only alkynes undergo hydrogenation (into alkene) resulting in high selectivity. Quantitatively, the selectivity towards the intermediate alkene (SALKENE) is described in eqn (1):9
 | (1) |
“Kinetic” factors, in contrast, focus on the dependence of rate constants on the catalyst surface morphology. In this model, the catalyst contains several types of notably different active sites. Poor selectivity comes from the presence of “non-selective” sites prone to indiscriminate hydrogenation of both alkynes and alkenes, or some direct alkyne to alkane over-hydrogenation.10
Gas-phase semi-hydrogenation reactions are well studied, facilitated by the simplicity of the chemistry involved and the available catalyst characterisation methods. The behaviour of ethyne and ethene are often studied using surface science techniques, direct adsorption measurements, and computational methods. The reviews Borodziński and Bond,5,7 Armbrüster et al.,11 and Zaera12 discuss the selectivity and mechanisms of gas-phase hydrogenation. The consensus is that both “thermodynamic” and “kinetic” factors contribute to the high selectivity of Pd catalysts in ethyne semi-hydrogenation. The adsorption of ethyne is considerably stronger compared to ethene over Pd.13–15 Ethene, however, can be hydrogenated in the presence of ethyne over non-selective sites.13,16,17 The addition of a second metal, such as Ag dilutes the Pd catalyst and improves “thermodynamic” factors (rate and adsorption constants, eqn (1)), compared to Pd catalysts.18,19 This picture becomes more complicated with the dissociative adsorption of ethyne leading to the formation of sub-surface carbide – a vital factor that determines the effect of the hydride phase and significantly influences selectivity.8,12,20–22
Liquid-phase, compared to the gas-phase, semi-hydrogenation reactions are far less studied. One reason might be that experimental methods for the liquid phase studies are fewer – some of the surface science tools operating under high vacuum are impossible in the liquid phase. Another reason is the apparent similarity of the liquid-phase hydrogenation to the gas-phase counterpart. But this similarity is only superficial: the liquid-phase reactions are notably different from the gas-phase counterpart.23 Firstly, the molecules hydrogenated in the liquid-phase are substantially larger and more complex, which may lead to different adsorption and hydrogenation behaviour. Secondly, the solvent in liquid-phase reactions decreases hydrogen availability (by limited solubility) and plays a critical role in the reaction kinetics as shown by strong solvent effects.24–26 One of the strongest adsorbates, carbon monoxide, may show dramatically different adsorption behaviour in liquid and gas phases.27
In the current work, we investigate the origin of high selectivity in liquid-phase alkyne semi-hydrogenation focusing on adsorption. We also examine the origins of the improved selectivity of the Lindlar catalyst, including the effect of Pb poisoning of Pd as well as addition of nitrogen bases on the adsorption properties of the catalyst.
Methodology
Experimental
Detailed experimental procedures are provided in the ESI1.† Briefly, the Pd/CaCO3 catalyst was prepared by wet impregnation followed by calcination, reduction, and passivation in 1 vol% O2. One part of the catalyst was poisoned with Pb from an aqueous nitrate solution. Elemental analysis by X-ray fluorescence showed that the Pd catalyst contained 2.1 wt% Pd; the Pd–Pb catalyst contained 1.8 wt% Pd and 3.7 wt% Pb. Transmission electron microscopy studies were attempted but Pd showed insufficient contrast over the large CaCO3 particles making only large and near-edge particles visible – not representative of the whole sample. Chemisorption28 that accesses all Pd particles showed the CO capacity for the Pd/CaCO3 catalyst was 4.62 ± 0.12 μmol gcat−1 and 2.56 ± 0.10 μmol gcat−1 for the Pd–Pb/CaCO3 catalyst. The number of Pd surface sites is twice higher.29 The BET specific surface area of the CaCO3 support was an order of 5 m2 g−1.Hydrogenation experiments were carried out in a Parr autoclave using 50 mg catalyst, 90 mL hexane, nonane (internal standard), and 2-methyl-3-butyn-2-ol substrate, all after degassing. The liquid samples withdrawn were analysed by gas chromatography. Experiments with various stirring rates and Weisz-Prater number calculations showed the kinetic regime of the reaction.
The liquid-phase adsorption studies were performed using an automated system controlled by OpenFlowChem software;30 the system injected liquids into vials with the pre-reduced catalyst according to a pre-defined sequence. After adsorption, the substrate concentration was analysed using gas chromatography comparing the catalyst materials, only support and empty vials. The analysis was for the detection limit of below 0.1 μM.
Computational
We used the Vienna ab initio simulation package (VASP) to perform spin-polarised periodic density functional theory (DFT) – based quantum chemical calculations using the projector augmented wave (PAW) method.31–34 The ideal Pd surfaces were modelled by 4 × 4 cell with 5 atomic layers of which, the top two layers were allowed to relax and bottom three layers were fixed to mimic the bulk of the system. The calculated Pd lattice constant of 3.904 Å agreed with the experimental value of 3.891 Å.35 The spurious dipole moments, due to the adsorption of MBY and MBE molecules on one of the two exposed surfaces of Pd surfaces, were taken into account according to the procedures by Makov et al. and Neugebauer et al. as implemented in VASP.36,37 All the calculations were performed using Perdew–Burke–Ernzerhof (PBE) exchange and correlation functional with Grimme's dispersion correction.38,39 Our previous studies on the interaction of organic molecules such as furfural on Pd surfaces have shown that the use of a K-point grid of 3 × 3 × 1 was sufficient.40 The adsorption energy was calculated as the difference in the total energy of the molecule on the surface and the energies of isolated molecule and the pristine surface.Results and discussion
We selected semi-hydrogenation of 2-methyl-3-butyn-2-ol (MBY, an alkyne alcohol) as a model molecule for liquid-phase semi-hydrogenation. This molecule is widely studied, being an important intermediate in vitamin synthesis and a molecule that is representative of many industrial substrates.6,41–45 Importantly, MBY is more representative of fine chemicals having branching and a polar hydroxyl group.Fig. 1 shows the main reactions observed such as MBY semi-hydrogenation to alkene (MBE), MBE over-hydrogenation to alkane (MBA) along with the possibility of the direct MBY to MBA reaction and oligomer formation. These are not elementary processes but combinations of multiple steps.
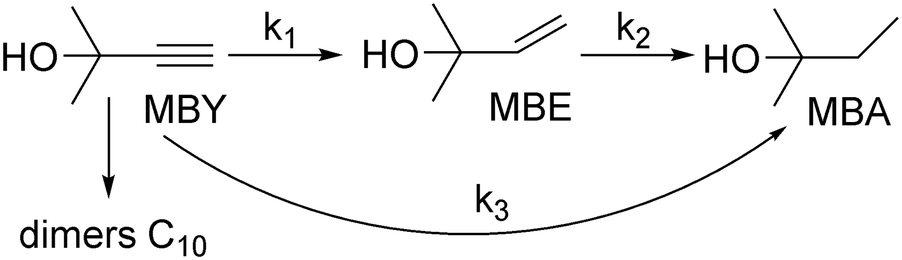 | ||
| Fig. 1 Scheme of MBY hydrogenation and main side-reactions. | ||
Kinetic modelling of alkyne semi-hydrogenation
Aiming to study adsorption over the Pd catalyst, we started with conventional kinetic modelling. Metal-catalysed hydrogenation reactions are described with the Langmuir–Hinshelwood model. There are four major types as a combination of the following answers: (i) competitive or non-competitive adsorption in organic and hydrogen species, and (ii) the reaction order to hydrogen 1 or 0.5.The competitive or non-competitive behaviour could be verified at high substrate or hydrogen concertation. In the case of competitive adsorption and high concentration, we expect the reaction to slow down due to blockage of the reaction sites with one kind (hydrogen or organic) of molecules. Such behaviour was not observed for organic solutions from mM to solvent-free (∼10 M) concentration range.46–48 Hence, we used the non-competitive model.
The reaction order to hydrogen in similar hydrogenation reactions is often either 0.5 or 1.0. In modelling terms, it is described by dissociative or non-dissociative hydrogen adsorption but both mechanisms could correspond to either kinetics; yet the particular hydrogen dissociation mechanism is outside of the scope of this paper – adsorption of organic species and the catalyst effect on selectivity is. Our and overwhelming literature data for the MBY hydrogenation over the Pd catalysts confirms that the reaction order is 1.49
Eqn (2) presents a typical rate equation for MBY semi-hydrogenation step with the full Langmuir–Hinshelwood model scheme presented in ESI2.†
 | (2) |
Table 1 shows the results along with the 90% confidence intervals based on the Monte-Carlo statistical analysis.23,55 The analysis generates a set of data with normally-distributed random errors (standard deviations from the experimental value); the regression is performed many times; the resulting parameters are analysed statistically. The MBY adsorption constant obtained with the model ranges between 1.9 × 10³ L mol−1 and 1.4 × 10⁴ L mol−1, while other values are even less defined. The poorly defined values, however, “agree” with earlier studies that report the MBY adsorption constant of 1.9,52 2 × 10⁶, and53 9 × 10⁻⁵ (ref. 54) (all in L mol−1) over a Pd/ZnO catalyst.
| Model – absolute adsorption constants | Model – relative adsorption constants | |
|---|---|---|
| k 1 (L molPd−1 s−1) | 6.5 ± 5.2 × 10⁷ | 7.6 ± 0.5 × 10⁶ |
| k 2 (L molPd−1 s−1) | 2.1 ± 2.1 × 10⁵ | 1.0 ± 0.8 × 10³ |
| k 3 (L molPd−1 s−1) | 4.1 ± 3.1 × 10⁶ | 4.5 ± 3.7 × 10⁵ |
| K MBY (L mol−1) | 8.4 ± 6.8 × 10³ | — |
| K MBE (L mol−1) or QMBE (—) | 5.9 ± 5.9 × 101 | 2.3 ± 2.0 × 10⁻³ |
| K MBA (L mol−1) or QMBA (—) | 3.1 ± 3.1 × 101 | 3.4 ± 3.2 × 10⁻³ |
Such variation is typical for numerous research areas: from empirical heat transfer correlations56 to adsorption.23 In fact, k1 values differing by more than a factor of 3 can be obtained fitting the same experimental data with high accuracy (ESI,† Fig. S3). The underlying problem (discussed in ESI2.2†) lies with eqn (2) – the equation is inadequate for our modelling.
This problem can be circumvented either fixing one constant51 or using relative adsorption constants57 with the rate equation shown in eqn (3):
 | (3) |
The relative adsorption constant QMBE shows that MBY adsorbs a factor of 200–3000 stronger compared to MBE, in agreement with thermodynamic factors in explaining high selectivity observed over the Pd catalyst. These data also agree with previous DFT calculations for the gas-phase adsorption showing stronger adsorption of alkynes compared to alkenes.13,14,16
Yet, any regression analysis does not prove that adsorption is responsible for high semi-hydrogenation selectivity of Pd – it only confirms that such an explanation does not contradict to the experiment. Hence, an independent adsorption study is essential.
Direct adsorption measurements of Pd and Pb-poisoned Pd catalysts
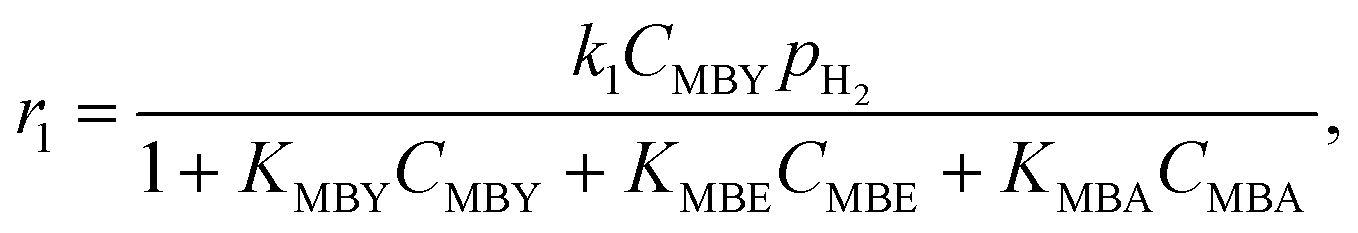
To do such an independent validation, we studied adsorption experimentally in liquid phase. Fig. 2 shows the adsorption isotherms of MBY and MBE species (separately) over the Pd and the Pb-poisoned catalysts in hexane. All isotherms show good agreement with the Langmuir adsorption model. It is worth noting that, however, good fit of the experimental data does not confirm that all model assumptions are valid.23,56,58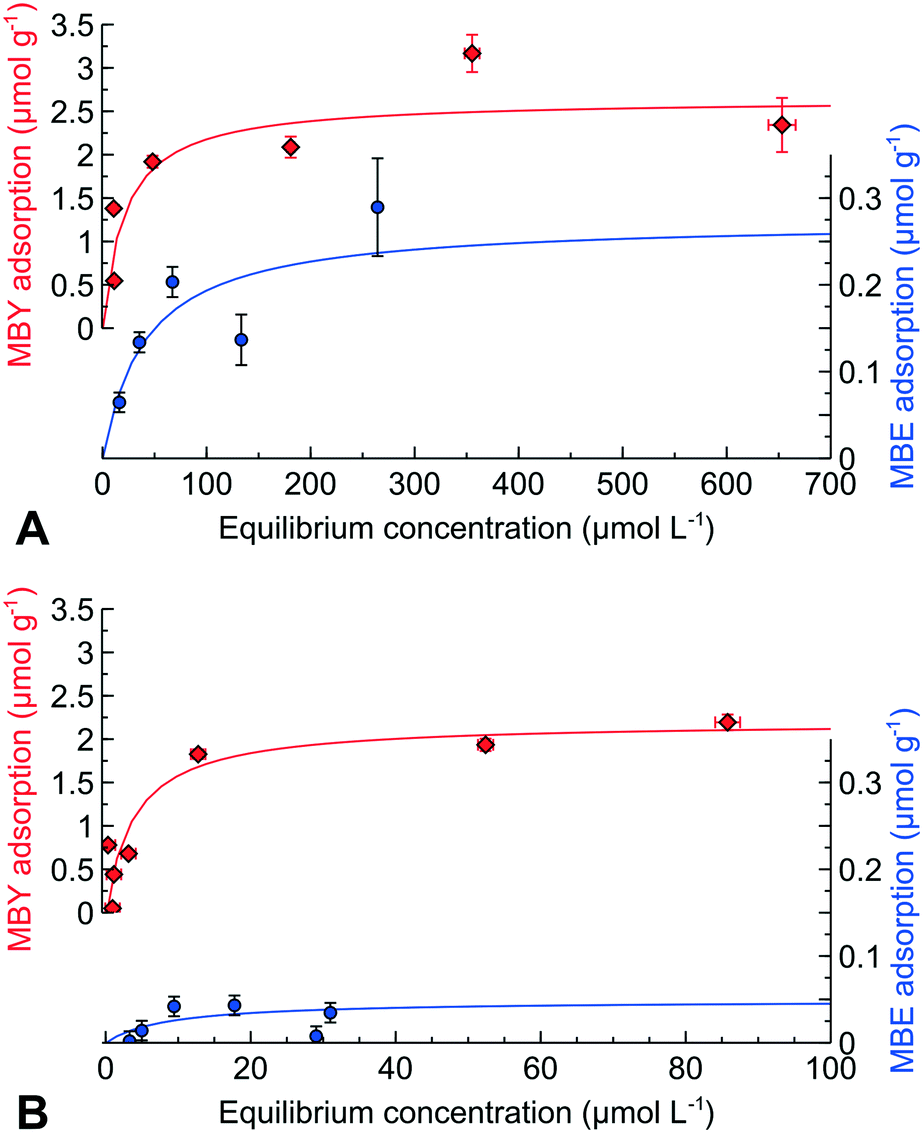 | ||
| Fig. 2 Adsorption isotherms of individual species, MBY and MBE, over the (A) 2 wt% Pd/CaCO3 and (B) Pb-poisoned 2 wt% Pd/CaCO3 catalysts. | ||
Adsorption capacities for MBY and MBE are different for both catalysts. The MBE capacity is almost an order of magnitude lower compared to that of MBY. The adsorption constants, on the contrary, are comparable. In both cases, full catalyst coverage is reached at the equilibrium substrate concentration below 100 μM. Therefore, both alkyne and alkene species adsorb strongly (high adsorption constant) on the Pd surface regardless of poisoning with Pb.
Despite similarities between the Pd and Pb-poisoned catalysts, there are significant quantitative differences (Table 2). Firstly, the alkyne adsorption capacity decreases by about 20% on poisoning with Pb – the value agrees with the decrease in the hydrogenation reaction rates on Pb-poisoning of 24% (discussed further in section 0). Secondly, Pb-poisoning of the Pd catalyst decreases the MBE capacity by a factor of 5.
| Catalyst | Compound | k (L mol−1) | n ads (μmol gcat−1) | S MBE (%) |
|---|---|---|---|---|
| a The ratio of adsorption capacities of MBE to a sum of MBE and MBY as an indication for MBE selectivity at low conversion. | ||||
| Pd | MBY | 5.22 ± 2.19 × 10⁴ | 2.71 ± 0.04 | |
| MBE | 4.30 ± 3.37 × 10⁴ | 0.32 ± 0.16 | 88.8 ± 6.3 | |
| Pd–Pb | MBY | 2.35 ± 0.93 × 10⁴ | 2.23 ± 0.15 | |
| MBE | 1.66 ± 1.14 × 10⁵ | 0.057 ± 0.025 | 97.4 ± 1.2 | |
The data show that alkynes and alkenes adsorb with comparable adsorption constants. Notably different adsorption capacities, however, are unexpected. The apparent rates of MBY to MBE and subsequent MBE to MBA hydrogenation over the Pd and Pb-poisoned Pd catalysts are comparable. If we assume that alkenes cannot adsorb (and react) on the alkyne adsorption sites, the specific rate of alkene hydrogenation should be an order of magnitude higher than for alkyne. That assumption leads to a conclusion that poisoning Pd catalysts with Pb results not only in a significant decrease in the number of active sites, but in an unlikely corresponding increase in specific reaction rates.
The comparable alkyne and alkene hydrogenation rates, however, can be explained if we assume that alkenes can adsorb on the alkyne sites as well. The observed low alkene adsorption capacity could be explained by much lower alkene adsorption constant over the alkyne sites rendering undetectable in the adsorption studies performed. This assumption is in line with gas-phase adsorption studies which showed that ethylene has a much lower adsorption capacity over the Pd surface at room temperature but can cover the whole surface at a lower temperature.59
Therefore, the data show that high selectivity to alkene in alkyne hydrogenation cannot be explained by purely thermodynamic factors because there is a significant number of sites over the Pd catalysts which strongly adsorb the alkene molecules. The expected MBE selectivity can be estimated as a ratio of the adsorption capacities of these sites (Table 2). Such a simplistic model predicts the MBE selectivity over the Pd catalyst of about 90%, while over the Pb-poisoned catalyst – 97%. These values are in line both with the literature41,60,61 and the experimental data (section 0).
Another basis of the typical Langmuir–Hinshelwood hydrogenation model is based on a thermodynamic explanation of selectivity – displacement of alkene species with alkyne. The experiments in ESI3† with the MBY and MBE mixtures indicate that MBY does not displace pre-adsorbed MBE and MBE does not displace MBY.
Therefore, it can be concluded that there are two sites over the Pd catalysts: (i) alkyne sites that strongly adsorb alkyne molecules and weakly adsorb alkene molecules, (ii) alkene sites that strongly adsorb only alkenes. An alkyne excess does not displace adsorbed alkene from alkene sites creating a pathway for non-selective reaction. Poisoning the Pd catalyst with Pb significantly decreases the number of alkene adsorption sites – the relative decrease in the alkene sites agrees with the corresponding alkyne semi-hydrogenation selectivity.
Alkyne and alkene adsorption in the presence of quinoline
Addition of nitrogen-containing heterocycles onto the Pd-based catalysts (and Pb-poisoned catalysts in particular) increases alkene selectivity but decreases the reaction rates. The poisoned catalysts are often detrimental for industrial application because of complexities in poison-product separation as well as potential side reactions; for complex molecules, however, the addition of poisons is often justified by enhanced selectivity. The heterocycles are reversibly adsorbed rendering the quinolone-poisoned catalysts reusable.30 Yet, there is only fragmentary knowledge of their mechanistic effect on selectivity.One of the best glimpses into the problem is provided by García-Mota et al.62 who showed that quinoline strongly adsorbs on the surface of the Pd catalyst. In combination with Pb, only a few available adsorption sites remain available for hydrogenation – hence, the decreasing reaction rates. The sites become spatially separated preventing reaction between the neighbouring alkyne molecules – decreased oligomerization. The addition of quinoline affects thermodynamic factors decreasing the adsorption energy of alkene molecules resulting in a higher semi-hydrogenation selectivity. A closer examination, however, raises some questions. For example, decreasing oligomerisation does not seem vital in liquid-phase semi-hydrogenation where oligomer selectivity is well below 1% compared to an order of 10% in gas-phase reaction.41,61,63,64
We performed direct adsorption of MBY and MBE over the Pd and Pd-Pb catalysts with pre-adsorbed quinoline (data for quinoline alone are provided in ESI4†). Fig. 3 shows that the alkyne adsorption capacity of the Pd catalyst decreased by 10% in the presence of quinoline. Therefore, quinoline blocks the active sites for MBY adsorption which explains the decreasing reaction rates.
 | ||
| Fig. 3 Adsorption of MBY or MBE over the Pd catalyst and MBE over Pd–Pb, all with pre-adsorbed quinoline at an equilibrium concentration of 8 μmol L−1. | ||
Quinoline had a significant effect on the MBE adsorption decreasing the alkene adsorption capacity by over 50%. Such a dramatic decrease in the MBE adsorption capacity is in excellent agreement with an increased MBE selectivity observed over the quinoline-poisoned catalyst.30,43,51,65,66
Adding quinolone to the Pb-poisoned Pd catalysts decreases the MBE adsorption capacity a factor of 5 further compared to the Pd catalyst without Pb. These data agree with the possibility of obtaining an MBE yield above 98% over the Pd–Pb catalyst in the presence of nitrogen bases.1
Kinetic modelling
This study shows that there are two types of adsorption sites in the Pd catalysts: alkyne and alkene sites. When the Pd catalysts are poisoned with Pb, quinolone, or both, the relative amount of alkene sites dramatically decreases indicating that MBE may be over-hydrogenated over the alkene adsorption sites.Yet, could this picture describe the observed hydrogenation data?
We performed kinetic modelling to study to test our model and if alkene sites could be responsible for alkene over-hydrogenation. It is worth pointing out that we intentionally selected the simplest model with the fewest adjustable parameters. If we could describe an experiment with a complex model, the conclusions are limited. After all, describing N experimental points with perfect accuracy is always possible with the (N-1) order polynom; yet such a description is not insightful. A correct description of a complex data set with a model containing few parameters, on the other hand, shows at the very least that the model does not contradict the experiment.
The model developed is described in ESI5† considers 3 reaction stages: (i) MBY to MBE hydrogenation over the alkyne sites, and MBE to MBA hydrogenation over the (ii) alkene, and (iii) alkyne sites. There are only 3 adjustable parameters, the corresponding apparent constants k1, k2, k3, while the numbers of active sites are taken as the corresponding adsorption capacities are determined experimentally.
Fig. 4 shows the experimental hydrogenation data and the model fitted with an excellent description of the experiment. Good fitting with narrow confidence in the regression parameters does not confirm that the model is correct23,56,58 but they show that the proposed mechanism can explain the observed reaction kinetics.
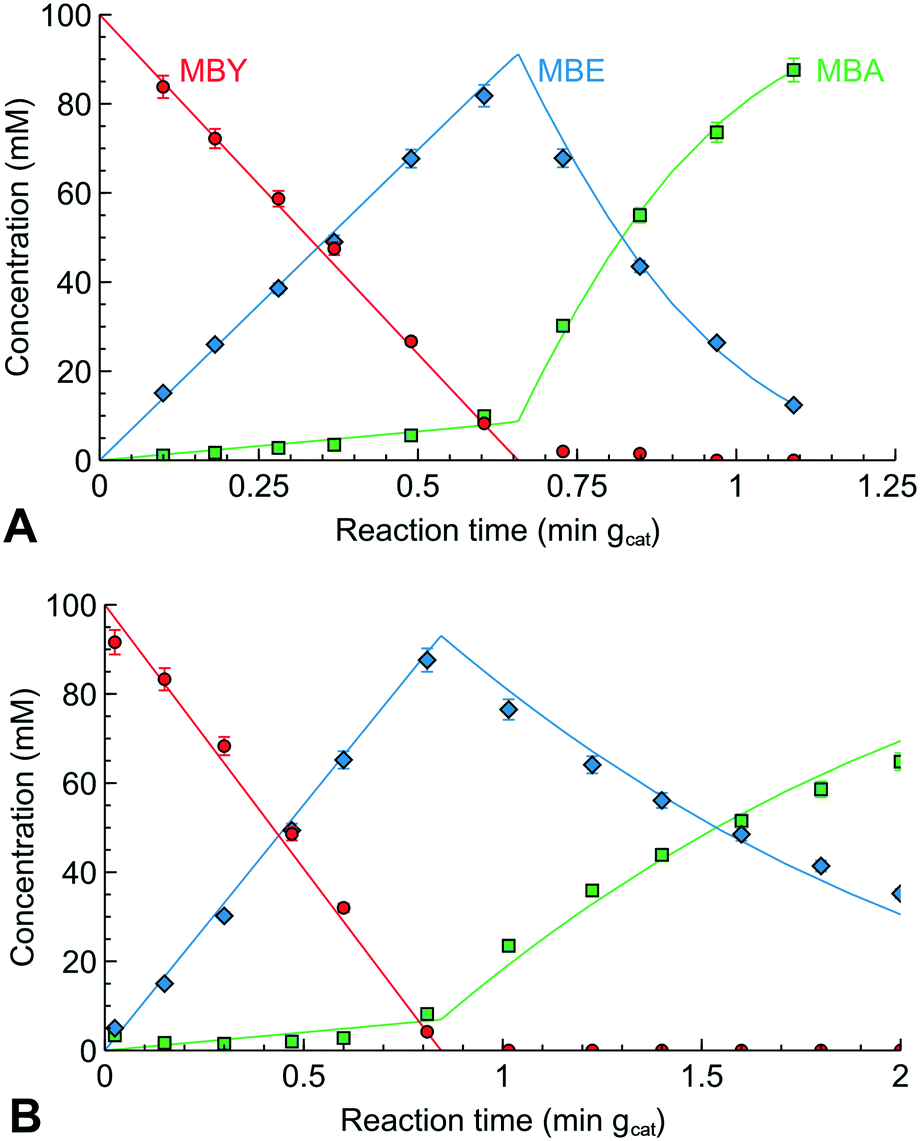 | ||
| Fig. 4 Concentration profile of MBY semi-hydrogenation over (A) the original and (B) Pb-poisoned 2 wt% Pd/CaCO3 catalyst with the lines corresponding to the model fit. | ||
Table 3 shows the apparent rate constants obtained. The confidence intervals of the parameters are narrow and the sensitivity analysis performed in ESI5† shows little intra-parameter correlation. The rate constant for MBY hydrogenation over the alkyne sites (k1) was virtually the same for the initial Pd and Pb-poisoned catalysts. MBE hydrogenation constant over the alkyne sites (k2), however, was considerably higher over the Pd catalyst as well as the rate constant for MBE hydrogenation over the alkene sites (k3).
| Pd | Pd–Pb | |
|---|---|---|
| k 1 (s−1) | 4.09 ± 0.05 × 10⁴ | 4.33 ± 0.05 × 10⁴ |
| k 2 (s−1) | 1.57 ± 0.07 × 10⁵ | 4.73 ± 0.34 × 10⁴ |
| k 3 (s−1) | 2.49 ± 0.28 × 10² | 1.22 ± 0.18 × 10² |
The conventional “thermodynamic” explanation could be discussed in terms of the kMBEKMBE/(kMBYKMBY) ratio from eqn (1). The ratio must be applied for the same prevalent, alkyne, sites; the ratio would correspond to the catalyst selectivity in the absence of non-selective alkene sites. The constants in the ratio are the following: kMBE = k3, kMBY = k1 (from Table 3), KMBY is the experimentally determined adsorption constant (Table 2), while KMBE is not defined because the experimental value of the MBE adsorption constant (Fig. 2) corresponds to strong adsorption over non-selective alkene sites. The MBE adsorption over the alkyne sites could not be experimentally determined. Assuming that KMBE/KMBY is at most 0.01, the ratio could be estimated as an order of 6 × 10⁻⁵ for the Pd catalyst and 2 × 10⁻⁵ for the Pd–Pb catalyst. This demonstrates that selectivity of the Pd catalyst in the absence of the non-selective sites shall be overwhelming. Even in the 100![[thin space (1/6-em)]](https://www.rsc.org/images/entities/char_2009.gif) :1 MBE to MBY mixture, the MBE selectivity shall be above 99.4%, while the MBE selectivity in a reaction starting from MBY shall be well above 99.9%.
:1 MBE to MBY mixture, the MBE selectivity shall be above 99.4%, while the MBE selectivity in a reaction starting from MBY shall be well above 99.9%.
Hence, the “thermodynamic” reasoning of looking only at the adsorption constants results in unrealistically high expected MBE selectivity, which should decrease(!) for the Pd–Pb catalyst. Therefore, it is the presence of the non-selective sites that limits selectivity. Poisoning with Pb affects not only the number of active sites, but decreases the over-hydrogenation rates probably affecting the adsorption geometry and the energy of the hydrogenation transition state.
Therefore, we can conclude that there are two sites over the Pd catalysts: (i) alkyne sites that strongly adsorb alkyne molecules and weakly alkene molecules and (ii) alkene sites that strongly adsorb only alkenes providing a pathway for non-selective reaction of alkene over-hydrogenation. This conclusion seemingly agrees with gas-phase data that showed existence of non-selective over-hydrogenation sites. Al Ammar and Webb13,16,17 performed detailed radiochemical studies into acetylene hydrogenation and identified selective and non-selective sites on the Pd catalysts. The amount of non-selective sites, however, was found insufficient to describe the experiments. The low selectivity in gas phase comes from direct hydrogenation of acetylene to ethane; in liquid phase, it comes from alkene to alkane hydrogenation over non-selective sites.
Adsorption geometry and the nature of non-selective sites
The first step in elucidating the nature of the alkyne and alkene sites was to examine the surface stoichiometry and compare the liquid-phase adsorption capacities with the total number of Pd sites from CO chemisorption. Table 4 shows that an MBY molecule occupies more than 3 Pd sites over the initial Pd catalyst and around 2 sites over the Pb-poisoned catalyst. The possibility for larger molecules to occupy 9–20 Pt and Pd active sites was demonstrated for respectively ethyl benzoylformate and hydroxymatairesinol.67,68 The 3:1 stoichiometry for MBY is easy to understand considering that MBY is a rigid linear molecule and the tertiary carbon atom can block an additional adsorption site (discussed further below). Additional repulsive interactions, steric effects of the methyl group or unfilled Pd sites in between the randomly packed MBY molecules on the Pd surface may explain the observed MBY:Pd stoichiometry higher than 3. Steric considerations also explain why the Pd–Pb catalyst shows a lower adsorption stoichiometry of around 2. Probably, the tertiary group of MBY can be placed above the non-reactive (Pb-poisoned) sites blocking only 2 Pd surface sites.
| Pd | Pd–Pb | |
|---|---|---|
|
a Total surface area from the gas-phase CO chemisorption.
b The average number of surface Pd sites occupied by a single adsorbate molecule in liquid phase.
c Fraction of the surface occupied by MBE molecules considering 1:1 stoichiometry.
|
||
| S Pd (μmol gcat−1) | 9.2 | 5.1 |
| N MBY | 3.4 | 2.3 |
| N MBE | 29 | 90 |
| S MBE (% surface) | 3.5 | 1.1 |
MBE surface stoichiometry, however, is notably higher than that of MBY and neither steric nor repulsive interactions can explain it. Such a low MBE coverage, however, could be explained considering that only strongly-adsorbing MBE sites were detected but not the weaker adsorption of MBE over the previously discussed alkyne sites. Hence, the alkene sites must have either unusual structural or electronic properties which differentiate them from the majority of the Pd surface sites. Similarly, the alkene sites should be differentiated significantly for preferential poisoning with Pb and quinoline.
An indication of the nature of the alkene sites may be inferred from the fraction of alkene sites in the Pd surface of 3.5–7.0% (considering adsorption stoichiometry of 1–2) of Pd surface. With the average diameter of the Pd nanoparticles in the studied Pd/CaCO3 catalyst estimated as 14.6 nm,69 surface statistics70 show that the low-coordination (coordination number ≤7) edge and kink sites account for about 2.3% of the surface in an ideal cuboctahedron. Considering the presence of defects in Pd crystals, the low-coordination sites will be in the expected range.
The possibility that the low-coordination Pd sites are substantially less selective in alkyne hydrogenation reactions is strongly supported by the literature. Ulan et al. showed that the 9-coordinated (111) Pd plane shows a maximum cis-hexenol selectivity of 87%, while the 7-coordinated (110) plane – only 37%.71 The authors explain the deviation from the ideal 100/0% behaviour by defects on the studied surfaces. Crespo-Quesada et al. have obtained unsupported Pd nanoparticles of various sizes and shapes to show that the smaller particles (with a higher proportion of low-coordinated sites) show a lower MBE selectivity.50 An additional, albeit, indirect confirmation of the low selectivity of the low-coordination edge and kink sites comes from the known increase in MBE selectivity over the Bi-poisoned Pd catalyst – the catalysts experimentally and theoretically demonstrated with preferential poisoning of the low-coordination sites.41,43,65,72
Several independent computational studies investigated poisoning of Pd particles by Pb. On Pb poisoning, there is a strong tendency for Pb segregation – Pb atoms tend to disperse in the Pd particles; preferably on the catalyst surface rather than penetrating into the bulk metal.62,72 Moreover, there are both experimental and computational confirmation that Pb surface atoms are more stable on the step sites.62 A strong interaction of Pb with Pd and its segregation indicates that Pb atoms block the surface sites of Pd with a preference to the less selective in alkyne semi-hydrogenation step sites. MBE surface stoichiometry, however, is notably higher than that of MBY and neither steric nor repulsive interactions can explain it. Such a low MBE coverage, however, could be explained considering that only strongly-adsorbing MBE sites were detected but not the weaker adsorption of MBE over the previously discussed alkyne sites. Hence, the alkene sites must have either unusual structural or electronic properties which differentiate them from the majority of the Pd surface sites. Similarly, the alkene sites should be differentiated significantly for preferential poisoning with Pb and quinoline.
An indication of the nature of the alkene sites may be inferred from the fraction of alkene sites in the Pd surface of 3.5–7.0% (considering adsorption stoichiometry of 1–2) of Pd surface. With the average diameter of the Pd nanoparticles in the studied Pd/CaCO3 catalyst estimated as 14.6 nm,69 surface statistics70 show that the low-coordination (coordination number ≤7) edge and kink sites account for about 2.3% of the surface in an ideal cuboctahedron. Considering the presence of defects in Pd crystals, the low-coordination sites will be in the expected range.
The possibility that the low-coordination Pd sites are substantially less selective in alkyne hydrogenation reactions is strongly supported by the literature. Ulan et al. showed that the 9-coordinated (111) Pd plane shows a maximum cis-hexenol selectivity of 87%, while the 7-coordinated (110) plane – only 37%.71 The authors explain the deviation from the ideal 100/0% behaviour by defects on the studied surfaces. Crespo-Quesada et al. have obtained unsupported Pd nanoparticles of various sizes and shapes to show that the smaller particles (with a higher proportion of low-coordinated sites) show a lower MBE selectivity.50 An additional, albeit, indirect confirmation of the low selectivity of the low-coordination edge and kink sites comes from the known increase in MBE selectivity over the Bi-poisoned Pd catalyst – the catalysts experimentally and theoretically demonstrated with preferential poisoning of the low-coordination sites.41,43,65,72
Several independent computational studies investigated poisoning of Pd particles by Pb. On Pb poisoning, there is a strong tendency for Pb segregation – Pb atoms tend to disperse in the Pd particles; preferably on the catalyst surface rather than penetrating into the bulk metal.62,72 Moreover, there are both experimental and computational confirmation that Pb surface atoms are more stable on the step sites.62 A strong interaction of Pb with Pd and its segregation indicates that Pb atoms block the surface sites of Pd with a preference to the less selective in alkyne semi-hydrogenation step sites.
Computational insights into the reaction sites
A DFT study had been performed into the origin of non-selective sites, comparing the adsorption properties of MBY and MBE molecules over the Pd(111), Pd(110) and Pd(210) surfaces. Firstly, the MBY and MBE molecules could adsorb on the Pd catalyst surface through different sites: via the methyl group, oxygen or hydrogen atoms of the hydroxyl group and or the terminal CH group. The adsorption could occur on top of a Pd atom, in between two Pd atoms, and on the hollow sites. The figures illustrating the possible adsorption sites and optimised structures are shown in ESI6.†The most stable structures of MBY and MBE over the Pd(111) surfaces are presented in Fig. 5. The calculated adsorption energies show that the MBY adsorbed through the oxygen atom of the OH group on the Pd(111) has the lowest energy with Ead = −2.800 eV and therefore, it is the most stable adsorption configuration. After relaxation, a rearrangement occurs forming chemical bonds via the triple C–C bond. For MBE, adsorption via the H atom of the OH group was the most stable with an adsorption energy of −1.663 eV, which is significantly (1.138 eV) more positive than the adoption of MBY in the same configuration.
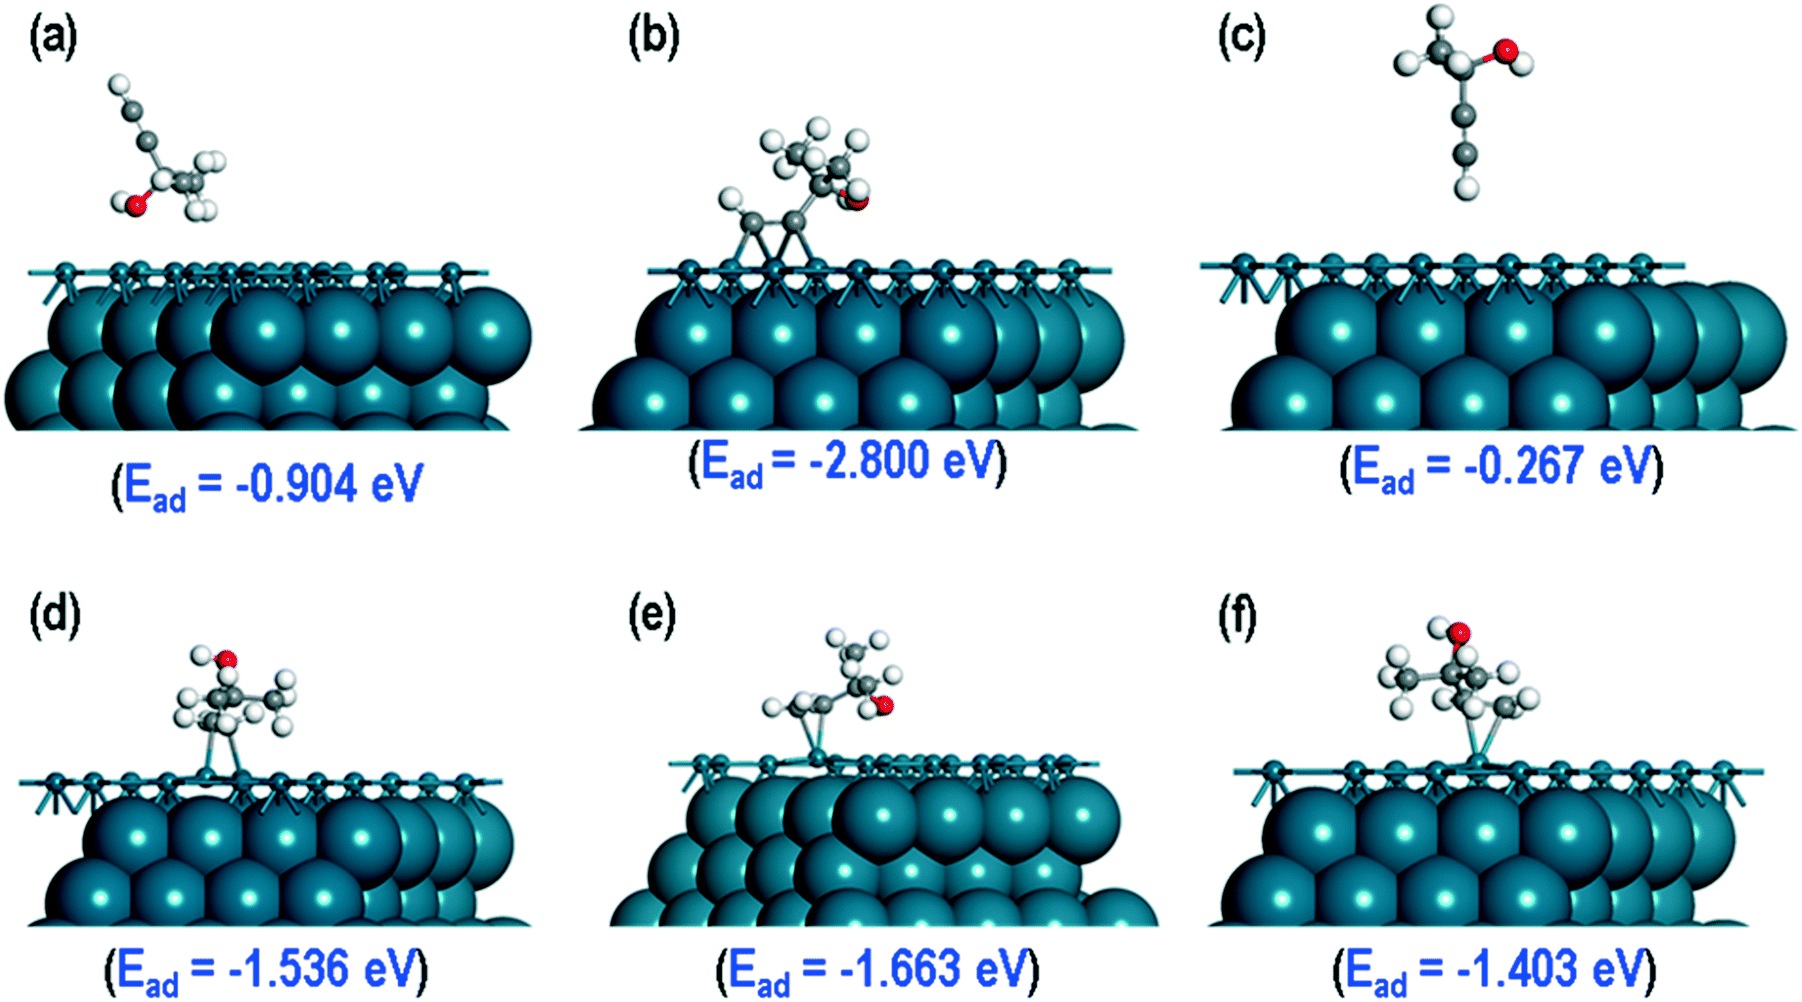 | ||
| Fig. 5 Most stable structures of MBY adsorbed (a) via H atom, (b) over the O atom, (c) via CH group, and MBE adsorption (d) via H atom, (e) via OH group, (f) via CH3 group. The top layer of Pd(111) surface along with the adsorbed molecule shown in ball and stick representation for clarity. | ||
To study the probable reasons for the higher stability of MBY as compared to MBE on the Pd(111) surface, we first consider the fully relaxed geometries of these molecules on the Pd(111) surface. For both molecules, two C atoms are close to the Pd(111) surface. For MBY over the Pd(111), those two C atoms are close to three surface Pd atoms (Fig. 5b), while only to one Pd atom for MBE (Fig. 5e) indicating stronger chemisorption in the former. The observed 3:1 ratio of surface Pd atom to MBY molecule is in excellent agreement with our experimental adsorption stoichiometry (Table 4).
We further analysed the atom projected partial density of states (PDOS) for MBY and MBE adsorbed over the Pd(111) surface to elucidate the higher stability of MBY over MBE. First, the PDOS for MBY and MBE molecule in the gas phase are analysed, which show that the p-orbital signatures of the C-atoms in MBY has a large peak of the C p-orbital signature just below the Fermi energy (EF) followed by the smaller peaks (Fig. 6a). In the MBE molecule, the C p-orbital signatures are uniform at the lower energy levels (Fig. 6b). When these molecules are adsorbed on the Pd(111) surface, the C p-orbital signatures move towards the lower energy levels to cross and overlap with the Pd d-orbital signatures to form chemical bonds. As indicated with the dotted circles in Fig. 6c and d, the major overlapping and crossing region is in between −6.573 eV to −4.864 eV for MBY and in between −6.193 eV to −4.652 eV for MBE. The broader region indicates stronger bonding for MBY compared to MBE molecules on the Pd(111) surface. The area under the Pd d-orbital signatures (calculated in ESI6†) was 0.615 number of states for MBY, which is substantially higher than 0.111 number of states for MBE indicating stronger chemical interaction and adsorption.
 | ||
| Fig. 6 Partial density of states for (a) MBY and (b) MBE molecules in gas phase, and (c) MBY and (d) MBE molecules adsorbed on the Pd (111) surface. The Fermi energy (EF) is a dotted line at 0 eV. | ||
We considered adsorption over the Pd(110) and the Pd(210) surfaces to determine the effect of the nature of the Pd surface on the adsorption properties of the MBY and MBE molecules. The optimised structures of MBY and MBE models are shown in ESI6.† The calculated adsorption energies for the most stable MBY and MBE structures on the Pd(110) surface are −2.536 eV and −2.011 eV respectively. On the Pd(210) surface, the most stable MBY and MBE structures have the adsorption energies of −2.986 eV and −2.077 eV respectively. From these calculations, we find that the difference in the adsorption energies between the MBY and MBE molecules significantly decreases as compared to the Pd(111) surface indicating that MBY and MBE molecules display much closer adsorption energy on the edges of nanoparticles. These data agree with previous studies on the preferential hydrogenation of alkene species over the low-coordination sites and indicate that the alkene adsorption sites identified in these studies are of such low-coordination Pd sites.50
Finally, we investigated how poisoning of the Pd catalyst by Pb affects the adsorption energies of the MBY and MBE molecules. For these calculations, we considered the most stable structures of the MBY and MBE molecules on the Pd(111) surface (Fig. 7a and b) and substituted one of the Pd atoms with a Pb-atom close to the adsorption site. The overall geometry of the adsorbed species did not change significantly. In the case of MBY, however, the molecule moved away from the Pb site and retained its geometry close to that over the pristine Pd(111) surface, which is achieved by adsorbing to the next nearest Pd atom. The shortest interatomic distance between Pd and C atoms was 3.60 Å while on the pristine Pd surface it was 2.21 Å.
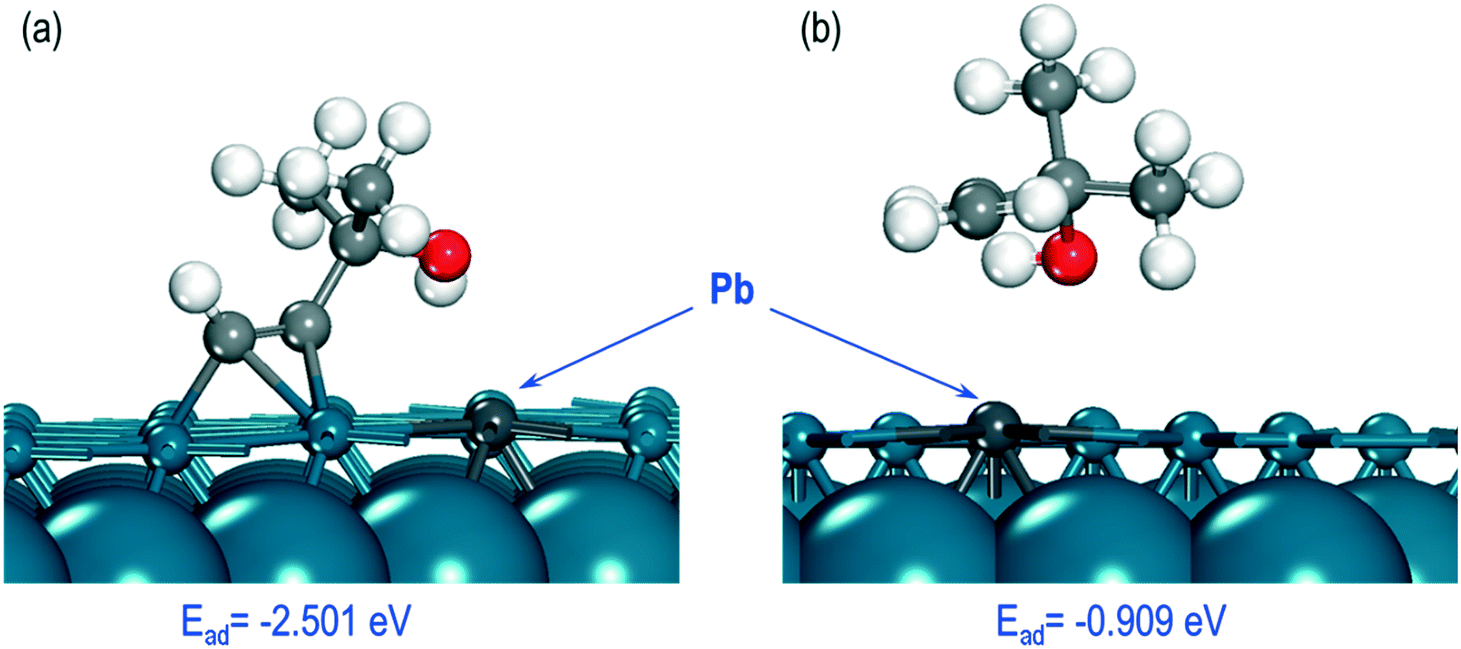 | ||
| Fig. 7 Optimised structures of (a) MBY and (b) MBE molecules on the Pd(111) surface doped with 1 Pb atom. | ||
Poisoning the Pd surface with Pb notably changes the adsorption energies for the species that become −0.909 eV for MBE and −2.501 eV for MBY. Both energies became more positive (weaker adsorption) compared to the pristine Pd surface. The change was about 0.30 eV (or 10%) for MBY and by 0.75 eV (or 45%) for MBE. Hence, the dramatically weaker adsorption of MBE over the Pb-poisoned surface demonstrates that Pb could decrease the MBE adsorption over the Pd surface.
In the case of the alkyne adsorption sites, poisoning with Pb only decreases the number of active sites but has minor effect on the adsorption rates. The alkene selectivity over the alkyne sites will be unaffected because alkene adsorption over such sites is already negligible. In the case of alkene adsorption sites, the presence of Pb atom nearby could dramatically decrease the alkene adsorption, block it, and in effect, preventing the over-hydrogenation reaction.
Therefore, the rational design of the selective catalysts required paying significant attention to the removal (poisoning) or eliminating non-selective sites such as low-coordinated Pd sites. These could be combined with enhanced electronic effects and diffusion to improve catalyst activity.73
Conclusions
The adsorption studies of alkyne and alkene molecules performed in the liquid phase show that there are two notably different adsorption sites: the sites that strongly adsorb either alkyne or alkene molecules. The number of the alkene sites is an order of magnitude lower compared to that of the alkyne sites. There is no alkene displacement by alkynes creating a path for non-selective hydrogenation.In the Lindlar catalyst (Pd poisoned with Pb), the number of both alkyne and alkene sites decreases compared to the unpoisoned Pd catalyst. In relative terms, however, the number of alkene sites notably decreases corresponding with the lower over-hydrogenation over the Pb-poisoned Pd catalysts. The addition of quinoline decreases the number of both sites further but the alkene sites almost disappear in line with high catalyst selectivity.
The alkyne reaction pathway can be summarised in the following way. During the initial stages of alkyne hydrogenation, alkyne reacts over the alkyne adsorption sites forming alkene. Specificity and strong alkene adsorption over the alkene sites create a pathway for non-selective alkene hydrogenation even in alkyne excess. When alkyne is exhausted, however, we surmise that alkene hydrogenation takes place even on the alkyne sites, which was not possible before due to much lower adsorption constant of alkenes compared to alkynes. The kinetic model built on these assumptions provides a good description of the hydrogenation kinetics.
DFT studies and the literature selectivity data agree indicating that the non-selective alkene sites are low-coordinated atoms at kink and edge sites of the Pd nanoparticles (Fig. 8).
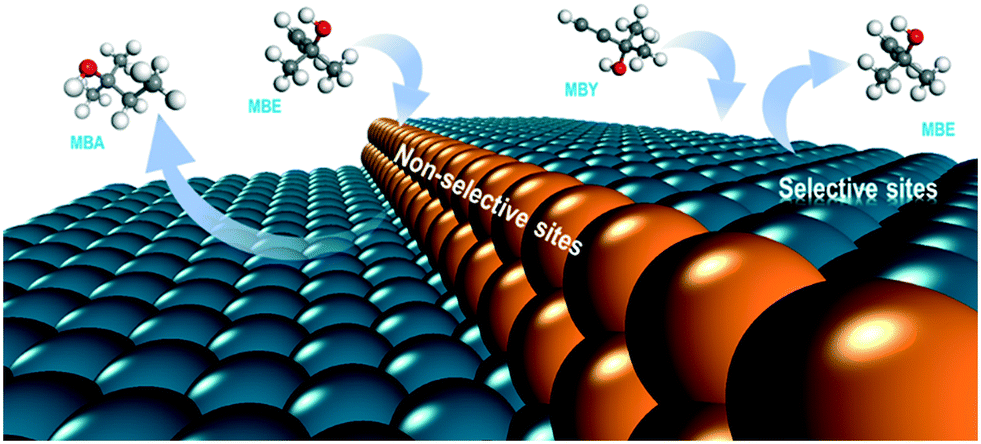 | ||
| Fig. 8 Scheme of the selective (terrace) and non-selective (low-coordination) sites in the Pd catalysts for alkyne semihydrogenation. | ||
The work provides a different viewpoint on the question of the kinetic and thermodynamic factors of selectivity. Contrary to many previous studies, we suggest that poisoning of the Pd catalysts with Pb or quinoline is not related to an improvement in the thermodynamic factors. The adsorption constants are high so minor changes in the adsorption constants make a little effect on selectivity. Thermodynamic factors explain why the alkene selectivity over the Pd catalyst is above 90% – because of strong adsorption of alkynes (compared to alkenes) over the alkyne adsorption sites. Kinetic factors, on the other hand, limit the alkene selectivity to only 93–98% (depending on the catalyst modification) creating a non-selective bypass hydrogenation pathway – the pathway significantly hindered by poisoning of Pd catalysts.
Author contributions
NC performed the investigation and data analysis, DM commented n kinetic modelling, the manuscript and directions for the DFT studies. AC performed the DFT studies and wrote the DFT computational part. RC helped with DFT computations, drafting of the manuscript and methodology.Conflicts of interest
There are no conflicts to declare.Acknowledgements
We are grateful to Mr Shrirang Deshmukh and Vishal Jadwani for help with some experimental work. NC is grateful for the Andrew Fellowship and Royal Society for the International Exchanges grant 193016. AC acknowledges the use of ARCHER/ARCHER-2 – the UK National Supercomputing service (via HEC Materials Chemistry membership and funded by EPSRC, EP/R029431), Supercomputer Wales, Athena at HPC Midlands+ (funded by the EPSRC (grant EP/P020232/1) via the EPSRC RAP call of spring 2018 and 2019) and Cirrus UK National Tier-2 HPC service at EPCC (funded by the University of Edinburg and EPSRC (EP/P020267/1)).References
- W. Bonrath, J. Medlock, J. Schutz, B. Wustenberg, T. Netscher, B. Wüstenberg and T. Netscher, Hydrogenation in the Vitamins and Fine Chemicals Industry – An Overview, in Hydrogenation, ed. I. Karame, InTech, Rijeka, 2012, pp. 69–90 Search PubMed.
- B. Chen, U. Dingerdissen, J. G. E. Krauter, H. G. J. Lansink Rotgerink, K. Möbus, D. J. Ostgard, P. Panster, T. H. Riermeier, S. Seebald, T. Tacke and H. Trauthwein, Appl. Catal., A, 2005, 280, 17–46 CrossRef CAS.
- W. Bonrath and T. Netscher, Appl. Catal., A, 2005, 280, 55–73 CrossRef CAS.
- L. A. Saudan, Acc. Chem. Res., 2007, 40, 1309–1319 CrossRef CAS PubMed.
- A. Borodziński and G. C. Bond, Catal. Rev.: Sci. Eng., 2006, 48, 91–144 CrossRef.
- M. Eggersdorfer, D. Laudert, U. Létinois, T. McClymont, J. Medlock, T. Netscher and W. Bonrath, Angew. Chem., Int. Ed., 2012, 51, 12960–12990 CrossRef CAS PubMed.
- A. Borodziński and G. C. Bond, Catal. Rev.: Sci. Eng., 2008, 50, 379–469 CrossRef.
- D. Teschner, J. Borsodi, A. Wootsch, Z. Révay, M. Hävecker, A. Knop-Gericke, S. D. Jackson and R. Schlögl, Science, 2008, 320, 86–89 CrossRef CAS PubMed.
- T. Salmi and D. Murzin, Catalytic Kinetics, 2005 Search PubMed.
- A. N. R. Bos and K. R. Westerterp, Chem. Eng. Process., 1993, 32, 1–7 CrossRef CAS.
- M. Armbrüster, M. Behrens, F. Cinquini, K. Föttinger, Y. Grin, A. Haghofer, B. Klötzer, A. Knop-Gericke, H. Lorenz, A. Ota, S. Penner, J. Prinz, C. Rameshan, Z. Révay, D. Rosenthal, G. Rupprechter, P. Sautet, R. Schlögl, L. Shao, L. Szentmiklósi, D. Teschner, D. Torres, R. Wagner, R. Widmer and G. Wowsnick, ChemCatChem, 2012, 4, 1048–1063 CrossRef.
- F. Zaera, ACS Catal., 2017, 7, 4947–4967 CrossRef CAS.
- A. S. Al-Ammar and G. Webb, J. Chem. Soc., Faraday Trans., 1978, 74, 195–205 RSC.
- L. Vattuone, Y. Y. Yeo, R. Kose and D. A. King, Surf. Sci., 2000, 447, 1–14 CrossRef CAS.
- A. J. McCue, A. Guerrero-Ruiz, C. Ramirez-Barria, I. Rodríguez-Ramos and J. A. Anderson, J. Catal., 2017, 355, 40–52 CrossRef CAS.
- A. S. Al-Ammar and G. Webb, J. Chem. Soc., Faraday Trans., 1979, 75, 1900–1911 RSC.
- A. S. Al-Ammar and G. Webb, J. Chem. Soc., Faraday Trans., 1978, 74, 657 RSC.
- S. Gonzalez, K. M. Neyman, S. Shaikhutdinov, H.-J. Freund and F. Illas, J. Phys. Chem. C, 2007, 2, 6852–6856 CrossRef.
- F. Studt, F. Abild-Pedersen, T. Bligaard, R. Z. Sørensen, C. H. Christensen and J. K. Nørskov, Science, 2008, 320, 1320–1322 CrossRef CAS.
- M. García-Mota, B. Bridier, J. Pérez-Ramírez and N. López, J. Catal., 2010, 273, 92–102 CrossRef.
- D. Teschner, E. Vass, M. Havecker, S. Zafeiratos, P. Schnorch, H. Sauer, A. Knopgericke, R. Schlogl, M. Chamam and A. Wootsch, J. Catal., 2006, 242, 26–37 CrossRef CAS.
- D. Torres, F. Cinquini and P. Sautet, J. Phys. Chem. C, 2013, 117, 11059–11065 CrossRef CAS.
- N. Cherkasov, J. Mol. Liq., 2020, 301, 1–8 CrossRef.
- J. A. Bennett, R. P. Fishwick, R. Spence, J. Wood, J. M. Winterbottom, S. D. Jackson and E. H. Stitt, Appl. Catal., A, 2009, 364, 57–64 CrossRef CAS.
- M. G. Musolino, C. M. S. Cutrupi, A. Donato, D. Pietropaolo and R. Pietropaolo, J. Mol. Catal. A: Chem., 2003, 195, 147–157 CrossRef CAS.
- H. Wan, A. Vitter, R. V. Chaudhari and B. Subramaniam, J. Catal., 2014, 309, 174–184 CrossRef CAS.
- M. A. Albiter, R. M. Crooks and F. Zaera, J. Phys. Chem. Lett., 2010, 1, 38–40 CrossRef CAS.
- Y. Bai, N. Cherkasov, S. Huband, D. Walker, R. Walton and E. Rebrov, Catalysts, 2018, 8, 1–18 CrossRef.
- P. Canton, G. Fagherazzi, M. Battagliarin, F. Menegazzo, F. Pinna and N. Pernicone, Langmuir, 2002, 18, 6530–6535 CrossRef CAS.
- N. Cherkasov, Y. Bai, A. J. Exposito and E. V. Rebrov, React. Chem. Eng., 2018, 3, 769–780 RSC.
- G. Kresse and J. Hafner, Phys. Rev. B: Condens. Matter Mater. Phys., 1993, 47, 558–561 CrossRef CAS PubMed.
- G. Kresse and J. Hafner, Phys. Rev. B: Condens. Matter Mater. Phys., 1994, 49, 14251–14269 CrossRef CAS PubMed.
- G. Kresse, Phys. Rev. B: Condens. Matter Mater. Phys., 1999, 59, 1758–1775 CrossRef CAS.
- P. E. Blöchl, Phys. Rev. B: Condens. Matter Mater. Phys., 1994, 50, 17953–17979 CrossRef.
- S. M. Rogers, C. R. A. Catlow, C. E. Chan-Thaw, A. Chutia, N. Jian, R. E. Palmer, M. Perdjon, A. Thetford, N. Dimitratos, A. Villa and P. P. Wells, ACS Catal., 2017, 7, 2266–2274 CrossRef CAS.
- G. Makov and M. Payne, Phys. Rev. B: Condens. Matter Mater. Phys., 1995, 51, 4014–4022 CrossRef CAS.
- J. Neugebauer and M. Scheffler, Phys. Rev. B: Condens. Matter Mater. Phys., 1992, 46, 16067–16080 CrossRef CAS PubMed.
- S. Grimme, J. Antony, S. Ehrlich and H. Krieg, J. Chem. Phys., 2010, 132, 154104 CrossRef PubMed.
- J. P. Perdew, M. Ernzerhof and K. Burke, Phys. Rev. Lett., 1996, 77, 3865 CrossRef CAS PubMed.
- E. K. Dann, E. K. Gibson, R. H. Blackmore, C. R. A. Catlow, P. Collier, A. Chutia, T. E. Erden, C. Hardacre, A. Kroner, M. Nachtegaal, A. Raj, S. M. Rogers, S. F. R. Taylor, P. Thompson, G. F. Tierney, C. D. Zeinalipour-Yazdi, A. Goguet and P. P. Wells, Nat. Catal., 2019, 2, 157–163 CrossRef CAS.
- N. Cherkasov, A. O. Ibhadon, A. McCue, J. A. Anderson and S. K. Johnston, Appl. Catal., A, 2015, 497, 22–30 CrossRef CAS.
- Y. Elias, P. Rudolf von Rohr, W. Bonrath, J. Medlock and A. Buss, Chem. Eng. Process., 2015, 95, 175–185 CrossRef CAS.
- N. Cherkasov, A. O. Ibhadon and E. V. Rebrov, Appl. Catal., A, 2016, 515, 108–115 CrossRef CAS.
- R. Easterday, C. Leonard, O. Sanchez-Felix, Y. Losovyj, M. Pink, B. D. Stein, D. G. Morgan, N. a Lyubimova, L. Z. Nikoshvili, E. M. Sulman, W. E. Mahmoud, A. a Al-Ghamdi and L. M. Bronstein, ACS Appl. Mater. Interfaces, 2014, 6, 21652–21660 CrossRef CAS PubMed.
- W. Bonrath, M. Eggersdorfer and T. Netscher, Catal. Today, 2007, 121, 45–57 CrossRef CAS.
- N. Cherkasov, Y. Bai and E. Rebrov, Catalysts, 2017, 7, 1–16 CrossRef.
- N. Cherkasov, A. Exposito, Y. Bai and E. V. Rebrov, React. Chem. Eng., 2019, 4, 112–121 RSC.
- N. Cherkasov, M. Al-Rawashdeh, A. O. Ibhadon and E. V. Rebrov, Catal. Today, 2016, 273, 205–212 CrossRef CAS.
- M. Crespo-Quesada, M. Grasemann, N. Semagina, A. Renken and L. Kiwi-Minsker, Catal. Today, 2009, 147, 247–254 CrossRef CAS.
- M. Crespo-Quesada, A. Yarulin, M. Jin, Y. Xia and L. Kiwi-Minsker, J. Am. Chem. Soc., 2011, 133, 12787–12794 CrossRef CAS PubMed.
- E. V. Rebrov, E. A. Klinger, A. Berenguer-Murcia, E. M. Sulman and J. C. Schouten, Org. Process Res. Dev., 2009, 13, 991–998 CrossRef CAS.
- N. Semagina, M. Grasemann, N. Xanthopoulos, A. Renken and L. Kiwi-Minsker, J. Catal., 2007, 251, 213–222 CrossRef CAS.
- L. N. Protasova, E. V. Rebrov, K. L. Choy, S. Y. Pung, V. Engels, M. Cabaj, A. E. H. Wheatley and J. C. Schouten, Catal. Sci. Technol., 2011, 1, 768–777 RSC.
- S. Vernuccio, R. Goy, A. Meier, P. Rudolf von Rohr and J. Medlock, Chem. Eng. J., 2017, 316, 121–130 CrossRef CAS.
- J. S. Alper and R. I. Gelb, J. Phys. Chem., 1990, 94, 4747–4751 CrossRef CAS.
- H. Stitt, M. Marigo, S. Wilkinson and T. Dixon, Johnson Matthey Technol. Rev., 2015, 59, 74–89 CrossRef.
- D. Duca, L. F. Liotta and G. Deganello, J. Catal., 1995, 154, 69–79 CrossRef CAS.
- N. Cherkasov, T. Vazhnova and D. B. Lukyanov, Vib. Spectrosc., 2016, 83, 170–179 CrossRef CAS.
- J. A. Gates and L. L. Kesmodel, Surf. Sci., 1983, 124, 68–86 CrossRef CAS.
- B. Tripathi, L. Paniwnyk, N. Cherkasov, A. O. Ibhadon, T. Lana-Villarreal and R. Gómez, Ultrason. Sonochem., 2015, 26, 445–451 CrossRef CAS PubMed.
- Z. Wu, N. Cherkasov, G. Cravotto, E. Borretto, A. O. Ibhadon, J. Medlock and W. Bonrath, ChemCatChem, 2015, 7, 952–959 CrossRef CAS.
- M. García-Mota, J. Gómez-Díaz, G. Novell-Leruth, C. Vargas-Fuentes, L. Bellarosa, B. Bridier, J. Pérez-Ramírez and N. López, Theor. Chem. Acc., 2011, 128, 663–673 Search PubMed.
- S. K. Johnston, N. Cherkasov, E. Pérez-Barrado, A. Aho, D. Y. Murzin, A. O. Ibhadon and M. G. Francesconi, Appl. Catal., A, 2017, 544, 40–45 CrossRef CAS.
- M. W. Tew, H. Emerich and J. A. van Bokhoven, J. Phys. Chem. C, 2011, 115, 8457–8465 CrossRef CAS.
- N. Cherkasov, A. O. Ibhadon and E. V. Rebrov, Lab Chip, 2015, 15, 1952–1960 RSC.
- L. Shen, S. Mao, J. Li, M. Li, P. Chen, H. Li, Z. Chen and Y. Wang, J. Catal., 2017, 350, 13–20 CrossRef CAS.
- G. Martin, P. Maki-Arvela, J. Warna, K. Honkala, D. Y. Murzin and T. Salmi, Ind. Eng. Chem. Res., 2014, 53, 11945–11953 CrossRef CAS.
- H. Bernas, A. Taskinen, J. Wärnå and D. Y. Murzin, J. Mol. Catal. A: Chem., 2009, 306, 33–39 CrossRef CAS.
- A. Borodziński and M. Bonarowska, Langmuir, 1997, 13, 5613–5620 CrossRef.
- R. V. A. N. Hardeveld and F. Hartog, Surf. Interface Anal., 1969, 15, 189–230 Search PubMed.
- J. G. Ulan, W. F. Maier and D. A. Smith, J. Org. Chem., 1987, 52, 3132–3142 CrossRef CAS.
- N. López and C. Vargas-Fuentes, Chem. Commun., 2012, 48, 1379–1391 RSC.
- Z. Wei, Z. Yao, Q. Zhou, G. Zhuang, X. Zhong, S. Deng, X. Li and J. Wang, ACS Catal., 2019, 9, 10656–10667 CrossRef CAS.
Footnote |
| † Electronic supplementary information (ESI) available: Experimental procedures, details on kinetic modelling and computations. See DOI: 10.1039/d1cy01016f |
| This journal is © The Royal Society of Chemistry 2021 |