 Open Access Article
Creative Commons Attribution 3.0 Unported Licence
Influence of surface defects on activity and selectivity: a quantitative study of structure sensitivity of Pd catalysts for acetylene hydrogenation†
Wenbo
Xie
and
P.
Hu
 *
*
School of Chemistry and Chemical Engineering, Queen's University Belfast, David Keir Building, Stranmillis Road, Belfast, BT9 5AG, UK. E-mail: p.hu@qub.ac.uk
First published on 7th June 2021
Abstract
As one of the essential processes in the energy industry, acetylene hydrogenation reactions have been studied extensively in both experiment and theory. However, the fundamentals of structure sensitivity of acetylene hydrogenation over Pd catalysts are still debatable. Herein, a newly developed coverage-dependent microkinetic modelling is utilized to investigate the structure sensitivity of Pd catalysts. The key reaction kinetics are quantitatively examined; for example, a high ethylene activity of 3.92 s−1 and a low selectivity of 0.2 at 300 K are calculated. It is found that the Pd(211) surface is much more active than Pd(111), but exhibits a poor selectivity toward ethylene in contrast to Pd(111) that is intrinsically selective toward ethylene. The high activity of Pd(211) is primarily due to the decisive role of the coverage effect in reducing the reaction barrier of the rate-determining step, while the poor selectivity is a consequence of the inherently high chemisorption energy of ethylene. Furthermore, the ethylene selectivity is found to be more sensitive to the desorption barrier at low temperature. This work provides an atomic-scale understanding of the intrinsic selectivity of the acetylene hydrogenation embodied in different Pd structures.
Introduction
Catalytic hydrogenation is one of the most common reactions in chemical production. It is estimated that 25% of chemical processes involve at least one step of hydrogenation reactions, contributing about 8% of the world GDP, and making it one of the most important areas of catalytic research.1–3 One of the greatest challenges in hydrogenation reactions is the product selectivity, and hence the understanding, development, and design of efficient and selective hydrogenation catalysts are of paramount importance.4,5 Ethylene, as a fundamental chemical for industrial usage, is now commonly produced by acetylene selective hydrogenation, which requires not only removing traces of acetylene from ethylene but also avoiding over-hydrogenation leading to the loss of ethylene.6–8 Generally speaking, acetylene hydrogenation is a tandem reaction in which there are two competing parallel reaction paths: sequential hydrogenation of acetylene to produce ethylene and further hydrogenation to ethane. Also, oligomerization could be a competitor with the Horiuti–Polanyi mechanism.9 An ideal catalyst for acetylene hydrogenation should be able to avoid the stepwise hydrogenation of acetylene to ethane.10,11 Although the emerging non-noble Ni-based10,12 and Cu-based13 catalysts are showing convincing potentials, Pd-based catalysts are still the most commonly used catalyst in industries for acetylene hydrogenation and are extensively studied from both experimental14–17 and theoretical perspectives.18–23 Interestingly, the activity and selectivity patterns of pure Pd catalysts vary significantly; in some cases, Pd was reported to exhibit considerable selectivity towards ethylene, while other studies showed that Pd primarily promotes the production of ethane. A fundamental understanding of achieving high selectivity is still very limited. Currently, bimetallic systems such as Pd–Ag,24,25 Pd–Zn,26 and Pd–Au (ref. 27) have been synthesized and used to improve the selectivity of acetylene hydrogenation. A recent study showed that Pd nanoclusters confined within sodalite (SOD) zeolite (Pd@SOD) exhibit an improved selectivity to ethylene.28 This divergent performance of Pd-based catalysts suggests that there is still significant room for improved understanding of the fundamental factors that control the activity and selectivity of acetylene hydrogenation.In this work, we hypothesize that the activity and selectivity of pure Pd catalysts are highly structure dependent. The recently developed microkinetic modelling using energies from density functional theory (DFT) calculations has emerged as a powerful tool for understanding heterogeneous catalysis.10,29–35 It provides the respective rates of the different reaction pathways, thus allowing the selectivity to the various products to be distinguished by quantitative means.29 It now has the potential to interpret the contradictions among a variety of studies in the literature from a theoretical point of view and to verify the hypothesis by calculations. In our previous work, we carried out a detailed microkinetic analysis of selective acetylene hydrogenation reaction on the flat Pd(111) surface. Taking the coverage effect into account and using methods such as ab initio molecular dynamics (AIMD) to obtain energetic details that are not readily available in traditional calculations bring new insights to the reaction kinetics.29,36,37 This framework has included self and cross adsorbate–adsorbate interactions, in order to provide a quantitative description of differential chemisorption energies on different structured surfaces. The microkinetic model achieves agreement with experimental results on Pd(111) and lays the foundation for our study of structural sensitivity. The structure sensitivity of Pd catalysts has been suggested previously,5,38 but it has not been described quantitatively. Furthermore, the activity and selectivity were found to change during reaction with the particle size.3 The smaller the sizes of particles are, the more defects it is expected for them to have on the surfaces.39 In an effort to provide a solid theoretical understanding of the structure effect on selectivity and activity, a detailed study of selective acetylene hydrogenation on a Pd surface with defects is highly desirable. In this work, we aim to answer the following questions. (i) How different is the activity and selectivity on the Pd(211) surface compared to Pd(111)? (ii) How are the activity and selectivity on the stepped Pd(211) surface affected by the coverage effects? (iii) What kind of quantitative understanding can we obtain by means of kinetic analysis?
Herein, acetylene hydrogenation is studied on the Pd(211) surface using DFT calculations and coverage-dependent microkinetic simulations. Firstly, a coverage-independent model, as a reference, was built to investigate the acetylene hydrogenation reactions on the stepped Pd surface. The reaction pathways were thoroughly mapped out and compared with reaction pathways on Pd(111). Based on the coverage-independent results, C2H2 and H were chosen as the environmental species to calculate the coverage-dependent differential chemisorption energies. Both self and cross adsorbate–adsorbate interactions versus the environmental species were thoroughly studied. The transition state energies were corrected with the coverage effect as well. To achieve more accurate kinetic results, the ethylene desorption energy barrier was obtained using the AIMD method based on the steady-state results obtained from coverage-dependent calculations.37 Ethylene activity and selectivity were explicitly investigated using microkinetic simulations on Pd(211). Our simulations find the Pd(211) surface to be much more active than the Pd(111) surface, while a strong differential chemisorption energy and lower further hydrogenation barrier of ethylene limit the selectivity. Our results indicate that close-packed surfaces are responsible for the ethylene production over Pd catalysts, while defect sites are significantly more active but selective toward ethane. Furthermore, a sensitivity analysis was carried out to quantitatively assess which physical quantity has a larger influence on ethylene selectivity on Pd(211), thus providing new insights into how surface defects impact on the selectivity. Notably, the catalytic hydrogenation of acetylene over Pd catalysts is highly intricate, and alterations in the Pd metal structure such as hydride and carbide formation can directly influence the reaction kinetics.11,40,41 In this work, we focus solely on the ideal Pd surfaces.
Computational method
Computational details
In this work, all the DFT energies were calculated using the Vienna ab initio simulation package (VASP)42,43 under the framework of the generalized gradient approximation (GGA) with the Perdew–Burke–Ernzerhof (PBE) functional.44 The projector-augmented-wave (PAW) pseudopotentials were used,43,45 and the cutoff energy of plane-wave basis expansion was set to 400 eV. All the gas-phase molecules, including H2, C2H2, C2H4, and C2H6, were placed in a (10 × 10 × 10) Å3 cubic box to obtain the total energies. The transition states (TS) were searched using the constrained minimization technique and the quasi-Newton algorithm.46–49 The transition states were verified by two key facts: (i) all forces on atoms have been optimized to be less than 0.05 eV/Å; (ii) the total energy is a maximum along the reaction coordinate but a minimum with respect to all other degrees of freedom.Ab initio molecular dynamics was used to investigate the desorption barrier of ethylene in this work using the VASP code, including constrained MD and umbrella sampling.50,51 The k-point 2 × 2 × 1 was used. The time step was 1.0 fs. The Nosé–Hoover52 thermostat was used to control the temperature, and the free energy is the Helmholtz free energy corresponding to the NVT ensemble.53 All energies used in this work were free energies. Vibrational frequency analyses were used to correct free energy from the total energy among initial states, transition states, and final states. The thermodynamic corrections of the gaseous species were calculated using Gaussian 03 with ideal gas approximation (only the correction values were used).
Microkinetic model with a coverage effect
A coverage-dependent microkinetic model was used to thoroughly study the acetylene hydrogenation on the Pd(211) surface. 7 elementary steps listed in Table 1 were considered in this work.5ri is the rate of reaction for step i, where i = 1, ⋯7. ki and k−i are the forward rate and reverse rate constants, respectively. The transition state theory was used to calculate the rate constants as
The differential chemisorption free energy of all species under different coverage conditions is defined as
| Gdiffads(i)(θN) = Gads,N − Genv,N−1 − Ggas |
We introduced a two-line model to quantify how the coverage effect prevails in the chemisorption energies and reaction barriers.30,36 The two-line model illustrates how the differential chemisorption energy changes at both low and high coverages. The two-line model describes the linear nature of the differential chemisorption free energy54,55–coverage relation. The influence of adsorbate–adsorbate interactions at different coverages with multiple species on differential chemisorption free energy can be written as:
The turnover frequency (TOF) was calculated using a self-consistent microkinetic model shown in Fig. S10.†14,56 The microkinetic modelling and analysis were performed using CATKINAS.57–59 The converged TOF and coverages for different species at the steady state were achieved when the convergence of coverages reaches the level that is smaller enough.
Results and discussion
Coverage-independent model on Pd(211)
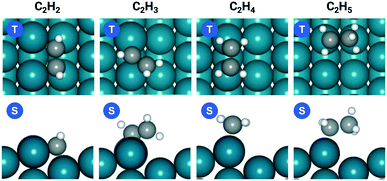
The acetylene hydrogenation reactions on Pd(211) was first studied using a traditional coverage-independent model in order to take a glimpse of the reaction kinetics and to provide clues for the selection of major adsorbates, referred to as environmental species (env) in the following sections of coverage-dependent studies. Prior to investigating each elementary step of acetylene hydrogenation, it is necessary first to understand the adsorption of relevant species on Pd(211). Table 2 lists the adsorption energies at 300 K for C2H2 and C2H4 on Pd(211) compared to those on Pd(111), while Fig. 1 illustrates the preferred adsorption geometries for all C2Hx on Pd(211).| Pd(211) | Pd(111) | |||
|---|---|---|---|---|
| E ads | G ads | E ads | G ads | |
| C2H2 | −2.33 | −1.65 | −2.01 | −1.49 |
| C2H4 | −1.21 | −0.81 | −0.87 | −0.34 |
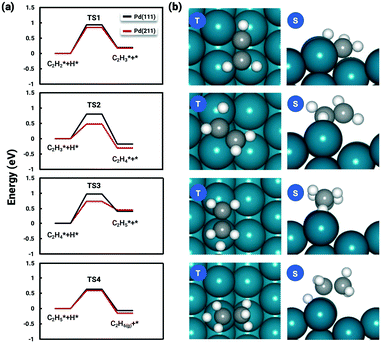
The favorable adsorption geometry of C2H2 is on the B5 site under the step edge, and C2H4 is found to adsorb on the step edge with a di-σ configuration, which is consistent with previously reported results.5,60 For C2H2, the adsorption energy of −2.33 eV on Pd(211) suggests a strong chemisorption, and the binding energy is slightly larger than that on Pd(111), which has an adsorption energy of −2.01 eV. However, the free adsorption energies of C2H2 on both Pd(211) and Pd(111) become relatively close with a small difference of 0.13 eV at 300 K. For C2H4, the adsorption energy of −1.21 eV on Pd(211) is larger than that on Pd(111) (−0.87 eV). In contrast to C2H2, when the temperature is considered, there is still a significant gap of 0.52 eV between the free adsorption energies of C2H4 on Pd(111) and Pd(211). The energy difference suggests that C2H4 binds much stronger onto Pd(211) than Pd(111). To further study the acetylene hydrogenation on the stepped Pd surface, the reaction energies and reaction barriers for all elementary steps were calculated. The results and transition state geometries are shown in Fig. 2.
The reaction barriers for hydrogenation reactions of C2H2, C2H3, C2H4, and C2H5 on Pd(211) were calculated to be 0.75 eV, 0.38 eV, 0.63 eV and 0.53 eV, respectively. The following observations are worth noting. (i) For the first and last hydrogenation steps, the barriers obtained on Pd(111) and Pd(211) are almost identical. However, the hydrogenation barriers of C2H3 and C2H4 are significantly reduced on Pd(211). (ii) The rate-determining step is found to be the first hydrogenation step, without considering the coverage effect, as in the reaction on Pd(111).
Recalling our previous coverage-dependent study on Pd(111),37 the reason for choosing both C2H2 and C2H3 as environmental species was that the C2H3 hydrogenation is kinetically hindered and the barrier is as high as that of the first hydrogenation step, which is the rate-limiting step on Pd(111). With the C2H3 hydrogenation barrier dropped significantly on Pd(211), the conversion rate of C2H3 become much faster than that that on Pd(111), resulting in far less C2H3 on the Pd(211) surface. Therefore, only C2H2 and H are selected as the environmental species for the coverage-dependent study. The lowered barriers should potentially impact the selectivity and activity of acetylene hydrogenation on Pd(211). We will discuss reaction kinetics in later sections.
Coverage-dependent model on Pd(211)
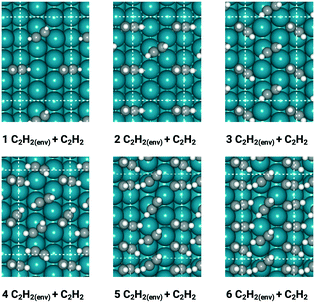
With insights from the coverage-independent model, two major adsorbates, H atom and C2H2 molecule, were selected as the environmental species, which pre-occupied the surface, to conduct the coverage-dependent kinetic modelling. The concept of differential chemisorption energy from the method section was applied to investigate both self and cross-interactions between different adsorbates versus the environmental species. The transition state energies were also rigorously calculated to add more details to the coverage-dependent microkinetic model. In general, for each coverage, all of the possible configurations are calculated, and the structure with the lowest energy is selected to obtain the differential chemisorption energy.The coverage effect caused by C2H2 as the environmental species was firstly determined, taking into account both self and cross interactions. In pursuit of higher accuracy, how to determine the accurate coverage of the surface adsorbates needs to be carefully studied; different adsorption structures on the Pd(211) surface can lead to variations in the number of sites occupied by adsorbates. For C2H2, if it adsorbs on the B5 and hcp sites, then it occupies 2 sites in the calculation of the differential chemisorption energy. The differential chemisorption energies with the adsorbate–adsorbate interactions were obtained using six different coverages to establish the two-line model. Taking the self-interaction of C2H2 as an example, the optimized structures of C2H2 adsorbed on the Pd(211) surface are illustrated in Fig. 3.
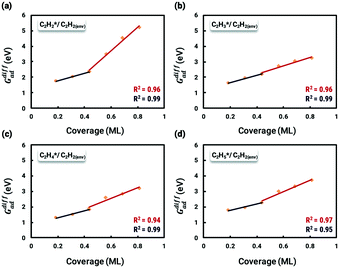
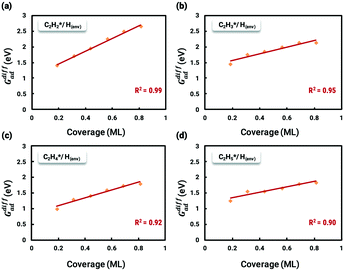
The differential chemisorption energies of all C2Hx species on the C2H2 pre-occupied surface were then calculated, and results are shown in Fig. 4. Fig. 4(a) shows the self-interaction of  /C2H2(env); when increasing the number of existing surface adsorbates, the differential chemisorption energy of the incoming molecule is weakened. This result can be simply explained by the Pauli repulsion effect and the bonding competition.61–63 When one adsorbate binds to a surface, the surface becomes inert and hinders further binding to a second adsorbate, resulting in a decrease of chemisorption energy. Therefore, the more existing adsorbates the surface possesses, the weaker the chemisorption energy becomes.
Likewise, the coverage effect caused by hydrogen atoms was rigorously studied on the Pd(211) surface (Fig. 5). Interestingly, the affected differential chemisorption energy displaces an almost uniform increasing trend, which differs from the results obtained on the Pd(111) surface, and does not show a particularly clear coverage to be distinguished between high and low coverages. This may be due to two reasons. (i) In a previous study we found that the distinction between high and low coverage is due to the sudden change in the degree to which differential chemisorption energy is affected by coverage which can also be seen from the change in the slope in the two-line model. The slopes in the low coverage region are mainly determined by the adsorbate or the transition state structure, while in the high coverage region the bonding competition with neighboring species becomes the dominant factor. However, on Pd(211), most of the adsorbates are adsorbed on the edge, and it is difficult for the environmental hydrogen atoms that adsorbed on the step side to be truly “neighboring”. This results in rather uniform changes in the coverage effect generated by H atoms. (ii) H atom is comparatively smaller, and the resulting repulsive force is more moderate. Therefore, the coverage effect caused by H atoms is described using a simplified one-line model. The self-interaction of the H atom on the stepped Pd(211) surface is found to be similar to that on Pd(111), which makes it negligible unless a very high coverage is achieved.37
In this work, a total of 8 possible cross-interactions are listed in Table 3. The three trends worth mentioning here are as follows. (i) Among all the adsorbate–adsorbate interactions, the differential chemisorption energy of C2H2 was most affected by the self-interaction of C2H2 with a slope of 2.47 in the low coverage region and 6.502 in the high coverage region. Such a high influence is mainly due to the adsorption geometry, as shown in Fig. 1. C2H2 adsorbs on the B5 site under the step edge; the stepped surface makes it closer to the pre-occupied molecules on the stepped surface, causing an increase of the intermolecular repulsion. In contrast, all other species adsorb on the edge of the stepped Pd(211) surface, making them relatively far away from the environmental molecules, resulting in less intermolecular repulsion. The geometry of adsorption is also responsible for the fact that C2H2 is exposed to the coverage effect of H atoms more than other C2Hx species. (ii) The differential chemisorption energy of the H atom was mostly affected by the coverage of C2H2 with a slope of 1.121. (iii) In contrast to the previous work, the overall coverage effect on the stepped surface may not be as dominant as on the flat surface due to the presence of edge sites.37
As previously studied in our group, the coverage effects would also significantly affect the reaction barriers.30,36,37 Transition state energies, as another critical factor, were also explicitly calculated with coverage effects. The structures of the TS–adsorbate interactions are reported in the Fig. S4–S7.† After a thorough study of the transition states at different coverages by the same method previously used for differential chemisorption energy calculations, the energies of the transition states corrected for the coverage effect are found to have a similar trend to that of the differential chemisorption energy: as the total coverage increases, the energies of the transition states become weaker. All the slopes of the interaction between the transition state and environmental species are listed in Table 4.
| Slope | ||||
|---|---|---|---|---|
| C2H2 (env) | Low coverage | High coverage | H (env) | Slope |
| C2H2–H* | 2.876 | 6.640 | C2H2–H* | 1.837 |
| C2H3–H* | 3.344 | 2.613 | C2H3–H* | 1.604 |
| C2H4–H* | 1.284 | 1.891 | C2H4–H* | 1.232 |
| C2H5–H* | 1.304 | 2.948 | C2H5–H* | 1.327 |
As seen in Table 4, the energy of the first transition state is mostly affected by the coverage effect caused by C2H2 with a slope of 6.640 in the high coverage region and a slope of 2.876 in the low coverage region. This can be rationalized by the adsorption structure of C2H2–H*, where it adsorbs on the B5 site at the step edge as shown in Fig. 3, leading to a strong repulsion caused by the other C2H2 molecules adsorbed on the step side of the Pd(211) surface. Other transition states primely adsorb on the edge, which makes them less vulnerable to the coverage effect. The reaction barrier of  is least affected by the coverage effect caused by C2H2 with a slope of 1.891 in the high coverage region and a slope of 1.284 in the low coverage region. The transition state geometry of C2H4–H* is nearly perpendicular to the bridge site of the Pd(211) edge, as can be seen in Fig. 3, which isolates it from other adsorbates. Comparing the coverage effects caused by C2H2 and H, it is clear that the contribution of C2H2 is more significant than that of H, which can be reasonably explained by the stronger differential chemisorption energy of C2H2 than that of H and also the greater number of atoms in C2H2. It is obvious when comparing the results with those on the Pd(111) surface, except for C2H2–H*, that the coverage effect on all other transition states is much smaller on Pd(211) than that on Pd(111).37
AIMD determination of the desorption barrier of ethylene on Pd(211)
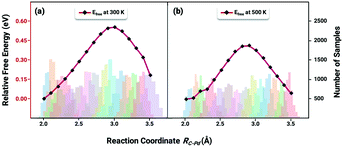
The key to resolve the underlying question of ethylene selectivity can be summarized as a contrast between the reaction barriers of the desorption process and the hydrogenation reaction of ethylene.10,37 The coverage-dependent model resolves how pre-occupied molecules influence the transition state energies and can be used to obtain the coverage-dependent barrier of C2H4 hydrogenation. The desorption free energy barrier of C2H4 was then calculated using the AIMD.64,65 According to our previous work,37 we can first set the desorption barrier of ethylene using the traditional method, and then apply the self-consistent calculation mentioned in the method section to obtain the surface coverage for the AIMD simulation. The self-consistent reaction kinetics were calculated using the coverage-effect corrected differential chemisorption energies and reaction barriers discussed in the previous sections. The surface coverages were found to be 0.84 ML at a temperature of 300 K and 0.54 ML at a temperature of 500 K.Ethylene desorption was calculated using the coordinate of the distance between one of the C atoms and the adsorbed site on the Pd surface from 2.0 Å to 3.5 Å, and a series of biased MD simulations were performed with a distance increment of 0.1 Å. An umbrella sampling with the weighted histogram analysis method (WHAM) was conducted for the ethylene desorption process on Pd(211). The 2d-WHAM code of Grossfield66 was used with the VASP code, and the Gaussian peak model was chosen for constraints.67 In Fig. 6, the lowest points of the two curves represent the most stable adsorbed states of C2H4 on the pre-occupied stepped Pd(211) surface at 300 and 500 K, respectively, and the peaks of the curves indicate the transition states in the process. The umbrella sampling method gives an ethylene desorption barrier of 0.57 eV at 300 K (Fig. 6a) and 0.43 eV at 500 K (Fig. 6b). Notably, as the desorption barrier is the key energy affecting the selectivity of this reaction system, our AIMD was stopped after the transition states were achieved to save simulation time.
Comparison of the reaction kinetics between the coverage-dependent and coverage-independent methods at 300 K
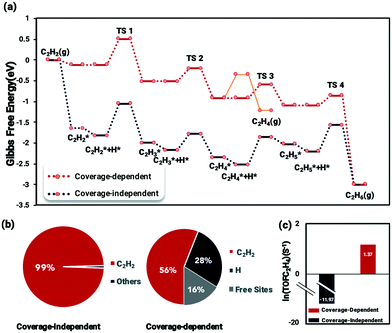
The coverage-dependent reaction kinetics of acetylene hydrogenation on the Pd(211) surface was investigated using the microkinetic method based on the energies obtained from coverage-dependent DFT calculations, and thermodynamic corrections were applied to obtain the free energy changes. The ethylene desorption barrier achieved using AIMD was added to the coverage-dependent model in order to make the kinetic calculations more exhaustive. The coverage-independent model was obtained using coverage-independent energies. Both models were conducted under the experimental conditions of 300 K temperature and 100 Torr pressure for both C2H2 and H2. Fig. 7 shows the free energy profiles, the surface distribution obtained from both the coverage-dependent and coverage-independent models and the calculated TOFs.Several interesting findings emerged when comparing the results from the coverage-dependent and coverage-independent methods (Fig. 7a). (i) Under high coverage conditions, the reaction barriers are reduced and become more processable due to the coverage effect affecting the transition state energies. This finding is consistent with previous studies.37,68 (ii) After considering the coverage effect, the rate-determining step remains to be the C2H2 hydrogenation, unlike the case on Pd(111) in which the coverage effect does decisively change the reaction rate-determining step.37 The surface coverage distribution was calculated using the self-consistent microkinetic method from the coverage-dependent model after adding the AIMD results. In the coverage-independent model (Fig. 7b), the surface was almost covered completely, being dominantly covered by C2H2 due to its more potent differential chemisorption energy. By factoring in the coverage effect, the differential chemisorption energy of C2H2 was drastically reduced, and the surface coverage calculated at the steady-state is 0.84 ML containing 0.56 ML of C2H2 and 0.28 ML of H, which is a much reasonable result. The over-estimated differential chemisorption energy of C2H2 results in a calculated ethylene TOF of 6.32 × 10⁻¹¹ s−1 (ln(TOF) = −11.07) (Fig. 7c). After obtaining the self and cross adsorbate–adsorbate interactions of each main species and the relationship between adsorbate and transition state, the TOF for the coverage-dependent model was calculated to be 3.9 s−1 (ln(TOF) = 1.37), which is closer to the experimental result.14
Kinetic analysis of activity and selectivity to ethylene on Pd(211)
The coverage-dependent microkinetic model was then used to further investigate C2H4 activity and selectivity on the stepped Pd(211) surface by taking the desorption barrier of ethylene into account. The kinetic simulations performed using the coverage-dependent microkinetic model were set in an acetylene–hydrogen mixture at temperatures of 300 K and 500 K and pressures of 100 Torr each. The resulting TOFs and selectivity were compared (Fig. 8) with the previously calculated results on Pd(111) and the experimental data collected by Molero et al.14,37 The selectivity used in this work is defined as:The activity trends of ethylene on Pd(211) and Pd(111) are similar, with a rapid increase in the TOF with increasing temperature. However, the TOFs (Fig. 8) for the stepped Pd(211) surface are much higher than both the experimental data and calculated results on Pd(111) at the investigated temperatures. The TOF of ethylene is as high as 8.74 × 10⁵ s−1 (ln(TOF) = 11.3) on Pd(211), while the TOF on Pd(111) is 1.48 × 10⁴ s−1 (ln(TOF) = 7.3). The two reasons that might contribute to the larger TOF of Pd(211) than that of Pd(111) are as follows. (i) From the reaction barrier comparison in Fig. 2, in the coverage-independent case the reaction barriers on Pd(211) are already lower than the corresponding barriers on Pd(111). (ii) The coverage effect heavily influences the transition state energies. The slope derived from the two-line model is an indicator of the extent to which the coverage effect affects these energies. As seen in Table 2, the transition state of the rate-determining step is more sharply influenced by the coverage effect on Pd(211) with a slope of 6.604 than that on Pd(111) (slope of 6.085, averaged from the two dominant environmental species: C2H2 and C2H3).37 The higher slope leads to the barrier of the rate determining step on Pd(211), which is inherently lower than the barrier on Pd(111), being more affected by the coverage effect. Numerically, the difference between the two barriers is merely about 0.04 eV in the coverage-independent case, but after considering the coverage effect, the barrier of Pd(211) at the steady state is 0.12 eV lower than that of Pd(111) with a similar surface coverage. This gap directly demonstrates that the primary contributor to the high activity on Pd(211) is the dominating influence of the coverage effect on the barrier of the rate-determining step.
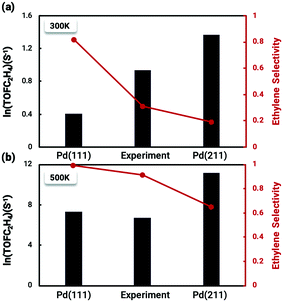 | ||
| Fig. 8 Comparison between the calculated TOF and selectivity results from the coverage-dependent microkinetic model and the experimental data from Molero et al.14 of ethylene production from acetylene hydrogenation over Pd(111) and Pd(211) at (a) 300 K and (b) 500 K. The high activity on the Pd(211) surface is primarily due to the decisive role of the coverage effect in reducing the reaction barrier of the rate-determining step, while the poor selectivity is a consequence of the inherently high chemisorption energy of ethylene on the stepped surface. The experimental value lies just in the middle of the two which may indicate that there might be two types of surface sites co-existing on the experimental catalysts. The results on Pd(111) were taken from our previous work.37 | ||
The situation is reversed regarding ethylene selectivity. The ethylene selectivity is around 0.2 at 300 K and 0.62 at 500 K on Pd(211), while the selectivity is always above 0.8 on Pd(111). The experimental values from the work of Molero et al. are 0.35 at 300 K and 0.87 at 500 K on Pd(111).14 The agreement between our calculation results and experimental values can be rationalized by the desorption barrier decreasing faster than the hydrogenation barrier of ethylene with increasing temperature. The high selectivity on Pd(111) is reasonable, given that the coverage-dependent microkinetic modelling shows that the free energy barrier for hydrogenating C2H4 is higher than the desorption barrier, which favors the desorption process. Since the selectivity is the primary focus of acetylene hydrogenation reactions, it is worthwhile to systematically investigate the reasons for such a low selectivity on Pd(211). The chemisorption energy and reaction barriers of C2H4 are chosen as the key aspects to analyze this problem.
With these analyses, it is clear that the issue of the selectivity is different from the activity. Due to the geometrical effect of the Pd(211) surface, which leads to the coverage effect becoming less influential, the poor selectivity on the Pd(211) surface is mainly caused by the inherent and excessive differential chemisorption energy of ethylene. By revealing how geometric effects can influence the role of surface coverage, we have thus demonstrated that different structures of the same catalyst can lead to vastly different activity and selectivity results.
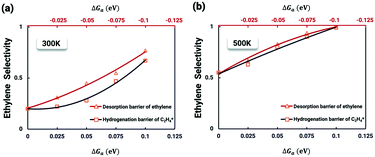
It is worth further identifying which physical quantity has the most significant effect on ethylene selectivity among surface defects. A sensitivity analysis was then performed to test which had a greater effect on selectivity, the desorption barrier of ethylene or the hydrogenation barrier of  . The sensitivity analysis was carried out based on the steady-state results obtained using the coverage-dependent microkinetic model at 300 and 500 K.37 The selected parameters are allowed to vary within a narrow range of 0.1 eV, while other factors remain constant during the test. Fig. 9 shows the resulting trends; the black curve shows the change of ethylene selectivity as the hydrogenation barrier of
  is increased, while the red curve shows the effect of decreasing the ethylene desorption barrier on the selectivity. The selectivity to ethylene increases when the desorption barrier drops or the hydrogenation barrier increases. Under low temperature conditions, as shown in Fig. 9a, we find that lowering the desorption barrier is significantly more effective in enhancing ethylene selectivity than increasing the hydrogenation barrier. The ethylene selectivity increases from 0.2 to 0.43 as the desorption barrier of ethylene is decreased by 0.05 eV; with the hydrogenation barrier being increased by 0.05 eV, the selectivity increases only by 10%. When the swing range exceeds 0.1 eV under high temperature conditions as shown in Fig. 9b, a change of either barrier will result in a selectivity higher than 99%. With the above trends, the design of Pd catalysts with reduced ethylene desorption energy barriers can help to significantly improve the selectivity to ethylene on catalysts with possible surface defects.
Conclusions
This work was motivated by two reasons. The first one was to confirm a speculation in our previous work that the difference in ethylene selectivity between the calculated results and the experiment data on Pd(111) was due to the surface defects. The second one, perhaps the more important one, is to truly understand the structural effects on the activity/selectivity of acetylene hydrogenation. Thus, an attempt to quantitatively determine ethylene activity as well as the selectivity of acetylene hydrogenation on the stepped Pd(211) surface using detailed microkinetic simulations that take the coverage effect into account is presented in order to answer how surface defects can influence reaction kinetics. Both pathways to C2H4 and C2H6 were calculated at relevant surface coverages thus explicitly accounting for all the major adsorbate–adsorbate interactions. With the thorough comparison between results obtained from Pd(111) and Pd(211), it was found that the selectivity towards C2H4 is highly structure-dependent. As a result, through rigorous calculation and kinetic analysis, an in-depth understanding of the reaction kinetics on the stepped surface was developed, and the following conclusions are reached.A coverage-independent model was first established to map out the reaction landscape of acetylene hydrogenation on the stepped Pd(211) surface. From this model, the hydrogenation barriers of C2H3 and C2H4 on Pd(211) are significantly reduced compared to Pd(111). Thus, only C2H2 and H are chosen as the environmental species for the coverage-dependent study.
The coverage-dependent microkinetic modelling was then performed self-consistently, and the coverage self and cross-interactions of adsorbates were rigorously calculated. It was found interestingly that the coverage effect has a particularly prominent effect on the differential chemisorption energy of C2H2 and its transition state energy for hydrogenation reactions compared to other species. This phenomenon is caused by a geometric effect, where Pd(211) has different active sites by its nature, with C2H2 adsorbed on the B5 site under the step edge, leading to stronger repulsion of other molecules adsorbed on the step of the Pd(211) surface.
The free energy barriers of the ethylene desorption process on Pd(211) with the surface coverage of steady states were revealed using AIMD. The free energy barriers were found to be at 0.57 eV at 300 K and 0.43 eV at 500 K, higher than the desorption barriers on Pd(111).
A high activity and low selectivity were obtained by the coverage-dependent microkinetic modelling combined with the AIMD. A quantitative analysis was carried out to explore the origin of this result. The high activity on Pd(211) is due to the dominating influence of the coverage effect on lowering the barrier of the rate-determining step. The poor selectivity is a result of the inherent and excessive chemisorption energy of ethylene on the step edge while being less influenced by the coverage effect, leading to a tendency to the further hydrogenation of C2H4 rather than the desorption.
A sensitivity analysis was performed to further investigate the ethylene selectivity of the reaction system based on our kinetic model. Similar to the results of Pd(111), both the desorption barrier of ethylene and the hydrogenation barrier of C2H4 have impacts on the selectivity to ethylene on Pd(211). Moreover, we found that lowering the desorption barrier gives better results for improving the selectivity at low temperatures.
Real Pd catalysts contain flat surface areas with surface defects, being perhaps best represented by a mixture of Pd(111) and Pd(211) surfaces. This work proposed an atomic level explanation for the differences in catalytic activity and selectivity reported in various literature studies, even for nominally identical catalysts.
Conflicts of interest
There are no conflicts to declare.Acknowledgements
We are grateful for computational support from the UK national high-performance computing service, ARCHER, for which access was obtained via the UKCP consortium and funded by the EPSRC grant ref EP/P022561/1. We are grateful to the UK Materials and Molecular Modelling Hub for computational resources, partially funded by the EPSRC (EP/P020194/1). We are grateful for access to the Queen's University Belfast Kelvin HPC service, which is partially funded by the ESPRC (EP/T022175/1). We thank Dr. Zihao Yao for the informative dissections.References
- Z. Sun, S. Wang and W. Chen, J. Mater. Chem. A, 2021, 9, 5296–5319 RSC
.
- J. F. Chen, Y. Mao, H. F. Wang and P. Hu, ACS Catal., 2019, 9, 2633–2638 CrossRef CAS
.
- G. Vilé, D. Albani, N. Almora-Barrios, N. López and J. Pérez-Ramírez, ChemCatChem, 2016, 8, 21–33 CrossRef
.
- D. S. Sholl and R. P. Lively, Nature, 2016, 532, 6–9 CrossRef PubMed
.
- B. Yang, R. Burch, C. Hardacre, G. Headdock and P. Hu, J. Catal., 2013, 305, 264–276 CrossRef CAS
.
- A. Borodziński and G. C. Bond, Catal. Rev.: Sci. Eng., 2006, 48, 91–144 CrossRef
.
- M. Larsson, J. Jansson and S. Asplund, J. Catal., 1998, 178, 49–57 CrossRef CAS
.
- S. Asplund, J. Catal., 1996, 158, 267–278 CrossRef CAS
.
- E. Vignola, S. N. Steinmann, A. Al Farra, B. D. Vandegehuchte, D. Curulla and P. Sautet, ACS Catal., 2018, 8, 1662–1671 CrossRef CAS
.
- F. Studt, F. Abild-Pedersen, T. Bligaard, R. Z. Sorensen, C. H. Christensen and J. K. Norskov, Science, 2008, 320, 1320–1322 CrossRef CAS PubMed
.
- F. Studt, F. Abild-Pedersen, T. Bligaard, R. Z. Sørensen, C. H. Christensen and J. K. Nørskov, Angew. Chem., Int. Ed., 2008, 47, 9299–9302 CrossRef CAS PubMed
.
- Y. Cao, H. Zhang, S. Ji, Z. Sui, Z. Jiang, D. Wang, F. Zaera, X. Zhou, X. Duan and Y. Li, Angew. Chem., 2020, 132, 11744–11749 CrossRef
.
- F. Huang, Y. Deng, Y. Chen, X. Cai, M. Peng, Z. Jia, J. Xie, D. Xiao, X. Wen, N. Wang, Z. Jiang, H. Liu and D. Ma, Nat. Commun., 2019, 10, 1–7 CrossRef PubMed
.
- H. Molero, B. F. Bartlett and W. T. Tysoe, J. Catal., 1999, 181, 49–56 CrossRef CAS
.
- W. J. Kim, E. W. Shin, J. H. Kang and S. H. Moon, Appl. Catal., A, 2003, 251, 305–313 CrossRef CAS
.
- L. Li, R. B. Lin, R. Krishna, X. Wang, B. Li, H. Wu, J. Li, W. Zhou and B. Chen, J. Mater. Chem. A, 2017, 5, 18984–18988 RSC
.
- G. Vilé, D. Albani, M. Nachtegaal, Z. Chen, D. Dontsova, M. Antonietti, N. López and J. Pérez-Ramírez, Angew. Chem., Int. Ed., 2015, 54, 11265–11269 CrossRef PubMed
.
- D. Duca, Z. Varga, G. La Manna and T. Vidóczy, Theor. Chem. Acc., 2000, 104, 302–311 Search PubMed
.
- D. Mei, P. A. Sheth, M. Neurock and C. M. Smith, J. Catal., 2006, 242, 1–15 CrossRef CAS
.
- M. Jørgensen and H. Grönbeck, J. Am. Chem. Soc., 2019, 141, 8541–8549 CrossRef PubMed
.
- D. Duca, G. Barone and Z. Varga, Catal. Lett., 2001, 72, 17–23 CrossRef CAS
.
- P. A. Sheth, M. Neurock and C. M. Smith, J. Phys. Chem. B, 2003, 107, 2009–2017 CrossRef CAS
.
- J. Zhao, S. Zha, R. Mu, Z. J. Zhao and J. Gong, J. Phys. Chem. C, 2018, 122, 6005–6013 CrossRef CAS
.
- Y. He, Y. Liu, P. Yang, Y. Du, J. Feng, X. Cao, J. Yang and D. Li, J. Catal., 2015, 330, 61–70 CrossRef CAS
.
- Y. Liu, J. Zhao, Y. He, J. Feng, T. Wu and D. Li, J. Catal., 2017, 348, 135–145 CrossRef CAS
.
- H. Zhou, X. Yang, L. Li, X. Liu, Y. Huang, X. Pan, A. Wang, J. Li and T. Zhang, ACS Catal., 2016, 6, 1054–1061 CrossRef CAS
.
- C. Ma, Y. Du, J. Feng, X. Cao, J. Yang and D. Li, J. Catal., 2014, 317, 263–271 CrossRef CAS
.
- S. Wang, Z. J. Zhao, X. Chang, J. Zhao, H. Tian, C. Yang, M. Li, Q. Fu, R. Mu and J. Gong, Angew. Chem., Int. Ed., 2019, 58, 7668–7672 CrossRef CAS PubMed
.
- Z. Yao, C. Guo, Y. Mao and P. Hu, ACS Catal., 2019, 9, 5957–5973 CrossRef CAS
.
- C. Guo, Y. Mao, Z. Yao, J. Chen and P. Hu, J. Catal., 2019, 379, 52–59 CrossRef CAS
.
- F. Wang, W. Xie, L. Yang, D. Xie and S. Lin, J. Catal., 2021, 396, 215–223 CrossRef CAS
.
- Y. Mao and P. Hu, Sci. China: Chem., 2020, 63, 850–859 CrossRef CAS
.
- Z. Wang, H. F. Wang and P. Hu, Chem. Sci., 2015, 6, 5703–5711 RSC
.
- Z. Yao, J. Zhao, R. J. Bunting, C. Zhao, P. Hu and J. Wang, ACS Catal., 2021, 1202–1221 CrossRef CAS
.
- M. Rellán-Piñeiro and N. López, ACS Sustainable Chem. Eng., 2018, 6, 16169–16178 CrossRef
.
- Y. Ding, Y. Xu, Y. Song, C. Guo and P. Hu, J. Phys. Chem. C, 2019, 123, 27594–27602 CrossRef CAS
.
- W. Xie, J. Xu, Y. Ding and P. Hu, ACS Catal., 2021, 4094–4106 CrossRef CAS
.
- B. Yang, R. Burch, C. Hardacre, P. Hu and P. Hughes, Catal. Sci. Technol., 2017, 7, 1508–1514 RSC
.
- M. Jørgensen and H. Grönbeck, J. Am. Chem. Soc., 2019, 141, 8541–8549 CrossRef PubMed
.
- B. Yang, R. Burch, C. Hardacre, P. Hu and P. Hughes, Surf. Sci., 2016, 646, 45–49 CrossRef CAS
.
- X.-T. Li, L. Chen, G. Wei, C. Shang and Z.-P. Liu, ACS Catal., 2020, 10, 9694–9705 CrossRef CAS
.
- G. Kresse and J. Furthmüller, Phys. Rev. B: Condens. Matter Mater. Phys., 1996, 54, 11169–11186 CrossRef CAS PubMed
.
- G. Kresse and D. Joubert, Phys. Rev. B: Condens. Matter Mater. Phys., 1999, 59, 1758–1775 CrossRef CAS
.
- J. P. Perdew, K. Burke and M. Ernzerhof, Phys. Rev. Lett., 1996, 77, 3865–3868 CrossRef CAS PubMed
.
- P. E. Blöchl, O. Jepsen and O. K. Andersen, Phys. Rev. B: Condens. Matter Mater. Phys., 1994, 49, 16223–16233 CrossRef PubMed
.
- H. F. Wang and Z. P. Liu, J. Am. Chem. Soc., 2008, 130, 10996–11004 CrossRef CAS PubMed
.
- A. Alavi, P. Hu, T. Deutsch, P. L. Silvestrelli and J. Hutter, Phys. Rev. Lett., 1998, 80, 3650–3653 CrossRef CAS
.
- A. Michaelides, Z. P. Liu, C. J. Zhang, A. Alavi, D. A. King and P. Hu, J. Am. Chem. Soc., 2003, 125, 3704–3705 CrossRef CAS PubMed
.
- Z. P. Liu and P. Hu, J. Am. Chem. Soc., 2003, 125, 1958–1967 CrossRef CAS PubMed
.
- J. Kästner, Wiley Interdiscip. Rev.: Comput. Mol. Sci., 2011, 1, 932–942 Search PubMed
.
- T. Bucko, J. Phys.: Condens. Matter, 2008, 20(6), 064211 CrossRef CAS PubMed
.
- H. A. Posch, W. G. Hoover and F. J. Vesely, Phys. Rev. A: At., Mol., Opt. Phys., 1986, 33, 4253–4265 CrossRef PubMed
.
- H. A. Posch, W. G. Hoover and F. J. Vesely, Phys. Rev. A: At., Mol., Opt. Phys., 1986, 33, 4253–4265 CrossRef PubMed
.
- L. C. Grabow, B. Hvolbæk and J. K. Nørskov, Top. Catal., 2010, 53, 298–310 CrossRef CAS
.
- N. Yang, A. J. Medford, X. Liu, F. Studt, T. Bligaard, S. F. Bent and J. K. Nørskov, J. Am. Chem. Soc., 2016, 138, 3705–3714 CrossRef CAS PubMed
.
- D. Mei, P. A. Sheth, M. Neurock and C. M. Smith, J. Catal., 2006, 242, 1–15 CrossRef CAS
.
- J. F. Chen, Y. Mao, H. F. Wang and P. Hu, ACS Catal., 2016, 6, 7078–7087 CrossRef CAS
.
- X. Sun, P. Wang, Z. Shao, X. Cao and P. Hu, Sci. China: Chem., 2019, 62, 1686–1697 CrossRef CAS
.
- J. Chen, M. Jia, P. Hu and H. Wang, J. Comput. Chem., 2021, 42, 379–391 CrossRef CAS PubMed
.
- J. Andersin and K. Honkala, Surf. Sci., 2010, 604, 762–769 CrossRef CAS
.
- K. Bleakley and P. Hu, J. Am. Chem. Soc., 1999, 121, 7644–7652 CrossRef CAS
.
- P. J. Feibelman, Phys. Rev. B: Condens. Matter Mater. Phys., 1988, 38, 12133–12138 CrossRef CAS
.
- Z. P. Liu, P. Hu and M. H. Lee, J. Chem. Phys., 2003, 119, 6282–6289 CrossRef CAS
.
- J. Xu, H. Huang and P. Hu, Phys. Chem. Chem. Phys., 2020, 22, 21340–21349 RSC
.
- C. Guo, Z. Wang, D. Wang, H. F. Wang and P. Hu, J. Phys. Chem. C, 2018, 122, 21478–21483 CrossRef CAS
.
-
A. Grossfield, WHAM: the weighted histogram analysis method,version 2.0.9 Search PubMed
.
- M. Iannuzzi, A. Laio and M. Parrinello, Phys. Rev. Lett., 2003, 90, 4 CrossRef PubMed
.
- D. Mei, M. Neurock and C. M. Smith, J. Catal., 2009, 268, 181–195 CrossRef CAS
.
Footnote |
| † Electronic supplementary information (ESI) available. See DOI: 10.1039/d1cy00665g |
| This journal is © The Royal Society of Chemistry 2021 |


