 Open Access Article
Creative Commons Attribution 3.0 Unported Licence
Coked Ni/Al2O3 from the catalytic reforming of volatiles from co-pyrolysis of lignin and polyethylene: preparation, identification and application as a potential adsorbent†
Jing
Zhao‡
a,
Zhanghong
Wang‡
b,
Dekui
Shen
 *a,
Chunfei
Wu
 *c,
Kaihong
Luo
 d and
Sai
Gu
e
aKey Laboratory of Energy Thermal Conversion and Control of Ministry of Education, School of Energy and Environment, Southeast University, Nanjing 210096, Jiangsu, PR China. E-mail: 101011398@seu.edu.cn; Tel: +86 13851706572
bCollege of Eco-Environmental Engineering, Guizhou Minzu University, Guiyang 550025, PR China
cSchool of Chemistry and Chemical Engineering, Queen's University Belfast, Belfast, BT7 1NN, UK. E-mail: c.wu@qub.ac.uk; Tel: +44 (0)2890975573
dDepartment of Mechanical Engineering, University College London, London, WC1E 7JE, UK
eFaculty of Engineering and Physical Sciences, University of Surrey, Guilford, GU2 7XH, UK
First published on 3rd May 2021
Abstract
A novel and eco-friendly C–Ni/Al2O3 composite was prepared through Ni/Al2O3 coking during the catalytic reforming of volatiles from co-pyrolysis of lignin and polyethylene. The influence of Ni loading (0–20%) in the Ni/Al2O3 catalyst and catalytic reforming temperature (500–800 °C) on the characteristics of the C–Ni/Al2O3 composite was investigated, involving the analysis of SEM, XRD, TPO and FTIR. Fibrous carbon on the C–Ni/Al2O3 composite was produced by the catalyst Ni(10%)/Al2O3 at reforming temperatures of 600 and 700 °C, which was oxidized at around 500 °C according to the TPO analysis. The maximum deposition of carbon in the C–Ni(10%)/Al2O3 composite was about 10.86%, achieved at a catalytic reforming temperature of 700 °C. Abundant oxygen-containing functional groups were observed on the C–Ni/Al2O3 composite through the FTIR analysis, leading to the outstanding adsorption performance for pollutant removal from aqueous systems. The optimal C–Ni/Al2O3 composite was selected to investigate the effect of process conditions on the adsorption performance for Pb(II), Cr(VI), rhodamine B (RhB) and methyl orange (MO). The adsorption isotherms for the four mentioned pollutants were well fitted by the Langmuir model and the maximum adsorption amount for Pb(II), Cr(VI), RhB and MO was estimated to be 223.52, 54.90, 290.76 and 95.71 mg g−1, respectively. The results indicated that the as-prepared C–Ni/Al2O3 composite had potential for the removal of heavy metal ions and hazardous organic compounds from aqueous systems.
1 Introduction
The utilization of lignin, which is the main residue in the papermaking industry, has been widely investigated in recent years, which not only can produce high-value chemicals or carbon materials, but also can reduce the impact of solid wastes on the environment.1 Co-pyrolysis is considered as a promising technique for converting solid wastes into value-added products, and adding a catalyst in the pyrolysis process can further enhance the conversion efficiency of feedstock and the yield of and selectivity to target products.2–5 Catalysts can be mixed with raw materials directly,6 or located under the raw material to catalyze the pyrolysis volatiles,7 which have different influences on the formation of products. In addition, the effects of catalytic temperature, the ratio of feedstock to catalyst, the properties of the catalyst and other parameters on the distribution of products are important for catalytic co-pyrolysis of solid wastes.8,9Carbon materials, as one of the main products from the pyrolysis of solid wastes, are mainly produced at the temperature of 250–1000 °C with a heating rate of about 5–50 °C min−1.10 These carbon materials have high specific surface areas, abundant adsorption sites, good thermal stability, and controllable morphology, and exhibit huge potential as adsorbents for removing heavy metal ions, dyes and other pollutants in wastewater.11,12 For example, biochar, one type of carbon material, produced from lignin-rich residues showed excellent adsorption capacities for heavy metal ions (Pb2+, Cu2+, Cd2+) due to well-developed pore structures, high surface area and acid groups.13 Li et al. also synthesized porous carbons by the co-pyrolysis of cyanobacteria and plastics, and applied the carbons for the treatment of wastewater containing methylene blue (MB); it was found that the as-synthesized carbon materials exhibited excellent adsorption of MB (maximum 490 mg g−1) because of the high surface area and pore volume.3 However, pure carbon materials have low dispersion and strong hydrophobicity in aqueous solution, confining their application in the adsorption treatment of wastewater.14
Carbon composites have been investigated to overcome the defects of pure carbon materials by modifying the carbon materials through oxidization, functional group grafting, and compositing with inorganic substances.15,16 For example, Chen et al. found that carbon nanotube composites decorated with Ca/Al layered double hydroxide exhibited a high adsorption capacity for U(VI), and the maximum adsorption capacity for U(VI) onto these composites was four times higher than that onto bare carbon nanotubes.17 In the study of Yari Moghaddam et al., a graphene oxide/almond shell composite fabricated by a freeze-drying method showed higher effectiveness than a pure graphene oxide in the removal of cadmium(II) and nickel(II).18 Nevertheless, a complex synthesis process is often needed for the preparation of an ideal carbon composite, which produces many by-products and requires additional costs.
The catalysts used in the catalytic pyrolysis of solid wastes are easily coked with carbon that is composed of amorphous carbon and ordered graphite carbon,19 which brings about catalyst deactivation.20,21 Although studies on the regeneration of catalysts have been addressed in many reports, the catalytic performance of catalysts ultimately reduced due to repeated regeneration treatment, and even losing the catalytic activity. Arregi et al. carried out consecutive reaction–regeneration cycles of a Ni catalyst in the catalytic steam reforming of biomass pyrolysis volatiles, finding that the catalyst is only partially regenerated by coke combustion and the deactivation in each reaction step is faster as the number of successive cycles increased due to the irreversible deactivation caused by sintering of Ni species.22 From another perspective, abundant oxygen-containing functional groups can be found in the deposited carbon on the catalyst with the migration of oxygen from the raw materials, such as biomass and lignin, which would bring new applications for the coked catalyst. Therefore, the used catalysts that have lost catalytic activity could be used for other applications.
The aim of this study is to explore the feasibility of the development of a carbon–catalyst composite and apply it as the adsorbent for the removal of heavy metal ions and dyes from aqueous solutions. The C–Ni/Al2O3 composite was produced through carbon deposition on a Ni/Al2O3 catalyst from catalytic reforming of volatiles derived from co-pyrolysis of lignin and polyethylene. SEM and TPO analyses were carried out to obtain the assembly patterns between the metal and deposited carbon, while XRD and FTIR analyses were adopted to identify the variation of metal distribution and surface functional groups of the composite against the metal loading and catalytic reforming temperature. The adsorption behavior of the composites was investigated by using Pb(II) and Cr(VI) as the model heavy metal ion pollutants and rhodamine B (RhB) and methyl orange (MO) as the model dye pollutants. The results of the adsorption experiments estimate the potential of the C–Ni/Al2O3 composite as a commercial adsorbent for the removal of heavy metal ions and dyes from water systems.
2 Materials and methods
2.1 Raw materials and chemicals
A lignin sample was extracted by using an acid precipitate method from a black liquor which was collected from a pulping company in Hunan Province, China. The detailed extraction process can be found in the literature.23 Polyethylene powder with an average Mw and Mn of about ∼4000 and ∼1700 by GPC, respectively, was purchased from Sigma-Aldrich Corporation (St. Louis, MO, USA). The proximate analysis and ultimate analysis of the lignin sample and polyethylene are presented in the ESI† (Table S1) associated with this article. Nickel nitrate hexahydrate, alumina, lead nitrate, chromic nitrate nonahydrate, rhodamine B, methyl orange, nitric acid and sodium hydroxide used in this study were all analytical reagent grade and were purchased from Nanjing Zhongdong Huabo Instrument Co. LTD. Water used in preparing solutions was purified using an ultra-pure water system (Nanopure water, Barnstead).2.2 Preparation of the C–Ni/Al2O3 composite
The co-pyrolysis sample was pretreated according to the procedure described in the literature.6 In brief, lignin was firstly impregnated in nickel nitrate solution, and then mixed with polyethylene powder after drying overnight. The concentration of metallic Ni in the co-pyrolysis sample was 1 mmol g−1 and the ratio of lignin and polyethylene was 1![[thin space (1/6-em)]](https://www.rsc.org/images/entities/char_2009.gif) :
:![[thin space (1/6-em)]](https://www.rsc.org/images/entities/char_2009.gif) 1. The catalyst used in the catalytic reforming process was Ni/Al2O3 with different Ni loadings (5, 10, 20%) prepared by an impregnation method, and the as-prepared catalyst was denoted Ni(5%)/Al2O3, Ni(10%)/Al2O3, and Ni(20%)/Al2O3, respectively.
1. The catalyst used in the catalytic reforming process was Ni/Al2O3 with different Ni loadings (5, 10, 20%) prepared by an impregnation method, and the as-prepared catalyst was denoted Ni(5%)/Al2O3, Ni(10%)/Al2O3, and Ni(20%)/Al2O3, respectively.
The catalytic reforming of the volatiles from co-pyrolysis of lignin and polyethylene was carried out in a two-stage vertical fixed bed reactor. At the beginning of the experiment, 2 g co-pyrolysis samples and 1 g Ni/Al2O3 catalyst were added in the first stage (pyrolysis zone) and second stage (catalytic reforming zone), respectively. Then, high purity nitrogen was injected into the reactor with a flow rate of 100 mL min−1 to remove air. After injecting for 20 min, the second stage was first heated to the set-point temperature with a heating rate of 40 °C min−1, and then the first stage was heated to 800 °C at a heating rate of 10 °C min−1. The residence time for the reaction was 2 h to ensure that the volatiles from the co-pyrolysis process was completely catalytically reformed. The coked Ni/Al2O3 (C–Ni/Al2O3) was collected when the furnace temperature was close to room temperature. The C–Ni/Al2O3 samples were prepared by the following catalytic reforming experiments: (1) the Ni loading on Al2O3 was 0%, 5%, 10% and 20% at the fixed catalytic reforming temperature of 600 °C, respectively, and (2) the catalytic reforming temperature was 500, 600, 700 and 800 °C with the fixed Ni loading of 10% on Al2O3, respectively. The samples were denoted C–Ni(loading)/Al2O3-temperature.
2.3 Characterization of the C–Ni/Al2O3 composite
The morphological characteristics of the as-synthesized C–Ni/Al2O3 composite were observed by scanning electron microscopy (SEM) (Inspect F50, FEI, USA). X-ray diffraction (XRD) patterns of the C–Ni/Al2O3 composite were obtained using a Smartlab XRD-3 with Kα radiation and the scans were taken at the 5–80° 2θ range. Raman spectra were determined by using a confocal LabRAM HR Evolution Raman spectroscopic system (HORIBA Scientific) with a 532 nm laser. The pyrolysis behavior and thermal stability of these C–Ni/Al2O3 composites were analyzed through temperature programmed oxidation (TPO) on a thermogravimetric analyzer (TG209 F3, Netzsch, German). About 10 mg of the C–Ni/Al2O3 composite was heated to 800 °C under 100 mL min−1 air flow at a heating rate of 10 °C min−1 and kept for 10 min. The functional group change of the C–Ni/Al2O3 composite under different conditions was qualitatively studied using a Fourier transform infrared spectroscopy (FTIR) analyzer (Nicolet 6700, Thermo Fisher Scientific, USA) with the wavenumber range of 600–4000 cm−1. The N2 adsorption/desorption isotherms of the synthesized C–Ni/Al2O3 composites were investigated by using nitrogen adsorption measurement at 77 K (Quantachrome IQ3, USA). The specific surface areas were calculated through the Brunauer–Emmett–Teller (BET) method, while the pore size distributions of the composites were obtained from the analysis of the desorption values by using the Barrett–Joyner–Halenda (BJH) method.2.4 Adsorption of heavy metal ions and dyes with the C–Ni/Al2O3 composite
Pb(II), Cr(VI), RhB and MO were chosen as model pollutants to investigate the adsorption performance of the C–Ni/Al2O3 composite that was derived from the coked Ni/Al2O3 catalyst. The solutions containing Pb(II), Cr(VI), RhB and MO were separately prepared by dissolving the corresponding nitrates or powders in deionized water. The adsorption experiments were conducted in a 100 mL screw-flask, in which a certain amount of C–Ni/Al2O3 composite (0.01 g for the adsorption of heavy metal ions and 0.05 g for the adsorption of dyes) and 50 mL model pollutant solutions were added. After adsorption, the C–Ni/Al2O3 composite was precipitated and filtered using a 0.22 μm filter. The concentrations of residual heavy metal ions and dyes in the solutions were detected using an atomic adsorption spectrometer (FAAS-M6, Thermo, USA) and a UV-vis spectrophotometer (Shimadzu UV-2600, Japan), respectively. All experiments were performed three times and the average values were presented.3 Results and discussion
3.1 Characteristics of the C–Ni/Al2O3 composite
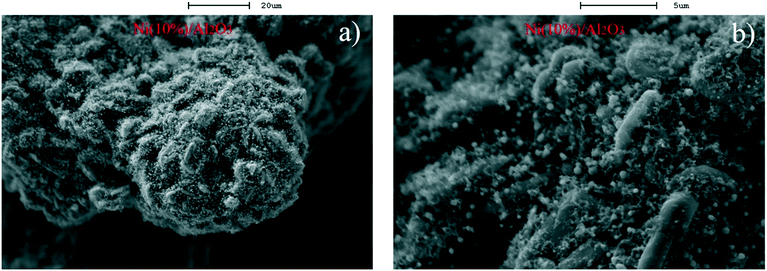 | ||
| Fig. 1 SEM images with different magnification scales of the C–Ni/Al2O3-600 °C composite with 10% Ni loading on Al2O3; a) 20 μm; b) 5 μm. | ||
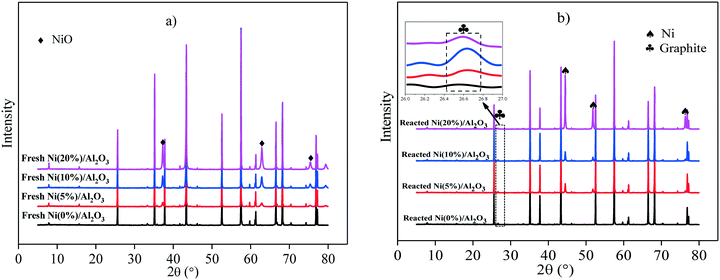
Fig. 2 depicts the XRD patterns of the fresh catalysts and reacted catalysts with different Ni loadings on Al2O3 catalytically reformed at 600 °C. As seen in Fig. 2a), typical NiO diffraction peaks at 37.3°, 63.0° and 75.6° (2θ) are present in the XRD diffraction patterns of the fresh Ni/Al2O3 catalysts, corresponding to NiO with (1 1 1), (2 2 0) and (3 1 1) crystal plane, respectively.25 It is found that the intensity of NiO-related diffraction peaks is increased gradually with the increase of Ni content in the as-prepared catalysts, and the strongest NiO diffraction peaks are found in Ni(20%)/Al2O3. The average sizes of NiO are calculated to be 5.2, 7.8 and 12.4 nm with 5%, 10% and 20% Ni loadings, respectively, suggesting that the crystal size of NiO is increased with the enhanced Ni loading on Al2O3.
As shown in Fig. 2b), metallic Ni and graphite are reflected in the XRD diffraction patterns of the reacted catalysts. It is clearly observed that metallic Ni diffraction peaks at 2θ = 44.5°, 51.8°, and 76.4° are present in the reacted Ni/Al2O3 catalysts and the diffraction peak intensity is increased with the increase of Ni loading from 5% to 20%. It is noticed that the diffraction peaks of graphite are near 26.5° (2θ) in the XRD patterns of the reacted Ni/Al2O3 catalysts with Ni loadings ranging from 5% to 20%, and the peak intensity of graphite in the patterns of the reacted Ni(10%)/Al2O3 is much stronger than that of the reacted Ni(5%)/Al2O3 and reacted Ni(20%)/Al2O3 catalysts. The SEM characterization results show that the graphitized carbon (fibrous carbon) is only distinctly observed on the Ni(10%)/Al2O3 catalyst (Fig. 1). It is possible that the amount of graphitized carbon produced over Ni(5%)/Al2O3 and Ni(20%)/Al2O3 during the catalytic reforming process was too low to be observed by SEM.
To cumulatively understand the influence of different Ni loadings on the pyrolysis behavior and thermal stability of the C–Ni/Al2O3-600 °C composite, temperature programmed oxidation (TPO) was used to analyse and the plots of TG and DTG are presented in Fig. 3. It can be found that the weight of the C–Ni(0%)/Al2O3-600 °C composite has no evident change during the whole oxidation process. From Fig. 3a), the weight of the C–Ni(5%)/Al2O3-600 °C composite reaches the maximum at around 500 °C and then hardly changes with the increased temperature. The oxidation process of the C–Ni/Al2O3-600 °C composites with Ni loadings of 10% and 20% can be divided into two stages: the first stage from 270 °C to 502 °C with a weight increment is ascribed to the oxidation of elemental Ni, and the second stage from 502 °C to 665 °C shows a significant weight loss due to the oxidative decomposition of carbon. The weight loss of the C–Ni(10%)/Al2O3-600 °C composite as 5.41% is more than that of the C–Ni(20%)/Al2O3-600 °C composite as 2.54%, confirming that a large amount of carbon was deposited on Ni(10%)/Al2O3 during the catalytic reforming process.
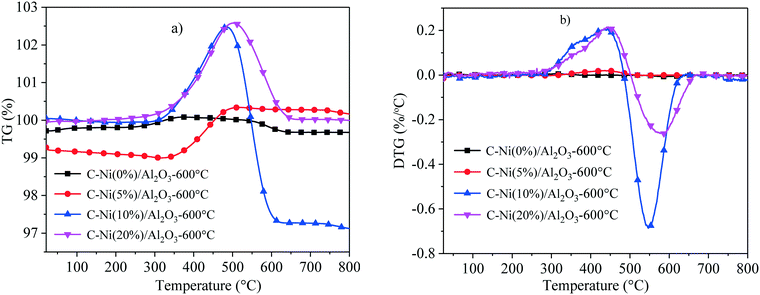 | ||
| Fig. 3 TPO curves of the C–Ni/Al2O3-600 °C composite with different Ni loadings on Al2O3; a) TG; b) DTG. | ||
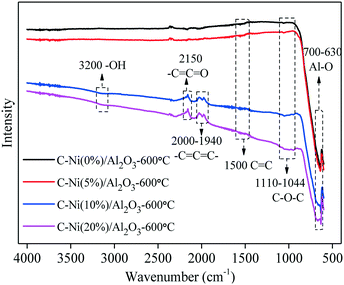
The influence of Ni loading on the functional groups of the C–Ni/Al2O3-600 °C composite is identified through FTIR analysis, as shown in Fig. 4. The absorbance of the peak at 700–630 cm−1 corresponding to the Al–O stretching vibration is related to the Al2O3 support. The absorption peak at 1110–1044 cm−1 is assigned to the C–O–C stretching vibration26 and the peak became stronger with the increase of Ni loading, which indicates that the presence of metallic Ni might facilitate the capture of oxygen-containing functional groups from the pyrolysis volatiles of lignin during the catalytic reforming process. The absorption at 1500 cm−1 attributed to the vibration of C![[double bond, length as m-dash]](https://www.rsc.org/images/entities/char_e001.gif) C is derived from the aromatic structure of the deposited carbon.27 At a higher Ni loading, the absorption of –C
C is derived from the aromatic structure of the deposited carbon.27 At a higher Ni loading, the absorption of –C![[double bond, length as m-dash]](https://www.rsc.org/images/entities/char_e001.gif) C
C![[double bond, length as m-dash]](https://www.rsc.org/images/entities/char_e001.gif) C– (2000–1940 cm−1) and –C
C– (2000–1940 cm−1) and –C![[double bond, length as m-dash]](https://www.rsc.org/images/entities/char_e001.gif) C
C![[double bond, length as m-dash]](https://www.rsc.org/images/entities/char_e001.gif) O (2150 cm−1) was detected, which is probably derived from the intermediates produced from the catalytic reforming of pyrolysis volatiles. The intermediates containing functionalities like –C
O (2150 cm−1) was detected, which is probably derived from the intermediates produced from the catalytic reforming of pyrolysis volatiles. The intermediates containing functionalities like –C![[double bond, length as m-dash]](https://www.rsc.org/images/entities/char_e001.gif) C
C![[double bond, length as m-dash]](https://www.rsc.org/images/entities/char_e001.gif) C– might be the precursors for carbon formation.25 In addition, a stretching signal corresponding to –OH functional groups appeared at 3200 cm−1 in the FTIR spectra28 of C–Ni(10%)/Al2O3-600 °C and C–Ni(20%)/Al2O3-600 °C, further confirming the effect of metallic Ni on the presence of oxygen-containing functional groups in the as-synthesized C–Ni/Al2O3 composites.
C– might be the precursors for carbon formation.25 In addition, a stretching signal corresponding to –OH functional groups appeared at 3200 cm−1 in the FTIR spectra28 of C–Ni(10%)/Al2O3-600 °C and C–Ni(20%)/Al2O3-600 °C, further confirming the effect of metallic Ni on the presence of oxygen-containing functional groups in the as-synthesized C–Ni/Al2O3 composites.
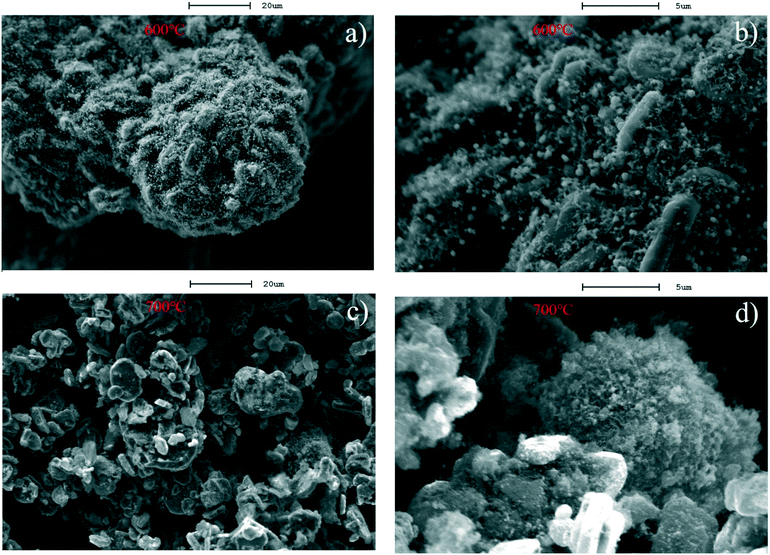 | ||
| Fig. 5 SEM images of the C–Ni(10%)/Al2O3 composite derived from catalytic reforming temperatures at 600 and 700 °C; a) and b) 600 °C and c) and d) 700 °C. | ||
XRD patterns of the C–Ni(10%)/Al2O3 composite derived from different catalytic reforming temperatures are shown in Fig. 6. It can be seen that metallic Ni diffraction peaks appeared at 2θ of 44.5°, 51.8°, and 76.4° in all the C–Ni(10%)/Al2O3 composites. It is suggested that the reduction of NiO in the catalyst took place before 500 °C. A diffraction peak of graphite at around 26.5° (2θ) was detected in the XRD patterns of the C–Ni(10%)/Al2O3 composites obtained at 600 °C and 700 °C, but it is absent in those at 500 °C and 800 °C. This indicated that the production of the graphitized carbon could be around specific temperatures during the catalytic forming process, influencing their performance in the removal of pollutants from wastewater. It is noted that the intensity of the graphite diffraction peak in the XRD pattern of the C–Ni(10%)/Al2O3 composite formed at 700 °C was much stronger than that at 600 °C, suggesting that more graphitized carbon was produced over Ni(10%)/Al2O3 at the catalytic reforming temperature of 700 °C.
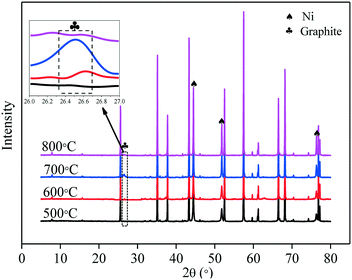 | ||
| Fig. 6 XRD patterns of the C–Ni(10%)/Al2O3 composite derived at different catalytic reforming temperatures with an inset showing details between 26° and 27°. | ||
The graphitization degree of the deposited carbon on the Ni(10%)/Al2O3 surface is also characterized by Raman spectroscopy, as depicted in Fig. S3.† Three characteristic peaks at around 1332 cm−1 (D band), 1589 cm−1 (G band), and 2770 cm−1 (2D band) were observed, corresponding to the disordered structure or defects in graphene, the sp2 C–C vibrations in graphene, and the ejection scattering of the two phonons, respectively.7,29 The relative intensity ratio of the D band and G band (ID/IG) is usually used to evaluate the degree of the defects or graphitization of carbon materials. As shown in Fig. S3,† the ID/IG ratios are 2.90, 2.86, 2.66, and 2.99 for C–Ni(10%)/Al2O3-500 °C, C–Ni(10%)/Al2O3-600 °C, C–Ni(10%)/Al2O3-700 °C, and C–Ni(10%)/Al2O3-800 °C, respectively, which are all greater than 2, implying that the carbon deposited on the Ni(10%)/Al2O3 catalyst contains many defects. The ID/IG ratio of the C–Ni(10%)/Al2O3-700 °C composite is the smallest among the values of the four samples, demonstrating the presence of more graphitized carbon on Ni(10%)/Al2O3 at the catalytic reforming temperature of 700 °C, which is consistent with the characterization results of XRD displayed in Fig. 6.
Fig. 7 shows the TPO plots of the C–Ni(10%)/Al2O3 composites derived at different catalytic reforming temperatures from 500 to 800 °C. It is found that the weight of the C–Ni(10%)/Al2O3 composites derived at 600, 700 and 800 °C are all firstly increased and then decreased, while the weight of the C–Ni(10%)/Al2O3 composite obtained at 500 °C is firstly decreased and then increased. The weight increment of the C–Ni(10%)/Al2O3 composites obtained at higher catalytic reforming temperatures is ascribed to the oxidation of metallic Ni in the composite, and the subsequent weight decrease is attributed to the oxidative decomposition of deposited carbon in the composite. The TPO temperature corresponding to the carbon decomposition for the C–Ni(10%)/Al2O3 composite is from 507 °C to 710 °C, while those at the catalytic reforming temperature of 600 °C and 800 °C are from 475 °C to 650 °C and from 477 °C to 618 °C, respectively. It is indicated that the thermal stability of the carbon deposited on Ni(10%)/Al2O3 at the catalytic reforming temperature of 700 °C was higher than that of the carbon deposited on the composites derived at 600 °C and 800 °C. The weight loss percentage of the C–Ni(10%)/Al2O3 composites obtained at 600, 700, and 800 °C is identified to be 5.41%, 10.86% and 1.13%, respectively. It can be concluded that the C–Ni(10%)/Al2O3 composite obtained at the catalytic reforming temperature of 700 °C possesses the highest content of carbon deposition with significant thermal stability.
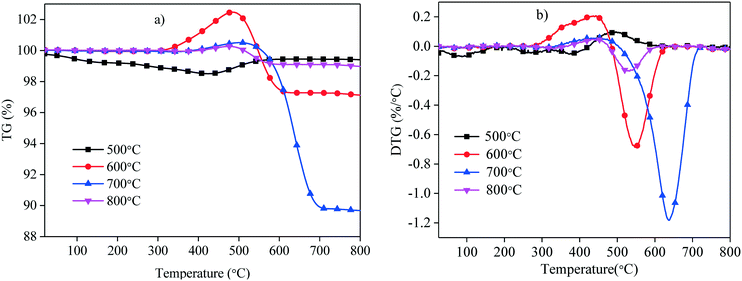 | ||
| Fig. 7 TPO curves of the C–Ni(10%)/Al2O3 composite derived at different catalytic reforming temperatures; a) TG; b) DTG. | ||
Fig. 8 depicts the FTIR spectra of the C–Ni(10%)/Al2O3 composites prepared at different catalytic reforming temperatures (500, 600, 700, 800 °C). It can be found that the bands at 3200 cm−1 and 1110–1044 cm−1 correspond to the stretching vibration peaks of OH groups and C–O–C groups, respectively. These vibration peaks appear in the FTIR spectra for all the C–Ni(10%)/Al2O3 composites, and the change of catalytic reforming temperature shows no obvious influence on the peak intensity of oxygen-containing functional groups of the obtained C–Ni(10%)/Al2O3 composites. The absorption bands at around 1500 cm−1 representing the stretching aromatic skeleton vibrations (C![[double bond, length as m-dash]](https://www.rsc.org/images/entities/char_e001.gif) C) are observed in all the FTIR spectra of the C–Ni(10%)/Al2O3 composites and the peak intensity becomes stronger with an increase of catalytic reforming temperature, indicating that the increase of catalytic reforming temperature is conducive to the formation of deposited carbon. The absorptions of –C
C) are observed in all the FTIR spectra of the C–Ni(10%)/Al2O3 composites and the peak intensity becomes stronger with an increase of catalytic reforming temperature, indicating that the increase of catalytic reforming temperature is conducive to the formation of deposited carbon. The absorptions of –C![[double bond, length as m-dash]](https://www.rsc.org/images/entities/char_e001.gif) C
C![[double bond, length as m-dash]](https://www.rsc.org/images/entities/char_e001.gif) C– (2000–1940 cm−1) and –C
C– (2000–1940 cm−1) and –C![[double bond, length as m-dash]](https://www.rsc.org/images/entities/char_e001.gif) C
C![[double bond, length as m-dash]](https://www.rsc.org/images/entities/char_e001.gif) O (2150 cm−1) are absent in the FTIR spectra of the C–Ni(10%)/Al2O3 composite derived at 500 °C, which is probably attributed to the lack of the intermediates produced from the catalytic reforming of pyrolysis volatiles at a lower temperature.
O (2150 cm−1) are absent in the FTIR spectra of the C–Ni(10%)/Al2O3 composite derived at 500 °C, which is probably attributed to the lack of the intermediates produced from the catalytic reforming of pyrolysis volatiles at a lower temperature.
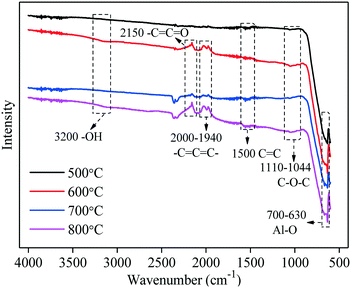 | ||
| Fig. 8 FTIR spectra of the C–Ni(10%)/Al2O3 composite derived at different catalytic reforming temperatures. | ||
The N2 adsorption–desorption isotherms and pore size distribution of the four C–Ni(10%)/Al2O3 composites obtained at the catalytic reforming temperatures from 500 °C to 800 °C are illustrated in Fig. S4.† It can be found from Fig. S4a)† that all the N2 sorption isotherms belong to type IV with H3 hysteresis loops, indicating the presence of mesopores in the as-prepared materials, which is similar to the report of Cai et al. who synthesized Fe–Ni catalysts encapsulated in oxidized carbon nanotubes from fast pyrolysis of waste plastics using Fe–Ni–Al2O3 catalysts.7 The pore size distribution shown in Fig. S4b)† further demonstrates the mesoporous structure of the C–Ni(10%)/Al2O3 composites with distinguished mesopore distribution peaks at around 22.47 nm, 26.81 nm, 26.76 nm, and 22.52 nm. The calculated specific surface areas of C–Ni(10%)/Al2O3-500 °C, C–Ni(10%)/Al2O3-600 °C, C–Ni(10%)/Al2O3-700 °C, and C–Ni(10%)/Al2O3-800 °C are 168.55 m2 g−1, 152.33 m2 g−1, 147.35 m2 g−1, and 166.40 m2 g−1, respectively, which are decreased firstly and then increased with the enhanced catalytic reforming temperatures.
3.2 Adsorption performance of the C–Ni/Al2O3 composite
Batch adsorption experiments of the C–Ni/Al2O3 composites were conducted to investigate the effects of Ni loading in the catalyst (0–20%) and catalytic reforming temperature (500–800 °C) on the removal of heavy metal ions (Pb(II) & Cr(VI)) and dyes (RhB & MO) from wastewater. The adsorption results are shown in Fig. 9.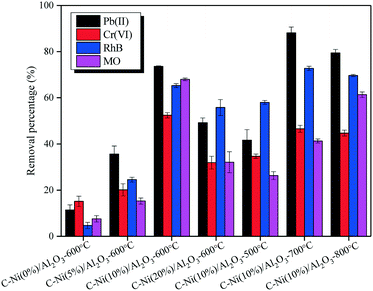 | ||
| Fig. 9 Heavy metal ions (Pb(II) & Cr(VI)) and dyes (RhB & MO) adsorbed on the C–Ni/Al2O3 composites obtained under different catalytic reforming conditions. | ||
Comparing the adsorption performance of the C–Ni/Al2O3-600 °C composites prepared with different Ni loadings, it is found that the removal percentages for Pb(II), Cr(VI), RhB and MO are all dramatically improved with the Ni loading increased from 0 to 10 and then decreased with the Ni loading on Al2O3 increased to 20%. For both heavy metal ions and dyes, the maximum removal percentage is achieved in the case of using the C–Ni(10%)/Al2O3-600 °C composite, suggesting that graphitized carbon with abundant oxygen-containing functional groups has a better adsorption property for the removal of pollutants from wastewater.30,31 However, increasing the catalytic reforming temperature shows different influences on the removal of the four pollutants from aqueous solution. The maximum adsorption of Pb(II) and RhB is achieved at 700 °C with the removal percentage of 88.14% and 72.75%, respectively, while the highest removal percentage for Cr(VI) and MO was 52.42% and 67.99% at 600 °C, respectively. The adsorption of Pb(II) was stronger than that of Cr(VI) and the removal percentage for RhB was always higher than that for MO by using all the C–Ni(10%)/Al2O3 composites regardless of the catalytic reforming temperature. Thus, it is concluded that the C–Ni(10%)/Al2O3-700 °C composite was the best adsorbent for the removal of Pb(II) and RhB, while the C–Ni(10%)/Al2O3-600 °C composite was the optimal for the adsorption of Cr(VI) and MO.
Based on the results above, the adsorption performance of the C–Ni(10%)/Al2O3-700 °C composite and C–Ni(10%)/Al2O3-600 °C composite is further investigated under different adsorption conditions including initial concentrations, contact time, ambient temperature and solution pH. The relevant experimental results are presented in the ESI† (Fig. S5–S8).
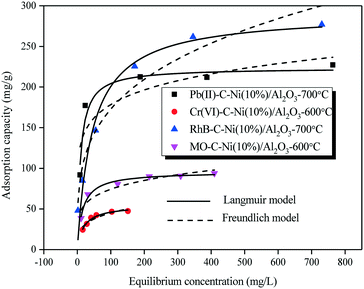 | ||
| Fig. 10 Adsorption isotherms of heavy metal ions (Pb(II) & Cr(VI)) and dyes (RhB & MO) adsorbed on the C–Ni/Al2O3 composites. | ||
| Pb(II)–C–Ni(10%)/Al2O3-700 °C | Cr(VI)–C–Ni(10%)/Al2O3-600 °C | RhB–C–Ni(10%)/Al2O3-700 °C | MO–C–Ni(10%)/Al2O3-600 °C | |
|---|---|---|---|---|
| Langmuir | ||||
| Q m (mg g−1) | 223.52 | 54.90 | 290.76 | 95.71 |
| K l (L mg−1) | 0.11 | 0.05 | 0.02 | 0.06 |
| R 2 | 0.941 | 0.945 | 0.956 | 0.979 |
| Freundlich | ||||
| K f (mg(1−n) Ln g−1) | 94.00 | 13.55 | 48.01 | 30.15 |
| n | 7.19 | 3.83 | 3.60 | 5.10 |
| R 2 | 0.743 | 0.858 | 0.948 | 0.874 |
The Langmuir model was better fitted to the isotherms of the C–Ni/Al2O3 composite with the higher values (0.941–0.979) of the correlation coefficient (R2) obtained from the Langmuir model compared to the Freundlich model. Similar observations were reported in the published studies.34–36 However, according to the study of Abukhadra et al.,37 the Freundlich model showed a better fitting than the Langmuir model and Temkin model in simulating the adsorption of Pb2+ and Cr6+ using kaolinite nanotubes as adsorbents. It is worth noting that the R2 for RhB adsorption calculated based on the Freundlich model as 0.948 was very close to that based on the Langmuir model (0.956), suggesting that both the Langmuir model and Freundlich model can well describe the adsorption of RhB. This might be ascribed to both homogeneous monolayer adsorption and heterogeneous multilayer adsorption that occurred during the adsorption process of RhB onto the C–Ni/Al2O3 composite.
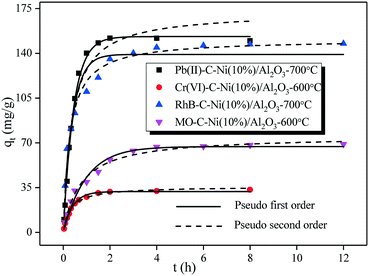 | ||
| Fig. 11 Adsorption kinetics of heavy metal ions (Pb(II) & Cr(VI)) and dyes (RhB & MO) adsorbed on the C–Ni/Al2O3 composites. | ||
| Pb(II)–C–Ni(10%)/Al2O3-700 °C | Cr(VI)–C–Ni(10%)/Al2O3-600 °C | RhB–C–Ni(10%)/Al2O3-700 °C | MO–C–Ni(10%)/Al2O3-600 °C | |
|---|---|---|---|---|
| Q exp (mg g−1) | 149.78 | 33.31 | 147.51 | 68.91 |
| Pseudo-first-order model | ||||
| K 1 (h−1) | 2.26 | 2.49 | 2.53 | 1.03 |
| Q e (mg g−1) | 153.07 | 31.99 | 139.14 | 67.05 |
| R 2 | 0.995 | 0.993 | 0.912 | 0.975 |
| Pseudo-second-order model | ||||
| K 2 (g mg−1 h−1) | 0.02 | 0.09 | 0.02 | 0.02 |
| Q e (mg g−1) | 172.51 | 35.89 | 150.93 | 75.40 |
| R 2 | 0.961 | 0.991 | 0.983 | 0.988 |
Conclusions
In this work, C–Ni/Al2O3 composites derived from the catalytic reforming of volatiles from co-pyrolysis of lignin and polyethylene are used as green adsorbents for the removal of heavy metal ions (Pb(II) & Cr(VI)) and dyes (RhB & MO) from aqueous solutions. The results show that the composition, morphological structure and thermal stability of the carbon deposited on Ni/Al2O3 is significantly influenced by Ni loading in Ni/Al2O3 and the catalytic reforming temperature. In addition, the capture of oxygen-containing functional groups can be enhanced by the higher Ni loading and catalytic reforming temperature, promoting the adsorption of heavy metal ions and dyes. Furthermore, the C–Ni(10%)/Al2O3 composites obtained at the catalytic reforming temperatures of 600 and 700 °C are estimated as the optimal adsorbents for the adsorption of Pb(II), Cr(VI), RhB and MO from aqueous systems. The results show that the adsorption of the C–Ni/Al2O3 composites is dominated by homogeneous monolayer adsorption better fitted by the Langmuir model. The relationship between the equilibrium adsorption capacity of heavy metal ions and contact time can be well described by the pseudo-first-order kinetic model, while the pseudo-second-order kinetic model gives better fitting for the adsorption of dyes. Therefore, the C–Ni/Al2O3 composite is considered as an environment-friendly and highly efficient adsorbent for treating wastewater containing heavy metal ions and dyes.Conflicts of interest
There are no conflicts to declare.Acknowledgements
The authors greatly acknowledge the funding support from the projects supported by the National Natural Science Foundation of China (grant no. 51861145102), the Jiangsu Provincial Key Research and Development Program (BE2020114) and the Royal Society International Exchange Scheme (IE150760). Additionally, we deeply appreciate the help from Mrs. Ann Lowry (Technical Manager of the Microscopy Suite, School of Environmental Sciences, University of Hull) and Mr. Garry S Robinson (School of Engineering and Computer Science, University of Hull) on analysing the results of SEM.Notes and references
- H. Chen, Z. Zhang, X. Zhong, Z. Zhuo, S. Tian, S. Fu, Y. Chen and Y. Liu, J. Hazard. Mater., 2021, 408, 124847 CrossRef CAS PubMed.
- L. Xu, Z. He, H. Zhang, S. Wu, C. Dong and Z. Fang, Bioresour. Technol., 2021, 320, 124252 CrossRef CAS PubMed.
- L. Li, J. Wang, C. Jia, Y. Lv and Y. Liu, J. Water Process Eng., 2021, 39, 101753 CrossRef.
- J. Wang, Z. Zhong, K. Ding, B. Zhang, A. Deng, M. Min, P. Chen and R. Ruan, Energy, 2017, 133, 90–98 CrossRef CAS.
- X. Zhang, H. Lei, L. Zhu, X. Zhu, M. Qian, G. Yadavalli, J. Wu and S. Chen, Bioresour. Technol., 2016, 220, 233–238 CrossRef CAS PubMed.
- Z. Wang, G. Liu, D. Shen, C. Wu and S. Gu, J. Energy Inst., 2020, 93, 281–291 CrossRef CAS.
- N. Cai, H. Yang, X. Zhang, S. Xia, D. Yao, P. Bartocci, F. Fantozzi, Y. Chen, H. Chen and P. T. Williams, Waste Manage., 2020, 109, 119–126 CrossRef CAS.
- V. Claude, J. G. Mahy, J. Geens and S. D. Lambert, Mater. Today Chem., 2019, 13, 98–109 CrossRef CAS.
- J. C. Acomb, C. Wu and P. T. Williams, J. Anal. Appl. Pyrolysis, 2015, 113, 231–238 CrossRef CAS.
- L. Cao, I. K. M. Yu, Y. Liu, X. Ruan, D. C. W. Tsang, A. J. Hunt, Y. S. Ok, H. Song and S. Zhang, Bioresour. Technol., 2018, 269, 465–475 CrossRef CAS PubMed.
- C. Duan, T. Ma, J. Wang and Y. Zhou, J. Water Process Eng., 2020, 37, 101339 CrossRef.
- Z. Wang, D. Shen, C. Wu and S. Gu, Green Chem., 2018, 20, 5031–5057 RSC.
- B. Wang, M. Ran, G. Fang, T. Wu and Y. Ni, Materials, 2020, 13, 1037 CrossRef CAS PubMed.
- K. Y. B. Xing, Chem. Rev., 2010, 110, 5989–6008 CrossRef.
- M. Chegeni, S. Etemadpour and M. H. Fekri, Phys. Chem. Res., 2021, 9, 1–16 CAS.
- H. El-Ahwany, W. Abddellah and R. El-Sheikh, Arab Journal of Nuclear Sciences and Applications, 2020, 1–17 CrossRef.
- H. Chen, Z. Chen, G. Zhao, Z. Zhang, C. Xu, Y. Liu, J. Chen, L. Zhuang, T. Haya and X. Wang, J. Hazard. Mater., 2018, 347, 67–77 CrossRef CAS PubMed.
- N. Yari Moghaddam, B. Lorestani, M. Cheraghi and S. Jamehbozorgi, Water Environ. Res., 2019, 91, 475–482 CrossRef CAS PubMed.
- C. Wu, Z. Wang, P. T. Williams and J. Huang, Sci. Rep., 2013, 3, 2742 CrossRef PubMed.
- E. Fernandez, M. Amutio, M. Artetxe, A. Arregi, L. Santamaria, G. Lopez, J. Bilbao and M. Olazar, Process Saf. Environ. Prot., 2021, 145, 52–62 CrossRef CAS.
- E. Heracleous, E. Pachatouridou, A. M. Hernández-Giménez, H. Hernando, T. Fakin, A. L. Paioni, M. Baldus, D. P. Serrano, P. C. A. Bruijnincx, B. M. Weckhuysen and A. A. Lappas, J. Catal., 2019, 380, 108–122 CrossRef CAS.
- A. Arregi, G. Lopez, M. Amutio, I. Barbarias, L. Santamaria, J. Bilbao and M. Olazar, J. Ind. Eng. Chem., 2018, 68, 69–78 CrossRef CAS.
- J. Hu, R. Xiao, D. Shen and H. Zhang, Bioresour. Technol., 2013, 128, 633–639 CrossRef CAS PubMed.
- J. Alvarez, S. Kumagai, C. Wu, T. Yoshioka, J. Bilbao, M. Olazar and P. T. Williams, Int. J. Hydrogen Energy, 2014, 39, 10883–10891 CrossRef CAS.
- Z. Zhang, X. Hu, L. Zhang, Y. Yang, Q. Li, H. Fan, Q. Liu, T. Wei and C.-Z. Li, Fuel Process. Technol., 2019, 191, 138–151 CrossRef CAS.
- N. Labbé, D. Harper and T. Rials, J. Agric. Food Chem., 2006, 54, 3492–3497 CrossRef PubMed.
- H. Zhang, B. Yu, W. Zhou, X. Liu and F. Chen, Int. J. Biol. Macromol., 2018, 109, 1232–1238 CrossRef CAS PubMed.
- L. Santamaria, G. Lopez, A. Arregi, M. Amutio, M. Artetxe, J. Bilbao and M. Olazar, Appl. Catal., B, 2019, 242, 109–120 CrossRef CAS.
- D. Xu, Y. Xiong, J. Ye, Y. Su, Q. Dong and S. Zhang, Chem. Eng. J., 2020, 392, 123728 CrossRef CAS.
- X. Yang, Y. Wan, Y. Zheng, F. He, Z. Yu, J. Huang, H. Wang, Y. S. Ok, Y. Jiang and B. Gao, Chem. Eng. J., 2019, 366, 608–621 CrossRef CAS.
- A. S. K. Kumara, S.-J. Jiang and W.-L. Tseng, J. Mater. Chem. A, 2015, 3, 7044–7057 RSC.
- A. Almasi, M. Omidi, M. Khodadadian, R. Khamutian and M. B. Gholivand, Toxicol. Environ. Chem., 2012, 94, 660–671 CrossRef CAS.
- R. M. Ali, H. A. Hamad, M. M. Hussein and G. F. Malash, Ecol. Eng., 2016, 91, 317–332 CrossRef.
- U. Khalil, M. Bilal Shakoor, S. Ali, M. Rizwan, M. Nasser Alyemeni and L. Wijaya, J. Saudi Chem. Soc., 2020, 24, 799–810 CrossRef CAS.
- X. Liu, J. Tian, Y. Li, N. Sun, S. Mi, Y. Xie and Z. Chen, J. Hazard. Mater., 2019, 373, 397–407 CrossRef CAS PubMed.
- W. N. Nyairo, Y. R. Eker, C. Kowenje, I. Akin, H. Bingol, A. Tor and D. M. Ongeri, Sep. Sci. Technol., 2018, 53, 1498–1510 CrossRef CAS.
- M. R. Abukhadra, B. M. Bakry, A. Adlii, S. M. Yakout and M. E. El-Zaidy, J. Hazard. Mater., 2019, 374, 296–308 CrossRef CAS PubMed.
Footnotes |
| † Electronic supplementary information (ESI) available. See DOI: 10.1039/d1cy00448d |
| ‡ These two authors contributed equally to the manuscript. |
| This journal is © The Royal Society of Chemistry 2021 |

