 Open Access Article
Creative Commons Attribution 3.0 Unported Licence
Studies of propene conversion over H-ZSM-5 demonstrate the importance of propene as an intermediate in methanol-to-hydrocarbons chemistry†
Alexander P.
Hawkins
 ab,
Andrea
Zachariou
 ab,
Stewart F.
Parker
 bc,
Paul
Collier
d,
Russell F.
Howe
 e and
David
Lennon
 *ab
*ab
aSchool of Chemistry, University of Glasgow, Joseph Black Building, Glasgow G12 8QQ, UK. E-mail: David.Lennon@glasgow.ac.uk
bUK Catalysis Hub, Research Complex at Harwell, STFC Rutherford Appleton Laboratory, Chilton, Oxon OX11 0FA, UK
cISIS Neutron and Muon Source, STFC Rutherford Appleton Laboratory, Chilton, Oxon OX11 0QX, UK
dJohnson Matthey Technology Centre, Blounts Court, Sonning Common, Reading RG4 9NH, UK
eDepartment of Chemistry, University of Aberdeen, Aberdeen, AB24 3UE, UK
First published on 1st March 2021
Abstract
To investigate its role as an intermediate in methanol-to-hydrocarbons (MTH) chemistry, the reaction of propene over H-ZSM-5 zeolite at temperatures of 473, 573 and 673 K is studied over a period of 6 hours and the post-reaction catalysts examined by inelastic neutron scattering and ancillary analytical techniques. Low temperatures favour production of gasoline-range alkanes and alkenes, whilst the product distribution shifts to a primarily aromatic product stream as reaction temperature increases, with cyclopentadienyl intermediates from the aromatic formation process being detected spectroscopically in the reacted catalysts. The 473 K reaction deactivates the zeolite due to pore blockage from the growth of large, branched oligomer chains but coke build-up at higher temperatures is minimal and primarily consists of pure carbon. No evidence of immobilised poly-methylated aromatic species is observed at any temperature. A scheme for the full propene reaction series is proposed that involves a dual-cycle hydrocarbon pool mechanism like that found in MTH chemistry and supporting propene's role as an intermediate in that process. Minor differences in the product distribution of the propene-only reactions compared to classical MTH chemistry are identified due to the lack of a significant methylation reaction pathway that results in a more restricted range of substituted products.
Introduction
The reactions of propene over zeolite catalysts play a role in several important processes in the industrial production of hydrocarbons. When exposed to such solid acids, alkenes such as propene undergo protonation to form alkoxide cations which are active in oligomerization and isomerisation reactions. While these reactions are of interest in themselves as a source of synthetic fuels and platform chemicals,1–3 further interest in these reactions arises from the possibility that they play a role in the methanol-to-hydrocarbons (MTH) reaction, an important reaction for upgrading alternative fuel sources into commercially valuable hydrocarbons.4,5 Extensive studies of the MTH reaction over the 40 years since it was first commercialised have established that it proceeds via a ‘hydrocarbon pool mechanism’ where an internal population of alkenes and aromatics act as co-catalysts, undergoing a continuous cycle of addition, isomerisation and cracking reactions to give the final products, which are primarily light olefins and methylated aromatics.5–8 However, the means by which this hydrocarbon pool is formed from the methanol feedstock, particularly the product of the first C–C bond formation reactions in the zeolite, has been a matter of further debate. Studies have suggested that the initial C–C bonded species produced are propene and other light olefins.9,10 It is the reactions of these olefin products which form the starting population of the hydrocarbon pool, the establishment of which completes the conditioning of the MTH catalyst.11–13Howe and co-workers have recently shown that operando spectroscopic methods can observe the formation of these transient olefin intermediates within H-ZSM-5 zeolites dosed with methanol at typical MTH reaction temperatures.14 The study also followed the subsequent consumption of olefins to form higher oligomers and cyclopentadienyl (CPD) cations, both of which are known to form as part of the hydrocarbon pool cycle in MTH reactions,15 with the cyclopentadienyl ions representing a key intermediate in the formation of aromatic product and hydrocarbon pool species.16 It follows that the products of the propene/zeolite reaction system at temperatures typical of MTH reactions (450–700 K)17 should therefore closely correspond to MTH product mixtures in similar conditions, which are determined by the pore structure of the specific zeolite employed. In this study we have sought to test this hypothesis and to extend the reaction timeframe studied by an investigation of the reactivity of propene from 473–673 K over H-ZSM-5 zeolite, chosen because of its wide use in MTH catalysis seeking to produce gasoline range products.17 Both on-line and ex situ analysis has been used to quantify the products of these reactions enabling determination of the specific reactions occurring within the zeolite at each temperature and their subsequent comparison with the reactions of methanol in similar zeolites, on which there is an extensive literature.
In addition, the used catalysts have also been investigated to characterise the species which remain trapped within the zeolite pore structure, since these species can function as active catalytic centres in the hydrocarbon pool mechanism and contribute to eventual catalyst deactivation through pore blocking. To this end, the technique of inelastic neutron scattering (INS) spectroscopy is employed, which has advantages in the study of zeolite-characterised systems due to the low scattering cross sections of the zeolite nuclei allowing observation of the hydrocarbon vibrational modes below 2000 cm−1 without interference from framework bands.18 Combined with the penetrating nature of neutrons as a probe, this allows characterisation of the retained coke species, including those in the interior of the H-ZSM-5 crystallites. The zeolite catalyst remains unchanged and available for further analysis or additional reactions, an improvement over methods such as Guisnet analysis, which requires the removal of the zeolite framework by treatment with hydrofluoric acid in order to extract trapped species for testing.19 Thus, the article provides a holistic view on the pivotal role of propene as an intermediate in MTH chemistry over ZSM-5; providing insight as to product forming pathways and deactivation channels. Intrinsically, the work additionally connects to aspects of methanol-to-olefin (MTO) chemistry.6,11,16
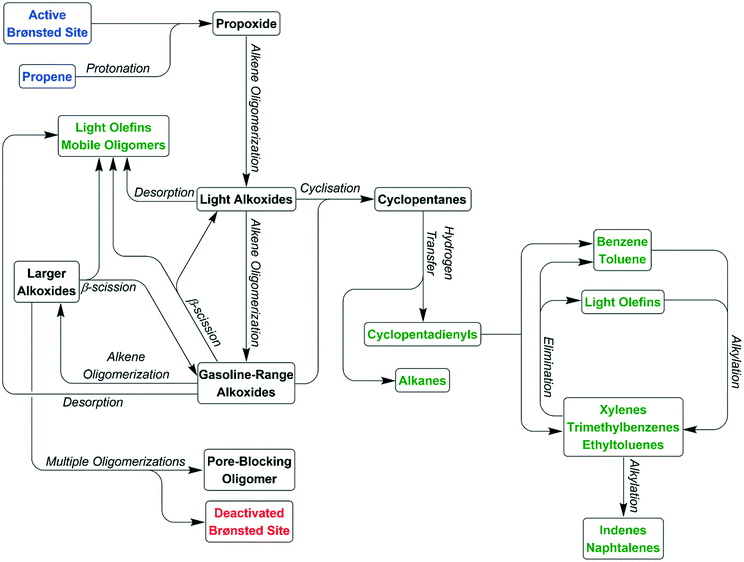
The paper is constructed as follows. On the basis of experimental observations and subsequent analysis within the Results section, Schemes 1 and 2 are presented in the Discussion section to account for how propene features in, respectively, the alkene and arene cycles of the hydrocarbon pool mechanism. Scheme 3 brings these contributing concepts together in to a single scheme that indicates how, depending on reaction conditions, the reaction of propene over ZSM-5 leads to a varied product slate. These deductions include identification of a deactivation pathway.
Experimental
Reaction testing
The ZSM-5 used was a powder form commercial material grade H-ZSM-5 zeolite supplied by Johnson Matthey and calcined in air for 12 hours at 773 K to remove the residual synthesis template. Pre-reaction characterisation of the zeolite showed it to possess a framework Si![[thin space (1/6-em)]](https://www.rsc.org/images/entities/char_2009.gif) :
:![[thin space (1/6-em)]](https://www.rsc.org/images/entities/char_2009.gif) Al ratio of 30
Al ratio of 30![[thin space (1/6-em)]](https://www.rsc.org/images/entities/char_2009.gif) :
:![[thin space (1/6-em)]](https://www.rsc.org/images/entities/char_2009.gif) 1 as assessed by SS-NMR. Scanning electron microscopy revealed crystal sizes in the 0.2–1.0 μm range; typical crystallite size dimensions being 0.1 × 0.1 × 0.5 μm (ref. 20) The calcined catalyst was sieved to provide consistent crystallite agglomeration sizes in the 200–500 μm range.
1 as assessed by SS-NMR. Scanning electron microscopy revealed crystal sizes in the 0.2–1.0 μm range; typical crystallite size dimensions being 0.1 × 0.1 × 0.5 μm (ref. 20) The calcined catalyst was sieved to provide consistent crystallite agglomeration sizes in the 200–500 μm range.
The propene conversion reactions were carried out at the ISIS Facility's sample preparation laboratory using a gas handling reaction system designed for the testing of catalyst systems; the layout and development of this system is described by Warringham, et al.21 Three cylindrical steel sample cells equipped with gas handling fittings were loaded with ∼17 g of zeolite in order to prepare sufficient material for both INS and ex situ analysis. This resulted in cylindrical fixed bed reactor with the bed having a diameter of 35 mm and a length of 45 mm, this geometry being chosen in order to minimise bed length effects and maximise the homogeneity of the reacted catalyst samples. The reaction temperatures for each sample were 473 K, 573 K and 673 K: full details of the conditions of each reaction are given in Table 1.
| Sample | Reaction temperature (K) | Mass zeolite (g) | Propene flow (cm3 min−1) | Helium flow (cm3 min−1) |
|---|---|---|---|---|
| ZSM5_Prop_473K | 473 K | 16.49 | 147 | 147 |
| ZSM5_Prop_573K | 573 K | 17.02 | 151 | 151 |
| ZSM5_Prop_673K | 673 K | 17.47 | 155 | 155 |
Each charged reactor was mounted on the reaction rig, heated to 573 K under flowing helium (100 cm3 min−1, BOC, >99.999%) at a rate of 5 K min−1 using the tube furnace incorporated into the rig and maintained at this temperature for 3 hours in order to remove adsorbed water from the system and zeolite. Following drying, the reactor temperature was changed to the desired reaction value and the reaction initiated by altering the gas flow to a 50![[thin space (1/6-em)]](https://www.rsc.org/images/entities/char_2009.gif) :
:![[thin space (1/6-em)]](https://www.rsc.org/images/entities/char_2009.gif) 50 mixture of propene (CK Gas, 99.5%) in helium at a flow rate sufficient to give a weight-hourly space velocity (WHSV) of 1 h−1. Inlet and outlet pressures were recorded and remained at 1 barg for the entirety of the reaction period in all cases. A catch pot located downstream of the reactor vessel and maintained at 293 K was used to collect the condensable reaction products. The composition of the remaining gas stream was analysed by a Hiden Analytical HPR-20 mass spectrometer and an Agilent 490 micro-GC, with both instruments drawing from the outlet of the reaction rig via differentially pumped capillaries heated to 423 K. The micro-GC was equipped with four parallel analysis columns, as detailed in Table 2, each analysed by a thermal conductivity detector with an injection volume of 5 cm3 per analysis. Five minutes was found to be sufficient for the elution of all detectable products from the GC columns, meaning that GC sampling took place approximately every 7 minutes with minor variations due to the need for the instrument to equilibrate prior to injection. Sampling was performed at maximum rate for the first hour to maximise data collection during the initial catalyst run-in period but was then interrupted for 45 minutes every 8 cycles in order to recondition the columns at higher temperature. Zero percent conversion data for the on-line analysis was collected by bypassing the reactor for the first ten minutes of propene flow prior to starting the reaction. Each catalyst sample was maintained under propene flow for a total of 6 hours on-stream, following which the propene was stopped and the cell purged using helium alone for 10 minutes in order to remove volatile products and residual propene from the reactor. Helium flow and on-line analysis was then stopped, the reactor sealed and cooled to room temperature and the reactor transferred to an argon glove box (MBraun UniLab MB-20-G, [H2O] < 1 ppm, [O2] < 1 ppm) to allow storage and handling of the reacted catalysts without contamination.
50 mixture of propene (CK Gas, 99.5%) in helium at a flow rate sufficient to give a weight-hourly space velocity (WHSV) of 1 h−1. Inlet and outlet pressures were recorded and remained at 1 barg for the entirety of the reaction period in all cases. A catch pot located downstream of the reactor vessel and maintained at 293 K was used to collect the condensable reaction products. The composition of the remaining gas stream was analysed by a Hiden Analytical HPR-20 mass spectrometer and an Agilent 490 micro-GC, with both instruments drawing from the outlet of the reaction rig via differentially pumped capillaries heated to 423 K. The micro-GC was equipped with four parallel analysis columns, as detailed in Table 2, each analysed by a thermal conductivity detector with an injection volume of 5 cm3 per analysis. Five minutes was found to be sufficient for the elution of all detectable products from the GC columns, meaning that GC sampling took place approximately every 7 minutes with minor variations due to the need for the instrument to equilibrate prior to injection. Sampling was performed at maximum rate for the first hour to maximise data collection during the initial catalyst run-in period but was then interrupted for 45 minutes every 8 cycles in order to recondition the columns at higher temperature. Zero percent conversion data for the on-line analysis was collected by bypassing the reactor for the first ten minutes of propene flow prior to starting the reaction. Each catalyst sample was maintained under propene flow for a total of 6 hours on-stream, following which the propene was stopped and the cell purged using helium alone for 10 minutes in order to remove volatile products and residual propene from the reactor. Helium flow and on-line analysis was then stopped, the reactor sealed and cooled to room temperature and the reactor transferred to an argon glove box (MBraun UniLab MB-20-G, [H2O] < 1 ppm, [O2] < 1 ppm) to allow storage and handling of the reacted catalysts without contamination.
| Column | T (°C) | Make-up gas | Details |
|---|---|---|---|
| 1 | 50 | He | 5 Å molecular sieve, 20 m column with backflush (O2, N2, CO, CO2) |
| 2 | 55 | He | PoraPLOT Q, 10 m column (CO2, water, light alkyl hydrocarbons) |
| 3 | 65 | He | CP-wax 52CB, 10 m column (heavy alkyl hydrocarbons, aromatics, alcohols) |
| 4 | 50 | N2 | 5 Å molecular sieve, 20 m column with backflush (He, H2) |
Inelastic neutron scattering
To investigate the vibrational spectra of the retained coke species within the zeolite pores, spectra were collected on the TOSCA indirect geometry neutron spectrometer at the ISIS Facility, which offers its optimum resolution at energies corresponding to the deformational region of the hydrocarbon spectrum (0–2000 cm−1).22 14 g samples of each reacted catalyst were loaded into 10 mm path length aluminium sample cells sealed with indium wire gaskets inside the glovebox, transferred to the TOSCA sample environment and cooled to the <15 K temperatures necessary for INS data collection using the integral closed-cycle refrigerator. A spectrum of the dried pre-reaction ZSM-5 catalyst was also collected to provide a baseline for comparison. The Mantid software package was used to reduce the resulting raw neutron time-of-flight data from all experiments to the energy transfer spectra presented below.23Infrared spectroscopy
Some material from each sample was retained for additional characterisation of the reacted catalysts. Infrared spectra were collected by diffuse-reflectance infrared Fourier transform spectroscopy (DRIFTS) using an Agilent Carey 680 FTIR spectrometer equipped with a Harrick praying mantis beam accessory and heated sample cell with gas flow capability. The cell was purged with dry N2 and the samples heated to 373 K to remove any water adsorbed onto the catalyst during cell loading prior to spectrum collection: monitoring of the sample spectrum during the process of heating to the drying temperature showed that it was not high enough to affect the composition of the hydrocarbon content of the sample. Spectra were collected from 4000–700 cm−1 using a liquid nitrogen cooled MCT detector with a resolution of 4 cm−1 and averaged over 64 scans per spectrum. This data is complementary to the INS spectra, as it provides higher resolution in the 2000–4000 cm−1 region containing the C–H and O–H stretching modes than is available on TOSCA.Additional characterisation
The degree of pore blockage in the samples was assessed by comparing the N2 adsorption isotherms of the reacted samples with those of the clean zeolite. Surface areas were calculated using the method of Brunauer, Emmett and Teller, 24 micropore volumes by the t-plot method of de Boer.25 Analysis was performed using a Quantachrome Quadrasorb EVO/SI gas adsorption instrument with gas adsorption and desorption isotherms collected across a relative pressure (P/P0) range from 5 × 10⁻⁴–0.99 using liquid nitrogen as the coolant. Samples were degassed to 20 mTorr prior to testing to ensure that only pore blocking effects from fully immobile coke were considered. The balance between the zeolite and hydrocarbon components of the samples was assessed by thermogravimetric analysis (TGA) performed from 373–1000 K in a 10% O2 gas flow using a TA Instruments TGA Q50.The condensable product fraction collected in the reactor catch-pot were analysed to determine composition by attenuated total reflectance infrared spectroscopy (Nicolet iS10 with Smart iTR accessory), ultraviolet-visible spectroscopy (Shimadzu UV-1800) and GC-MS analysis (Agilent 7890A GC, 5975 MSD, 60 m DB-1MS capillary).
Results
As noted above, the products of olefin conversion reactions over ZSM-5 are known to vary significantly depending on the reaction temperature employed. Temperatures below 500 K are known to favour the production of paraffins and olefins with linear or partially branched structures,26,27 while higher temperatures result in aromatic compounds becoming more significant contributors to the product mixture with temperatures of up to 700 K used in the olefins to gasoline distillate process.1 This study therefore considers three samples, reacted at 473 K, 573 K and 673 K while keeping other reaction conditions as consistent as possible, in order to investigate the differences in hydrocarbon production and retained species over the catalyst at these different reaction regimes.Reaction products analysis
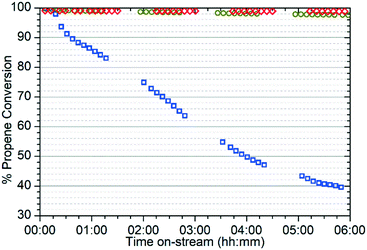
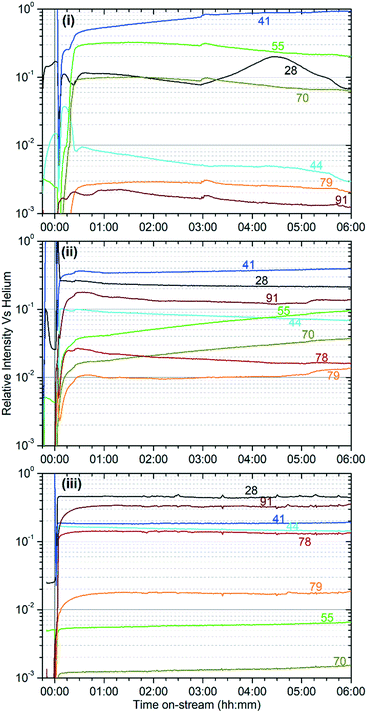
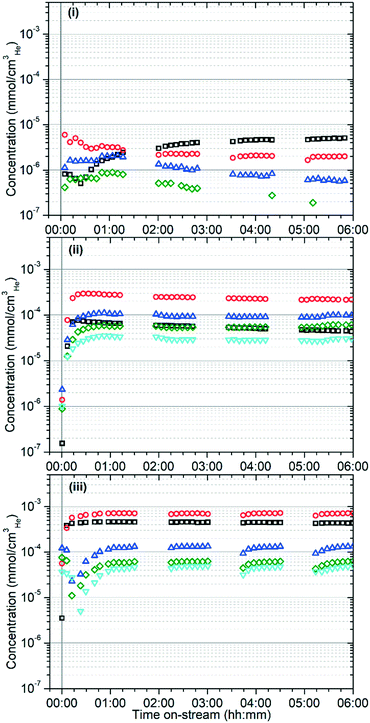
The different reactivity of the three samples is readily apparent from the on-line analysis of the products, with marked differences even in the percentage conversion of the reactant. As shown in Fig. 1 the catalyst is initially highly active at all three temperatures, attaining conversions of greater than 95% of the propene feed as assessed by GC analysis. However, while the 573 K and 673 K samples maintain this high conversion value for the duration of the test, at 473 K the catalyst rapidly undergoes a progressive deactivation that results in conversion dropping to around 40% after 6 hours.The on-line analysis of the products of the reaction which remain in the gas phase confirm that the catalyst is operating in a different reaction regime at each temperature studied. Fig. 2 shows the reaction products measured by mass spectrometry; only the most significant or illustrative ions monitored are reproduced here for clarity, with the full set of MS traces obtained being reproduced in the supplementary information as Fig. S1–S3.†Fig. 3 shows the concentrations of benzene and the various methylated benzenes observed in the product mix by GC analysis, allowing the contributions of each substituted aromatic to the 91 atomic mass units (amu) signal in the MS data to be evaluated. Fig. S4† shows the GC traces recorded at each temperature after 6 hours reaction time in order to illustrate the peak assignments.
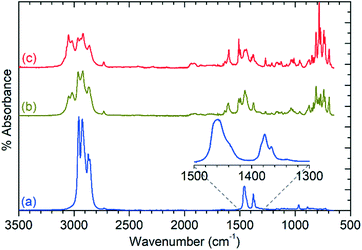
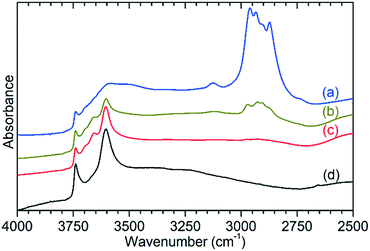
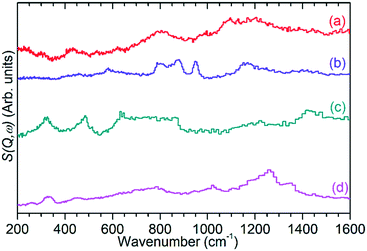
The products at 573 and 673 K exhibit all of the alkyl modes present in the 473 K spectrum, but also add additional features due to the presence of aromatic species. This is most clearly demonstrated by the presence of additional νC–H modes at 3050 and 3017 cm−1 which are stronger in the 673 K spectrum due to the greater production of aromatics at this temperature. The rich nature of the aromatic spectra, particularly in the 600–800 cm−1 region, confirms that multiple substituted aromatics are present, due to the presence of modes at frequencies associated with mono-, di-, and trisubstituted benzenes, as well as other modes which indicate the presence of multiple isomers or larger species. GCMS analysis (Fig. S5†) confirms the presence of tri-methyl benzenes, naphthalenes and tetralins in significant quantities, although tetra-, penta- and hexa-methyl benzenes are notably absent. UV-visible spectroscopic analysis of the liquids indicates the presence of trace quantities of polyaromatics as large as tricyclic species, evidenced by the presence of peaks up to 380 nm (Fig. S6†), despite the fact that durene is generally regarded as the largest species capable of diffusing out of the zeolite pore in ZSM-5.8 Due to their low concentrations, these polyaromatics products may represent propene conversion on exterior acid sites where steric considerations are not relevant. The disappearance of the mode at 968 cm−1 and lack of any additional modes in the 1650–1700 cm−1 or 3075–4000 cm−1 regions in Fig. 4 indicates that linear or branched alkenes are even less significant contributors to the condensable products at these higher reaction temperatures than was the case at 473 K.
Catalyst post-reaction analysis
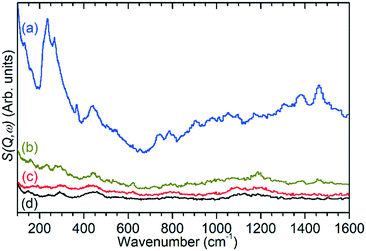
Ex situ analysis of the zeolite catalysts following completion of the reaction allows examination of both the state of the catalytic acid sites and any retained species which remain inside the zeolite pores. Due to the fact that the reactor was purged with inert gas at the end of the 6 h reaction run the non-zeolite species which are observed in these measurements are those which are immobilised within the pore network and which therefore contribute to catalyst deactivation through pore blocking. For brevity these species will be referred to by the generic designation of ‘coke’ for the remainder of this section.Infrared analysis allows examination of the νC–H and νO–H regions of the vibrational spectrum of the catalysts, as shown in Fig. 5. However, as previously noted, interference from the zeolite framework modes means that the deformation modes of the coke are not available for analysis as demonstrated by the presentation of the full range of the collected DRIFTS spectra in Fig. S7.† This holds true even if difference spectra are used (Fig. S8†) since the darkening of the samples due to hydrocarbon build-up results in increased absorbance across the full frequency range and incomplete cancellation of the zeolite modes. The INS spectra collected on TOSCA, presented as Fig. 6, do not share this limitation and in combination with the infrared data provide access to the full vibrational spectrum of the coke species.
| Sample | Coke content (wt%) | BET surface area (m2g−1) | V–t micropore volume (cm3 g−1) |
|---|---|---|---|
| Fresh ZSM-5 | — | 370 ± 11 | 9.7 (±0.3) × 10−2 |
| Reacted 473 K | 9.53 | 66 ± 1 | 1.1 (±0.1) × 10−2 |
| Reacted 573 K | 5.31 | 284 ± 6 | 6.7 (±0.1) × 10−2 |
| Reacted 673 K | 2.32 | 364 ± 8 | 8.6 (±0.2) × 10−2 |
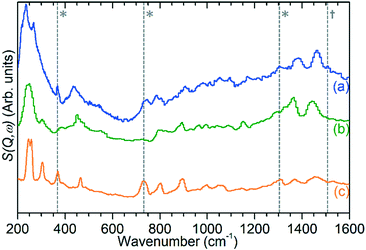 | ||
| Fig. 7 INS spectrum of ZSM-5 catalyst after reaction at 473 K (a) compared with reference spectra of solid atactic polypropene (b)30 and hexane (c).31 Modes indicating the presence of adjacent methylene groups (*) and the asymmetric allyl stretch of cyclopentadiene (†) in the experimental spectrum are highlighted. All spectra collected on TOSCA and offset in y-axis for clarity. Reference spectra obtained from the ISIS INS database.32 | ||
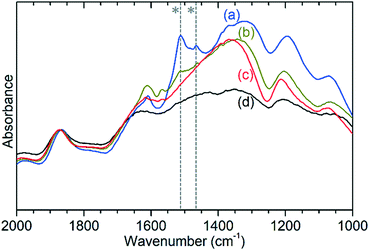
The previously mentioned alkene mode at 3125 cm−1 visible in addition to these alkyl species in Fig. 5 has been taken in previous studies of hydrocarbon conversion over zeolite catalysts to be indicative of the presence of cyclopentadienyl (CPD) cations which form a key intermediate species in the conversion of linear oligomers to alkenes and aromatic species in the hydrocarbon pool mechanism,14–16 and which are known to be stable in ZSM-5 type zeolites.32 The associated very strong allyl asymmetric stretching mode at 1510 cm−1 and the weaker symmetric counterpart at 1465 cm−1 are also visible in the extended infrared spectrum, being strong enough to be clearly distinguishable from the zeolite contributions below 2000 cm−1 (Fig. 8).15 The asymmetric stretching mode is also visible in the INS spectrum, although considerably weaker due to the overall population of the CPD cation being low and the associated hydrogen motions small, but the symmetric mode overlaps with, and is indistinguishable from, the CH3 asymmetric bending from the more populous alkyl species. Fig. 8 also shows an additional mode at 1611 cm−1, which is assigned to an aromatic C–C stretching mode (the ring quadrant stretch) from adsorbed toluene or xylenes.28 The population of these aromatics is quite low, as indicated by the low levels of their production in the on-line analysis and their minimal contributions to the INS data, explaining why their presence cannot be discerned from Fig. 5 as the associated C–H stretch modes are weak. This therefore indicates that trace aromatic products and reactive intermediates from the reactions which formed them remain trapped within the zeolite by the high degree of pore blockage, which in the case of the intermediates also prevents them from accessing a catalytic site and being converted to one of the final product species. The TGA data also shows the presence of a population of coke with combustion temperatures from 700–950 K, as visible in Fig. S10.† While the trapped aromatics represent some of this material, the relatively high weight of this coke relative to the low levels of aromatics visible spectroscopically argues for the presence of a quantity of fully carbonaceous material which is not easily detectable by infrared or INS.
Discussion
The reaction data indicates the presence of a wide variety of different product and coke species with quite different profiles at each reaction temperature investigated. However, the presence of all these species can be explained in terms of the zeolite catalysing a hydrocarbon pool series of reactions, similar to that studied for methanol-to-olefins chemistry.16 Two distinct reaction cycles occur within the zeolite, with the predominant cycle varying depending on temperature.Cycle 1 – alkyl production
On initial propene contact at all temperatures the reaction occurs according to Scheme 1(i) with propene at the active site forming a H-bonded intermediate, which immediately protonates to form a bonded alkoxide.40–42 This alkoxide can alternatively be thought of as a carbocation replacing the proton. The alkoxide then reacts with additional gas-phase propene to form branched oligomers. After any given alkene addition, the branched product may optionally undergo rearrangement via the method described by Chen and Bridger26 to give the linear oligomer sections whose modes are observed in the INS data (Fig. 7). While the linear product is known to predominate at low temperatures,42 the relative intensity of the branched and unbranched modes in the 473 K INS indicates that the branched form predominates at this temperature due to the faster oligomerization reaction rate resulting in decreased time for rearrangements between alkene addition steps. Once formed the alkoxide chains may either be released and diffuse away from the active site, yielding the alkene products observed in the product analysis and regenerating the Brønsted acid group or, alternatively, undergo further chain propagation to give larger products (Scheme 1(ii)). Due to the positioning of the carbocation charge in the adsorbed alkoxide, the primary alkene products will be secondary alkenes, matching the conclusions drawn from the product infrared spectra (Fig. 4). Sufficiently long oligomers may undergo β-scission cracking reactions (Scheme 1(iii)), producing the ethene detected in the non-condensable products and explaining the presence of chains which are not an integer multiple of propene units. However, an alkoxide which undergoes many successive oligomerizations without cracking will grow large enough that it is unable to diffuse away from the Brønsted site if it breaks away (Scheme 1(iv)). This results in the formation of the physisorbed Brønsted-hydrocarbon species observed in the infrared spectrum of the 473 K reacted catalyst (Fig. 5). The blockage of the zeolite pore network at that location then prevents the associated Brønsted site from participating in further reactions, contributing to catalyst deactivation and the observed reduction in propene conversion at 473 K.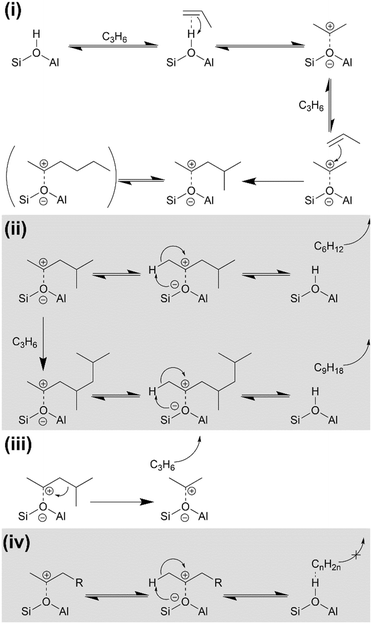 | ||
| Scheme 1 Alkoxide intermediate reactions of propene over H-ZSM-5: (i) alkene protonation and initial oligomerization; (ii) alkene product release and acid site regeneration or further oligomerization; (iii) β-scission of bonded alkoxide; (iv) partial acid site regeneration involving immobile hydrocarbon molecule. Reaction mechanisms derived from ref. 27 and 40–42. | ||
Cycle 2 – aromatic production
The reactions shown in Scheme 1 are able to explain the linear species which form the majority of the products at 473 K, but not the aromatic fraction which is a minor contribution at this temperature and the major products at 573 and 673 K. The production of aromatic products requires a second cycle of reactions which are detailed in Scheme 2. The presence of cyclopentadienyl ions in both the MS and IR data indicates that the aromatic species are formed via a route involving 5-membered rings. Bonded alkoxides in the C6–C9 size range formed by the reactions in Scheme 1 may cyclise to form substituted cyclopropanes in a process which also regenerates the Brønsted site (Scheme 2(i)).11 Removal of four hydrogens and the subsequent re-protonation of the resulting diene results in the formation of the cyclopentadienyl cations, which Fig. 5 shows are observed spectroscopically (Scheme 2(ii)). The hydrogen abstraction reaction is driven by their transfer to alkene species also within the zeolite, explaining the presence of propane in the gaseous products.11,43 This also accounts for the high proportion of saturated alkyl molecules in the condensable products: molecules heavy enough to condense in the catch-pot will diffuse through the zeolite slower than the non-condensable alkenes, resulting in a higher probability of their participation in a hydrogen transfer reaction before they escape the zeolite pore. The protonated cyclopentadienyl cation is observed in the coke infrared spectra (Fig. 5) because it is more stable in H-ZSM-5 than the corresponding diene, even though steric constraints mean that it does not form a framework-bound alkoxide as the linear carbocations do.33 Once formed, these cyclopentadienyl cations can interconvert to the corresponding benzene or methylated benzene through a rearrangement that involves the removal of four more hydrogens (Scheme 2(iii)), generating further alkane products through hydrogen transfer to alkenes. Multiple cyclopentadienyl ions may also react in concert through a disproportionation mechanism, with some of them fragmenting to adsorb the excess hydrogen and forming propene in addition to the aromatic product.44 Alternatively, xylene products may be formed by the disproportionation of toluene produced by the Scheme 2(iii) rearrangement mechanism (Scheme 2(iv)).45,46 Cyclopentadienyl cations with ethyl or longer side chains may release light olefins through an internal rearrangement followed by elimination, as demonstrated for ethene in Scheme 2(v).44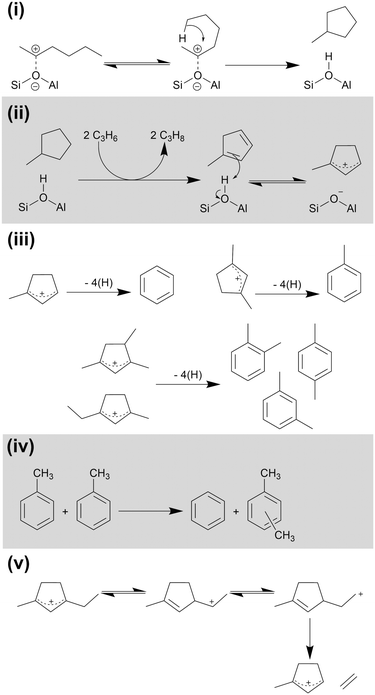 | ||
| Scheme 2 Cyclic and aromatic ring based reactions over H-ZSM-5: (i) alkoxide cyclisation; (ii) hydrogen transfer and cyclopentadienyl formation; (iii) conversion to aromatic products; (iv) toluene disproportionation to yield benzene and xylenes; (v) elimination of light olefins from substituted cyclopentadienyl cation. Mechanisms derived from ref. 11, 33, and 43–45. | ||
Overall reaction scheme
These two groups of reactions can therefore account for all the observed products (as outlined in the Results section) and all species which are detected within the reacted catalyst (IR and INS) and form a linked pair of reaction cycles. Scheme 3 summarises the trends observed and, crucially, links the two contributing cycles. As commented on by Ilias and Bhan, it is the relative rates of these two cycles that defines the MTH selectivity.7 While the alkyl reaction cycle is active at all temperatures, it is evident that formation of aromatic species from the cyclopentadienyl cations have a sufficiently high activation energy that the aromatic cycle does not contribute significantly at 473 K. The presence of detectable levels of cyclopentadienyl C–H and C–C vibrations in the infrared (Fig. 5 and 8) and the fact that di-methyl cyclopentadiene is more prevalent in the exit gas stream than aromatic species at this temperature (Fig. 2(i)) indicates that it is the aromatic ring formation step which is rate limiting in the transfer between cycles. At higher temperatures it is proposed that this energy barrier is overcome, permitting the aromatic cycle to fully contribute to product formation. The availability of this additional reaction branch, together with the increased rate of β-scission at higher temperatures, also means that bonded alkoxides are less likely to undergo multiple successive oligomerization steps and the formation of immobile branched pore blocking oligomers is not significant at temperatures higher than 473 K, preventing premature deactivation of the catalyst. Instead, what coke species do form at this temperature are graphitic and amorphous carbon agglomerations, which form at the surface of the zeolite crystallites.47,48Desorbed precursors to the formation of these coke species are the likely source of the signals of polyaromatics observed in the products by UV-vis spectroscopy (Fig. S6†). Full operation of the aromatic production cycle also increases the number of hydrogen transfer reactions which occur, converting more of the alkene population to alkanes and explaining why levels of condensable alkenes are even lower at 573 K and 673 K than they are at 473 K. However, while the aromatic cycle remains fully operational for the lifetime of the reaction at 673 K, the 573 K reaction seems to progressively shift toward the alkyl cycle becoming more dominant, indicating that there may be a step in the regeneration of the catalytic sites following aromatic production that is not totally efficient at this temperature. This process is likely to be the major factor in determining the catalyst lifetime at 573 K. Once the contribution of the aromatic cycle is sufficiently reduced the catalyst will be operating in a similar regime to that observed at 473 K and full deactivation will be subsequently rapid, as observed in the data for the lower temperature reaction. The 573 K sample does not appear to have reached this stage in the course of the 6 hours on-stream investigated here, as evidenced by the rate of change in product concentrations being constant once the catalyst enters steady-state operation. It is therefore not possible to say at what point the deactivation process will commence based on this data.
The hydrogen transfer reactions which form the linking steps between the two cycles are well established in the MTH literature,11,43,44,49 and the ability of H-ZSM-5 to catalyse these reactions is proposed as one of the key differentiating factors between aromatic-producing MTH reactions over H-ZSM-5 and the more constrained methanol-to-olefins reaction which occurs over silicoaluminophosphates such as H-SAPO-34.43 The rate of hydrogen transfer reactions is strongly influenced by the strength and population of the acid sites within the catalyst framework, as shown by comparative studies of zeolite and SAPO catalysts with identical framework structures.50,51 It therefore follows that the high aromatic productivity observed at 573 and 673 K is a function of the high acidity of the fresh catalyst used in this study, and that aromatic production is likely to decrease over time as the zeolite acid sites are removed through framework de-alumination and the production of CPD intermediates is reduced. The decrease in aromatic production observed at 573 K is not believed to be due to this process, since the rate of acid site loss in zeolites is temperature-dependant and no comparable loss in production is observed at 673 K; the losses at the lower temperature are therefore best explained by incomplete catalytic site regeneration, with permanent acid site losses not being significant on the timescales investigated here. A study by Arora and Bhan52 also shows a link between the methanol partial pressure and hydrogen transfer reaction rate in MTH chemistry, which, by analogy, suggests that the high WHSV of propene used in this study may also play a role in the high aromatic production observed.
The reactions in Scheme 2 also explain the distribution of the aromatic products which are observed at each temperature. The identity of the aromatic species initially formed is determined by the length of the alkoxide chain which undergoes cyclisation, which in turn is dictated by the alkenes present in the zeolite to undergo oligomerization. At 473 K these chains are thought to be primarily C6 species formed by propene dimerization; hence, the increasing dominance of benzene as an aromatic product as the initial pool of other oligomers generated during catalyst conditioning is consumed or converted to pore blocking oligomers (Fig. 3). At higher temperatures the quantity of ethene in the zeolite is greatly increased due to both increased β-scission and the full participation of the alkene elimination reactions in Scheme 2(iv). This results in a more even distribution of oligomer lengths and means that the higher stability of 1,3-dimethyl cyclopentadienyl cations relative to other CPD species becomes relevant, resulting in toluene becoming the major aromatic product. In a similar fashion, the increased production of benzene at 673 K relative to 573 K can be explained by ethene elimination from CPD species which would otherwise yield xylenes. The majority of the xylene production is likely due to the disproportionation of toluene, which is known to occur over ZSM-5.46 This reaction yields the thermodynamic equilibrium mixture of xylenes, with m-xylene as the major and p-xylene as the minor product with o-xylene levels closer to those of p-xylene, which matches the observations in Fig. 3.
In addition to benzene, toluene and xylenes, oligomer cyclisation can occur with chains of up to C9 length, directly generating the trimethyl benzenes and ethyl toluenes observed by GCMS. However, alkylation of these first stage aromatics to produce heavier products can only occur through the addition of ethyl and propyl groups since the reaction systems lacks a source of methyl cations. These additions will directly yield naphthalenes, by-passing the production of tetra-, penta- and hexa-substituted benzenes that form a major component of the products in MTH reactions but which are not observed in the products here. Thus Scheme 3 represents a means of depicting the various inter-relationships that contribute to the MTH reaction over ZSM-5. The complementarity between the IR and INS measurements is at the forefront of developing this enhanced understanding.
Conclusions
The reactions of a propene feed over H-ZSM-5 catalyst at temperatures from 473–673 K have been studied. At these temperatures, propene undergoes acid protonation and subsequent oligomerization to form a pool of oligomers and cyclised oligomers, which subsequently react via the established 2-cycle hydrocarbon pool mechanism to give a mixture of aromatic and aliphatic products. This dual-cycle mechanism requires temperatures at the higher end of the studied range in order to operate efficiently. First, low temperatures prevent full conversion of oligomeric species to aromatics through the cyclopentadienyl intermediate mechanism and therefore inhibit operation of the aromatic production cycle, resulting in early deactivation of the catalyst through pore blocking. Second, while temperatures of 573 K allow operation of the aromatic cycle, the regeneration of zeolite acid sites is not 100% efficient at this temperature, resulting in a progressive shift toward single-cycle operation as reaction time increases; although this process is only partial on the timeframe studied. When fully active at 673 K the hydrocarbon pool operates with almost no loss of catalytic activity over the period studied with minimal zeolite coking observed. Collectively these actions produce a mixture of products consisting mainly of mono- and bi-cyclic aromatics and C6–C12 aliphatic hydrocarbons. It is noted that this product mixture is similar to that generated by methanol-to-hydrocarbons reactions over similar zeolite catalysts, supporting the conclusions drawn in previous studies of the MTH reaction that light olefins such as propene represent the products of the first C–C bond formation reactions in MTH catalyst conditioning.14 These light olefins then form the MTH hydrocarbon pool in the same manner as observed here. One exception to this close agreement is the lack of significant production of tetra-, penta- and hexa-methyl benzenes and higher-substituted naphthalenes, which are important aromatic-cycle reaction centres and pore blocking species in MTH chemistry: the absence of these species in this ‘propene-to-hydrocarbons’ reaction is attributed to the fact that methylation reactions cannot play a significant role due to the absence of a significant source of methyl cations, resulting in a more restricted population of aromatic products. The greater energy required to alkylate aromatics using ethyl or propyl cations relative to the energy barrier of methylation explains why this reaction requires higher temperatures than comparable MTH processes. The use of inelastic neutron scattering spectroscopy has allowed the non-destructive analysis of species trapped within the zeolite pore structure, showing that catalyst deactivation at low temperatures is due to an overproduction of large branched oligomers due to an imbalanced hydrocarbon pool cycle.Author contributions
A. P. Hawkins: Investigation, methodology, visualization, writing-original draft. A. Zachariou: Investigation, methodology. S. F. Parker: Investigation, resources, supervision, writing-review and editing. P. Collier: Funding acquisition, resources, supervision. R. F. Howe: Investigation, methodology, writing-review and editing. D. Lennon: Conceptualisation, funding acquisition, project administration, supervision, writing-review and editing.Conflicts of interest
There are no conflicts to declare.Acknowledgements
Johnson Matthey plc. is thanked for supplying the ZSM-5 zeolite and for financial support through the provision of industrial CASE studentships in partnership with the EPSRC (APH (EP/P510506/1), AZ (EP/N509176/1)). Experiments at the ISIS Neutron and Muon Source were made possible by a beam time allocation from the Science and Technologies Facilities Council.53 The resources and support provided by the UK Catalysis Hub via membership of the UK Catalysis Hub consortium and funded by EPSRC grants EP/R026815/1 and EP/R026939/1 are gratefully acknowledged. This research has been performed with the use of facilities and equipment at the Research Complex at Harwell; the authors are grateful to the Research Complex for this access and support.References
- S. A. Tabak, F. J. Krambeck and W. E. Garwood, AIChE J., 1986, 32(9), 1526–1531 CrossRef CAS.
- M. L. Sarazen, E. Doskocil and E. Iglesia, J. Catal., 2016, 344, 553–569 CrossRef CAS.
- M. L. Sarazen, E. Doskocil and E. Iglesia, ACS Catal., 2016, 6(10), 7059–7070 CrossRef CAS.
- R. Y. Brogaard, R. Henry, Y. Schuurman, A. J. Medford, P. G. Moses, P. Beato, S. Svelle, J. K. Norskov and U. Olsbye, J. Catal., 2014, 314, 159–169 CrossRef CAS.
- I. Yarulina, A. D. Chowdhury, F. Meirer, B. M. Weckhuysen and J. Gascon, Nat. Catal., 2018, 1(6), 398–411 CrossRef CAS.
- I. M. Dahl and S. Kolboe, Catal. Lett., 1993, 20(3–4), 329–336 CrossRef CAS.
- S. Ilias and A. Bhan, ACS Catal., 2013, 3(1), 18–31 CrossRef CAS.
- U. Olsbye, S. Svelle, K. P. Lillerud, Z. H. Wei, Y. Y. Chen, J. F. Li, J. G. Wang and W. B. Fan, Chem. Soc. Rev., 2015, 44(20), 7155–7176 RSC.
- H. Yamazaki, H. Shima, H. Imai, T. Yokoi, T. Tatsumi and J. N. Kondo, J. Phys. Chem. C, 2012, 116(45), 24091–24097 CrossRef CAS.
- J. Li, Z. Wei, Y. Chen, B. Jing, Y. He, M. Dong, H. Jiao, X. Li, Z. Qin, J. Wang and W. Fan, J. Catal., 2014, 317, 277–283 CrossRef CAS.
- M. Vandichel, D. Lesthaeghe, J. Van der Mynsbrugge, M. Waroquier and V. Van Speybroeck, J. Catal., 2010, 271(1), 67–78 CrossRef CAS.
- P. M. Allotta and P. C. Stair, ACS Catal., 2012, 2(11), 2424–2432 CrossRef CAS.
- M. J. Wulfers and F. C. Jentoft, ACS Catal., 2014, 4(10), 3521–3532 CrossRef CAS.
- I. B. Minova, S. K. Matam, A. Greenaway, C. R. A. Catlow, M. D. Frogley, G. Cinque, P. A. Wright and R. F. Howe, ACS Catal., 2019, 9(7), 6564–6570 CrossRef CAS.
- J. D. Mosley, J. W. Young, J. Agarwal, H. F. Schaefer, P. V. R. Schleyer and M. A. Duncan, Angew. Chem., Int. Ed., 2014, 53(23), 5888–5891 CrossRef CAS PubMed.
- E. D. Hernandez and F. C. Jentoft, ACS Catal., 2020, 10(10), 5764–5782 CrossRef CAS.
- M. Stocker, Microporous Mesoporous Mater., 1999, 29(1–2), 3–48 CrossRef CAS.
- S. F. Parker, D. Lennon and P. W. Albers, Appl. Spectrosc., 2011, 65(12), 1325–1341 CrossRef CAS.
- P. Magnoux, P. Roger, C. Canaff, V. Fouche, N. S. Gnep and M. Guisnet, Stud. Surf. Sci. Catal., 1987, 34, 317–330 CrossRef CAS.
- A. P. Hawkins, A. Zachariou, P. Collier, R. A. Ewings, R. F. Howe, S. F. Parker and D. Lennon, RSC Adv., 2019, 9(33), 18785–18790 RSC.
- R. Warringham, D. Bellaire, S. F. Parker, J. Taylor, R. A. Ewings, C. M. Goodway, M. Kibble, S. R. Wakefield, M. Jura, M. P. Dudman, R. P. Tooze, P. B. Webband and D. Lennon, J. Phys.: Conf. Ser., 2014, 554(1), 012005 CrossRef.
- S. F. Parker, F. Fernandez-Alonso, A. J. Ramirez-Cuesta, J. Tomkinson, S. Rudic, R. S. Pinna, G. Gorini and J. F. Castañon, J. Phys.: Conf. Ser., 2014, 554(1), 012003 CrossRef.
- O. Arnold, J. C. Bilheux, J. M. Borreguero, A. Buts, S. I. Campbell, L. Chapon, M. Doucet, N. Draper, R. Ferraz Leal, M. A. Gigg, V. E. Lynch, A. Markvardsen, D. J. Mikkelson, R. L. Mikkelson, R. Miller, K. Palmen, P. Parker, G. Passos, T. G. Perring, P. F. Peterson, S. Ren, M. A. Reuter, A. T. Savici, J. W. Taylor, R. J. Taylor, R. Tolchenov, W. Zhou and J. Zikovsky, Nucl. Instrum. Methods Phys. Res., Sect. A, 2014, 764, 156–166 CrossRef CAS.
- S. Brunauer, P. H. Emmett and E. Teller, J. Am. Chem. Soc., 1938, 60, 309–319 CrossRef CAS.
- J. H. de Boer, B. C. Lippens, B. G. Linsen, J. C. P. Broekhoff, A. van den Heuvel and T. J. Osinga, J. Colloid Interface Sci., 1966, 21, 405–414 CrossRef CAS.
- S. Bessell and D. Seddon, J. Catal., 1987, 105(1), 270–275 CrossRef CAS.
- C. S. H. Chen and R. F. Bridger, J. Catal., 1996, 161(2), 687–693 CrossRef CAS.
- D. Lin-Vien, N. B. Colthup, W. G. Fateley and J. G. Grasselli, The Handbook of Infrared and Raman Characteristic Frequencies of Organic Molecules, Academic Press, San Diego, 1991 Search PubMed.
- S. Müller, Y. Liu, M. Vishnuvarthan, X. Sun, A. C. van Veen, G. L. Haller, M. Sanchez-Sanchez and J. A. Lercher, J. Catal., 2015, 325, 48–59 CrossRef.
- P. Mitchell, S. F. Parker, A. Ramirez-Cuesta and J. Tomkinson, Vibrational Spectroscopy With Neutrons: With Applications in Chemistry, Biology, Materials Science and Catalysis. World Scientific, Hackensack, NJ, 2005, vol. 3 Search PubMed.
- D. A. Braden, S. F. Parker, J. Tomkinson and B. S. Hudson, J. Chem. Phys., 1999, 111(1), 429–437 CrossRef CAS.
- ISIS INS Database, https://edata.stfc.ac.uk/handle/edata/18 (accessed January 2021) Search PubMed.
- W. Song, J. B. Nicholas and J. F. Haw, J. Am. Chem. Soc., 2001, 123(1), 121–129 CrossRef CAS PubMed.
- S. F. Parker, S. Imberti, S. K. Callear and P. W. Albers, Chem. Phys., 2013, 427, 44–48 CrossRef CAS.
- J. K. Walters, R. J. Newport, S. F. Parker and W. S. Howells, J. Phys.: Condens. Matter, 1995, 7(50), 10059–10073 CrossRef.
- P. A. Jacobs and R. Von Ballmoos, J. Phys. Chem., 1982, 86(15), 3050–3052 CrossRef CAS.
- J. C. Vedrine, A. Auroux and G. Coudurier, ACS Symp. Ser., 1984, 248, 253–273 CrossRef CAS.
- S. M. Campbell, D. M. Bibby, J. M. Coddington, R. F. Howe and R. H. Meinhold, J. Catal., 1996, 161(1), 338–349 CrossRef CAS.
- A. N. Mlinar, P. M. Zimmerman, F. E. Celik, M. Head-Gordon and A. T. Bell, J. Catal., 2012, 288, 65–73 CrossRef CAS.
- G. Spoto, S. Bordiga, G. Ricchiardi, D. Scarano, A. Zecchina and E. Borello, J. Chem. Soc., Faraday Trans., 1994, 90(18), 2827–2835 RSC.
- F. Geobaldo, G. Spoto, S. Bordiga, C. Lamberti and A. Zecchina, J. Chem. Soc., Faraday Trans., 1997, 93(6), 1243–1249 RSC.
- A. P. Hawkins, A. Zachariou, S. F. Parker, P. Collier, I. P. Silverwood, R. F. Howe and D. Lennon, ACS Omega, 2020, 5(14), 7762–7770 CrossRef CAS PubMed.
- J. F. Haw and D. M. Marcus, Top. Catal., 2005, 34(1), 41–48 CrossRef CAS.
- J. F. Haw, J. B. Nicholas, W. Song, F. Deng, Z. Wang, T. Xu and C. S. Heneghan, J. Am. Chem. Soc., 2000, 122(19), 4763–4775 CrossRef CAS.
- G. V. Bhaskar and D. D. Do, Ind. Eng. Chem. Res., 1990, 29, 355–361 CrossRef CAS.
- M. Albahar, C. Li, V. L. Zholobenko and A. A. Garforth, Microporous Mesoporous Mater., 2020, 302, 110221 CrossRef CAS.
- L. Palumbo, F. Bonino, P. Beato, M. Bjørgen, A. Zecchina and S. Bordiga, J. Phys. Chem. C, 2008, 112(26), 9710–9716 CrossRef CAS.
- D. Mores, E. Stavitski, M. H. F. Kox, J. Kornatowski, U. Olsbye and B. M. Weckhuysen, Chem. – Eur. J., 2008, 14(36), 11320–11327 CrossRef CAS PubMed.
- W. Zhang, M. Zhang, S. Xu, S. Gao, Y. Wei and Z. Liu, ACS Catal., 2020, 10(8), 4510–4516 CrossRef CAS.
- L.-T. Yuen, S. I. Zones, T. V. Harris, E. J. Gallegos and A. Auroux, Microporous Mater., 1994, 2(2), 105–117 CrossRef CAS.
- M. Westgård-Erichsen, S. Svelle and U. Olsbye, Catal. Today, 2013, 215, 216–223 CrossRef.
- S. S. Arora and A. Bhan, J. Catal., 2017, 356, 300–306 CrossRef CAS.
- R. F. Howe, A. P. Hawkins, A. Zachariou, D. Lennon, I. Hitchcock, S. Huang, Y. Li and S. F. Parker, RB1910203: INS Studies of Olefin Reactivity in HZSM-5 Zeolite Catalysts, STFC ISIS Neutron and Muon Source Experiment, 2019, DOI:10.5286/ISIS.E.RB1910203.
Footnote |
| † Electronic supplementary information (ESI) available. See DOI: 10.1039/d1cy00048a |
| This journal is © The Royal Society of Chemistry 2021 |

