
 Open Access Article
 This Open Access Article is licensed under a Creative Commons Attribution-Non Commercial 3.0 Unported Licence
Rational catalyst design for CO oxidation: a gradient-based optimization strategy
Ziyun
Wang
and
P.
Hu
 *
*
School of Chemistry and Chemical Engineering, The Queen's University of Belfast, Belfast BT9 5AG, UK. E-mail: zwang07@qub.ac.uk; p.hu@qub.ac.uk
First published on 3rd February 2021
Abstract
Rational catalyst design is one of the most challenging tasks in heterogeneous catalysis, mainly due to the lack of optimization strategies. In this work, we proposed a gradient-based optimization strategy for rational catalyst design. In this strategy, the catalyst design is treated as an optimization process of surface structures toward maximum activity. The bonding contribution equation, a quantitative relationship between the surface structures and the adsorption energies, is utilized to predict the adsorption in the optimization. A traditional catalyst for CO oxidation, platinum, is optimized using this strategy. After eight step optimization, the activity of CO oxidation increases dramatically. It is found that the origin of the high activity of the designed catalyst is not only from the suitable bonding strength of all the species and reaction barriers of all elementary steps, but also from circumventing the BEP relation. Our design strategy offers a powerful tool to understand and design novel catalytic materials.
1. Introduction
Rational catalyst design is arguably the most important goal in heterogeneous catalysis, which requires not only a deep understanding of catalytic materials, but also good design strategies. In the last few decades, with the help of density functional theory (DFT) calculations, many investigations on heterogeneous catalysis have been carried out, which enhanced the understanding of heterogeneous catalysis. Nørskov and Hammer1 reported that the d-band centre of a catalyst correlates with the bonding strength, which uncovers the relationship between the electronic properties and adsorption energy in heterogeneous catalysis. Furthermore, a linear relationship between the activation energy and the enthalpy change of an elementary step, the Brønsted–Evans–Polanyi (BEP) relation, was found by several groups from DFT calculations.2–4 This linear relationship offers a quantitative and simple way to predict the kinetic properties using thermodynamic properties with reasonable accuracy. Furthermore, a volcano curve4–8 was found between the adsorption energies of key intermediates and the activities, where the adsorption energy for the most active catalyst can be evaluated. Recently, the concept of the generalized coordination number was introduced by Calle-Vallejo et al.,9–11 where the adsorption energies on many nanoparticles9 and facets10 can be predicted. Furthermore, the adsorption energy of an alloy surface can be evaluated using the bonding contribution equation.12–14 Ma and Xin developed the orbitalwise coordination number to predict the adsorption properties of metal nanocatalysts.15 The state-of-the-art machine learning method has also shown promise for catalyst design.16–18 There are also many other exciting design studies recently published.19–24 These theoretical findings greatly enrich the knowledge of heterogeneous catalysis and offer powerful tools for in silico rational catalyst design.Despite these theoretical investigations, only a few design strategies were suggested before: Nørskov and co-workers showed that using the adsorption energies of key intermediates as descriptors, promising catalyst candidates can be obtained by screening large catalyst databases.25–29 An example of this can be found in searching for active hydrogen evolution catalysts,25 where they calculated the adsorption energies of the hydrogen atom on 736 binary transition-metal surface alloys. These alloys were screened based on the optimal hydrogen adsorption energy from the volcano curve. In their work, BiPt was found to possess a higher activity than pure Pt both experimentally and computationally. Employing a similar method, a non-precious metal alloy, NiZn, was successfully discovered for the selective hydrogenation of acetylene.26 It was found that the adsorption energies of both acetylene and ethylene on one metal surface are correlated with the methyl adsorption energies on the same surface. Moreover, the adsorption energies of acetylene and ethylene are also related to the activity and selectivity of acetylene hydrogenation, respectively. Thus, the optimum catalyst for acetylene hydrogenation can be screened by balancing the adsorption energies of acetylene and ethylene. The descriptor-based screening method was reviewed by Nørskov and co-workers.27,28 Furthermore, Cheng and Hu30 introduced the concept of chemical potential into heterogeneous catalysis, and reformulated the kinetic properties such as reaction rate and reversibility, in terms of the chemical potential. Using this new formulation, they found that the adsorption energy of key intermediates should stay in the optimal adsorption energy window.31,32 Using this optimal adsorption energy window, a novel active counter electrode material for triiodide reduction reaction, α-Fe2O3, was discovered for dye-sensitized solar cells.33 More details of the chemical potential and its usage in catalyst design can be found in a recent review.34
Although the theoretical foundations of the design strategies mentioned above are different, these strategies are all based on the screening of adsorption energies of some species. Even though many novel catalysts were discovered using these methods, they still have some disadvantages: firstly, these screening strategies require the calculations of adsorption energies on large numbers of surface candidates exhaustively, which exhibits a lack of rationality. This is not desirable both scientifically and practically: scientifically, these strategies offer an approach to find active surfaces without information on why these catalysts outweigh other catalysts, whilst practically these strategies require complete calculations of adsorption energies on all surface candidates, which is computationally demanding. Secondly, the designed catalysts from these strategies are highly related to the size and diversity of the screening database, i.e. the surfaces that are not included in the database will be ignored. In the aforementioned design examples, only bi-metal alloy and typical metal oxide surfaces can be found due to the limitations of the screening database. Thirdly, in these screening strategies, many approximations such as the BEP relation35 and linear scaling36 were used; hence catalysts that do not obey these linear relationships are not considered in the design process. Some recent work37 proposed that catalysts that do not obey these linear relationships are very important in catalyst design. Therefore, a more rational strategy is necessary for further catalyst design and development.
Herein, we proposed a new rational design strategy, namely the gradient-based optimization strategy, based on DFT calculations and micro-kinetic modelling, which makes it possible to rationally manipulate the reaction sites and tune the adsorption energies and reaction barriers towards the direction of higher activity. CO oxidation was chosen as the model reaction because it is a typical heterogeneous catalysis reaction that includes adsorption, dissociation, association and desorption steps; thus such a design example may also be applied in other heterogeneous reactions. In this contribution, the general design idea and theoretical foundations of this gradient-based optimization strategy are introduced in section 2 and section 3, respectively. Using this strategy, a design process of CO oxidation on Pt-based alloy surfaces is shown in section 4. The structures, energies of intermediates and transition states (TSs) and kinetic properties of the surfaces in the process are analyzed, and the extraordinary activities of the designed surface are discussed.
2. Computational methods
2.1. Density functional theory (DFT)
All DFT calculations were carried out using a periodic slab model using the Vienna ab initio simulation program (VASP).38–41 The generalized gradient approximation (GGA) was used with the Perdew–Burke–Ernzerhof (PBE)42 exchange-correlation functional. The projector-augmented wave (PAW) method43,44 was utilized to describe the electron–ion interactions and the plane-wave basis expansion cut-off was set to 450 eV. All the adsorption geometries were optimized using a force-based conjugate gradient algorithm, whilst TSs were located with a constrained minimisation technique.45–47 In this work, Pt(111) and designed surfaces were modelled using a periodic 4-layer model with the 2 lower layers fixed and the 2 upper layers relaxed. A p(2 × 2) supercell was chosen with 4 × 4 × 1 Monkhorst–Pack k-point mesh sampling for Brillouin zone integration. For the designed surfaces, only the chosen atom was replaced, while the lattice size remained the same. A ∼10 Å vacuum region was placed on all the models mentioned above.2.2. Thermodynamic correction and micro-kinetic modelling
In this work, some standard formulas of statistical mechanics were used to calculate the free energy corrections of surface species including zero-point-energy (ZPE), thermal energy and entropy derived from partition functions.48–50 Only the vibrational contribution was considered for surface species, with the vibrational frequencies obtained based on the harmonic oscillator approximation.51 Regarding the gaseous species, the thermodynamic corrections were calculated using the Shomate equation. Similar to the work of Nørskov and co-workers,52 the reaction temperature of CO oxidation was chosen to be 600 K, with partial pressures of 0.33 and 0.67 bar for O2 and CO, respectively.In the micro-kinetic modelling, three elementary steps were taken into account, namely the adsorption of CO, the dissociative adsorption of O2 and the oxidation of CO, as follows:
| CO(g) + * ↔ CO* |
| O2(g) + 2* ↔ 2O* |
| CO* + O * ↔ CO2(g) + 2* |
| EH = EH2/2, EC = ECH4 − 4EH, and EO = EH2O − 2EH. |
3. Optimization strategy
3.1. Optimization problem
In our previous work,57 it is proposed that the catalyst design can be treated as an optimization problem. In order to design active catalysts for CO oxidation, there is a requirement to optimize the surface structures to achieve better activities. In general, there are two different types of optimizations, namely the local optimization and global optimization. One method for the local optimization is the gradient ascent, which begins with an initial guess, and then optimizes iteratively based on the gradient. In the global optimization, some initial points are generated and then the global maximum can be searched using various methods, such as genetic algorithm,58 simulated annealing59 and particle swarm optimization.60 In heterogeneous catalysis, these two different approaches may be used in different situations of catalyst design: for reactions that are systematically investigated, we can start from a known active catalyst, and then optimize the catalyst structure using the local optimization method, while the global optimization method may be used in reaction systems that are not well studied. Therefore, for the CO oxidation, a local optimization method was chosen, specifically the gradient ascent method, starting with one of the most active metal catalysts, Pt(111).52After choosing the optimization method and initial guess, we need to determine how the surface is optimized in the first step optimization, i.e. how to calculate the gradient of the overall rate at the initial point. However, the derivative of the overall rate of the structure is very difficult to calculate for the following reasons: firstly, it is challenging to represent the structure in a numerical and continuous approach. Secondly, the quantitative relationship between structure and activity is still not clear. As proposed in our previous work,57 the optimization of the surface structure may be achievable, if we treated the relationship between structure and activity into two parts, namely the relationship between structure and energy (the energies of all states involved in the reaction), and the relationship between energy and activity. The relationship between energy and activity can be easily obtained using micro-kinetic modelling, and the partial derivative of the activity of each energy of the intermediate or transition state can be calculated numerically, known as the degree of rate control by Campbell and co-worker.61–63 Furthermore, some quantitative relationship between structure and adsorption energy has been suggested recently, such as the d-band center,1 generalized coordination number9,10 and bonding contribution equation.12 In this work, the bonding contribution equation was selected due to the following reasons: firstly, the bonding contribution equation offers a fast and quantitative prediction of adsorption energies from structures without any DFT level calculations. Secondly, this equation is focused on the adsorption energy prediction on alloy surfaces, which is an important type of catalyst for CO oxidation. Several alloy catalysts were reported to be very active for CO oxidation, such as Pd–Ni (ref. 64) and Pd–Au.65 Thirdly, the bonding contribution equation was well tested for the adsorption energies of CO and O,12 and thus it is ready to be used for the catalyst design of CO oxidation. Using the bonding contribution equation, the optimization of the catalyst surface is converted into the optimization of energies of intermediates and TSs.
3.2. Gradient for activity
In order to optimize the energies of all the states in the direction of higher CO oxidation activity, the gradient of energies needs to be calculated, which contains the partial derivative of all the energies of the states involved in the CO oxidation reaction. Herein, this partial derivative of activity of the energy of a state (PDi) is calculated with the following equation: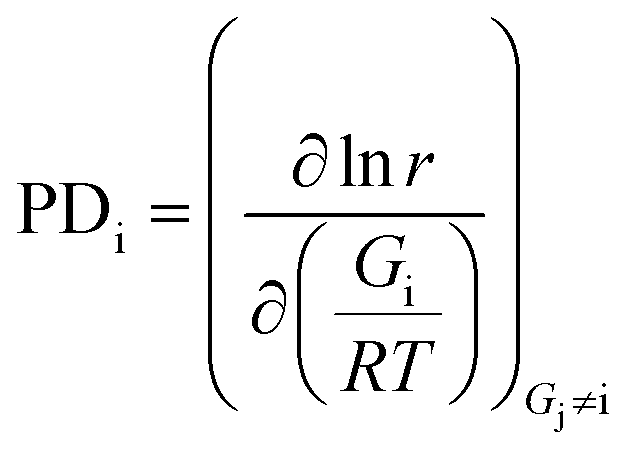 | (1) |
| ∇rate(G) = [PDCO, PDO, PDCO–O, PDO–O] | (2) |
| Gn+1 = Gn + γ∇rate(G), n = 0, 1, 2… | (3) |
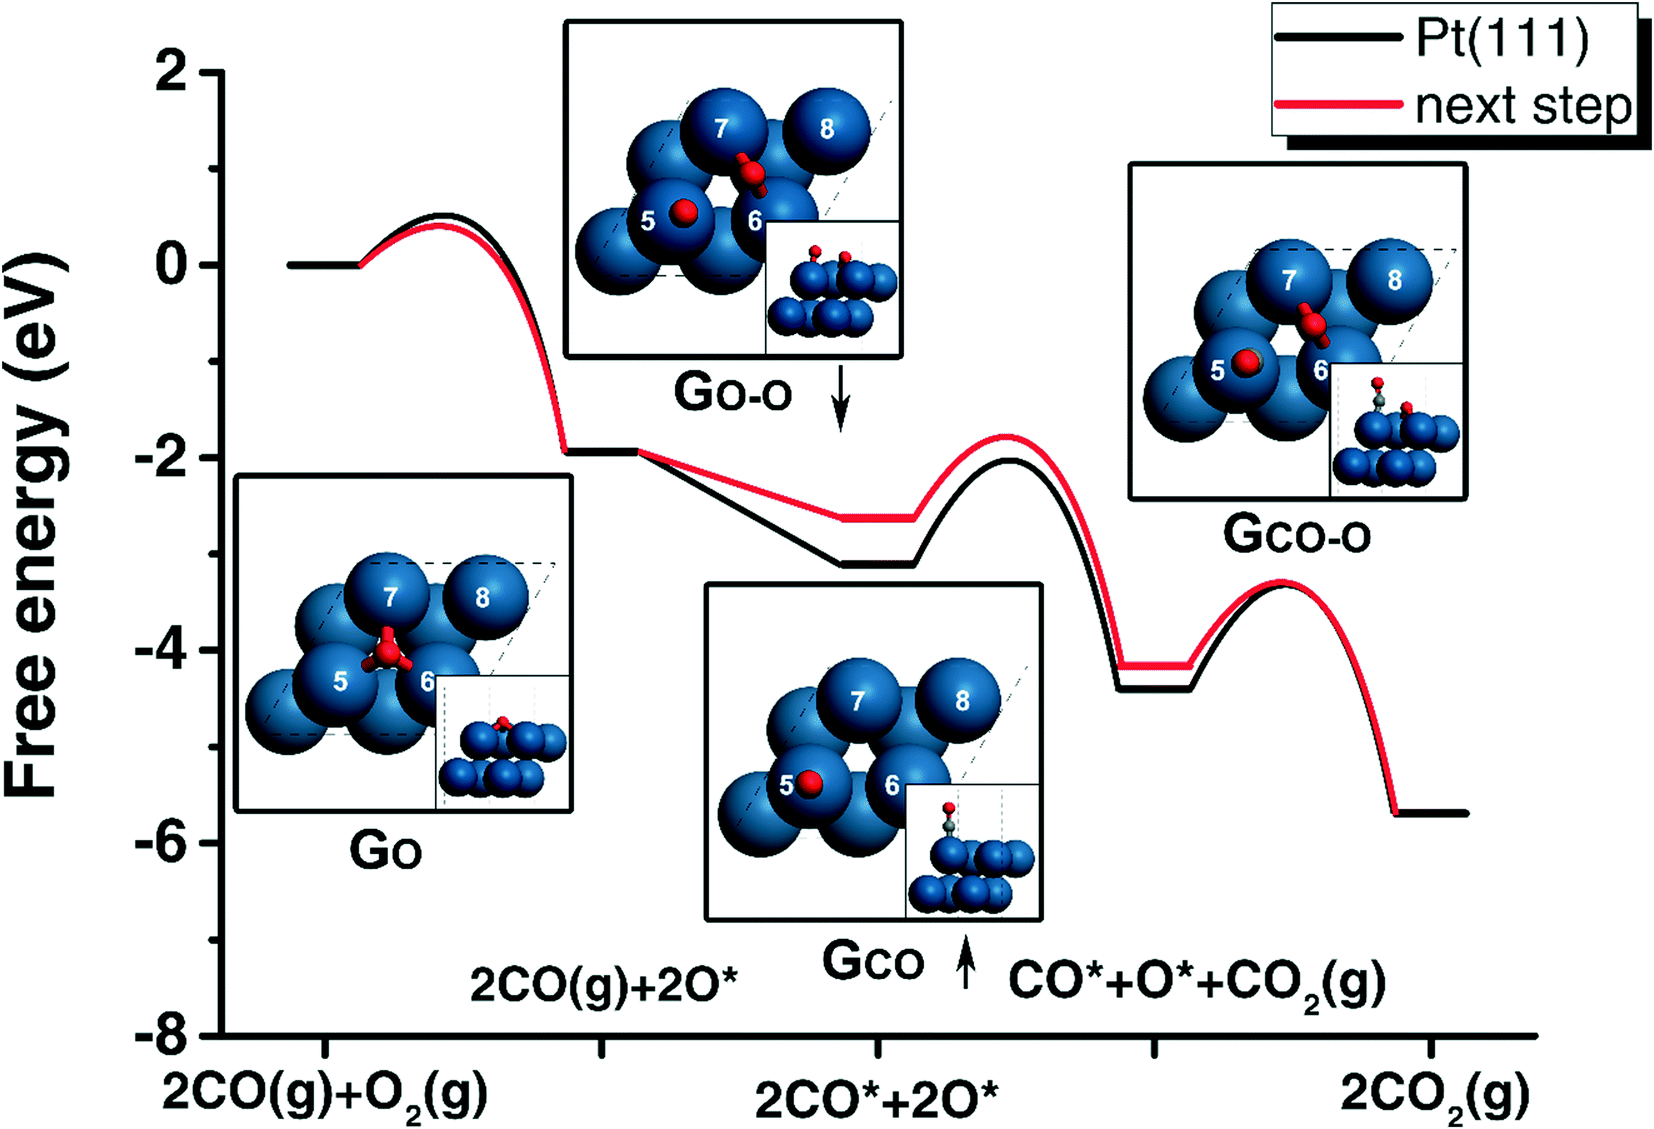 | ||
| Fig. 1 The free energy profiles of CO oxidation on Pt(111) (black) and on the next step surface according to the gradient values (red). The geometries of the adsorbed O, adsorbed (CO), TS of oxygen molecule dissociation (O–O) and TS of CO oxidation (CO–O) are shown with corresponding labels. The up arrow of CO adsorption energy, GCO, indicates that this energy should increase, while the down arrow of O2 dissociation, GO–O, shows that this TS should be more stable in the next step. The indexes of surface atoms are labelled from 5 to 8. | ||
| Step | Component | E CO | E O | E CO–O | E O–O | PDCO | PDO | PDCO–O | PDO–O |
|---|---|---|---|---|---|---|---|---|---|
| 1 | Pt8 | 1.58 | 1.23 | 3.78 | 4.90 | 2.00 | 0.00 | 0.00 | −1.00 |
| 2 | IrPt7 | 1.65 | 0.85 | 3.44 | 4.39 | 0.90 | 1.14 | −1.11 | 0.01 |
| 3 | IrPdPt6 | 1.68 | 0.94 | 3.56 | 4.50 | 0.95 | 1.05 | −1.05 | 0.05 |
| 4 | Ir2PdPt5 | 1.69 | 1.02 | 3.58 | 4.55 | 1.64 | 0.37 | −0.36 | −0.63 |
| 5 | Ir2Pd2Pt4 | 1.73 | 1.00 | 3.62 | 4.57 | 0.95 | 1.02 | −1.05 | 0.04 |
| 6 | Ir3Pd2Pt3 | 1.76 | 1.07 | 3.65 | 4.57 | 1.18 | 0.82 | −0.82 | −0.18 |
| 7 | Ir4Pd2Pt2 | 1.80 | 0.78 | 3.33 | 4.29 | 0.11 | 1.83 | −1.88 | −0.01 |
| 8 | Ir3OsPd2Pt2 | 1.83 | 0.82 | 3.34 | 4.28 | 0.14 | 1.83 | −1.86 | 0.00 |
| 9 | Ir3OsPd3Pt | 1.72 | 0.67 | 3.15 | 4.07 | 1.14 | 0.85 | −0.86 | 0.00 |
3.3. Optimization process
Based on the discussion above, a gradient-based optimization scheme was proposed to design CO oxidation catalysts, as shown in Fig. 2: firstly, a starting structure was chosen as the initial guess for the optimization, namely Pt(111) as discussed above. Secondly, the energies of all the intermediates and TSs, including the adsorbed CO and O and the TSs of CO oxidation and O2 dissociation, were calculated on Pt(111), and based on these energies and micro-kinetic modelling results, the overall activity and the gradient of the overall activity with respect to the energies of all states were obtained. Eqn (2) shows that there should be four partial derivatives involved in the gradient. The energies of TSs of CO oxidation and O2 dissociation are correlated with the energies of adsorbed CO and O, known as the BEP relation. To simplify the optimization process, the partial derivatives of intermediate states are considered, namely the adsorbed CO and O, and the energy changes of TSs were evaluated using the BEP relation. Using eqn (3) and the gradient of overall activity with respect to CO and O chemisorption energies, the adsorption energies of the next step were calculated with the findings presented in Fig. 2. In optimization, if the step size is too small, the optimization process is slow and many optimization steps are needed to reach the optimization criteria. If the step size is too big, it is very hard to converge to a maximum. In this work, the step size γ was set to 0.06. The adsorption sites of Pt(111) are manipulated by substituting one atom with another type of atom, and then the adsorption energies of CO and O on these modified surfaces are predicted using the bonding contribution equation:12 For the alloy system with n different substitutions, the bonding contribution equation for the adsorption energies on the alloy surfaces with n solute metals is as follows: | (4) |
 | ||
| Fig. 2 Block scheme of the optimization strategy for the catalyst design in this work. | ||
Four substituting metals were taken into account in this work, namely Re, Os, Ir and Pd, which were well investigated in the bonding contribution equation. In the manipulation of the surface, only the surface and subsurface atoms were allowed to be substituted. With the gradient, we obtained the desired adsorption energy of the next step with higher activity. We then calculated the adsorption energies of all the alloy surfaces by replacing one metal site using the bonding contribution equation and chose 5 structures with the adsorption energy closest to the desired adsorption energy. The adsorption energies of CO and O, and the TS energies of CO oxidation and O2 dissociation were calculated on these chosen surfaces, and the activities of these 5 surfaces were evaluated using micro-kinetic modelling. Then comparisons are made between the activities of these 5 surfaces with the previous one (Fig. 2). If the activities of these new surfaces are all lower than the previous one, the optimization is deemed finished. If the activity of any new surface is higher than the previous one, the most active surfaces are chosen and treated as the surface of the next optimization cycle (Fig. 2).
Compared with the screening strategy, this gradient-based optimization strategy suggested above has the following advantages: firstly, unlike the exhaustive screening method, the gradient-based optimization strategy is more rational because the explicit direction for better catalysts is given as the gradient of activity, and the catalyst structures are modified towards the higher activity. Secondly, in this strategy, some approximate relations were also considered, including the BEP relation and the bonding contribution equation. However, in each optimization cycle, five candidates for the next step are taken into account, and thus the failure prediction of the BEP relation and bonding contribution equation can be to a great extent avoided. Furthermore, even though the BEP relation was used in the calculation of gradient in this strategy, the TSs were explicitly calculated using DFT, and thus surfaces that do not obey the BEP relation may also be discovered. Thirdly, the adsorption site is modified by substituting one atom in each optimization cycle, which in turn can manipulate the adsorption sites to design better catalysts. Such a step-wise manipulating design may offer a more comprehensive understanding of catalyst design than that of the screening method. In this work, all the BEP relation parameters were obtained using our calculations on pure metals.
4. Results and discussion
Using the gradient-based optimization strategy, a rational catalyst design for CO oxidation was carried out. As mentioned above, the initial guess of this optimization is Pt(111), and the substitution of solute metals, including Re, Os, Ir and Pd, was used to manipulate the adsorption sites. Several alloy surfaces were designed in this work, and the activities of CO oxidation on these surfaces are shown in Fig. 3. In this optimization, starting from the initial activity, 2.90 × 10⁻¹ s−1, of Pt(111), the activities increase dramatically, and after eight optimization cycles, the activity becomes 1.97 × 10⁵ s−1, suggesting that this optimization strategy is robust and efficient in the catalyst design process. To obtain a better understanding of this design process and designed catalysts, in this section, the structure changes in the optimization are reported with their effects on the energies of intermediates and TSs. Next, the activity increase in the optimization is analyzed from both thermodynamic and kinetic aspects. At the end of this section, the structural and energetic properties of the most active catalysts are introduced to understand the reasons for the high activities.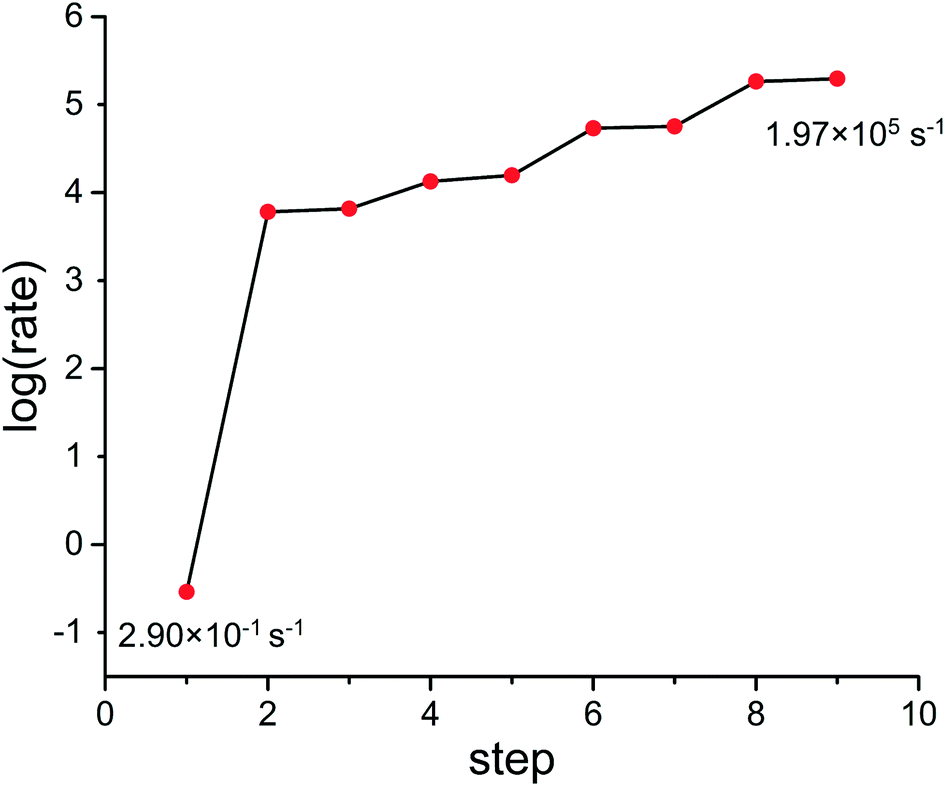 | ||
| Fig. 3 The activity change of CO oxidation on the catalysts designed in steps 1 to 9. The activities increase from 2.90 × 10⁻¹ s−1 of step 1 to 1.97 × 10⁵ s−1 in our design process. | ||
4.1. Changes of structures and energies
In each optimization cycle, one of the surface or subsurface atoms is replaced by another type of metal to manipulate the adsorption site achieving higher activity. In order to discuss this manipulating process, the indexes of all the atoms are needed. As shown in Fig. 4(a), the surface atoms are numbered from 5 to 8, while the subsurface atoms are labelled from 1 to 4. Fig. 1 shows the CO adsorbed on the top site of surface atom 5, while the oxygen atom is on the hollow site of surface atoms 5, 6 and 7. For the transition state of CO oxidation, the oxygen is found on the bridge site of surface atoms 6 and 7, and the CO is located on the top site of atom 5 (Fig. 1). A similar geometry can also be found for the dissociation of the oxygen molecule, as shown in Fig. 1.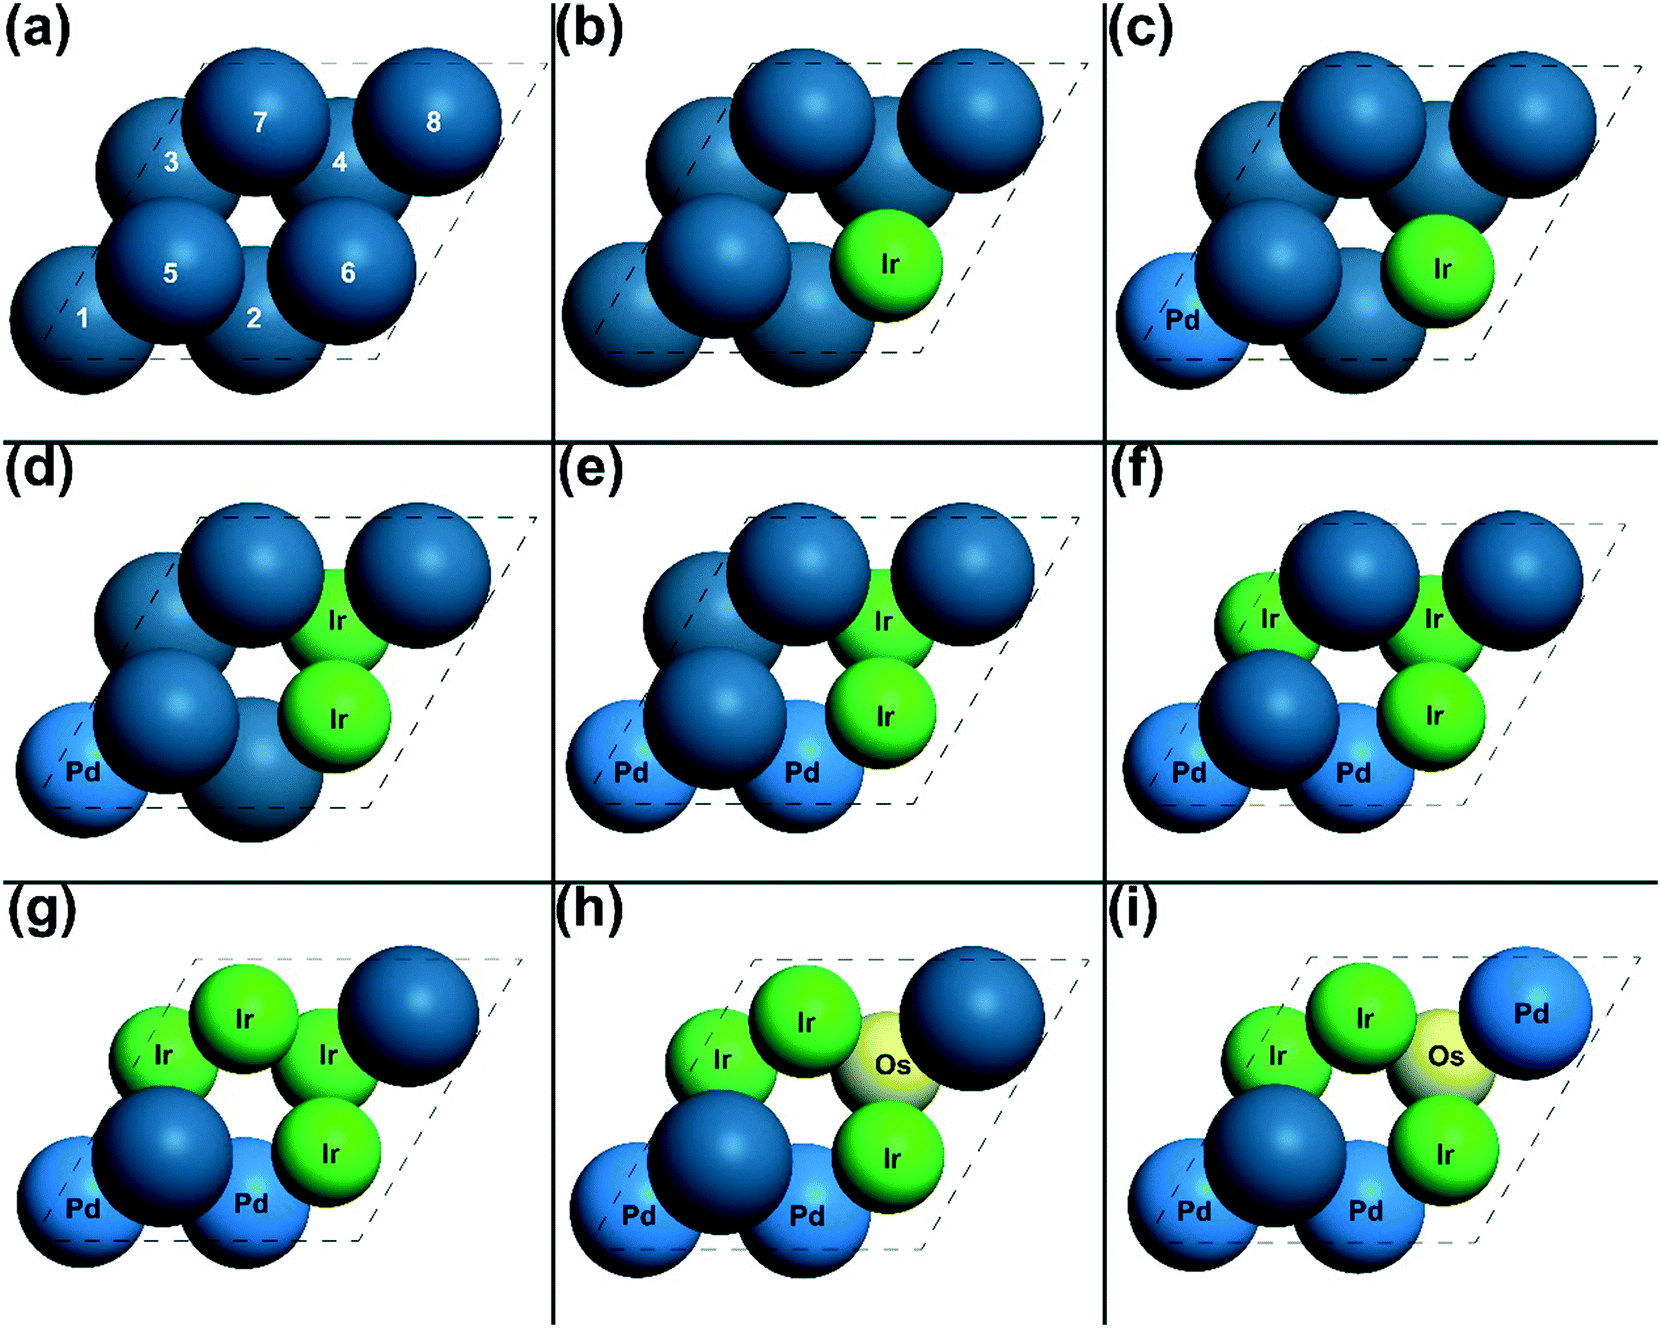 | ||
| Fig. 4 The geometries of the designed catalysts from (a) step 1 to (i) step 9. The metals are represented as: yellow for Os, green for Ir, light blue for Pd and blue for Pt. The indexes of all the surface and subsurface atoms are labelled in (a). These indexes and the atom notation are used throughout the paper. The solute metals are also labelled with their corresponding atom symbol. | ||
The energies of the adsorbed CO and O, and the TSs of CO oxidation and O2 dissociation on Pt(111) were calculated, and the gradient for the activity of these energies was also investigated using micro-kinetic modelling. From these results (shown in Table 1), the most significant partial derivative values were found for the adsorbed CO and the TS of O2 dissociation, which are 2.00 and −1.00, respectively, suggesting that these states are the rate-determining states.66 Thus, as mentioned above, the adsorption site of CO and the reaction site of O2 dissociation should be manipulated to increase the adsorption energy of CO and decrease the transition state energy of O2 dissociation. Using the gradient optimization method, five possible candidates were considered, of which the catalyst in Fig. 4(b) was found to be the most active with an overall reaction rate 6055.14 s−1. After the first optimization cycle, the surface Pt atom 6 was replaced by an Ir atom as shown in Fig. 4(b). With this replacement, the energy of CO on surface atom 5 is increased from 1.58 eV in step 1 to 1.65 eV in step 2 (Table 1). This is because a second neighbour of the adsorption site atom was replaced by a more intrinsic active metal, Ir, making the adsorbed CO less stable according to the bonding contribution equation.12 Moreover, replacing atom 6 with a more active atom changes the first neighbour of adsorbed oxygen and oxygen molecule dissociation, increasing the adsorption strength of oxygen and stabilizing the transition state of oxygen dissociation. Thus, the transition state energy of O2 dissociation is decreased from 4.90 eV to 4.39 eV, as shown in Table 1. Due to the energy changes in the direction of activity gradient, the overall reaction rate of CO oxidation increases from 2.90 × 10⁻¹ s−1 to 6.06 × 10³ s−1 in going from step 1 to step 2.
In the first optimization cycle, one surface Pt has been replaced by an Ir atom. On the modified catalyst after the first optimization cycle, the partial derivatives for activity were calculated of all the energies on the optimized catalyst IrPt7. It was found that the partial derivatives of the adsorption states of CO and O are both positive as shown in Table 1, suggesting that these states need to be destabilized to achieve the higher activity. The partial derivative of the transition state of CO oxidation is −1.11, indicating that the barrier of CO oxidation is too high, hence hindering the overall reaction. As shown in Fig. 4(c), the subsurface Pt atom 1 was replaced by a Pd atom in the second optimization cycle. Atom 1 is the second nearest neighbour atom of all the sites of intermediates and all the TSs, and thus substituting this atom with a slightly more reactive metal would mildly increase the energies of all the states according to the bonding contribution equation. The calculated energies on IrPdPt6 agree with the prediction mentioned above: all the energies of intermediates and TSs slightly increase by around 0.1 eV. With this substitution, the energies of adsorbed CO and O were tuned in the direction of the gradient. Therefore, the overall rate increases from 6.06 × 10³ s−1 to 6.58 × 10³ s−1 in this optimization cycle.
Using this gradient-based optimization, the adsorption sites of CO and O and the reaction sites of CO oxidation and O2 dissociation were manipulated with 8 optimization cycles, in which one surface or subsurface atom was substituted to tune the energies of all the states. As shown in Table 1, in all the optimization cycles, the energy of at least one rate-determining state went in the direction of the gradient as discussed above. Therefore, the overall activity changes from 2.90 × 10⁻¹ s−1 of Pt8 (Fig. 4(a)) in step 1 to 1.97 × 10⁵ s−1 of Ir3OsPd3Pt (Fig. 4(i)) in step 9.
4.2. Thermodynamic and kinetic changes
After reporting the structure and energy changes in the optimization, the free energy changes and free energy barriers of all the reactions on these optimized catalysts are discussed in this section.From the overall rates in this optimization (Table 3), three dramatic changes in the overall rates can be found, namely 2.90 × 10⁻¹ s−1 to 6.06 × 10³ s−1 from step 1 to 2, 1.58 × 10⁴ s−1 to 5.40 × 10⁴ s−1 from step 5 to 6, and 5.68 × 10⁴ s−1 to 1.84 × 10⁵ s−1 from step 7 to 8. On the initial structure Pt(111), as shown in Table 2, the adsorption free energy of CO is −0.59 eV, while the activation energies of O2 dissociation and CO oxidation is 0.47 eV and 1.07 eV, respectively, in the free energy landscape. As mentioned in section 4.1, the CO binding strength on the Pt surface is too strong, hindering the dissociation of O2. Kinetic results agree with this statement; the coverage of CO is very close to 1.00, whereas the coverage of the oxygen atom is only 2.20 × 10⁻⁵ ML (Table 3). After the first optimization cycle, the barrier of oxygen molecule dissociation became negligible, while the adsorption strength of CO was also weakened from −0.59 eV to −0.52 eV (step 2 in Table 2). Therefore, the enhancement of O2 dissociative adsorption and decrease in the CO adsorption energy on the optimized surface in step 2 greatly affect the surface species ratio: 0.44 ML for the CO coverage and 0.56 for the O coverage. Therefore, the reaction rate of CO oxidation is drastically increased from step 1 to step 2.
| Step | G adCO | O2(g) + 2* → 2O* | CO* + O* → CO2(g) + 2* | ||
|---|---|---|---|---|---|
| G a | ΔG | G a | ΔG | ||
| 1 | −0.59 | 0.47 | −1.94 | 1.07 | −1.29 |
| 2 | −0.52 | 0.00 | −2.68 | 1.04 | −0.98 |
| 3 | −0.49 | 0.07 | −2.50 | 1.03 | −1.10 |
| 4 | −0.48 | 0.11 | −2.34 | 0.97 | −1.20 |
| 5 | −0.43 | 0.13 | −2.39 | 0.99 | −1.22 |
| 6 | −0.41 | 0.14 | −2.24 | 0.92 | −1.31 |
| 7 | −0.37 | 0.00 | −2.83 | 0.85 | −1.06 |
| 8 | −0.34 | 0.00 | −2.75 | 0.79 | −1.13 |
| 9 | −0.45 | 0.00 | −3.04 | 0.86 | −0.88 |
| Step | θ CO | θ O | Rate |
|---|---|---|---|
| 1 | 0.99 | 2.20 × 10⁻⁵ | 2.90 × 10⁻¹ |
| 2 | 0.44 | 0.56 | 6.06 × 10³ |
| 3 | 0.48 | 0.52 | 6.58 × 10³ |
| 4 | 0.82 | 0.18 | 1.34 × 10⁴ |
| 5 | 0.48 | 0.52 | 1.58 × 10⁴ |
| 6 | 0.59 | 0.41 | 5.40 × 10⁴ |
| 7 | 0.07 | 0.93 | 5.68 × 10⁴ |
| 8 | 0.07 | 0.93 | 1.84 × 10⁵ |
| 9 | 0.57 | 0.43 | 1.97 × 10⁵ |
Regarding the change from step 5 to 6, on the catalyst surface Ir2Pd2Pt4 of step 5, the adsorption energy of CO is −0.43 eV (Table 2), being 0.16 eV weaker compared with that on Pt(111). As shown in Table 2, the free energy barriers of O2 dissociation and CO oxidation are 0.13 eV and 0.99 eV, respectively, whereas the free energy changes for these two steps are −2.39 eV for O2 dissociation and −1.22 eV for CO oxidation. According to the gradient results (Table 1), the activity on this catalyst is mainly constrained by the over bonding of oxygen. After the optimization, the O2 dissociation on the catalyst in step 6 became less favourable thermodynamically, in which the free energy change decreases by 1.5 eV (Table 2). Furthermore, compared to the catalyst of step 5, the CO oxidation on the optimized catalyst is slightly more favourable both thermodynamically and kinetically, as shown in Table 2. Therefore, after this optimization, the overall reaction rate changes from 1.58 × 10⁴ s−1 to 5.40 × 10⁴ s−1. The next dramatic activity enhancement is from step 7 to step 8. On the catalyst of step 7, Ir4Pd2Pt2, the barrier of dissociative adsorption of an oxygen molecule is negligible with this step also being very exergonic, possessing a free energy change of −2.83 eV. According to the two-step model,7,8 if the adsorption energy of one species is too strong, the dissociation of this species is likely to be unfavourable, thus limiting the overall activity. Therefore, the strong oxygen adsorption on the catalyst of step 7 is likely to present an obstacle in achieving higher activity. On the optimized surface of step 8, the free energy change of O2 dissociative adsorption decreases by 0.08 eV, whilst CO and O coupling (CO* + O* → CO2(g) + 2*)12 also becomes slightly more favourable. After this optimization, the overall activity is increased from 5.68 × 10⁴ s−1 to 1.84 × 10⁵ s−1.
The free energy profiles of CO oxidation on the initial catalyst (Pt(111)), the catalyst of step 5 and the catalyst on step 9, are shown in Fig. 5. From these results, the following features can be seen: firstly, for the dissociative adsorption of O2, the free energy barrier decreases from 0.47 eV of step 1 to 0.13 eV step 5, and then on the catalyst of step 9, the dissociation becomes barrierless. The free energy changes also decrease from −1.94 eV of step 1 to −3.04 eV of step 9, suggesting that after the optimization, the dissociation of O2 is much more exergonic than that of step 1. Secondly, regarding the adsorption of CO, the adsorption free energy first decreases from −0.59 eV of step 1 to −0.43 eV of step 5, and then slightly increases by 0.02 eV to −0.45 eV of step 9. Therefore, after the optimization, the adsorption free energy of CO was only weakened by 0.14 eV, a much smaller change than that of the O2 dissociative adsorption mentioned above. Finally, from the energy profiles (Fig. 5), the CO oxidation becomes much more favourable kinetically after the optimization, with a decrease of the free energy barrier by 0.21 eV. On the other hand, the free energy change of the CO oxidation step decreases from −1.29 eV of step 1 to −0.88 eV of step 9.
 | ||
| Fig. 5 The energy profiles of CO oxidation on the catalysts of step 1 (black), step 5 (red) and step 9 (blue) in the free energy landscape. | ||
4.3. Optimized catalyst
On the optimized catalyst Ir3OsPd3Pt of step 9, the activity of CO oxidation is significantly higher than the pure Pt surface, and the surface structure of step 9 (Fig. 4(i)) is very complex with four different types of atoms. This in turn left many interesting questions that needed to be addressed. What can be taken from these results? Will the complex surface structures change the geometries of the intermediates and TSs? How can they result in such a high activity? Regarding the energies of intermediates and TSs, will these energies still obey the BEP relation? In this section, each of these questions is addressed individually.The geometries of intermediates (CO and O) and TSs (CO oxidation and O2 dissociation) on the catalyst Ir3OsPd3Pt of step 9 are shown in Fig. 6. Comparing these with those on Pt(111) (Fig. 1), it can be seen that despite the structural complexity of the catalyst surface for step 9, the adsorption sites of CO and O and the reaction sites of CO oxidation and O2 dissociation stay the same in general. However, due to the asymmetry of the adsorption or reaction sites, the atom positions of the intermediates and the TSs on the optimized catalyst are slightly different from those on Pt(111). The Pt–O bond length is 2.04 Å on Pt(111) for all the three bonds (Fig. 1 inset), whereas on the optimized catalysts (Fig. 6(b)), the two Ir–O bond lengths are 2.05 Å and 2.02 Å, respectively, and the Pt–O bond length is 2.22 Å. Furthermore, the C–O bond in the transition state geometry of CO oxidation (Fig. 6(c)) and the O–O bond in the transition state geometry of O2 dissociation (Fig. 6(d)) are 1.94 Å and 1.80 Å, respectively, which are both shorter than 2.08 Å for the C–O bond and 2.18 Å for the O–O bond on Pt(111).
 | ||
| Fig. 6 The top views and side views (insets) of (a) adsorbed CO, (b) adsorbed oxygen atoms, (c) transition state of CO oxidation, and (d) transition state of O2 dissociation on the catalyst candidate of step 9. Oxygen and carbon atoms are in red and grey, respectively. | ||
With these geometries of the intermediates and the TSs (Fig. 6), the effects of each component atom can be explained. For the adsorption of CO, the adsorption slightly decreases by 0.14 eV represented in Table 2. From the geometries of CO adsorption (Fig. 6), the geometry of the adsorption site remains unchanged after the activity optimization, whilst all the second nearest neighbour atoms are replaced by Ir or Pd atoms. Based on the bonding contribution equation,12 the replacement of the adsorption site atom has the most significant effect on the adsorption energies, and the effects of the second nearest neighbour replacement are much smaller. Therefore, the adsorption energy of CO on the optimized catalyst only differs slightly because CO still adsorbs on the Pt atom. Moreover, according to the bonding contribution equation, replacing the adsorption site atom with a more reactive metal can increase the bonding strength, but the adsorption becomes weaker if a second nearest atom is replaced. For the optimized catalyst Ir3OsPd3Pt, the second neighbours are all replaced by reactive metals, thus decreasing the adsorption energies of CO. The adsorption energy change of an oxygen atom on the optimized catalyst can also be explained using a similar approach. From Fig. 6(b), it can be seen that two adsorption site atoms are replaced by Ir atoms, which are more reactive than Pt, resulting in the adsorption strength of the oxygen atom being 0.56 eV stronger than that on the original Pt(111) surface.
Having discussed the structural properties of the optimized catalyst, we are in the position to discuss the energetic properties on the optimized catalyst, namely checking the BEP relation on the catalysts in the optimization. The BEP relations of CO oxidation and O2 dissociation on pure close-packed metal surfaces are shown in Fig. 7, along with the energies on the catalysts in the optimization. From this figure, it can be seen that for O2 dissociation, the energies of the oxygen atom and the transition state of O2 dissociation are still on the BEP relation of pure metal in general. Therefore, the barrierless dissociation of an oxygen molecule is caused by the strong adsorption strength of oxygen on the optimized catalyst. Regarding the oxidation of CO, the energies of adsorbed CO and O, and the transition state of CO oxidation correlate well on the catalysts from 1 to 6. However, after the optimization cycle from steps 6 to 7, the energies of intermediates and TSs do not obey the BEP relation any more, as shown in Fig. 7(a). From Fig. 7(a), it can be seen that according to the BEP relation of pure metal, the energy of the CO oxidation transition state on the optimized catalyst should be higher than the calculated value, suggesting that the complex surface structure of the optimized catalyst makes it possible to circumvent the BEP relation, increasing the overall activity. These unexpected phenomena may be caused by the inhomogeneous adsorption properties of the alloy surfaces and the existence of multiple energy configurations. The adsorption energies of step 7, step 8, and step 9 structures seem to be on another BEP relation, which is interesting for future studies. Therefore, the extraordinary activity of the optimized catalyst is derived not only from the tuning of energies in the more active direction based on the gradient, but also from the alloy structure circumventing the BEP relation. It is also worth noting that some aspects of kinetics, such as the coverage effect, are not considered, which may lead to some errors in the calculated activity. However, the main aim of our work is to demonstrate the concept of our rational design of new catalysts: as shown above, it is very promising and exciting.
 | ||
| Fig. 7 The BEP relations of CO oxidation on (a) designed catalysts and (b) pure metals, and O2 dissociation on (c) designed catalysts and (d) pure metals. The energies of adsorbed CO (ECO) and (EO) and the energies of CO oxidation (ECO–O) and O2 dissociation (EO–O) transition states on the catalysts from step 1 to step 9 are also marked with their corresponding label. All the free energies are in eV and represented using formation energies with respect to the energies of H in H2, C in CH4 and O in H2O. | ||
5. Conclusion
This work represents an attempt to transfer the task of rational catalyst design to an optimization problem. The gradient ascent method is chosen as an example for the optimization of surface structures towards the maximum activity based on the gradient of the overall reaction rate. Unlike traditional screening methods, this gradient-based optimization does not need to know the peak positions of the volcano curves. Therefore, our method may discover catalysts that are different from traditional screening methods. Furthermore, the gradient-based optimization strategy not only offers the surface structure and component of the designed catalyst, but also gives details on how to achieve higher activity step-by-step. Taking CO oxidation as an example, it was shown how one active catalyst, platinum, is engineered one atom by one atom towards higher activity. After eight-step optimization, the activity of CO oxidation from micro-kinetic modelling increases significantly. Interestingly, we found that the high activity of the designed catalyst is not only due to the tuning of energies in the more active direction but also from the alloy structure circumventing the BEP relation. Therefore, the gradient-based optimization strategy offers not only a deep understanding of the relationship between surface structures and catalytic activity but also makes it possible to design novel catalysts.Conflicts of interest
There are no conflicts to declare.References
- B. Hammer and J. K. Nørskov, Nature, 1995, 376, 238–240 CrossRef CAS.
- V. Pallassana and M. Neurock, J. Catal., 2000, 191, 301–317 CrossRef CAS.
- Z. P. Liu and P. Hu, J. Chem. Phys., 2001, 114, 8244–8247 CrossRef CAS.
- A. Logadottir, T. H. Rod, J. K. Norskov, B. Hammer, S. Dahl and C. J. H. Jacobsen, J. Catal., 2001, 197, 229–231 CrossRef CAS.
- P. Sabatier, Ber. Dtsch. Chem. Ges., 1911, 44, 1984–2001 CrossRef CAS.
- H. Falsig, T. Bligaard, J. Rass-Hansen, A. L. Kustov, C. H. Christensen and J. K. Norskov, Top. Catal., 2007, 45, 117–120 CrossRef CAS.
- J. Cheng, P. Hu, P. Ellis, S. French, G. Kelly and C. M. Lok, J. Phys. Chem. C, 2008, 112, 1308–1311 CrossRef CAS.
- J. Cheng and P. Hu, J. Am. Chem. Soc., 2008, 130, 10868–10869 CrossRef CAS.
- F. Calle-Vallejo, J. I. Martínez, J. M. García-Lastra, P. Sautet and D. Loffreda, Angew. Chem., Int. Ed., 2014, 53, 8316–8319 CrossRef CAS.
- F. Calle-Vallejo, D. Loffreda, T. M. KoperMarc and P. Sautet, Nat. Chem., 2015, 7, 403–410 CrossRef CAS.
- F. Calle-Vallejo and A. S. Bandarenka, ChemSusChem, 2018, 11, 1824–1828 CrossRef CAS.
- Z. Wang and P. Hu, Phys. Chem. Chem. Phys., 2017, 19, 5063–5069 RSC.
- Z. Wang and P. Hu, Chem. Commun., 2017, 53, 8106–8109 RSC.
- Y. Ding, Y. Xu, Y. Mao, Z. Wang and P. Hu, Chem. Commun., 2020, 56, 3214–3217 RSC.
- X. Ma and H. Xin, Phys. Rev. Lett., 2017, 118, 036101 CrossRef.
- M. Zhong, K. Tran, Y. Min, C. Wang, Z. Wang, C.-T. Dinh, P. De Luna, Z. Yu, A. S. Rasouli, P. Brodersen, S. Sun, O. Voznyy, C.-S. Tan, M. Askerka, F. Che, M. Liu, A. Seifitokaldani, Y. Pang, S.-C. Lo, A. Ip, Z. Ulissi and E. H. Sargent, Nature, 2020, 581, 178–183 CrossRef CAS.
- Z. W. Ulissi, M. T. Tang, J. Xiao, X. Liu, D. A. Torelli, M. Karamad, K. Cummins, C. Hahn, N. S. Lewis, T. F. Jaramillo, K. Chan and J. K. Nørskov, ACS Catal., 2017, 7, 6600–6608 CrossRef CAS.
- A. A. Peterson, R. Christensen and A. Khorshidi, Phys. Chem. Chem. Phys., 2017, 19, 10978–10985 RSC.
- J. K. Pedersen, T. A. A. Batchelor, A. Bagger and J. Rossmeisl, ACS Catal., 2020, 10, 2169–2176 CrossRef CAS.
- W. Gao, Y. Chen, B. Li, S.-P. Liu, X. Liu and Q. Jiang, Nat. Commun., 2020, 11, 1196 CrossRef CAS.
- N. Govindarajan, M. T. M. Koper, E. J. Meijer and F. Calle-Vallejo, ACS Catal., 2019, 9, 4218–4225 CrossRef CAS.
- K. S. Exner, ACS Appl. Energy Mater., 2019, 2, 7991–8001 CrossRef CAS.
- T. S. Choksi, L. T. Roling, V. Streibel and F. Abild-Pedersen, J. Phys. Chem. Lett., 2019, 10, 1852–1859 CrossRef CAS.
- T. A. A. Batchelor, J. K. Pedersen, S. H. Winther, I. E. Castelli, K. W. Jacobsen and J. Rossmeisl, Joule, 2019, 3, 834–845 CrossRef CAS.
- J. Greeley, T. F. Jaramillo, J. Bonde, I. B. Chorkendorff and J. K. Nørskov, Nat. Mater., 2006, 5, 909–913 CrossRef CAS.
- F. Studt, F. Abild-Pedersen, T. Bligaard, R. Z. Sorensen, C. H. Christensen and J. K. Nørskov, Science, 2008, 320, 1320–1322 CrossRef CAS.
- C. H. Christensen and J. K. Nørskov, J. Chem. Phys., 2008, 128, 182503 CrossRef.
- J. K. Nørskov, T. Bligaard, J. Rossmeisl and C. H. Christensen, Nat. Chem., 2009, 1, 37–46 CrossRef.
- J. Greeley and J. K. Nørskov, J. Phys. Chem. C, 2009, 113, 4932–4939 CrossRef CAS.
- J. Cheng and P. Hu, Angew. Chem., Int. Ed., 2011, 50, 7650–7654 CrossRef CAS.
- T. Bligaard, J. K. Norskov, S. Dahl, J. Matthiesen, C. H. Christensen and J. Sehested, J. Catal., 2004, 224, 206–217 CrossRef CAS.
- J. K. Nørskov, T. Bligaard, A. Logadottir, S. Bahn, L. B. Hansen, M. Bollinger, H. Bengaard, B. Hammer, Z. Sljivancanin, M. Mavrikakis, Y. Xu, S. Dahl and C. J. H. Jacobsen, J. Catal., 2002, 209, 275–278 CrossRef.
- Y. Hou, D. Wang, X. H. Yang, W. Q. Fang, B. Zhang, H. F. Wang, G. Z. Lu, P. Hu, H. J. Zhao and H. G. Yang, Nat. Commun., 2013, 4, 1583 CrossRef.
- Z. Wang and P. Hu, Top. Catal., 2015, 58, 633–643 CrossRef CAS.
- Z. Wang, B. Yang, Y. Wang, Y. Zhao, X. M. Cao and P. Hu, Phys. Chem. Chem. Phys., 2013, 15, 9498–9502 RSC.
- F. Abild-Pedersen, J. Greeley, F. Studt, J. Rossmeisl, T. R. Munter, P. G. Moses, E. Skulason, T. Bligaard and J. K. Nørskov, Phys. Rev. Lett., 2007, 99, 016105 CrossRef CAS.
- A. Vojvodic and J. K. Nørskov, Natl. Sci. Rev., 2015, 2, 140–149 CrossRef CAS.
- G. Kresse and J. Furthmüller, Phys. Rev. B: Condens. Matter Mater. Phys., 1996, 54, 11169–11186 CrossRef CAS.
- G. Kresse and J. Furthmuller, Comput. Mater. Sci., 1996, 6, 15–50 CrossRef CAS.
- G. Kresse and J. Hafner, Phys. Rev. B: Condens. Matter Mater. Phys., 1994, 49, 14251–14269 CrossRef CAS.
- G. Kresse and J. Hafner, Phys. Rev. B: Condens. Matter Mater. Phys., 1993, 47, 558–561 CrossRef CAS.
- J. P. Perdew, K. Burke and M. Ernzerhof, Phys. Rev. Lett., 1996, 77, 3865–3868 CrossRef CAS.
- G. Kresse and D. Joubert, Phys. Rev. B: Condens. Matter Mater. Phys., 1999, 59, 1758–1775 CrossRef CAS.
- P. E. Blöchl, Phys. Rev. B: Condens. Matter Mater. Phys., 1994, 50, 17953–17979 CrossRef.
- A. Michaelides, Z. P. Liu, C. J. Zhang, A. Alavi, D. A. King and P. Hu, J. Am. Chem. Soc., 2003, 125, 3704–3705 CrossRef CAS.
- Z. P. Liu and P. Hu, J. Am. Chem. Soc., 2003, 125, 1958–1967 CrossRef CAS.
- A. Alavi, P. J. Hu, T. Deutsch, P. L. Silvestrelli and J. Hutter, Phys. Rev. Lett., 1998, 80, 3650–3653 CrossRef CAS.
- X. M. Cao, R. Burch, C. Hardacre and P. Hu, Catal. Today, 2011, 165, 71–79 CrossRef CAS.
- Z. Y. Wang, X. Y. Liu, D. W. Rooney and P. Hu, Surf. Sci., 2015, 640, 181–189 CrossRef CAS.
- Z. Wang, X. M. Cao, J. Zhu and P. Hu, J. Catal., 2014, 311, 469–480 CrossRef CAS.
- T. Komatsu and A. Tamura, J. Catal., 2008, 258, 306–314 CrossRef CAS.
- H. Falsig, B. Hvolbaek, I. S. Kristensen, T. Jiang, T. Bligaard, C. H. Christensen and J. K. Nørskov, Angew. Chem., Int. Ed., 2008, 47, 4835–4839 CrossRef CAS.
- R. Y. Brogaard, R. Henry, Y. Schuurman, A. J. Medford, P. G. Moses, P. Beato, S. Svelle, J. K. Nørskov and U. Olsbye, J. Catal., 2014, 314, 159–169 CrossRef CAS.
- A. J. Medford, J. Sehested, J. Rossmeisl, I. Chorkendorff, F. Studt, J. K. Norskov and P. G. Moses, J. Catal., 2014, 309, 397–407 CrossRef CAS.
- A. Medford, C. Shi, M. Hoffmann, A. Lausche, S. Fitzgibbon, T. Bligaard and J. Nørskov, Catal. Lett., 2015, 145, 794–807 CrossRef CAS.
- F. Johansson, mpmath: a Python library for arbitrary-precision floating-point arithmetic (version 0.14), 2010 Search PubMed.
- Z. Wang and P. Hu, Philos. Trans. R. Soc., A, 2016, 374, 20150078 CrossRef.
- A. R. Oganov, A. O. Lyakhov and M. Valle, Acc. Chem. Res., 2011, 44, 227–237 CrossRef CAS.
- J. Pannetier, J. Bassas-Alsina, J. Rodriguez-Carvajal and V. Caignaert, Nature, 1990, 346, 343–345 CrossRef CAS.
- Y. C. Wang, J. Lv, L. Zhu and Y. M. Ma, Comput. Phys. Commun., 2012, 183, 2063–2070 CrossRef CAS.
- C. Stegelmann, A. Andreasen and C. T. Campbell, J. Am. Chem. Soc., 2009, 131, 8077–8082 CrossRef CAS.
- C. Stegelmann, N. C. Schiødt, C. T. Campbell and P. Stoltze, J. Catal., 2004, 221, 630–649 CrossRef CAS.
- C. T. Campbell, J. Catal., 2001, 204, 520–524 CrossRef CAS.
- S. Shan, V. Petkov, L. Yang, J. Luo, P. Joseph, D. Mayzel, B. Prasai, L. Wang, M. Engelhard and C.-J. Zhong, J. Am. Chem. Soc., 2014, 136, 7140–7151 CrossRef CAS.
- J. Xu, T. White, P. Li, C. He, J. Yu, W. Yuan and Y.-F. Han, J. Am. Chem. Soc., 2010, 132, 10398–10406 CrossRef CAS.
- S. Kozuch and J. M. L. Martin, ChemPhysChem, 2011, 12, 1413–1418 CrossRef CAS.
| This journal is © The Royal Society of Chemistry 2021 |