 Open Access Article
Creative Commons Attribution 3.0 Unported Licence
A surface oxidised Fe–S catalyst for the liquid phase hydrogenation of CO2†
Claire E.
Mitchell
 a,
Umberto
Terranova
 ab,
Andrew M.
Beale
 cd,
Wilm
Jones
 cd,
David J.
Morgan
 a,
Meenakshisundaram
Sankar
 *a and
Nora H.
de Leeuw
 *ae
*ae
aCardiff Catalysis Institute, School of Chemistry, Cardiff University, Cardiff, CF10 4AT, UK. E-mail: sankar@cardiff.ac.uk
bSchool of Postgraduate Medicine and Allied Health, Crewe campus, University of Buckingham, Crewe, CW1 5DU, UK
cDepartment of Chemistry, University College London, London, WC1H 0AJ, UK
dResearch Complex at Harwell, Rutherford Appleton Laboratory, Harwell Science & Innovation Campus, Harwell, Didcot, OX11 0FA, UK
eSchool of Chemistry, University of Leeds, Leeds, LS2 9JT, UK. E-mail: n.h.deleeuw@leeds.ac.uk
First published on 23rd November 2020
Abstract
Rapidly increasing anthropogenic carbon dioxide (CO2) emissions, coupled with irreversible climate change and depleting fossil fuel reserves, have significantly increased the drive for CO2 utilisation. Iron sulfide as a catalyst for the hydrogenation of CO2 has been discussed in the literature for decades, especially in an origin-of-life context, but little experimental evidence exists in the literature for its feasibility. Here we report the catalytic properties of pyrrhotite (Fe1−xS) for the hydrogenation of CO2 into formate. Advanced material characterisation methods in combination with computational studies have allowed us to identify surface S–Fe–O moieties as active sites for the reaction.
Due to the high natural abundance, low cost and low toxicity of iron and sulfur, the last decade has seen attention focussed on iron sulfide structures, including pyrrhotite (Fe1−xS), pyrite (FeS2) and greigite (Fe3S4), for their potential in green catalytic applications and energy storage.1–7 Fe–S phases have been hypothesised as potential membrane catalysts produced at hydrothermal vents, which reduce aqueous carbon dioxide (CO2) in the formation of prebiotic molecules on the pathway to the emergence of life on early Earth,8–10 owing to their unique similarities to iron and sulfur clusters within enzyme active sites. Following this lead, bio-inspired Fe–S catalysts such as FeS2,11 Fe3S4 (ref. 1) and Fe4.5Ni4.5S8 (ref. 12 and 13) have been reported for the electrochemical reduction of CO2. However, in these systems the reduction potential of the H2/2H+ couple is not sufficiently low to reduce CO2 to formate (HCOO−), formaldehyde (HCHO) or similar oxygenates,14 resulting in poor activity and low product yields. Thermal catalysis in an alkaline medium, using high pressure CO2, can overcome such challenges, and can be potentially used in large scale industrial production.
Herein, we present the catalytic properties of iron sulfide-based materials for the hydrogenation of CO2 to formate under alkaline hydrothermal conditions, proceeding via a HCO3− intermediate. After pyrite, pyrrhotite is the most common and abundant iron sulfide mineral in nature and one of the most stable Fe–S phases, occurring as an accessory mineral in many rocks and found in a wide range of hydrothermal deposits.15,16 Pyrrhotite is highly sensitive to oxygen and upon contact with air or moisture, the surface of the material spontaneously oxidises through an established process.16–19 Our work focuses on investigating the effect of oxidation on the catalytic efficacy of these iron sulfide materials. By enhancing the catalytic properties of these materials, via controlled calcination, we report new possibilities for a cheap, non-toxic, readily available pyrrhotite-based catalyst.
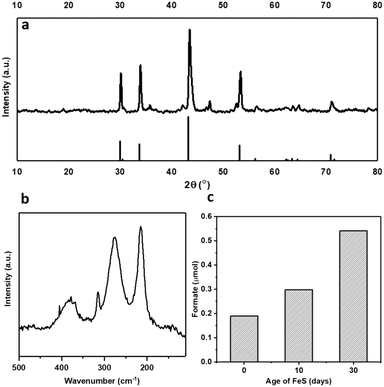
Pyrrhotite materials were prepared using an adapted method reported by Beal et al.20 (ESI†). The synthesis methodology uses rapid in situ sulfidization of the decomposition product of Fe(acac)2 with elemental sulfur to form Fe1−xS.21–23 Pyrrhotite can be identified as the majority phase, as confirmed by XRD, Fig. 1a, presenting five major reflections at 2θ ≈ 31, 34, 44, 53 and 71°, (JCPDS-PDF card no. 01-079-5974). Raman spectroscopy, Fig. 1b, showing bands at 215, 277 and 384 cm−1, also perfectly correlate with reported Raman spectra of natural pyrrhotite.24 The XRD patterns in Fig. S1† confirm the successful conversion of Fe(acac)2 precursor to Fe1−xS without any iron carbide formation. Elemental analysis revealed an Fe![[thin space (1/6-em)]](https://www.rsc.org/images/entities/char_2009.gif) :
:![[thin space (1/6-em)]](https://www.rsc.org/images/entities/char_2009.gif) S ratio of 0.96
S ratio of 0.96![[thin space (1/6-em)]](https://www.rsc.org/images/entities/char_2009.gif) :
:![[thin space (1/6-em)]](https://www.rsc.org/images/entities/char_2009.gif) 1, (Table S1†), which is consistent with the stoichiometry of hexagonal pyrrhotite.25
1, (Table S1†), which is consistent with the stoichiometry of hexagonal pyrrhotite.25
The lab-synthesised pyrrhotite was tested for the liquid phase CO2 hydrogenation in an aqueous 1 M NaOH solution at 125 °C and at 20 bar pressure (CO2![[thin space (1/6-em)]](https://www.rsc.org/images/entities/char_2009.gif) :
:![[thin space (1/6-em)]](https://www.rsc.org/images/entities/char_2009.gif) H2, 1
H2, 1![[thin space (1/6-em)]](https://www.rsc.org/images/entities/char_2009.gif) :
:![[thin space (1/6-em)]](https://www.rsc.org/images/entities/char_2009.gif) 1 at 25 °C), see ESI† for full procedure. Previously, we have reported the hydrogenation of CO2 using different alkaline solvents; NaOH, NaHCO3 and Na2CO3
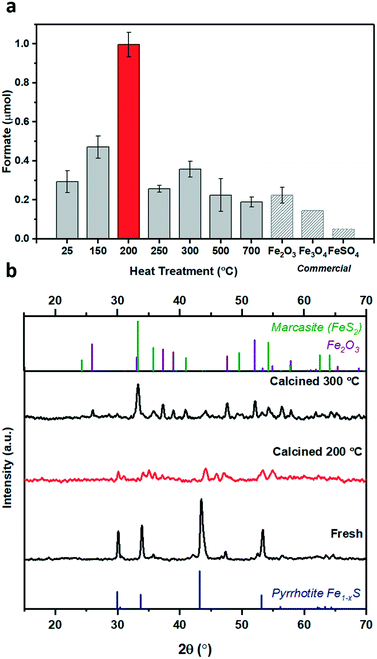
1 at 25 °C), see ESI† for full procedure. Previously, we have reported the hydrogenation of CO2 using different alkaline solvents; NaOH, NaHCO3 and Na2CO3![[thin space (1/6-em)]](https://www.rsc.org/images/entities/char_2009.gif) 26 and found that NaOH is the most suitable base for this reaction. When NaOH was used, all the formate is produced from CO2 rather than from the alkaline salt.26 Based on these prior results, we have used NaOH in this study as well. After CO2 dissolution, the pH of the reaction medium is ca. pH 6–8,26i.e. conditions favouring HCO3− species,27 which is hence considered as the intermediate carbon species. Freshly synthesised pyrrhotite was found to be active for CO2 hydrogenation, resulting in 0.19 μmols of formate after 3 days of reaction, Fig. 1c. Interestingly, pyrrhotite aged in air at room temperature and pressure for 30 days displayed a much better activity, yielding 0.54 μmols of formate under identical reaction conditions, stimulating a hypothesis that oxidation improves the activity of the material. To investigate this suggestion further, fresh pyrrhotite was calcined at different temperatures and tested for CO2 hydrogenation, Fig. 2a. Calcination at 200 °C resulted in the most active catalyst, achieving the highest formate productivity of 1.00 μmol after 3 days, a significant improvement on the catalytic activity of pyrrhotite (0.29 μmol). However, increasing the calcination temperature above 200 °C resulted in reduced formate productivity (0.26 μmol for samples calcined at 250 °C). The first bar in Fig. 2a is the productivity of fresh sample kept at room temperature (25 °C) for several days, hence the formate productivity is higher than the fresh catalyst presented in Fig. 1c. XRD of a 200 °C calcined sample, Fig. 2b, revealed the presence of a poorly crystalline sample of lower symmetry, comprising a number of phases although their identification is ambiguous. A comparison with JCPDS database entries suggests the 200 °C pattern may comprise contributions from the original pyrrhotite, marcasite (FeS2) (JCPS 01-074-1051 PDF file) and Fe2O3 (JCPS 01-085-0987 PDF file). However, an examination of the SEM before and after calcination (Fig. S2†) reveals no obvious formation of multiple phases (morphologies), but rather an overall reduction in particle size. The XRD pattern of a pyrrhotite sample calcined at 300 °C, Fig. 2b, shows evidence of the presence of marcasite and iron oxide, Fe2O3. The formation of these new Fe–S or Fe–O phases in correlation with loss in activity implies that they are not the source of the enhanced activity. Increasing the temperature beyond 300 °C leads to the formation of primarily Fe2O3, as determined by XRD in Fig. S3† and supported by TGA in Fig. S4,† which reveal a mass loss from 300 °C, implying Fe–S decomposition releasing SO2. Commercial Fe2O3, Fe3O4 and FeSO4 samples resulted in low formate productivity (Fig. 2a), thus eliminating the possibility of their role as catalytic active site within our oxidised Fe–S catalyst. Heating pyrrhotite under an N2 atmosphere at 200 °C also had little effect on the crystal structure of the pyrrhotite phase, and a reduced catalytic activity, most likely due to the absence of the surface oxide species (Fig. S5†). To understand the role of calcination on the structural properties of pyrrhotite and in turn its catalytic property, these materials were characterised by several spectroscopic and microscopic methods.
26 and found that NaOH is the most suitable base for this reaction. When NaOH was used, all the formate is produced from CO2 rather than from the alkaline salt.26 Based on these prior results, we have used NaOH in this study as well. After CO2 dissolution, the pH of the reaction medium is ca. pH 6–8,26i.e. conditions favouring HCO3− species,27 which is hence considered as the intermediate carbon species. Freshly synthesised pyrrhotite was found to be active for CO2 hydrogenation, resulting in 0.19 μmols of formate after 3 days of reaction, Fig. 1c. Interestingly, pyrrhotite aged in air at room temperature and pressure for 30 days displayed a much better activity, yielding 0.54 μmols of formate under identical reaction conditions, stimulating a hypothesis that oxidation improves the activity of the material. To investigate this suggestion further, fresh pyrrhotite was calcined at different temperatures and tested for CO2 hydrogenation, Fig. 2a. Calcination at 200 °C resulted in the most active catalyst, achieving the highest formate productivity of 1.00 μmol after 3 days, a significant improvement on the catalytic activity of pyrrhotite (0.29 μmol). However, increasing the calcination temperature above 200 °C resulted in reduced formate productivity (0.26 μmol for samples calcined at 250 °C). The first bar in Fig. 2a is the productivity of fresh sample kept at room temperature (25 °C) for several days, hence the formate productivity is higher than the fresh catalyst presented in Fig. 1c. XRD of a 200 °C calcined sample, Fig. 2b, revealed the presence of a poorly crystalline sample of lower symmetry, comprising a number of phases although their identification is ambiguous. A comparison with JCPDS database entries suggests the 200 °C pattern may comprise contributions from the original pyrrhotite, marcasite (FeS2) (JCPS 01-074-1051 PDF file) and Fe2O3 (JCPS 01-085-0987 PDF file). However, an examination of the SEM before and after calcination (Fig. S2†) reveals no obvious formation of multiple phases (morphologies), but rather an overall reduction in particle size. The XRD pattern of a pyrrhotite sample calcined at 300 °C, Fig. 2b, shows evidence of the presence of marcasite and iron oxide, Fe2O3. The formation of these new Fe–S or Fe–O phases in correlation with loss in activity implies that they are not the source of the enhanced activity. Increasing the temperature beyond 300 °C leads to the formation of primarily Fe2O3, as determined by XRD in Fig. S3† and supported by TGA in Fig. S4,† which reveal a mass loss from 300 °C, implying Fe–S decomposition releasing SO2. Commercial Fe2O3, Fe3O4 and FeSO4 samples resulted in low formate productivity (Fig. 2a), thus eliminating the possibility of their role as catalytic active site within our oxidised Fe–S catalyst. Heating pyrrhotite under an N2 atmosphere at 200 °C also had little effect on the crystal structure of the pyrrhotite phase, and a reduced catalytic activity, most likely due to the absence of the surface oxide species (Fig. S5†). To understand the role of calcination on the structural properties of pyrrhotite and in turn its catalytic property, these materials were characterised by several spectroscopic and microscopic methods.
XPS spectra of a fresh pyrrhotite sample and a sample calcined at 200 °C are presented in Fig. 3a–d. The atomic surface ratio of Fe![[thin space (1/6-em)]](https://www.rsc.org/images/entities/char_2009.gif) :
:![[thin space (1/6-em)]](https://www.rsc.org/images/entities/char_2009.gif) S
S![[thin space (1/6-em)]](https://www.rsc.org/images/entities/char_2009.gif) :
:![[thin space (1/6-em)]](https://www.rsc.org/images/entities/char_2009.gif) O in a fresh pyrrhotite sample was 12
O in a fresh pyrrhotite sample was 12![[thin space (1/6-em)]](https://www.rsc.org/images/entities/char_2009.gif) :
:![[thin space (1/6-em)]](https://www.rsc.org/images/entities/char_2009.gif) 39
39![[thin space (1/6-em)]](https://www.rsc.org/images/entities/char_2009.gif) :
:![[thin space (1/6-em)]](https://www.rsc.org/images/entities/char_2009.gif) 49, but in the calcined sample it was approximately 13
49, but in the calcined sample it was approximately 13![[thin space (1/6-em)]](https://www.rsc.org/images/entities/char_2009.gif) :
:![[thin space (1/6-em)]](https://www.rsc.org/images/entities/char_2009.gif) 7
7![[thin space (1/6-em)]](https://www.rsc.org/images/entities/char_2009.gif) :
:![[thin space (1/6-em)]](https://www.rsc.org/images/entities/char_2009.gif) 80. As pyrrhotite is highly air sensitive, exposure to oxygen forces Fe atoms to diffuse from the interior to the surface to combine with oxygen,28 altering the surface Fe/S ratio. Calcination increased the rate of oxidation to form an oxygen-rich surface with an atomic percentage of 80%. TGA (Fig. S4†) revealed no significant mass loss at 200 °C, and therefore no sulfur had been removed from the surface as SO2. Fe 2p analysis of fresh pyrrhotite surfaces, shown in Fig. 3a, reveals three distinct peaks at 710.1–713.3 eV, indicating the presence of oxidised iron. Another, smaller peak at 707.3 eV, indicates the presence of Fe(II)–S species.28,29 Calcination of pyrrhotite increases the amount of surface Fe–O species and depletes surface Fe–S species (Fig. 3b), calculated from the atom concentrations listed in Table S1.† The S 2p spectrum (Fig. 3c and d) is fitted with a doublet representing the spin-orbit splitting of S 2p3/2 and S 2p1/2 lines. They show a dominance of monosulfide (S2−) with peaks at 161.2 eV (2 p3/2), but also disulfides (S22−) with peaks at 162.2 eV (2 p3/2), indicating the presence of S–Fe bonds. Also shown are polysulfides (Sn2−) at 163.2 eV and elemental sulfur (164.1 eV). Finally, S 2p3/2 peaks are detected at binding energies of 166.6 and 168.2 eV, corresponding to SO32− and SO42− species, respectively. All mentioned binding energy values are similar to those reported by Pratt et al.28 and Buckley et al.29 Calcination at 200 °C, Fig. 3d, reveals an increase in SOx species, whilst the monosulfides decrease in concentration with an increase in disulfides. The migration of Fe towards the surface to combine with oxygen, is evidenced by Fe–S (monosulfide) bond cleavage, leaving Fe vacancies within the structure and forcing the remaining Fe(II)–S to form disulfide bonds,17,28 as evident in Table S2.† The formation of S–S bonds requires the oxidation of some sulfide (S2−) to S0, hence the increase in elemental sulfur.28 These results suggest a surface of an oxide/hydroxide-rich layer with a small concentration of surface iron sulfide, and a sulfide-rich layer buried beneath the surface. As shown, calcining the catalyst from 200 °C to 300 °C causes a large drop in its activity. XPS reveals pyrrhotite calcined at 300 °C (Fig. S6†) has an atomic surface ratio of Fe
80. As pyrrhotite is highly air sensitive, exposure to oxygen forces Fe atoms to diffuse from the interior to the surface to combine with oxygen,28 altering the surface Fe/S ratio. Calcination increased the rate of oxidation to form an oxygen-rich surface with an atomic percentage of 80%. TGA (Fig. S4†) revealed no significant mass loss at 200 °C, and therefore no sulfur had been removed from the surface as SO2. Fe 2p analysis of fresh pyrrhotite surfaces, shown in Fig. 3a, reveals three distinct peaks at 710.1–713.3 eV, indicating the presence of oxidised iron. Another, smaller peak at 707.3 eV, indicates the presence of Fe(II)–S species.28,29 Calcination of pyrrhotite increases the amount of surface Fe–O species and depletes surface Fe–S species (Fig. 3b), calculated from the atom concentrations listed in Table S1.† The S 2p spectrum (Fig. 3c and d) is fitted with a doublet representing the spin-orbit splitting of S 2p3/2 and S 2p1/2 lines. They show a dominance of monosulfide (S2−) with peaks at 161.2 eV (2 p3/2), but also disulfides (S22−) with peaks at 162.2 eV (2 p3/2), indicating the presence of S–Fe bonds. Also shown are polysulfides (Sn2−) at 163.2 eV and elemental sulfur (164.1 eV). Finally, S 2p3/2 peaks are detected at binding energies of 166.6 and 168.2 eV, corresponding to SO32− and SO42− species, respectively. All mentioned binding energy values are similar to those reported by Pratt et al.28 and Buckley et al.29 Calcination at 200 °C, Fig. 3d, reveals an increase in SOx species, whilst the monosulfides decrease in concentration with an increase in disulfides. The migration of Fe towards the surface to combine with oxygen, is evidenced by Fe–S (monosulfide) bond cleavage, leaving Fe vacancies within the structure and forcing the remaining Fe(II)–S to form disulfide bonds,17,28 as evident in Table S2.† The formation of S–S bonds requires the oxidation of some sulfide (S2−) to S0, hence the increase in elemental sulfur.28 These results suggest a surface of an oxide/hydroxide-rich layer with a small concentration of surface iron sulfide, and a sulfide-rich layer buried beneath the surface. As shown, calcining the catalyst from 200 °C to 300 °C causes a large drop in its activity. XPS reveals pyrrhotite calcined at 300 °C (Fig. S6†) has an atomic surface ratio of Fe![[thin space (1/6-em)]](https://www.rsc.org/images/entities/char_2009.gif) :
:![[thin space (1/6-em)]](https://www.rsc.org/images/entities/char_2009.gif) S
S![[thin space (1/6-em)]](https://www.rsc.org/images/entities/char_2009.gif) :
:![[thin space (1/6-em)]](https://www.rsc.org/images/entities/char_2009.gif) O at approximately 19
O at approximately 19![[thin space (1/6-em)]](https://www.rsc.org/images/entities/char_2009.gif) :
:![[thin space (1/6-em)]](https://www.rsc.org/images/entities/char_2009.gif) 4
4![[thin space (1/6-em)]](https://www.rsc.org/images/entities/char_2009.gif) :177, a dominantly iron oxide surface with a diminished sulfur content from 7% at 200 °C calcination to 4%. These results demonstrate that a significant amount of sulfur within an oxygen dominant surface is crucial for facilitating optimum catalytic activity. Hence, following our previous work with pyrrhotites,30,31 density functional theory calculations have been employed to explore the role of sulfur atoms in the reduction of HCO3−, which is the dominant reactant species under the reaction conditions.
:177, a dominantly iron oxide surface with a diminished sulfur content from 7% at 200 °C calcination to 4%. These results demonstrate that a significant amount of sulfur within an oxygen dominant surface is crucial for facilitating optimum catalytic activity. Hence, following our previous work with pyrrhotites,30,31 density functional theory calculations have been employed to explore the role of sulfur atoms in the reduction of HCO3−, which is the dominant reactant species under the reaction conditions.
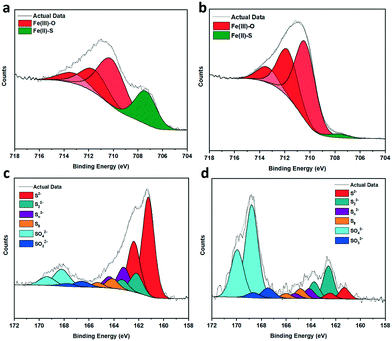 | ||
| Fig. 3 (a–d) XPS spectra of fresh and calcined samples (a) Fe 2p, fresh (b) Fe 2p, calcined 200 °C (c) S 2p, fresh (d) S 2p, calcined 200 °C. Plot details in (Table S2†). | ||
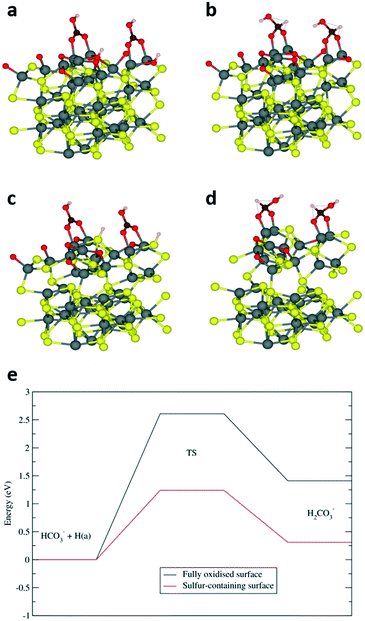
Previous computational investigation on a different iron sulfide – mixed-valence Fe3S4 greigite material – has reported that the aqueous phase reduction of HCO3− to HCOO− proceeds via the transfer of the OH− species from a bridging adsorbate to the surface.1 The remaining CO2 molecule is activated to a bent geometry, which undergoes subsequent hydrogenation on the carbon atom. Similar to greigite, our findings have determined that the most stable adsorption of HCO3− on a fully oxidised pyrrhotite surface (termination A, Fig. S7a†) corresponds to a bridging vertical geometry, with an adsorption energy of −2.34 eV and Fe–O distances of 2.01 Å (Fig. 4a). However, we calculated that a considerable energy penalty of 2.08 eV was associated with the transfer of the OH group to the surface (Fig. S8†), which makes the greigite pathway thermodynamically unlikely, at least on the fully oxidised FeS (01−10) surface. Alternatively, the carbon atom can be attacked by a surface hydrogen, which reacts with the HCO3− hydroxyl group to eliminate a water molecule and the resulting CO2 molecule can then be hydrogenated to HCOO−. A similar pathway has been reported for the hydrogenation of HCO3− on nickel catalysts.32 To investigate this pathway, we optimised the first H2CO3− intermediate, i.e. a structure where the carbon is hydrogenated and in a tetrahedral arrangement (Fig. 4b). The corresponding energy was 1.41 eV higher than the reactant configuration, while the high activation energy of 2.61 eV was again in line with the low efficiency of the fully oxidised surface. Interestingly, we found that the subsequent elimination of H2O (Fig. S9†) is endothermic by only 0.39 eV, with a relatively low activation barrier of 1.25 eV which we would not expect to hinder the reaction, suggesting that the preceding carbon hydrogenation is the rate-limiting step.
A sulfur-containing surface (termination B, Fig. S7b†) leads to a very different scenario. The adsorption of HCO3−, with an energy of −1.75 eV, is still favoured, but the presence of the bulkier sulfur atom bends the adsorbate (Fig. 4c). In addition, the sulfur-bound hydrogen is closer to the carbon than the oxygen-bound hydrogen in termination A, which opens up the possibility of an alternative path for the hydrogen transfer leading to a tetrahedral carbon intermediate (Fig. 4d), which is only 0.31 eV higher in energy than the HCO3− reactant. Furthermore, its activation energy barrier of 1.24 eV is significantly reduced compared to the 2.61 eV reported above for termination A, which clearly highlights the importance of surface sulfur atoms in the HCO3− reduction process, as illustrated in the diagram of Fig. 4e.
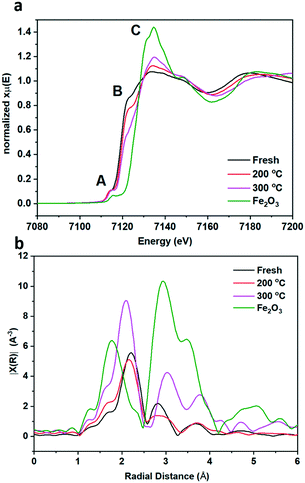
To gain more understanding of the bulk structure, XAFS was employed. Data of fresh pyrrhotite, calcined at 200 °C and calcined at 300 °C, as well as a Fe2O3 reference are presented in Fig. 5a and b. XANES analysis provided the opportunity to study the oxidation state of the Fe K-edge (Fig. 5a). First to note is a very characteristic pre-edge (feature A) from the contribution of the Fe 1s → 3d transition.33 There is a shoulder to the edge (B), indicating the coordination between Fe and S and representing the normally forbidden Fe 1s → 4s transition, which becomes more accessible, because the S 3p orbital overlap contributes p character to the Fe 4s orbital.34 There is also white line intensity (C), corresponding to the first dipole-allowed Fe 1s → 4p transition.35,36 Upon calcination at 200 °C, there is a shift towards lower energy of feature B, indicating that iron is oxidising upon calcination from Fe(II) to Fe(III), in particular losing Fe–S character and acquiring more O ligands. This finding is re-enforced by the Fourier transform EXAFS from a shift in radial distance at 2.2 Å, indicated in Fig. 5b. Calcination causes a small decrease in radial distance and a broader peak, indicating a mixture of Fe–S and Fe–O bonds. This effect is created owing to the fact that Fe(II) and S2− are larger ions than Fe(III) and O2−, therefore exhibiting a larger radial distance than Fe–O. Fe–S retains a bond distance in the range of 2.37–2.72 Å, whereas the Fe–O bond distance ranges from 1.81–1.93 Å. Our results show fresh pyrrhotite and Fe2O3 exhibit radial distances of 2.21 Å and 1.78 Å respectively, which are phase uncorrected results, hence the slight difference with actual Fe–O and Fe–S radial distances. The Fourier transform EXAFS reveals a particularly interesting feature: When the sample is calcined at 300 °C, a peak at ∼2.8 Å starts to form. As this peak is also present in Fe2O3, it can be assigned as the Fe–Fe scattering component, consistent with the formation of bulk Fe2O3 from XRD. This peak is not present in the fresh and 200 °C calcined samples, showing that they do not contain iron oxide/iron hydroxide species. We have already confirmed that the 200 °C calcined sample shows that iron oxidation has occurred, whereas the shoulder edge B indicates Fe–S character, which together we suggest to be evidence for the formation of S–Fe–O species. Increasing the calcination temperature to 300 °C separates these species into separate Fe–O and Fe–S domains (as seen from the peak at ∼2.8 Å). Since the formation of these Fe–O and Fe–S domains corresponds to a drop in the catalytic activity, S–Fe–O is a likely active species in this catalyst, corresponding well with the DFT calculations.
Conclusions
We have reported the synthesis of pyrrhotite (Fe1−xS) and its catalytic activity towards the hydrogenation of CO2 to formate under mild hydrothermal conditions, which is optimised by calcination. XPS and XAFS analysis has determined that oxidation of surface Fe–S species to form S–Fe–O species has a positive effect on the catalytic efficacy. Density functional theory calculations confirmed that the unique S–Fe–O interaction is critical in the carbon hydrogenation reaction, lowering the activation energy compared to the fully oxidised surface. The results from our preliminary investigation on the catalytic application of the Fe–S material, reported in this communication, is both exciting and promising. Further fine-tuning of this Fe–S material, inspired by the results presented here, has the potential to produce a more efficient, cheap and sustainable catalyst for CO2 utilisation.Conflicts of interest
There are no conflicts to declare.Acknowledgements
The authors thank the Cardiff University scanning electron microscopy (SEM) and X-ray absorption spectroscopy (XPS) facilities, funded by EPRSC. We also thank the UK Catalysis Hub for allocating beamtime slots through the UK Catalysis Hub BAG allocation for X-ray acquisition of the transmission spectroscopic data at the Diamond synchrotron facility. This work was supported by the Engineering and Physical Sciences Research Council (grant EP/K009567/2) and used the ARCHER UK National Supercomputing Service (http://www.archer.ac.uk) via our membership of the UK's HEC Materials Chemistry Consortium, which is funded by EPSRC (EP/L000202). We acknowledge the support of the Supercomputing Wales project, which is part-funded by the European Regional Development Fund (ERDF) via Welsh Government. All data generated during this research are openly available from the Cardiff University Research Portal at http://doi.org/10.17035/d.2020.0098194792.References
- A. Roldan, N. Hollingsworth, A. Roffey, H.-U. Islam, J. B. M. Goodall, C. R. A. Catlow, J. A. Darr, W. Bras, G. Sankar, K. B. Holt, G. Hogarth and N. H. de Leeuw, Chem. Commun., 2015, 51, 7501–7504 RSC.
- C. Di Giovanni, A. Reyes-Carmona, A. Coursier, S. Nowak, J. M. Greneche, H. Lecoq, L. Mouton, J. Roziere, D. Jones, J. Peron, M. Giraud and C. Tard, ACS Catal., 2016, 6, 2626–2631 CrossRef.
- R. Miao, B. Dutta, S. Sahoo, J. He, W. Zhong, S. A. Cetegen, T. Jiang, S. P. Alpay and S. L. Suib, J. Am. Chem. Soc., 2017, 139, 13604–13607 CrossRef CAS.
- M. S. Faber, M. A. Lukowski, Q. Ding, N. S. Kaiser and S. Jin, J. Phys. Chem. C, 2014, 118, 21347–21356 CrossRef CAS.
- D. Susac, L. Zhu, M. Teo, A. Sode, K. C. Wong, P. C. Wong, R. R. Parsons, D. Bizzotto, K. A. R. Mitchell and S. A. Campbell, J. Phys. Chem. C, 2007, 111, 18715–18723 CrossRef CAS.
- H. Li, J. Liu, J. Li, Y. Hu, W. Wang, D. Yuan, Y. Wang, T. Yang, L. Li, H. Sun, S. Ren, X. Zhu, Q. Guo, X. Wen, Y. Li and B. Shen, ACS Catal., 2017, 7, 4805–4816 CrossRef CAS.
- T. A. Pecoraro and R. R. Chianelli, J. Catal., 1981, 67, 430–445 CrossRef CAS.
- G. Wächtershäuser, Syst. Appl. Microbiol., 1988, 10, 207–210 CrossRef.
- M. J. Russell, R. M. Daniel, A. J. Hall and J. A. Sherringham, J. Mol. Evol., 1994, 39, 231–243 CrossRef CAS.
- V. Sojo, B. Herschy, A. Whicher, E. Camprubí and N. Lane, Astrobiology, 2016, 16, 181–197 CrossRef CAS.
- M. G. Vladimirov, Y. F. Ryzhkov, V. A. Alekseev, V. A. Bogdanovskaya, V. A. Otroshchenko and M. S. Kritsky, Origins Life Evol. Biospheres, 2004, 34, 347–360 CrossRef CAS.
- K. Pellumbi, M. Smialkowski, D. Siegmund and U. Apfel, Chem. – Eur. J., 2020, chem.202001289 Search PubMed.
- S. Piontek, K. J. Puring, D. Siegmund, M. Smialkowski, I. Sinev, D. Tetzlaff, B. Roldan Cuenya and U.-P. Apfel, Chem. Sci., 2019, 10, 1075–1081 RSC.
- N. Lane, Cold Spring Harbor Perspect. Biol., 2014, 6, a015982 CrossRef.
- P. Toulmin III and P. B. Barton Jr, Geochim. Cosmochim. Acta, 1964, 28, 641–671 CrossRef.
- N. Belzile, Y.-W. Chen, M.-F. Cai and Y. Li, J. Geochem. Explor., 2004, 84, 65–76 CrossRef CAS.
- A. N. Buckley and R. Woods, Appl. Surf. Sci., 1985, 22–23, 280–287 CAS.
- H. F. Steger and L. E. Desjardins, Chem. Geol., 1978, 23, 225–237 CrossRef CAS.
- M. P. Janzen, R. V. Nicholson and J. M. Scharer, Geochim. Cosmochim. Acta, 2000, 64, 1511–1522 CrossRef CAS.
- J. H. L. Beal, P. G. Etchegoin and R. D. Tilley, J. Solid State Chem., 2012, 189, 57–62 CrossRef CAS.
- J. H. L. Beal, S. Prabakar, N. Gaston, G. B. Teh, P. G. Etchegoin, G. Williams and R. D. Tilley, Chem. Mater., 2011, 23, 2514–2517 CrossRef CAS.
- T. Li, H. Li, Z. Wu, H. Hao, J. Liu, T. Huang, H. Sun, J. Zhang, H. Zhang and Z. Guo, Nanoscale, 2015, 7, 4171–4178 RSC.
- A. Kirkeminde and S. Ren, J. Mater. Chem. A, 2013, 1, 49–54 RSC.
- Y. El Mendili, A. Abdelouas, H. El Hajj and J.-F. Bardeau, RSC Adv., 2013, 3, 26343 RSC.
- F. Gronvold and H. Haraldsen, Acta Chem. Scand., 1952, 6, 1452–1469 CrossRef CAS.
- C. Mitchell, U. Terranova, I. AlShibane, D. J. Morgan, T. Davies, Q. He, J. Hargreaves, M. Sankar and N. H. De Leeuw, New J. Chem., 2019, 43, 13985–13997 RSC.
- O. Pedersen, T. D. Colmer and K. Sand-Jensen, Front. Plant Sci., 2013, 4, 140 Search PubMed.
- A. R. Pratt, I. J. Muir and H. W. Nesbitt, Geochim. Cosmochim. Acta, 1994, 58, 827–841 CrossRef CAS.
- A. N. Buckley and R. Woods, Appl. Surf. Sci., 1985, 20, 472–480 CrossRef CAS.
- U. Terranova and N. H. de Leeuw, J. Phys. Chem. Solids, 2017, 111, 317–323 CrossRef CAS.
- U. Terranova, C. Mitchell, M. Sankar, D. Morgan and N. H. De Leeuw, J. Phys. Chem. C, 2018, 122, 12810–12818 CrossRef CAS.
- C. S. He, L. Gong, J. Zhang, P. P. He and Y. Mu, J. CO2 Util., 2017, 19, 157–164 CrossRef CAS.
- M. Wilke, F. Farges, P. E. Petit, G. E. Brown and F. Martin, Am. Mineral., 2001, 86, 714–730 CrossRef CAS.
- M. Womes, R. C. Karnatak, J. M. Esteva, I. Lefebvre, G. Allan, J. Olivier-Fourcade and J. C. Jumas, J. Phys. Chem. Solids, 1997, 58, 345–352 CrossRef CAS.
- S. N. A. Zakaria, N. Hollingsworth, H. U. Islam, A. Roffey, D. Santos-Carballal, A. Roldan, W. Bras, G. Sankar, G. Hogarth, K. B. Holt and N. H. De Leeuw, ACS Appl. Mater. Interfaces, 2018, 10, 32078–32085 CrossRef CAS.
- Y. Mikhlin, Y. Tomashevich, S. Vorobyev, S. Saikova, A. Romanchenko and R. Félix, Appl. Surf. Sci., 2016, 387, 796–804 CrossRef CAS.
Footnote |
| † Electronic supplementary information (ESI) available. See DOI: 10.1039/d0cy01779e |
| This journal is © The Royal Society of Chemistry 2021 |

