
 Open Access Article
 This Open Access Article is licensed under a
 Creative Commons Attribution 3.0 Unported Licence
Sum frequency generation spectroscopy in heterogeneous model catalysis: a minireview of CO-related processes
Xia
Li
 and
Günther
Rupprechter
*
and
Günther
Rupprechter
*
Institute of Materials Chemistry, Technische Universität Wien, 1060 Vienna, Austria. E-mail: guenther.rupprechter@tuwien.ac.at; Tel: +43 (1) 58801 165100
First published on 8th December 2020
Abstract
Sum frequency generation (SFG) vibrational spectroscopy is a unique surface/interface-sensitive method, enabling the identification of chemical species and molecular structures, densities and orientations. SFG has been proven to be a powerful probe to examine adsorbates and reactions at solid–gas interfaces related to heterogeneous catalysis, employing well-defined ultra-high vacuum (UHV) grown model catalysts and UHV-compatible high-pressure reaction cells, enabling bridging both the materials and pressure gaps. SFG was thus among the first methods for ambient pressure surface science, enabling the characterization of “high pressure adsorbates”. In this mini-review, we provide an overview of SFG studies of CO-related processes in heterogeneous model catalysis. This includes pressure- and/or temperature-dependent CO adsorption on single crystals (platinum, palladium, rhodium, iridium, copper, nickel) and oxide/graphene-supported (palladium, platinum) nanoparticles, as well as CO reactions (oxidation/hydrogenation) simultaneously monitored by SFG and mass spectrometry. The adsorption of isotopic CO mixtures on single crystals and nanoparticles provides information on the individual contributions of vibrational coupling and chemical interactions to the adsorbate–adsorbate interactions. Altogether, SFG helps to identify various adsorption sites, adsorbate structures, molecular orientations and CO reactions on prototypical catalyst surfaces of increasing complexity. Specifically, the analysis of molecular orientation (tilt angles) can be carried out by polarization-dependent SFG.
 Xia Li | Xia Li received her Master's degree in Polymer Chemistry and Physics at Qingdao University of Science and Technology (Shandong, China) and obtained her Ph.D. in Physical Chemistry from the Institute of Chemistry, Chinese Academy of Sciences (Beijing, China). In 2016, she started a postdoctoral position at the Technische Universität Wien (Vienna, Austria) in the group of Günther Rupprechter. In her current research she uses polarization-dependent sum frequency generation (SFG) vibrational spectroscopy, low energy electron diffraction (LEED) and Auger electron spectroscopy (AES) to reveal adsorbate/reactant structures and orientations on model catalyst surfaces (e.g. Pt, Pd, and Ir single crystals and graphene-supported nanoparticles). Since 2019, she holds a Lise Meitner Fellowship of the Austrian Science Fund (FWF). |
 Günther Rupprechter | Günther Rupprechter received his Ph.D. in Physical Chemistry from the University of Innsbruck (Austria). After being a postdoctoral fellow at the University of California at Berkeley and the Lawrence Berkeley National Laboratory (with Gabor A. Somorjai), he became group leader for Laser Spectroscopy and Catalysis at the Fritz Haber Institute of the Max Planck Society in Berlin (Germany) from 1999 to 2005 (with Hajo Freund). In 2005, he accepted a full professorship in Surface and Interface Chemistry at Technische Universität Wien (Austria). His research emphasis is on heterogeneous catalysis, particularly in situ (operando) spectroscopy/microscopy on model and technological catalysts, applied to studies of the mechanisms and kinetics of processes relevant for energy and the environment: hydrogen as clean fuel, methane reforming, CO2 hydrogenation and more efficient automotive pollution abatement. In 2005, he received the Jochen Block Award of the German Catalysis Society for “the application of surface science methods to heterogeneous catalysis” and became a corresponding member of the Austrian Academy of Sciences in 2012. He is an editorial board member of “Catalysis Letters” and “Topics in Catalysis”, and Vice-Chair of the Austrian Catalysis Society. Since 2018 he is a “Renowned Overseas Professor” of Shanghai University of Engineering Science. |
1. Introduction: SFG in heterogeneous catalysis
Surface science has to a large extent been driven by heterogeneous catalysis,1–8 which mostly occurs at solid–gas interfaces (for solid–liquid interfaces we refer to ref. 9–12 and references therein). Much of the fundamental understanding of elementary steps originates from studies of well-defined model catalysts in ultrahigh vacuum (UHV),1,2 especially when combined with DFT calculations.13–20 Investigations of metal single crystal surfaces of different crystallographic orientations directly revealed the structure-sensitivity of gas adsorption, co-adsorption and reactivity, focusing on molecular/dissociative adsorption and oxidation/hydrogenation reactions.This was based on an arsenal of tools, but most of the typical surface-sensitive methods require UHV, such as low energy electron diffraction (LEED), Auger electron spectroscopy (AES), temperature programmed desorption/reaction (TPD/R), X-ray/UV photoelectron spectroscopy (XPS/UPS), electron energy loss spectroscopy (EELS), infrared reflection absorption spectroscopy (IRAS), and others.
UHV conditions guarantee the cleanliness of the surfaces and well-controlled conditions, but due to the low-pressure cryogenic temperature (liquid N2) needed to produce substantial surface coverages of adsorbates, at such low temperatures, adsorbate structures may be different21 and reactions typically do not occur. Vice versa, at high temperatures of catalytic reactions, coverages under UHV are typically very low, whereas technological catalytic reactions are carried out at ∼10 orders of magnitude higher pressure. Accordingly, it was debated whether the adsorbed species observed under UHV conditions are really comparable to the “high pressure species” present under reaction conditions. The pressure differences may also affect the chemical state of a catalyst surface under reaction conditions (e.g. by oxidation, hydride formation, coking, restructuring, etc.). Both effects lead to the so-called pressure gap.
Over the years, several surface-sensitive and UHV-compatible methods have been developed that are able to operate under (near) atmospheric pressure, e.g. sum frequency generation (SFG) laser spectroscopy, polarization-modulation infrared reflection absorption spectroscopy (PM-IRAS), near ambient pressure X-ray photoelectron spectroscopy (NAP-XPS), high-pressure scanning tunnelling microscopy (HP-STM) or surface X-ray diffraction (SXRD). To examine UHV-grown model catalysts at realistic pressure and temperature via ambient pressure surface science, dedicated UHV-compatible high-pressure cells have thus been constructed.22–30
Together with advances in model catalyst preparation, the pressure (UHV vs. atmospheric pressure), material (single crystals vs. supported nanoparticles), and complexity (alloys, promoters, multicomponent oxides) gaps between surface science and applied catalysis have been substantially narrowed, but understanding catalysis at the atomic level remains a formidable task.
Along these lines, sum frequency generation (SFG) spectroscopy, exhibiting utmost surface sensitivity31 as the SFG process solely occurs at a surface or interface, has been performed using UHV-compatible high-pressure cells. SFG has been successfully employed to understand molecular level gas adsorption/reaction (e.g. adsorption sites, adsorbate structures, orientations, and changes thereof) on model catalyst surfaces.6,32–34 The initial surface science SFG studies examined the adsorption of small molecules (such as CO, NO or alkenes) on metal single-crystal surfaces (such as Pd(111),35 Pd(100),36 Pt(111),37–39 and Rh(111)40). The SFG vibrational spectra provided insight into adsorption sites and adsorption configurations up to atmospheric pressure, for example the relative population of hollow/bride/on-top bonded CO or di-σ/π bonded ethylene/propylene.41–44 Subsequently, SFG has also been employed to study the structure of adsorbates on polycrystalline foils,45,46 thin films,47 and supported nanoparticles (NPs of Pd, Pt, etc.),6,35 extending typical UHV surface science experiments to more realistic pressures and temperatures.
The “drosophila” molecule CO has been frequently used as a probe to “titrate” the number and nature of exposed metal atom/sites of a catalyst, but CO is also involved in many processes of environmental and energy catalysis (exhaust cleaning, reforming, water gas shift, Boudouard, methanation, methanol synthesis, Fischer–Tropsch, etc.). In the following, we will thus focus on rather recent SFG studies of CO adsorption and reaction on metal single crystals and supported nanoparticles. Note that there are also reports of applying SFG to technological catalysts (powders) and shape-controlled colloidal nanoparticles linked to quartz prisms,48–53 with total internal reflection geometry yielding a higher signal.
Before turning to the details of SFG, we would like to stress that there are a number of other, often complementary, methods that can operate under near ambient pressures (NAP). They include e.g. vibrational spectroscopy (polarization modulation (PM) IRAS), composition (X-ray photoelectron spectroscopy; NAP-XPS54,55) and structure characterization (surface X-ray diffraction (SXRD),56,57 electron microscopy58 and scanning tunnelling microscopy55,59). These methods, which can be applied to both solid/gas and solid/liquid interfaces, were previously contrasted to SFG.6 For more detailed accounts we refer to a number of recent reviews.60–63
2. SFG theory
SFG is a second order nonlinear optical process and in a “conventional scanning” setup, a tunable infrared beam is mixed with a (fixed-frequency) visible beam to generate a sum frequency output (Fig. 1). The SFG output is thus in the near-infrared or visible region and can be detected by a photomultiplier.31 In the electric dipole approximation, the mixing process is allowed only in a medium without centrosymmetry, thus it is restricted to the surface (or interface), where the symmetry is broken (surface-specificity). When the IR beam (ωIR) is tuned through a vibrational resonance of the adsorbate, it induces a vibrational transition from the ground state (v = 0) to an excited state (e.g. v = 1), and simultaneously the visible beam (e.g. ωVis = 532 nm) induces a transition to a higher-energy virtual state through an anti-Stokes Raman process (Fig. 1 inset). When the virtual state relaxes, light is generated at the sum of the two incident frequencies (ωSFG = ωVis + ωIR) (Fig. 1). To acquire an SFG vibrational spectrum of adsorbate molecules (e.g. CO) on a metal catalyst (e.g. Ir(111) single crystal), the IR and visible beams are spatially and temporally overlapped on the sample. The beam mixing process induces a nonlinear polarization (P(2)):64| P(2)(ωSFG) = χ(2)SE(ωVis)E(ωIR), | (1) |
| ISFG = |χ(2)S|2IVisIIR. | (2) |
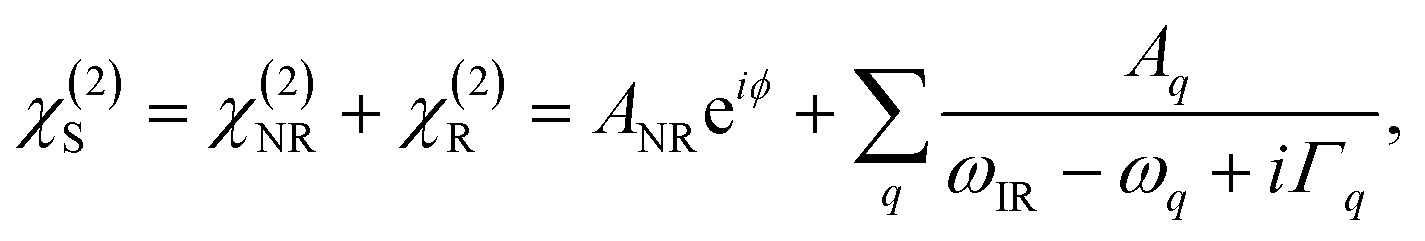 | (3) |
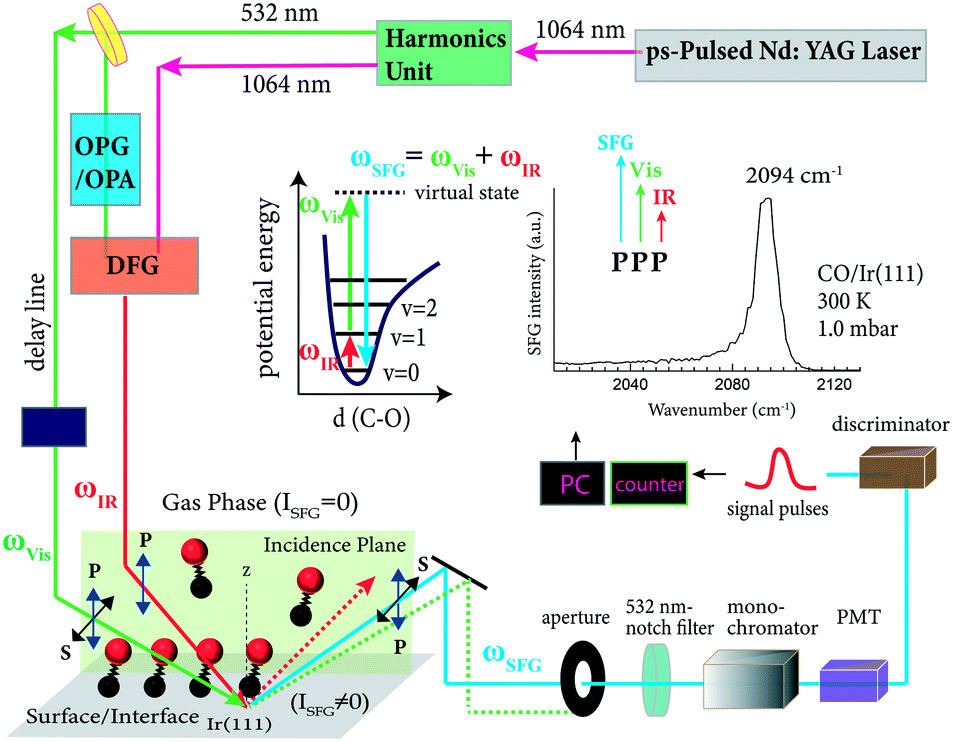 | ||
| Fig. 1 Schematic illustration of the IR-vis SFG measurement, using CO adsorption on Ir(111) as an example. The energy level diagram of an IR single-resonance SFG process and an exemplary SFG spectrum of CO/Ir(111) are shown as insets (right inset adapted from Li et al.32 with permission. Copyright (2020) American Chemical Society). | ||
The polarizations of both incidence and output beams can be switched between P- and S-polarization. P denotes the polarization of the optical field in the incidence plane, and S denotes the polarization of the optical field perpendicular to the incidence plane (Fig. 1). Because χ(2)S is polarization-dependent, SFG measured in different polarization combinations (e.g. SSP, PPP, SPS, PSS) yields different information (see below). PPP denotes the polarization combinations in the order of relative laser energies: that is, SFG, visible and IR beams (Fig. 1 inset). For metal surfaces, the IR laser beam must always be P-polarized, because the surface electric-field of an S-polarized IR laser beam is screened by the conduction electrons of the metal. In contrast, the polarization of the visible and SFG beams can be switched between S and P due to the lower dielectric constants of metals in the visible region, which is why the surface electric field is less effectively screened by the conduction electrons.65
Because χ(2)NR contributes to χ(2)S, an observed spectrum may appear somewhat “distorted” (asymmetric, negative/derivative) peaks, resembling coherent anti-Stokes Raman spectra, but being quite different from IR spectroscopy. Depending on the (relative) amplitudes (ANR and Aq), and the phase shift, the SFG lineshape may be strongly asymmetric.66 In particular for metal or semiconductor interfaces, incorporation of inhomogeneous effects on the lineshape must be considered. However, the simple assumption of a Lorentzian line profile in eqn (3) can be successfully applied in spectral fitting.
The amplitude of the vibrationally resonant susceptibility Aq is related to the adsorbate concentration (surface density of molecules, Ns) and the microscopic hyperpolarizability tensor elements β(2)q in the molecular coordinates system:
Aq = Ns〈θ,![[thin space (1/6-em)]](https://www.rsc.org/images/entities/char_2009.gif) ψ,ϕ〉β(2)q ψ,ϕ〉β(2)q | (4) |
In general, for C∞v (e.g. single OH, CH bond, CO molecules) and C3v (e.g. CH3, NH3, SiH3 groups) groups, the twist angle (Ψ) and azimuthal angle (ϕ) can be integrated, and only the tilt angle needs to be determined. However, if a symmetric stretch vibrational mode of a CH2 group is observed in the SPS and PSS polarizations, the twist angle Ψ cannot be rotationally averaged anymore.68
Concerning polarization-dependent measurements, an SFG signal is generated only when the electric fields of the visible and IR lights have a component parallel to the bond axis of the adsorbed molecule.69 Consequently, PPP spectra detect molecules with molecular axes parallel or inclined to the surface normal, whereas SSP spectra are mainly sensitive to molecules tilted relative to the macroscopic surface normal (e.g. for CO/Ir(111),32 the SSP intensity is maximum for a tilt angle of 51° with R = 0.08). Utilizing the intensity ratio in different polarization combination spectra (e.g. PPP/SSP), or the ratio of CH3-sym/CH3-asym of the PPP spectrum, the orientation angle of adsorbates can be quantitatively determined.32,33,46
In addition, SFG spectroscopy has also been widely applied for solid–liquid interfaces9–12,70,71 and liquid–liquid interfaces,72–78 related to electrochemistry, polymers, surfactants, biomolecules and others, and has been extended to SFG microscopy.46,79,80
3. UHV-compatible high-pressure reaction cell for SFG spectroscopy
Surface-specific SFG provides vibrational spectra of surface adsorbed molecules only, while molecules in the gas phase do not produce signals. Consequently, SFG is perfectly suited for spectroscopy from UHV to atmospheric pressure (IR gas phase absorption must still be accounted for; for details see ref. 6). Fig. 2a shows an UHV-compatible high-pressure reaction cell, optimized for SFG spectroscopy, and attached to a UHV preparation/analysis chamber for heterogeneous model catalysts (a thorough description can be found in ref. 28). Briefly, this setup has three main sections: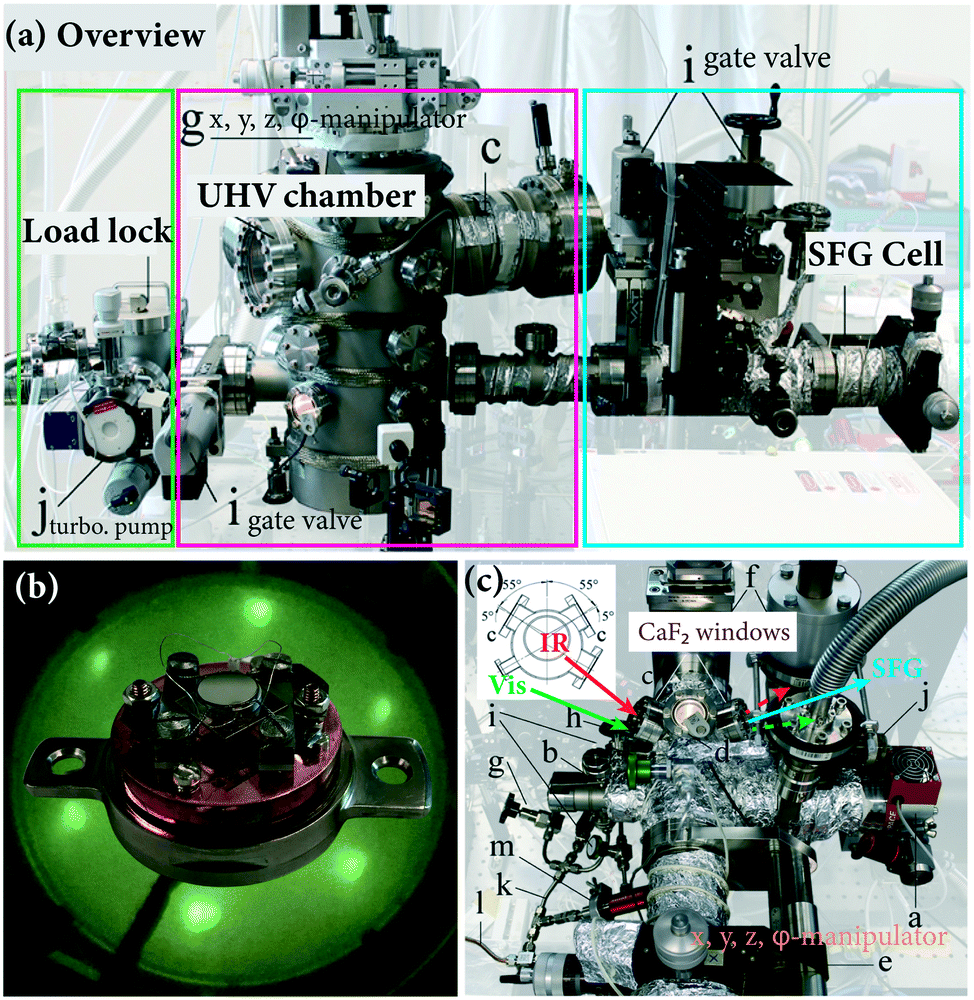 | ||
| Fig. 2 SFG spectroscopy on model catalysts from UHV to 1 bar: (a) overview of the three main sections, connected via magnetic transfer rods: load-lock, UHV preparation/characterization chamber and UHV-high-pressure spectroscopic SFG cell. (b) Photograph of the sample holder with an Ir(111) single crystal mounted, with the corresponding LEED pattern as background. (c) Photograph of the SFG spectroscopic cell, displaying the beam input/exit CaF2 windows. (a) and (c) are adapted from Roiaz et al.28 with permission. Copyright (2018) American Institute of Physics. | ||
i) A load-lock to quickly insert samples into the system, without the need to vent the main UHV chamber.
ii) A main UHV chamber to prepare and characterize model catalyst surfaces.
iii) An SFG high-pressure cell (that can be operated from UHV to 1 bar) to measure the vibrational spectra of molecular adsorbates.
The UHV chamber (base pressure <5 × 10⁻¹⁰ mbar) is a stainless-steel vessel of about 40 L volume equipped with various flanges to accommodate analysis and preparation tools (e.g. LEED/AES (c), mass spectroscopy (MS), evaporator, microbalance, etc.) and gauges, with connections and gate valves to/between the load-lock and SFG cell. The sample, such as an Ir(111) single crystal (disk-shaped, 6 mm outer diameter), is mounted onto the sample holder (Fig. 2b), which allows heating by Joule resistive heating to 1273 K and cooling to 95 K (LN2). After installation in the load-lock and transfer to the UHV manipulator using a magnetic transfer rod, the single crystal is pretreated in the UHV chamber by cycles of Ar ion-sputtering, O2 oxidation and annealing.28,33 The long-range surface ordering and cleanliness of the pretreated Ir surface are confirmed by LEED and AES, respectively. After the cleaning procedure, the sample is further transferred to the SFG spectroscopic cell for measurements, as shown in Fig. 2c.
The SFG cell, shown in Fig. 2c has a volume of approximately 1.5 L. It is pumped by a combination of a turbomolecular pump (j) and a pre-vacuum diaphragm pump (to prevent oil back-diffusion) to a routine base pressure of 1 × 10⁻⁹ mbar. The x, y, z, φ-manipulator (e) of the SFG cell, receiving the sample holder, allows optimization of the sample position, ensuring a spatial overlap of the visible and IR impinging beams on the surface. Two CaF2 windows (c) allow directing the visible and IR laser radiation into the cell and the SFG signal to exit to the detector. According to the SFG geometry, the windows are oriented at 55° with respect to the surface normal. Furthermore, the window surface normal is tilted 5° off the incidence laser beams to avoid back-reflection into the laser optics. A third window (d) is placed on-top of the sample stage to visually inspect the position during sample transfer and SFG measurements. A gas (mixture) at 1000 mbar is recirculated in the SFG cell by a metal-bellows pump (i).
Although no SFG signal is produced by the gas phase itself, at elevated pressure significant frequency-dependent IR absorption occurs in the gas phase via vibrational and rotational excitations. Consequently, because the number of generated SFG photons depends linearly on the intensity of the IR pulse (and the visible, which, however, is essentially constant), the SFG process is indirectly influenced by the gas pressure.6 However, the distance between the input window and the sample is only 5.4 cm (Fig. 2c), which is why there is hardly any gas-phase IR-absorption at CO pressures below 200 mbar.
For the SFG laser spectrometer, most frequently neodymium–yttrium–aluminum–garnet (Nd:YAG), titanium–sapphire (Ti:Sa) or free-electron lasers are used. For details on the generation of tunable IR and visible radiation and on the detection of the SFG signal, we refer to ref. 6 and references therein. A 20 ps mode-locked Nd:YAG-based “scanning” system (EKSPLA; 1064 nm, 30 mJ per pulse, 50 Hz repetition rate) is briefly described here and depicted schematically in Fig. 1. The output of a 1064 nm picosecond laser is partly converted to 532 nm light by a second-harmonic generator (SHG). One part of 532 nm is used as the visible input for the surface SFG experiment. Another part of the 532 nm beam is used to pump an optical parametric generator/amplifier (OPG/OPA). The generated tunable near-IR idler and another portion of 1064 nm are spatially and temporally overlapped in a difference frequency generation (DFG) crystal (e.g. AgGaS2), generating the tunable mid-IR beam (2.3–10 μm) for the SFG process. The polarization of the visible light and SFG signal is switched between P and S using a Glan–Taylor prism and a half-wave plate, while the infrared polarization is always kept as P (an S-polarized field would be canceled on a metal surface65). The used beam energies for CO/single crystals (Ir, Pt, Pd)32,33 are approximately 40 μJ per pulse for visible and 90–130 μJ per pulse for IR between 1800 and 2160 cm−1. The angle of incidence of a laser beam has a significant effect on the SFG intensity33 and was usually around 55°. However, a difference in the incident angles is necessary to separate the SFG signal from the reflected pump beams by an aperture (Fig. 1). A 5° angular separation between IR and visible beams is sufficient for spatially filtering the reflected input light from the SFG signal.64 To better remove contributions from the reflected pump beams, a combination of spatial, spectral and temporal filtering is required.6,81 Therefore, the SFG signal is filtered by an aperture, notch filter, monochromator, detected by a photomultiplier tube (PMT) and (gated) discriminator, and finally recorded using software (Fig. 1).
4. Case studies
4.1 CO adsorption on single crystals
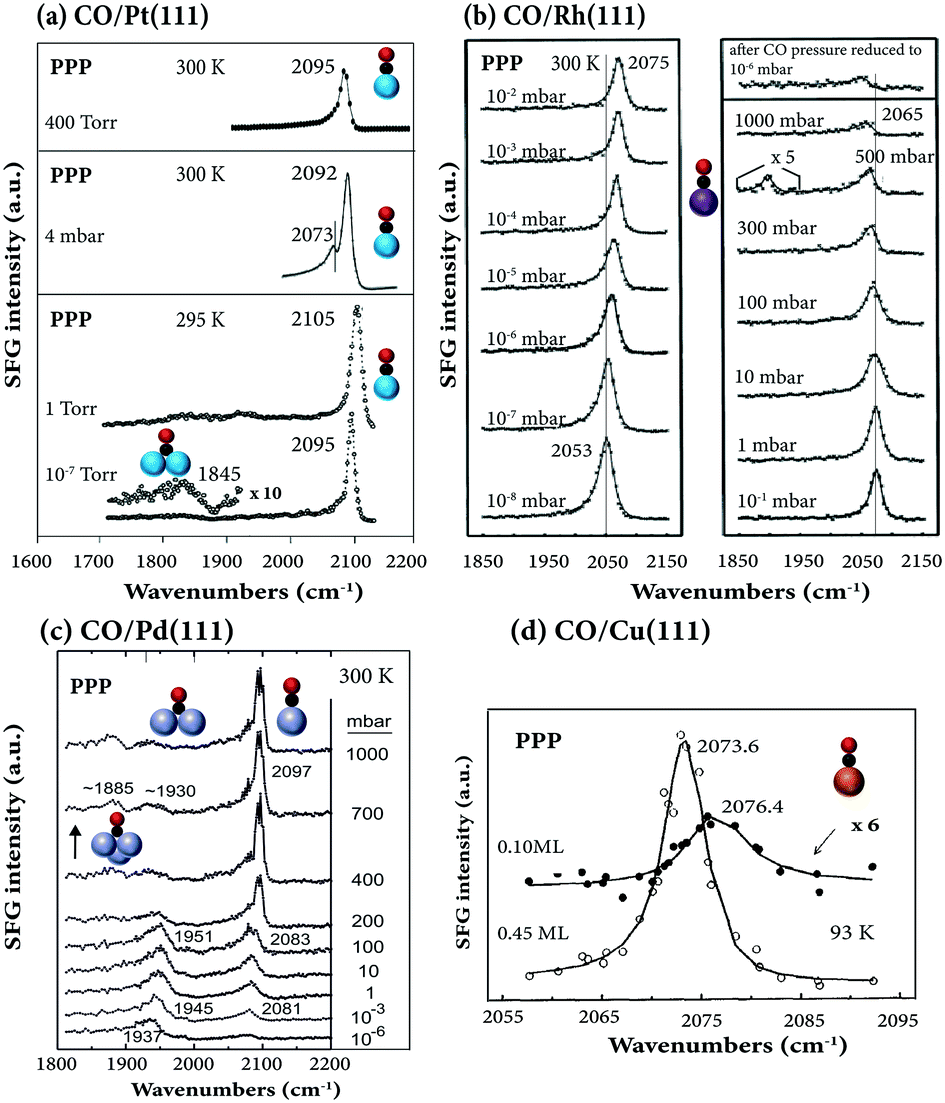 | ||
| Fig. 3 Pressure-dependent SFG spectra in PPP polarization combination: (a) CO/Pt(111). 10−7 and 1 Torr at 295 K, adapted from Su et al.38 with permission. Copyright (1996) American Physical Society; 4 mbar at 300 K, adapted from Li et al.33 with permission from Springer; 400 mbar at 300 K, adapted from Kung et al.88 with permission from Elsevier. (b) CO/Rh(111) at 300 K, adapted from Pery et al.84 with permission from Elsevier. (c) CO/Pd(111) at 300 K, adapted from Unterhalt et al.89 with permission. Copyright (2002) American Chemical Society. (d) CO/Cu(111) at 93 K, adapted from Owrutsky et al.86 with permission. Copyright (1992) American Institute of Physics. | ||
When Rh(111) was exposed to a high CO pressure up to 1000 mbar (Fig. 3b), additional “lower-frequency” on-top CO stretching vibrational features were observed in SFG,84 which were absent under UHV conditions, likely due to hollow site population and surface roughening.37 Spectra acquired after CO pressure evacuation to 10−6 mbar were irreversible, however, likely due to CO dissociation.
For CO on Pd(111) under UHV (1 × 10⁻⁷ mbar), three peaks at 1890, 1925, and 2106 cm−1, characteristic of the stretch vibrations of CO adsorbed at hollow, bridge, and atop sites, were observed at 100 K (∼0.7 ML coverage).28 Different from CO on Pt(111)38 and Rh(111) (Fig. 3b),37,84 on Pd(111) at room temperature and 6 mbar, the SFG signal of bridge-bound CO is much stronger than that of on-top CO.28 However, when the pressure exceeds 200 mbar, on-top CO dominates the spectra (Fig. 3c; for details see ref. 6).
For CO on Ir(111),32,85 Cu(111)86 (Fig. 3d), Ni(111)47 and single Fe atoms in a self-assembled 2D metal–organic crystal (Fe-phthalocyanines supported on graphene/Ir(111)87), only terminally bound (atop/on-top) CO appeared in the spectra, and other species were not observed.
The temperature-dependence of adsorbed CO on different single crystals is shown in Fig. 4. As temperature increased, the SFG intensity of on-top CO on Pt(111) decreased (in the pressure range of 10−8–10−5 Torr). At approximately 460 K, the signal at 10−8 Torr was close to zero (Fig. 4a). Previous temperature-programmed desorption (TPD) studies showed that for low exposure (0.5 Langmuir) the desorption maximum is found at 435 K, but shifts to 410 K at a saturation coverage of 4 Langmuir.90Accordingly, at higher pressure (4 mbar), the signal of on-top CO disappears at 423 K. When Pt(111) was heated in 400 Torr CO, the vibrational frequency of on-top CO moved to lower wavenumbers and the on-top CO signal disappeared at 823 K.88 After cooling to room temperature, a strong decrease in spectral intensity was observed, that is, the spectra were irreversible. This was attributed to carbon formation resulting from high-pressure CO dissociation on the Pt(111) surface at 673 K.88
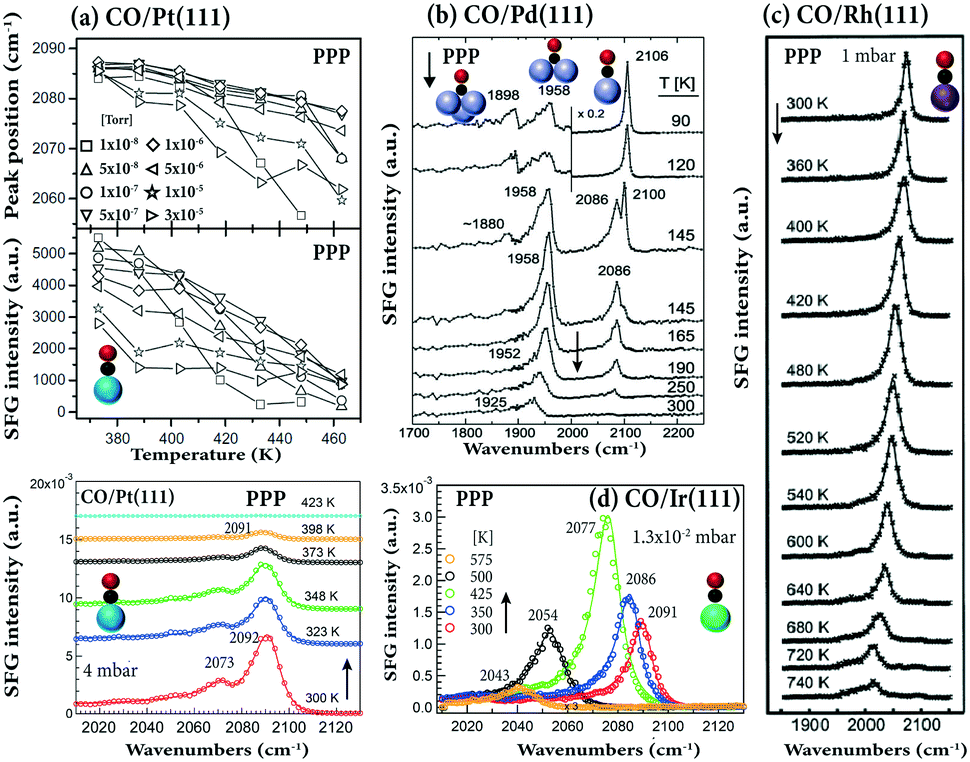 | ||
| Fig. 4 Temperature-dependent SFG spectra in PPP polarization combination: (a) CO/Pt(111) in the pressure range of 1 × 10⁻⁸–3 × 10⁻⁵ Torr (adapted from Westerberg et al.91 with permission from Elsevier) and at 4 mbar. (b) CO/Pd(111), after saturating the surface at 90 K, the crystal was annealed as indicated. Adapted from Morkel et al.21 with permission from Elsevier. (c) CO/Rh(111) at 1 mbar, adapted from Pery et al.84 with permission from Elsevier. (d) CO/Ir(111) at 1.3 × 10⁻² mbar, adapted from Li et al.32 with permission. Copyright (2020) American Chemical Society. | ||
Upon heating CO on Pd(111) under UHV (Fig. 4b), the on-top and hollow signals decreased, while that of bridge bonded CO first increased and then decreased. The observed changes can be explained by the complex coverage-dependent adsorption structures of CO/Pd(111), changing from hollow/on-top via bridge/on-top to bridge (for details see ref. 6). This behavior agrees with TPD results indicating that linear CO desorbed at ∼275 K (coverage <0.6 ML), whereas the stronger bonded bridge/three-fold hollow CO desorbed at higher temperature (>380 K).21 SFG spectra of CO on Rh(111) (Fig. 4c) indicated that an additional (but quite weak) low-frequency vibrational feature appeared at temperatures ≥600 K, marking the onset of irreversible CO dissociation.84
Distinctively different, upon heating CO on Ir(111), the on-top CO peak in PPP spectra first unexpectedly increased and then decreased (Fig. 4d). The TPD spectra of 0.56 ML coverage CO/Ir(111) in ref. 92 and 93 showed a broad desorption peak, starting at 375 K and extending to 540–600 K, with the peak maximum at 490 K. Therefore, the increase in PPP intensity from 300 to 425 K (despite coverage decreased) suggests a change in the CO tilt angle (see below), while the sharp decrease at 500 K results from CO desorption.32
By correlating the SFG intensity with the CO coverage determined from the integrated CO-TPD signal, for CO/Pt foil a linear relationship of SFG intensity and CO coverage was obtained.94 However, for on-top (or bridge95) CO adsorption on Ni(111),95 Pt(111)91,96,97 and Ir(111),32 non-linear relationships between SFG intensity and coverage were reported. In addition, for CO on Pt(111) and Pt(110),82 and Ir(111),32 a decrease in the peak width was observed with increasing CO coverage, due to the formation of uniform overlayer structures at high coverage.95 Narrow bands at high coverage are indicative of well-ordered uniform overlayer structures.95
Because the spectra of CO/Pt(111)38 and CO/Pd(111)89 were fully reversible upon variation of the gas pressure, irreversible pressure-induced surface reconstructions were absent (unless Pt(111) was heated at high CO pressure (400 Torr) and high temperature (673 K)88). As coverage increased, either by increasing gas pressure or decreasing temperature, the vibrational frequencies of the on-top CO consistently shifted to higher wavenumbers for CO/Pt(111) (Fig. 4a), CO/Pd(111) (Fig. 4b), CO/Rh(111) (Fig. 3b and 4c), and CO/Ir(111) (Fig. 4d). This originates from higher coverage which enhances the dipole–dipole coupling between adsorbed CO molecules and weakens the CO–substrate interaction via donation/back donation (chemical shift). Both effects decrease the strength of the metal–carbon bond, consequently making the C–O bond stronger, shifting the CO resonance position to higher wavenumbers.32,65,92 For CO/Cu(111) a small opposite shift was observed (2076.4 cm−1 at 0.1 ML to 2073.6 at 0.45 ML) (Fig. 3d). Moreover, the phase was constant at 37° for CO/Ir(111),98 whereas it increases from 20° (0.1 ML) to 30° (0.45 ML) for CO/Cu(111).86 Note that all SFG spectra discussed so far were measured in PPP polarization combination only.
For CO on Pt(111),69 Pd(111)99 and Ni(111),47 an upright (perpendicular) orientation of on-top and bridged CO were reported, as in SSP spectra no peaks were observed. Based on the simulations reported in ref. 32 and 33, ISSP is small at θ = 0°, but not zero, at the experimental configurations of αVis = 58.5° and αIR = 55°. Both SSP and PPP spectra of CO/Pt(111) at 300 K were thus obtained with relatively good signal-to-noise ratio (the experimental IPPP/ISSP intensity ratio for on-top CO at terrace sites (2092 cm−1) was 27).33 The simulated IPPP/ISSP has a maximum at θ = 0°, changing from 20 to 60 for the R-value (i.e. molecular hyperpolarizability ratio) range 0.6–0.3 at αVis = 58.5° and αIR = 55°.33 Also, the simulated IPPP, ISSP, and IPPP/ISSP significantly depend on the incidence angles of visible and IR beams (αVis and αIR). In particular, IPPP/ISSP increased as αVis increased. Therefore, the absence of SSP signals in previous studies may be due to the use of unfavorable incidence angles of visible and/or IR laser beams.
Taking advantage of the high-pressure capability of SFG, the pressure-dependent PPP and/or SSP spectra for CO on Pt(111) and Pd(111) at 300 K were obtained. PPP and SSP spectra of CO on Pt(111) simultaneously increased with CO pressure (10−4–36 mbar) (Fig. 5a), yielding almost the same IPPP/ISSP ratio (∼20). Apparently, the orientation of CO molecules did not change in the studied pressure range.33 Note that the peaks (2073–2076 cm−1) were assigned to on-top CO adsorbed at stepped terraces, and there were only small changes in intensity and frequency, as at 300 K saturation is almost reached at 10−4 mbar. This agrees with previous results of CO on smooth Pt(111).90 The observed increase of spectral intensity in PPP and SSP spectra can be attributed to the increasing surface coverage at a constant orientation angle.
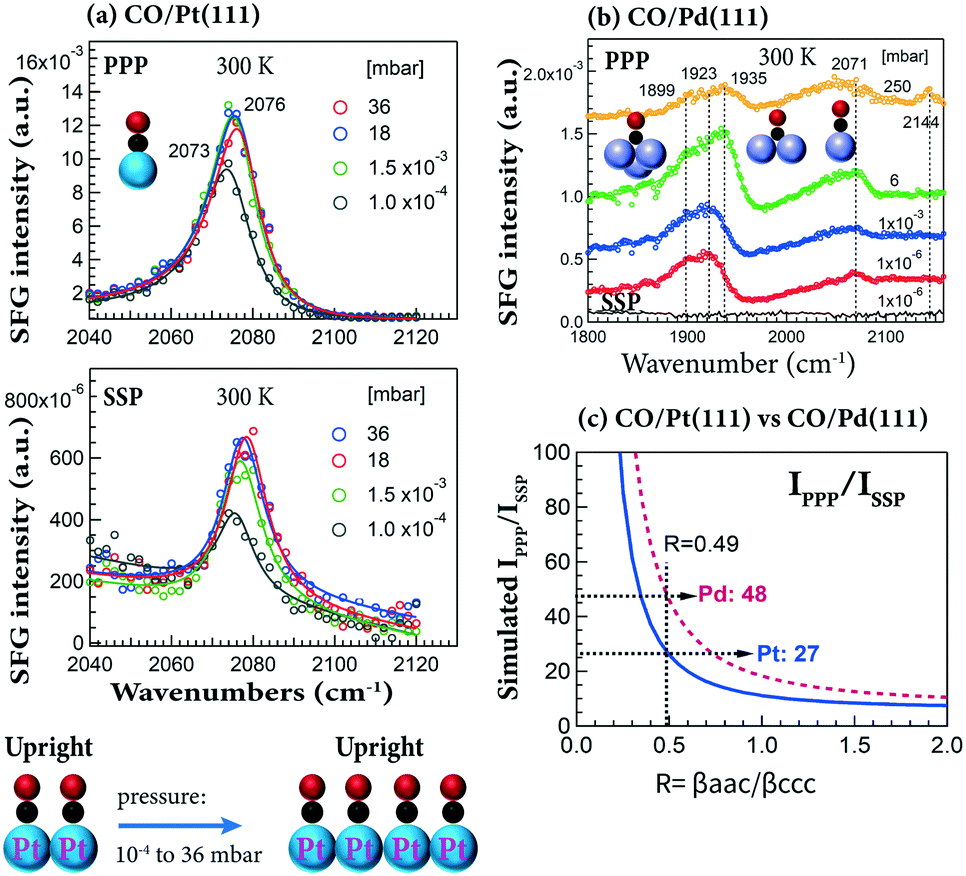 | ||
| Fig. 5 Pressure-dependent PPP and SSP spectra at 300 K of (a) CO/Pt(111) and (b) CO/Pd(111). (c) Simulations of IPPP/ISSPvs. R for CO/Pt(111) and CO/Pd(111). Experimental configurations: αVis = 58.5° and αIR = 55°. Adapted from Li et al.33 with permission from Springer. | ||
At comparable CO pressure (e.g. 6 vs. 4 mbar), the signal of on-top CO on Pd(111) is several times weaker than that on Pt(111).33 Thus, no quantitative orientation analysis can be obtained for CO on Pd(111) at 300 K, because the SSP spectra are too weak (even on-top CO PPP spectra are already quite weak in the entire pressure range of 10−6–250 mbar; Fig. 5b).
Assuming CO is upright and based on the value of IPPP/ISSP = 27, the molecular hyperpolarizability ratio (R) of on-top CO on Pt(111) is deduced by simulation/modeling to be 0.49 (Fig. 5c),33 approximately twice that of the free CO molecule (R ≈ 0.25).100 Or using IPPP/ISSP = 27, the tilt angles of on-top CO are 40°, 30°, 22° and 0° for R-values of 0.1, 0.3, 0.4 and 0.5, respectively.33 Similarly, at θ = 0° and R = 0.49, IPPP is 48 times larger than ISSP for CO on Pd(111) (Fig. 5c), indicating that SSP spectra are more difficult to measure on Pd(111) than on Pt(111).
Very recently, using the same experimental configuration (i.e. αVis = 58.5° and αIR = 55°), we also acquired the pressure- (and temperature-) dependent PPP and SSP spectra for CO adsorption on Ir(111).32 Because PPP and SSP changed oppositely (Fig. 6a), i.e. IPPP/ISSP varied, this again indicated that the CO tilt angle changed with coverage. The CO tilt angle increases from 25° to 36° when the coverage increases from 0.62 to 0.77 ML (Fig. 6d), assuming R = 0.08.32 Because the SSP signal was close to noise, CO on Ni(111) was reported to be upright (Fig. 6b and d). However, both PPP and SSP spectra with a relatively good signal-to-noise ratio were obtained for CO on NiO(111) (Fig. 6c), indicating that CO was (macroscopically) tilted.47 This is due to the inclined trigonal NiO(111) microfacets, with CO adsorbing on the Ni2+ ions of the “slopes”. Accordingly, the adsorbed CO molecules are oriented perpendicular to the NiO facets, but are tilted with respect to the underlying (111) surface (or the macroscopic surface normal) (Fig. 6d). Unfortunately, even though both PPP and SSP spectra of CO/NiO(111) were obtained, no quantitative analysis of tilt angles was performed.47 On the (100) surfaces of body-centered cubic transition metals, DFT calculations also suggested CO to be tilted. For example, CO adsorbed molecularly at fourfold hollow sites with tilt angles respective to the surface normal of 47°, 57°, 57°, and 58° for Fe, Mo, Cr, and W, respectively. However, unlike having coverage-dependent tilt angles on Ir(111), no significant variation of the tilt angle of CO with coverage was found on these metal surfaces.101
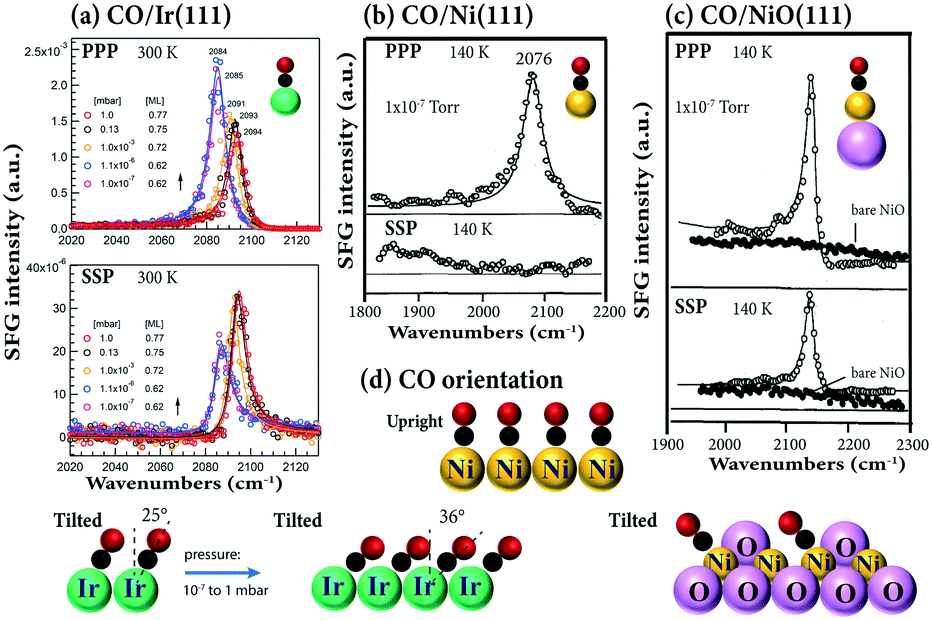 | ||
| Fig. 6 (a) Pressure dependent PPP and SSP spectra of (a) CO/Ir(111) at 300 K. Experimental configurations: αIR = 55°, αVis = 58.5°. Adapted from Li et al.32 with permission. Copyright (2020) American Chemical Society. (b) CO/Ni(111) at 140 K. (c) CO/NiO(111) at 140 K. Experimental configurations of (b) and (c): αIR = 65°, αVis = 65°, adapted from Bandara et al.47 with permission from Elsevier. | ||
As illustrated above, the SFG intensity depends on the incidence angles of laser beams, especially the visible beam. In ref. 47, relatively large incidence angles (∼65°) of visible and IR beams (configuration1: αIR = 65°, αVis = 65°) were used, which are larger than those adapted in ref. 32 (configuration2: αIR = 55°, αVis = 58.5°). Fig. 7 shows the simulated IPPP, ISSP and IPPP/ISSPvs. αVis with fixed αIR = 55° and 65° for CO on Ni(111). IPPP_1 of configuration 1 is comparable to IPPP_2 of configuration 2. Both of IPPP_1 and IPPP_2 are nearly at maximum (Fig. 7a). Unfortunately, the ISSP_1 of configuration 1 and ISSP_2 of configuration 2 are quite small (Fig. 7b). However, ISSP_2 is still two times larger than ISSP_1 (Fig. 7c). When the αIR had a 10° change (55° to 65°), the ratios of IPPP/ISSP were identical, but the IPPP/ISSP ratios strongly depended on αVis. When αVis increased from 58.5 to 65°, IPPP/ISSP increased from 1000 to 2200 (Fig. 7d). Therefore, the absence of the SSP signal for CO on Ni(111) in ref. 47 is likely caused by using a very large αVis (65°).
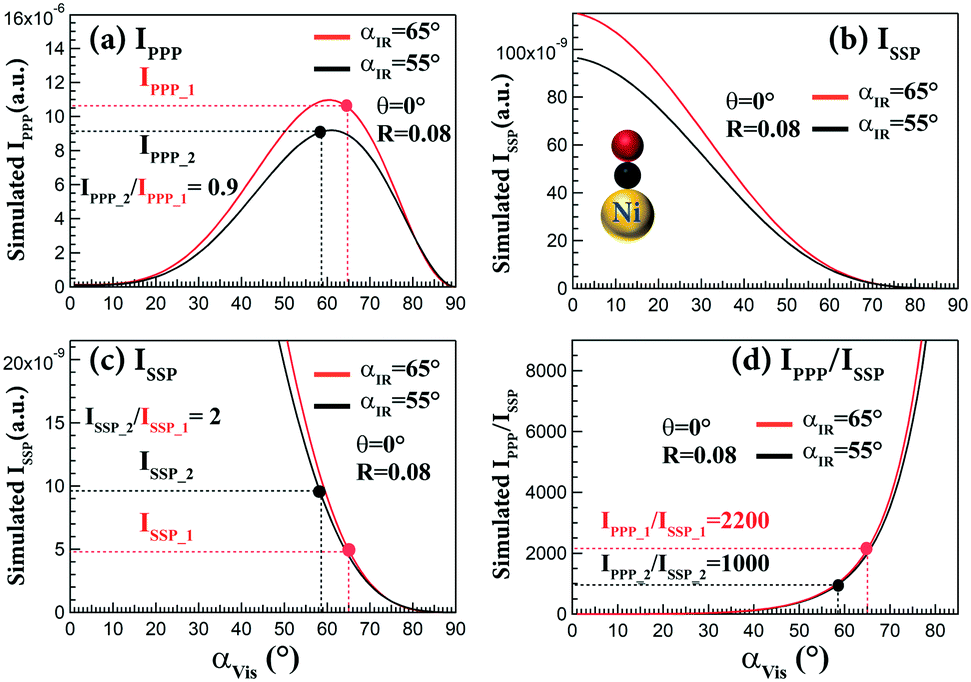 | ||
| Fig. 7 Simulated (a) IPPP, (b and c) ISSP and (d) IPPP/ISSP as a function of αVis for CO on Ni(111) with αIR = 65° and 55°. IPPP_1 and ISSP_1 were obtained at configuration1: αIR and αVis = 65° (ref. 47); IPPP_2 and ISSP_2 were obtained at configuration2: αIR = 55°, αVis = 58.5° (ref. 32). Refractive indices of Ni: n2(Vis)102 = 1.88 + 3.49i, n2(SFG)102 = 1.79 + 3.14i, n2(IR)103 = 5.24 + 17.88i; assumed βccc = 1, θ = 0°, and R = 0.08 (determined by CO on Ir(111)32). | ||
4.2 CO adsorption on supported metal nanoparticles
SFG has also been performed on supported Pd nanoparticles (grown by metal vapor deposition/electron beam evaporation on Al2O3 thin films) to bridge both the pressure and materials gaps.29,30,81,89 The particle number density and size can be adjusted by accurately controlling the growth conditions. When the same Pd amount (nominal thickness of 0.4 nm) is deposited at 90 and 300 K, the particles are smaller (3.5 nm mean size) and less ordered (with more defects, edges, steps, etc.) and larger (6 nm mean size) and well-faceted, respectively.81 For both sizes, under UHV conditions (10−7 mbar), the CO adsorption site occupancy on Pd nanoparticles was mainly governed by the particle surface structure,89 but with the gas pressure (10−7–200 mbar) controlling the coverage.81 Typically, CO adsorbs on two different sites of the supported Pd nanoparticles: twofold bridging on particle edges and terraces and on-top at terraces and low-coordinated sites (Fig. 8). For the smaller “defective” NPs a higher fraction of on-top was observed (Fig. 8a), similar to rough Pd thin films.65 For the larger “well-faceted” NPs (Fig. 8b), the on-top population was smaller at low pressure and the site occupancy compares best with the defect-rich (stepped or strongly sputtered) Pd(111),89 rather than “smooth” Pd(111) (Fig. 8c). On Pd(111), a rearrangement of the (>0.5 ML) CO layer from a bridge (1955 cm−1)/on-top (2087 cm−1) to a (∼0.7 ML) hollow (1895 cm−1)/on-top (2107 cm−1) configuration occurred at high pressure (≥1 mbar, Fig. 8c).34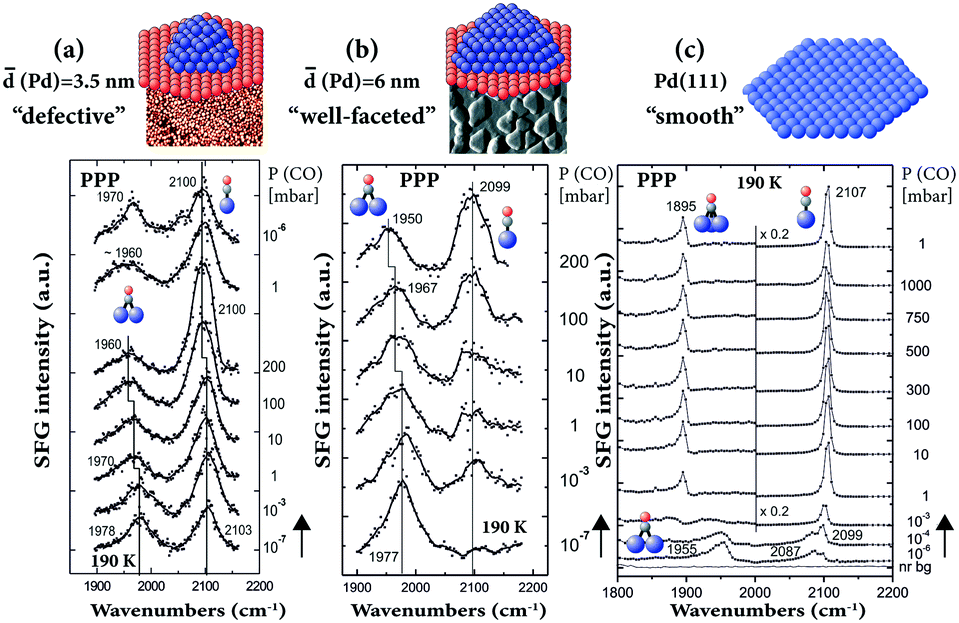 | ||
| Fig. 8 Pressure-dependent PPP spectra at 190 K of CO on (a) 3.5 nm Pd/Al2O3/NiAl(110), (b) 6 nm Pd/Al2O3/NiAl(110) and (c) Pd(111). Adapted from Unterhalt et al.89 with permission. Copyright (2002) American Chemical Society. Note that all spectra were acquired in PPP polarization combination. | ||
It should be noted that the first SFG spectra of CO on supported nanoparticles (in Fig. 8 and ref. 29, 30 and 81) were obtained by using a Ti:Sa-based laser system. Although these spectra had a poor resolution of only approximately 25 cm−1 (Fig. 8a and b and 9c), they still provided valuable information about adsorbate structures on Pd nanoparticles. Using a Nd:YAG laser system (Fig. 9a and b), a clear improvement in resolution was obtained. Comparing the UHV spectra of CO adsorbed on 3.5 nm Pd nanoparticles acquired with Nd:YAG (Fig. 9b) and Ti:Sa (Fig. 9c) laser systems, not only the linewidth decreased, but also the lineshape became very asymmetric. A similar linewidth was obtained for CO on Pd(111), but the peaks were more symmetric (Fig. 9a). The asymmetric lineshape observed on nanoparticles can thus be understood by the fact that the SFG signal originates from the interference between the resonant signal and the nonresonant background. For the Nd:YAG laser system, the nonresonant background was much higher for Pd nanoparticles than that for Pd(111), which is attributed to electric transitions in the NiAl(110) substrate.104
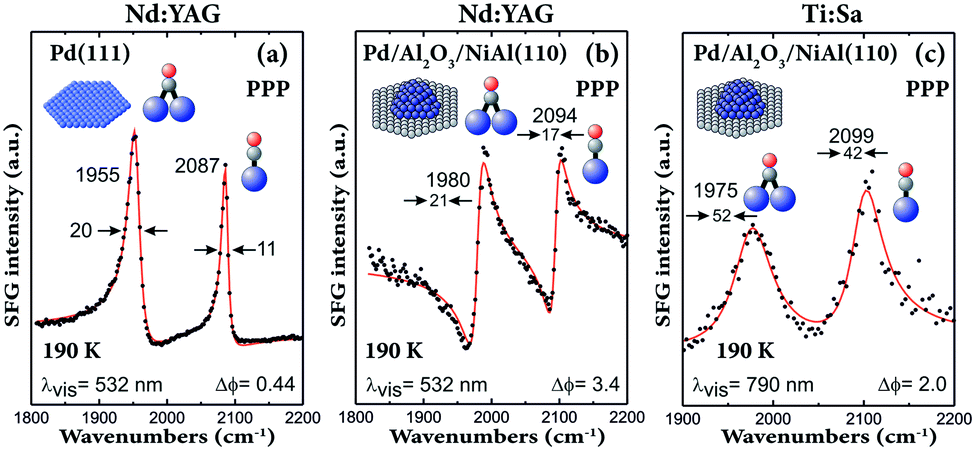 | ||
| Fig. 9 SFG spectra of CO (near saturation coverage at 190 K) adsorbed on (a) Pd(111) and on (b and c) Pd/Al2O3/NiAl(110) with 3.5 nm Pd nanoparticles (grown at 90 K) acquired with Nd:YAG (a and b) and Ti:Sa (c) laser-based SFG spectrometers. Adapted from Morkel et al.104 with permission from Elsevier. Note that all spectra were acquired in PPP polarization combination. | ||
The adsorption of CO on 3.6 to 5.8 nm pyramidal Pd nanoparticles, grown on ultrathin MgO films on Ag(100), was studied at room temperature as a function of CO coverage by Bourguignon and coworkers (Fig. 10a and b),105 and compared to CO on bulk Pd(100) (Fig. 10c).36 For both Pd particle sizes, the spectroscopic signature was dominated by CO on the (100) top facets (∼1880 to 1990 cm−1), accompanied by few relatively weak bands at high coverage attributed to CO on (111) side facets, edges, and defects (>1930 cm−1 and 2040–2100 cm−1). In both cases, the bridged CO peaks blue-shifted with higher coverage, from 1890 (low coverage; singleton frequency) to 1983 cm−1 (10−3 mbar) for smaller and larger NPs, respectively. Size-dependent spectra on Pd clusters and nanoparticles (4 to >500 atoms) on Al2O3/Ni3Al(111) were reported in ref. 34.
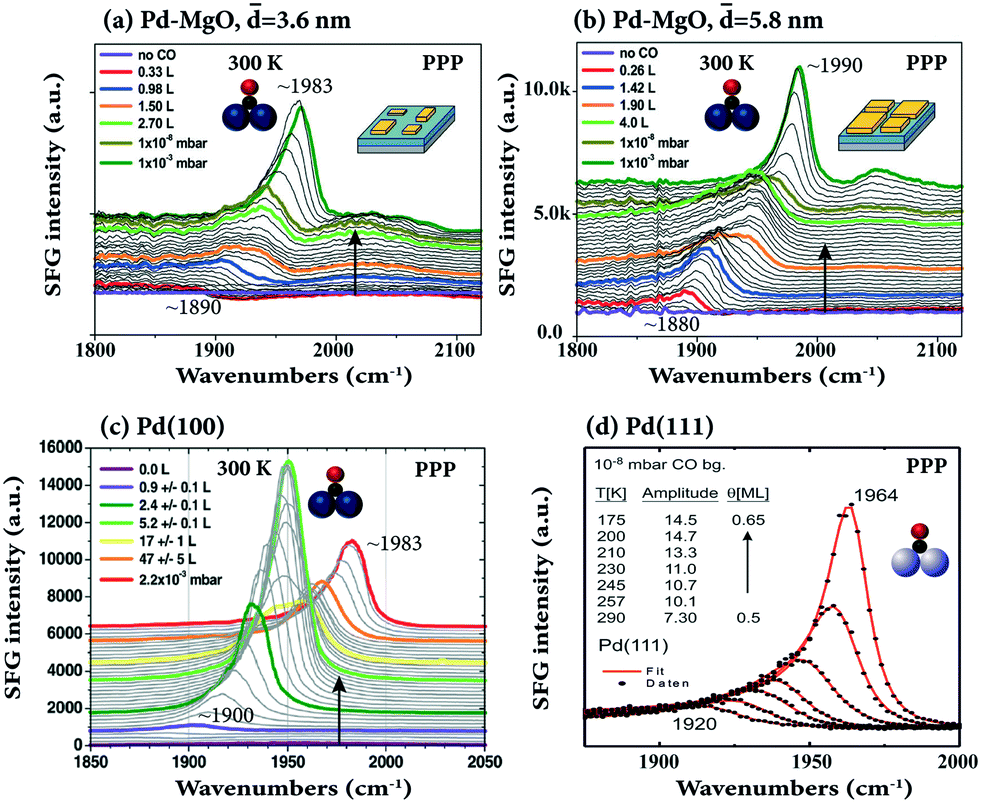 | ||
| Fig. 10 SFG spectra of CO adsorbed on MgO-supported (a) 3.6 nm size and (b) 5.8 nm size Pd NPs at 300 K as a function of CO dose/pressure. Adapted from Ouvrard et al.105 with permission. Copyright (2017) American Chemical Society. (c) CO on Pd(100) at 300 K, adapted from Ouvrard et al.36 with permission. Copyright (2014) American Chemical Society. (d) CO on Pd(111) at the temperature range 175–290 K, adapted from Morkel et al.104 with permission from Elsevier. Note that all spectra were acquired in PPP polarization combination. | ||
In contrast, upon CO coverage increase on the Pd(100) single crystal, the SFG intensity first increased, but then decreased. This behavior is different from the “monotonic” increase of bridge bonded CO on Pd–MgO (Fig. 10a and b) and Pd(111) (Fig. 10d) and was explained by the coexistence of compressed and uncompressed CO (with the molecular hyperpolarizability at compressed sites being two times smaller than at uncompressed sites). According to DFT compressed CO/Pd(100) is tilted by 8–9° with respect to the surface normal, but unfortunately, only PPP (no SSP) spectra were acquired in ref. 36.
Note that for CO/Pd(111) (Fig. 10d), there is a non-proportional relationship between the CO coverage and the SFG signal amplitude (coverage increases by ∼30% from 0.5 to 0.65 ML, while the SFG amplitude doubles). The strong enhancement of the SFG amplitude may be due to coverage-dependent (increasing) Raman factors99,104 or interference effects between different SFG susceptibility tensor elements.45 A direct quantitative coverage analysis by integration of the SFG peak areas or via the amplitude is thus not possible.89,106 Nevertheless, the strong coverage-dependence of the C–O stretching frequency, if known from combined TPD, XPS, LEED, IRAS or SFG UHV measurements, allows the actual CO coverage under mbar pressure conditions, e.g. for CO on Pd(111) or Ir(111), to be deduced.
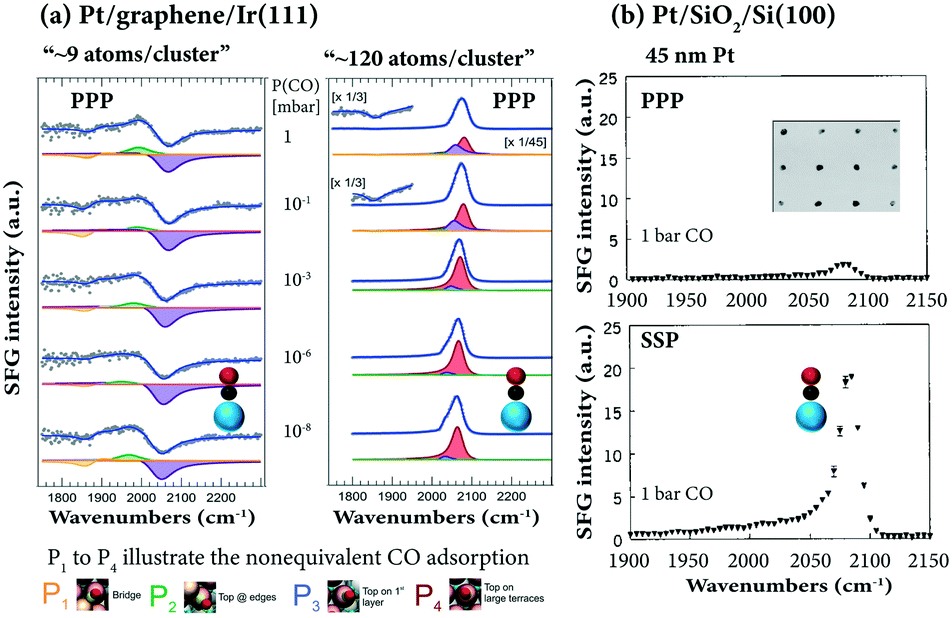
The room temperature adsorption of CO on Pt clusters/nanoclusters, grown on a regular array template provided by the graphene/Ir(111) moiré structure, was examined by Vesselli and coworkers107 by SFG, STM, XPS and DFT. SFG revealed adsorbate structures different from those on a Pt single crystal, on which only terminal CO was observed (cf.Fig. 3). On Pt∼9 clusters, both bridge and on-top bonded CO species populate different sites of the clusters at terraces, borders, edges (Fig. 11a). For example, for Pt∼9 CO at ∼1870 cm−1 (Pt-bridge), ∼1970–1995 cm−1 (on-top Pt at edges/corners), and ∼2040–2060 cm−1 (on-top Pt at borders and 1st layer terraces) appeared. For larger Pt nanoparticles, typical on-top CO on terraces was observed (∼2070–2105 cm−1).
 | ||
| Fig. 11 SFG spectra of CO adsorbed on supported Pt: (a) CO at 10−8–1 mbar at 300 K on Pt nanoclusters grown on graphene/Ir(111), adapted from Podda et al.107 with permission. Copyright (2017) American Chemical Society. (b) CO at 1 bar at 300 K on polycrystalline Pt particles (45 nm size) grown by electron beam lithography, adapted from Baldelli et al.114 with permission. Copyright (2000) American Institute of Physics. | ||
Furthermore, upon CO adsorption a significant restructuring of the Pt clusters was observed, promoting particle sintering for small clusters and reshaping for large ones (similar CO-induced restructuring/mobility was reported for Pt nanoparticles108 and Cu clusters109). Above 420 K at 0.1 mbar, there was CO spillover from Pt clusters to the underlying graphene/Ir(111) interface (i.e. intercalated CO at 2060–2080 cm−1ref. 32 and 98) promoted by the Pt particles. Once more, SFG has been successfully used to reveal CO adsorption sites on the surface of nanoparticles, but due to the lack of SSP spectra, there is unfortunately no information about the CO orientation. Vice versa, using high-resolution broadband SFG, Ren and coworkers110 reported SSP (but no PPP) spectra of CO adsorption on z-cut α-quartz-supported Pt nanoparticles at 1 bar.
The adsorption of ∼1 bar CO on Pt nanoparticle arrays on SiO2, with polycrystalline Pt particles grown by electron beam lithography (30, 40, 45, 200, and 1000 nm in mean size),29,111–113 was reported by Baldelli et al.114 On-top CO was characterized both in PPP and SSP polarization combinations (Fig. 11b) and a strong signal enhancement was attributed to the surface plasmon resonance in the 45 nm Pt particles and the dielectric properties of the SiO2 substrate (but no CO orientation information was provided).
4.3 Isotopic CO adsorption on single crystals and Pd nanoparticles
The adsorption of CO on metal surfaces has been widely used to characterize the available surface adsorption sites. With increasing coverage, the adsorbate–adsorbate interactions can be described by vibrational (dipole–dipole) coupling and by chemical (through substrate) interaction.65 These two effects can be disentangled by isotopic mixtures, as the vibrational frequencies of 12C16O and 12C18O (or 13C18O) are too different to enable dipole-coupling.The adsorbate–metal and adsorbate–adsorbate interactions determine the frequency and intensity of the vibrational bands.95 An abnormal coverage dependence was observed for CO on Ni(111). At low coverage (0.04–0.4 ML) CO preferred to adsorb on the bridge sites of Ni(111), but as the coverage further increased (0.47 ML), the signal of bridge CO weakened upon appearance of on-top CO and finally disappeared at 0.60 ML. To examine the possibility that the bridge bonded CO did not really weaken/disappear, but was rather screened by the high-frequency dipoles of on-top CO, the adsorption of isotopic mixtures was studied: 12C16O and 12C18O on Ni(111) at 0.33 ML with only bridge CO on the surface, and at 1 ML with only on-top CO on the surface (Fig. 12a). Note that as the 12C16O concentration decreased, the signal of bridge 12C16O (1920 cm−1) and on-top 12C16O (2074 cm−1) monotonically decreased, and the signal of bridge 12C18O (1890 cm−1) and on-top 12C18O (2022 cm−1) monotonically increased, suggesting that the intensity transfer between the 12C16O and 12C18O bands is not sufficient to suppress one of the two peaks. Rather than the screening of the bridged CO band by on-top CO, a change in the Raman tensor is thus responsible for the disappearance of bridge CO at high coverage.95
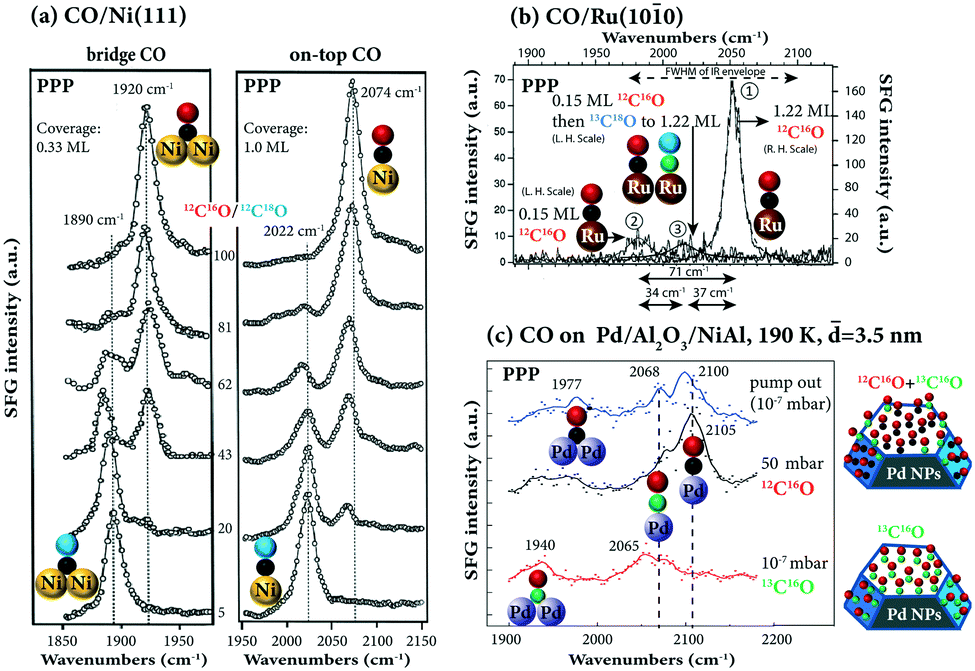 | ||
Fig. 12 (a) Isotopic 12C16O and 12C18O adsorption on Ni(111). The ratio of 12C16O and 12C18O was determined by the TPD peak area. Adapted from Bandara et al.95 with permission from Elsevier. (b) Isotope 12C16O and 13C18O adsorption on Ru(10![[1 with combining macron]](https://www.rsc.org/images/entities/char_0031_0304.gif) 0), adapted from Symonds et al.115 with permission. Copyright (2004) American Institute of Physics. (c) Isotope 12C16O and 13C16O adsorption on Pd/Al2O3/NiAl(110), adapted from Unterhalt et al.89 with permission. Copyright (2002) American Chemical Society. Note that all spectra were acquired in PPP polarization combination. 0), adapted from Symonds et al.115 with permission. Copyright (2004) American Institute of Physics. (c) Isotope 12C16O and 13C16O adsorption on Pd/Al2O3/NiAl(110), adapted from Unterhalt et al.89 with permission. Copyright (2002) American Chemical Society. Note that all spectra were acquired in PPP polarization combination. | ||
Furthermore, isotopic experiments help to understand coverage-dependent changes in the CO stretch frequency. Fig. 12b shows three SFG spectra of isotopic 12C16O/13C18O adsorption on Ru(100) in PPP polarization combination. The first was acquired at saturation coverage of 12C16O. Then, for comparison a spectrum at 0.15 ML coverage of 12C16O was taken. Apparently, there is a total frequency shift of 71 cm−1, due to the combined contributions of dipole–dipole coupling and chemical shift. Then, the 0.15 ML 12C16O surface was filled with 13C18O up to saturation coverage and a third spectrum was measured. Since the 12C16O molecules do not couple well to the heavier 13C18O molecules, the observed 34 cm−1-shift is largely chemical in nature. Apparently, the effects of dipole coupling and chemical shift on the CO frequency shift can be quantitatively disentangled. Unfortunately, only PPP spectra were recorded. The orientation information of CO on Ru(100) as well as isotopic effects on the CO orientation angle remains unclear. Similarly, the adsorption of an isotopic mixture of 12C16O and 13C16O on Al2O3-supported Pd nanoparticles has been studied by SFG,89 revealing high mobility of the adsorbed CO molecules at 190 K. As shown in Fig. 12c, Pd particles of 3.5 nm mean size were saturated with 13C16O resulting in a bridge and an on-top peak at lower wavenumbers (1940 and 2065 cm−1) due to the isotopic effect. When the sample was exposed to 50 mbar of 12C16O, the on-top peak was shifted to 2105 cm−1 (the resonance frequency of 12C16O), indicating exchange of molecules. However, the exchange was not complete because a shoulder of linear 13C16O (∼2068 cm−1) still existed. The remaining linear 13C16O may be bonded to defects or edges. When the CO gas was pumped out, the spectrum exhibited peaks originating from linearly bonded 12C16O (2100 cm−1) and 13C16O (2068 cm−1) and a broad bridge peak with a maximum around 1977 cm−1. Once more, without SSP spectra, orientation angles of the strongly bound 13C16O (not exchanged with 12C16O) and the on-top 12C16O cannot be determined.
4.4 SFG under reaction conditions
One of the main benefits of SFG spectroscopy is that it can be performed during an ongoing catalytic reaction (in situ or operando), such as CO oxidation on Pt(111),37 on Pt nanoparticles supported on ZrO2,28 and on Rh(111),84 or CO hydrogenation on Pd(111),89,116,117 and methanol oxidation on Pd nanoparticles supported on Al2O3.118Some examples of SFG spectra recorded during CO oxidation and hydrogenation are depicted in Fig. 13. For CO oxidation (CO/O2 = 1:2) on ZrO2-supported Pt nanoparticles at 523 K (Fig. 13a), an intense on-top CO peak was observed at 2085 cm−1, and only little CO2 was generated since the Pt surface was CO poisoned. Upon increasing the temperature, an increase in CO2 was observed and at 623 K the conversion of CO and O2 was at maximum. At this temperature, even though the SFG spectra decreased in intensity and red-shifted in frequency (shifted from 2085 to 2077 cm−1) which indicated a decreasing CO coverage, some facets of Pt nanoparticles were still covered by CO due to the strong on-top CO peak in the SFG spectra. Therefore, CO2-production occurred at non-poisoned sites of Pt nanoparticles (defects or metal/oxide interfaces). For CO oxidation on polycrystalline Pt foil, the order of the ignition temperatures is (110) < (100) < (111), in line with a facet-dependent stepwise lifting of CO poisoning.119
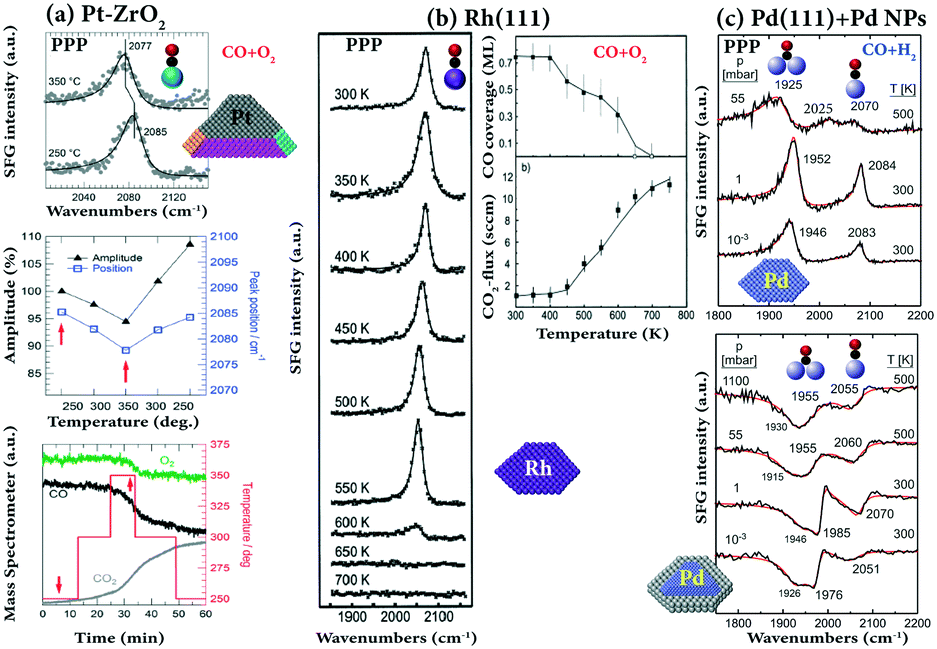 | ||
| Fig. 13 SFG and MS spectra of CO oxidation on (a) Pt–ZrO2 at 10 mbar CO and 20 mbar O2; Pt particles of 7 nm size on a ZrO2 film of 42 nm thickness; adapted from Roiaz et al.28 with permission. Copyright (2018) American Institute of Physics. (b) Rh(111) under laminar flow conditions at a total pressure of 20 mbar in a stagnation point flow (CO, 15 sccm; O2, 30 sccm; Ar, 105 sccm; flow velocity 2.5 cm s−1), adapted from Pery et al.84 with permission from Elsevier. (c) CO hydrogenation (CO/H2 = 1:10) on Pd(111) and Pd/Al2O3/NiAl(110). Pressures and temperatures are indicated, adapted from Morkel et al.117 with permission from Elsevier. All spectra were measured in PPP polarization combination. | ||
A lower (∼450 K) ignition temperature was found for the CO oxidation (CO/O2 = 1:2) on Rh(111).84 As shown in Fig. 13b, below 400 K the presence of O2 in the stagnation flow did not result in a reduction of the CO coverage, indicating that adsorbed CO efficiently blocked the adsorption of oxygen. At 450 K, the CO coverage apparently decreases and the onset of CO2 production is noted. In the temperature range 400–600 K, not only the CO coverage linearly decreased, but also the CO frequency gradually redshifted. The sudden decrease in CO coverage above 600 K was a result of a transition from a predominately CO-covered surface state to an O-covered state, originating from an increase of dissociative oxygen adsorption upon decreasing CO coverage and the increase of the surface reaction rate. Further post-reaction AES spectra revealed that only trace amounts of surface carbon and Rh surface oxides were formed upon CO oxidation under the investigated conditions.
For CO oxidation on polycrystalline Rh foil, defect-rich (high Miller-index) Rh surfaces appeared to be much more tolerant towards CO poisoning than annealed (smooth) surfaces. Nanometer-sized Rh nanotips, representing Rh NPs, were found to be even more CO tolerant.120
Additionally, CO/H2 coadsorption and CO hydrogenation on Pd(111) were studied by SFG, showing that the adsorption site occupancy depended on the type of gas exposure (sequential dosing vs. co-dosing). When Pd(111) was exposed to 1:1 CO/H2 mixtures under UHV at 100 K, on-top CO was absent due to hydrogen atoms diffusing between hollow sites via bridge sites that destabilized neighboring on-top CO molecules. Preadsorbed surface hydrogen prevented CO adsorption at 100 K, but it was replaced by CO above 125 K and H2 desorption started only after a considerable amount of CO had desorbed.
To monitor the CO–H reaction at high temperature, SFG experiments of a 1:10 CO/H2 mixture on Pd(111) and on Pd/Al2O3/NiAl(110) were carried out at elevated pressure (Fig. 13c). On Pd(111) at 500 K, a peak at 1925 cm−1 (bridge CO) was accompanied by weak features (on-top CO) at ∼2025 cm−1 and ∼2070 cm−1 at 55 mbar, while for low temperature (UHV) CO spectra a bridge (or hollow) bonded CO signal around 1925 cm−1 did not occur in combination with on-top CO.89 Consequently, the species at 2070 cm−1 and 2025 cm−1 may indicate that the Pd(111) surface is (partially) roughened under reaction conditions.
Similar to CO/H2 on Pd(111), at high pressure (55 mbar) and at high temperature (500 K), a modified adsorbate structure was also observed for Pd/Al2O3 where a bridging species at 1955 cm−1 was accompanied by an on-top feature around 2060 cm−1 (Fig. 13c). Such a low-frequency on-top CO species does not occur under UHV121 and again points to a possible surface roughening. Unfortunately, only trace amounts of CO hydrogenation products (methanol or methane) were detected by gas chromatographic and mass spectroscopic detection117 due to the small turnover frequency of Pd (∼5 × 10⁻⁴ s−1 at 550 K)122 and the small Pd surface area of the model catalysts.
5. Conclusions
The few case studies presented illustrate how vibrational SFG spectroscopy can be applied to characterize the adsorption and reaction of (isotopic) CO on single crystals and supported nanoparticles over wide pressure ranges (from UHV to atmospheric) and over wide temperature ranges (from 90 to 700 K). The aim of such investigations is to analyse adsorbate sites and geometries, molecular orientation (and changes thereof) of CO on different (low-index) single crystals and (oxide- or graphene-supported) nanoparticles, as a function of CO gas pressure and/or substrate temperature, approaching technological reaction conditions.The adsorbate geometries that were observed on the (111) facets of platinum, rhodium, iridium, and copper single crystals are similar, with on-top CO dominating the SFG spectra. No high-pressure species were observed, but coverage is apparently controlled by pressure and temperature. The site population cannot be extrapolated from UHV studies, especially when the population of hollow, bridge and on-top CO sensitively depends on coverage, e.g. on Pd(111). Different from the known adsorbate geometries, the coverage-dependent molecular orientation (tilt angle) of CO on most single crystals is still lacking (and thus typically considered to be upright and constant). So far, only the orientation analysis of CO on Pt(111) and Ir(111) was performed by SFG, as for these systems spectra both in PPP and SSP polarizations were obtained simultaneously. The orientation angle of CO on Pt(111) was found to be independent of coverage, whereas for CO on Ir(111) it is coverage-dependent (i.e. CO is upright at low coverage, but tilted at high coverage). In addition, assuming upright CO, the hyperpolarizability ratios of CO on Pt(111) and on Ir(111) were deduced to be 0.49 and 0.08, respectively. For CO adsorption on supported metal nanoparticles, the adsorbate geometries are typically different from those obtained on single crystals, because nanoparticles exhibit several different facets and edges/defects. Using isotopically labelled CO allows dynamic and static coupling to be disentangled. SFG spectroscopy under reaction conditions revealed that CO2-production may start at defects or metal/oxide interfaces of CO-covered Pt nanoparticles. The onset temperature of CO2 production on Rh(111) is above 400 K, and only trace amounts of surface carbon and Rh surface oxides were formed upon CO oxidation. Under high pressure and at high temperature, both Pd(111) and Pd/Al2O3 surfaces were (partially) roughened in the CO/H2 mixture, but only minute amounts of CO hydrogenation products were detected. The continued combined application of model catalysts and polarization-dependent SFG spectroscopy, especially under operando conditions with simultaneous SFG/MS analysis, will thus improve our understanding of catalytic processes in heterogeneous catalysis.
Conflicts of interest
There are no conflicts of interest to declare.Acknowledgements
XL is indebted to the Austrian Science Fund (FWF) for a Lise Meitner Fellowship (M 2787-N). GR acknowledges the Austrian Science Fund (FWF) for grants SFB FOXSI (F4502-N16), DK+Solids4Fun (W1243), ComCat (I1041-N28), I4434-N (Single Atom Catalysis), and TU Wien for project IP 2008 (SFG Spectroscopy).References
- G. A. Somorjai and Y. M. Li, Introduction to Surface Chemistry and Catalysis, Wiley-VCH Verlag GmbH & Co. KGaA, 2010 Search PubMed.
- G. Ertl, Angew. Chem., Int. Ed., 2008, 47, 3524–3535 CrossRef CAS.
- G. A. Somorjai and G. Rupprechter, J. Chem. Educ., 1998, 75, 161–176 CrossRef CAS.
- G. Ertl and H.-J. Freund, Phys. Today, 1999, 52, 32–38 CrossRef CAS.
- J. Sauer and H.-J. Freund, Catal. Lett., 2015, 145, 109–125 CrossRef CAS.
- G. Rupprechter, in Advances in Catalysis, ed. B. Gates and H. Knözinger, Academic, New York, 2007, vol. 51, pp. 133–263 Search PubMed.
- G. Rupprechter, Annu. Rep. Prog. Chem., Sect. C: Phys. Chem., 2004, 100, 237–311 RSC.
- C. T. Campbell, Surf. Sci. Rep., 1997, 27, 1–111 CrossRef CAS.
- A. Ghalgaoui and M. Sterrer, J. Phys. Chem. C, 2020, 124, 4190–4195 CrossRef CAS.
- Y. J. Tong, F. Lapointe, M. Thamer, M. Wolf and R. K. Campen, Angew. Chem., Int. Ed., 2017, 56, 4211–4214 CrossRef CAS.
- H. Tatsumi, F. D. Liu, H. L. Han, L. M. Carl, A. Sapi and G. A. Somorjai, J. Phys. Chem. C, 2017, 121, 7365–7371 CrossRef CAS.
- X. Li and G. Rupprechter, Chin. J. Catal., 2019, 40, 1655–1667 CrossRef.
- I. V. Yudanov, R. Sahnoun, K. M. Neyman, N. Rösch, J. Hoffmann, S. Schauermann, V. Johánek, H. Unterhalt, G. Rupprechter, J. Libuda and H.-J. Freund, J. Phys. Chem. B, 2003, 107, 255–264 CrossRef CAS.
- H.-J. Freund and G. Pacchioni, Chem. Soc. Rev., 2008, 37, 2224–2242 RSC.
- G. Pacchioni, ChemPhysChem, 2003, 4, 1041–1047 CrossRef CAS.
- V. K. Markova, J. P. Philbin, W. Zhao, A. Genest, J. Silvestre-Albero, G. Rupprechter and N. Rösch, ACS Catal., 2018, 8, 5675–5685 CrossRef CAS.
- C. Spiel, P. Blaha, Y. Suchorski, K. Schwarz and G. Rupprechter, Phys. Rev. B: Condens. Matter Mater. Phys., 2011, 84, 045412 CrossRef.
- L. Moskaleva, C. C. Chiu, A. Genest and N. Rosch, Chem. Rec., 2016, 16, 2388–2404 CrossRef CAS.
- R. A. Vansanten and M. Neurock, Catal. Rev.: Sci. Eng., 1995, 37, 557–698 CrossRef CAS.
- M. V. Ganduglia-Pirovano, A. Hofmann and J. Sauer, Surf. Sci. Rep., 2007, 62, 219–270 CrossRef CAS.
- M. Morkel, H. Unterhalt, M. Salmeron, G. Rupprechter and H.-J. Freund, Surf. Sci., 2003, 532, 103–107 CrossRef.
- W. Reichl, G. Rosina, G. Rupprechter, C. Zimmermann and K. Hayek, Rev. Sci. Instrum., 2000, 71, 1495–1499 CrossRef CAS.
- G. A. Somorjai, Chem. Rev., 1996, 96, 1223–1235 CrossRef CAS.
- J. Szanyi and D. W. Goodman, Rev. Sci. Instrum., 1993, 64, 2350–2352 CrossRef CAS.
- D. Godbey, F. Zaera, R. Yeates and G. A. Somorjai, Surf. Sci., 1986, 167, 150–166 CrossRef CAS.
- A. L. Cabrera, N. D. Spencer, E. Kozak, P. W. Davies and G. A. Somorjai, Rev. Sci. Instrum., 1982, 53, 1888–1893 CrossRef CAS.
- D. W. Blakely, E. I. Kozak, B. A. Sexton and G. A. Somorjai, J. Vac. Sci. Technol., 1976, 13, 1091–1096 CrossRef CAS.
- M. Roiaz, V. Pramhaas, X. Li, C. Rameshan and G. Rupprechter, Rev. Sci. Instrum., 2018, 89, 045104 CrossRef.
- G. Rupprechter and H.-J. Freund, Top. Catal., 2001, 14, 3–14 CrossRef.
- G. Rupprechter, Phys. Chem. Chem. Phys., 2001, 3, 4621–4632 RSC.
- Y. R. Shen, Nature, 1989, 337, 519–525 CrossRef CAS.
- X. Li, V. Pramhaas, C. Rameshan, P. Blaha and G. Rupprechter, J. Phys. Chem. C, 2020, 124, 18102–18111 CrossRef CAS.
- X. Li, M. Roiaz, V. Pramhaas, C. Rameshan and G. Rupprechter, Top. Catal., 2018, 61, 751–762 CrossRef CAS.
- N. Alyabyeva, A. Ouvrard, A.-M. Zakaria and B. Bourguignon, J. Phys. Chem. Lett., 2019, 10, 624–629 CrossRef.
- G. Rupprechter, MRS Bull., 2007, 32, 1031–1037 CrossRef CAS.
- A. Ouvrard, J. J. Wang, A. Ghalgaoui, S. Nave, S. Carrez, W. Q. Zheng, H. Dubost and B. Bourguignon, J. Phys. Chem. C, 2014, 118, 19688–19700 CrossRef CAS.
- G. A. Somorjai and G. Rupprechter, J. Phys. Chem. B, 1999, 103, 1623–1638 CrossRef CAS.
- X. C. Su, P. S. Cremer, Y. R. Shen and G. A. Somorjai, Phys. Rev. Lett., 1996, 77, 3858–3860 CrossRef CAS.
- C. T. Williams, Y. Yang and C. D. Bain, Catal. Lett., 1999, 61, 7–13 CrossRef CAS.
- G. A. Somorjai, Surf. Sci., 1995, 335, 10–22 CrossRef CAS.
- P. S. Cremer, X. C. Su, Y. R. Shen and G. A. Somorjai, J. Am. Chem. Soc., 1996, 118, 2942–2949 CrossRef CAS.
- P. S. Cremer, X. C. Su, Y. R. Shen and G. A. Somorjai, Catal. Lett., 1996, 40, 143–145 CrossRef CAS.
- P. S. Cremer, B. J. McIntyre, M. Salmeron, Y. R. Shen and G. A. Somorjai, Catal. Lett., 1995, 34, 11–18 CrossRef CAS.
- P. Cremer, C. Stanners, J. W. Niemantsverdriet, Y. R. Shen and G. Somorjai, Surf. Sci., 1995, 328, 111–118 CrossRef CAS.
- S. Baldelli, N. Markovic, P. Ross, Y. R. Shen and G. Somorjai, J. Phys. Chem. B, 1999, 103, 8920–8925 CrossRef CAS.
- M. Fang, G. Santos, X. L. Chen and S. Baldelli, Surf. Sci., 2016, 648, 35–41 CrossRef CAS.
- A. Bandara, S. Dobashi, J. Kubota, K. Onda, A. Wada, K. Domen, C. Hirose and S. S. Kano, Surf. Sci., 1997, 387, 312–319 CrossRef.
- C. T. Williams and D. A. Beattie, Surf. Sci., 2002, 500, 545–576 CrossRef CAS.
- S. B. Waldrup and C. T. Williams, Catal. Commun., 2007, 8, 1373–1376 CrossRef CAS.
- M. S. Yeganeh, S. M. Dougal and B. G. Silbernagel, Langmuir, 2006, 22, 637–641 CrossRef CAS.
- S. J. Kweskin, R. M. Rioux, S. E. Habas, K. Komvopoulos, P. Yang and G. A. Somorjai, J. Phys. Chem. B, 2006, 110, 15920–15925 CrossRef CAS.
- G. Kennedy, L. R. Baker and G. A. Somorjai, Angew. Chem., Int. Ed., 2014, 53, 3405–3408 CrossRef CAS.
- G. Tourillon, L. Dreesen, C. Volcke, Y. Sartenaer, P. A. Thiry and A. Peremans, Nanotechnology, 2007, 18, 415301 CrossRef.
- M. Salmeron and R. Schlögl, Surf. Sci. Rep., 2008, 63, 169–199 CrossRef CAS.
- X. Zhou, F. Bebensee, M. Yang, R. Bebensee, F. Cheng, Y. He, Q. Shen, J. Shang, Z. Liu, F. Besenbacher, T. R. Linderoth and K. Wu, ACS Nano, 2017, 11, 9397–9404 CrossRef CAS.
- W. de Poel, S. J. T. Brugman, K. H. A. van de Ven, A. Gasseling, J. de Lange, E. R. Townsend, A. H. J. Engwerda, M. Jankowski, M. A. R. Blijlevens, B. Werkhoven, J. Drnec, F. Carla, R. Felici, A. Tuladhar, N. M. Adhikari, J. J. De Yoreo, J. A. A. W. Elemans, W. J. P. van Enckevort, A. E. Rowan and E. Vlieg, Angew. Chem., Int. Ed., 2020, 59, 2323–2327 CrossRef CAS.
- E. Arakawa, in Compendium of Surface and Interface Analysis, ed. The Surface Science Society of Japan, Springer, Singapore, 2018, pp. 689–696 Search PubMed.
- M. Plodinec, H. C. Nerl, F. Girgsdies, R. Schlögl and T. Lunkenbein, ACS Catal., 2020, 10, 3183–3193 CrossRef CAS.
- J. V. Lauritsen and F. Besenbacher, J. Catal., 2015, 328, 49–58 CrossRef CAS.
- J. Frenken and I. Groot, Operando Research in Heterogeneous Catalysis, Springer, Switzerland, 2017 Search PubMed.
- J. Dou, Z. Sun, A. A. Opalade, N. Wang, W. Fu and F. Tao, Chem. Soc. Rev., 2017, 46, 2001–2027 RSC.
- G. Rupprechter, in Surface and Interface Science, ed. K. Wandelt, Wiey-VCH Verlag GmbH & Co. KGaA, Germany, 2016, pp. 459–528 Search PubMed.
- K. Föttinger and G. Rupprechter, Acc. Chem. Res., 2014, 47, 3071–3079 CrossRef.
- J. H. Hunt, P. Guyotsionnest and Y. R. Shen, Chem. Phys. Lett., 1987, 133, 189–192 CrossRef CAS.
- F. M. Hoffmann, Surf. Sci. Rep., 1983, 3, 107–192 CrossRef CAS.
- P. Miranda and Y. Shen, J. Phys. Chem. B, 1999, 103, 3292–3307 CrossRef CAS.
- C. Hirose, N. Akamatsu and K. Domen, Appl. Spectrosc., 1992, 46, 1051–1072 CrossRef.
- H. F. Wang, W. Gan, R. Lu, Y. Rao and B. H. Wu, Int. Rev. Phys. Chem., 2005, 24, 191–256 Search PubMed.
- G. Rupprechter and A. Bandara, in Surface and Thin Film Analysis: A compendium of Principles, Instrumentation, and Applications, ed. G. Friedbacher and H. Bubert, Wiey-VCH Verlag GmbH & Co. KGaA, Germany, 2011, pp. 407–435 Search PubMed.
- W. Liu, L. Fu, Z. G. Wang, Z. Sohrabpour, X. B. Li, Y. T. Liu, H. F. Wang and E. C. Y. Yan, Phys. Chem. Chem. Phys., 2018, 20, 22421–22426 RSC.
- X. Li, G. Z. Deng, L. Ma and X. L. Lu, Langmuir, 2018, 34, 9453–9459 CrossRef CAS.
- T. Iwahashi, T. Ishiyama, Y. Sakai, A. Morita, D. Kim and Y. Ouchi, Phys. Chem. Chem. Phys., 2015, 17, 24587–24597 RSC.
- T. Iwahashi, T. Miyamae, K. Kanai, K. Seki, D. Kim and Y. Ouchi, ACS Symp. Ser. Am. Chem. Soc., 2009, 1030, 305–316 CAS.
- M. M. Knock, G. R. Bell, E. K. Hill, H. J. Turner and C. D. Bain, J. Phys. Chem. B, 2003, 107, 10801–10814 CrossRef CAS.
- L. F. Scatena and G. L. Richmond, J. Phys. Chem. B, 2001, 105, 11240–11250 CrossRef CAS.
- L. F. Scatena, M. G. Brown and G. L. Richmond, Science, 2001, 292, 908–912 CrossRef CAS.
- J. C. Conboy, M. C. Messmer and G. L. Richmond, J. Phys. Chem., 1996, 100, 7617–7622 CrossRef CAS.
- M. C. Messmer, J. C. Conboy and G. L. Richmond, J. Am. Chem. Soc., 1995, 117, 8039–8040 CrossRef CAS.
- G. Mizutani and Y. Miyauchi, Surf. Interface Anal., 2010, 42, 1675–1679 CrossRef CAS.
- Y. Miyauchi, H. Sano, J. Okada, H. Yamashita and G. Mizutani, Surf. Interface Anal., 2010, 42, 1667–1670 CrossRef CAS.
- T. Dellwig, G. Rupprechter, H. Unterhalt and H.-J. Freund, Phys. Rev. Lett., 2000, 85, 776–779 CrossRef CAS.
- C. Klünker, M. Balden, S. Lehwald and W. Daum, Surf. Sci., 1996, 360, 104–111 CrossRef.
- E. Carrasco, A. Aumer, M. A. Brown, R. Dowler, I. Palacio, S. Song and M. Sterrer, Surf. Sci., 2010, 604, 1320–1325 CrossRef CAS.
- T. Pery, M. G. Schweitzer, H. R. Volpp, J. Wolfrum, L. Ciossu, O. Deutschmann and J. Warnatz, Proc. Combust. Inst., 2002, 29, 973–980 CrossRef CAS.
- I. M. Lane, D. A. King and H. Arnolds, J. Chem. Phys., 2007, 126, 024707 CrossRef.
- J. C. Owrutsky, J. P. Culver, M. Li, Y. R. Kim, M. J. Sarisky, M. S. Yeganeh, A. G. Yodh and R. M. Hochstrasser, J. Chem. Phys., 1992, 97, 4421–4427 CrossRef CAS.
- M. Corva, M. Rinaldi, Z. Feng, M. Roiaz, C. Rameshan, G. Rupprechter, R. Costantini, M. Dell'Angela, G. Pastore, G. Comelli, N. Seriani and E. Vesselli, Nat. Commun., 2018, 9, 4703 CrossRef CAS.
- K. Y. Kung, P. Chen, F. Wei, Y. R. Shen and G. A. Somorjai, Surf. Sci., 2000, 463, L627–L633 CrossRef CAS.
- H. Unterhalt, G. Rupprechter and H.-J. Freund, J. Phys. Chem. B, 2002, 106, 356–367 CrossRef CAS.
- G. Rupprechter, T. Dellwig, H. Unterhalt and H.-J. Freund, J. Phys. Chem. B, 2001, 105, 3797–3802 CrossRef CAS.
- S. Westerberg, C. Wang and G. A. Somorjai, Surf. Sci., 2005, 582, 137–144 CrossRef CAS.
- J. Lauterbach, R. W. Boyle, M. Schick, W. J. Mitchell, B. Meng and W. H. Weinberg, Surf. Sci., 1996, 350, 32–44 CrossRef CAS.
- C. M. Comrie and W. H. Weinberg, J. Chem. Phys., 1976, 64, 250–259 CrossRef CAS.
- H. Härle, A. Lehnert, U. Metka, H. R. Volpp, L. Willms and J. Wolfrum, Appl. Phys. B: Lasers Opt., 1999, 68, 567–572 CrossRef.
- A. Bandara, S. Katano, J. Kubota, K. Onda, A. Wada, K. Domen and C. Hirose, Chem. Phys. Lett., 1998, 290, 261–267 CrossRef CAS.
- G. A. Somorjai, Surf. Sci., 2006, 600, 240–240 CrossRef CAS.
- C. Gutierrez, Surf. Sci., 2005, 595, 249–251 CrossRef CAS.
- M. Corva, Z. J. Feng, C. Dri, F. Salvador, P. Bertoch, G. Comelli and E. Vesselli, Phys. Chem. Chem. Phys., 2016, 18, 6763–6772 RSC.
- P. Galletto, H. Unterhalt and G. Rupprechter, Chem. Phys. Lett., 2003, 367, 785–790 CrossRef CAS.
- S. J. A. van Gisbergen, J. G. Snijders and E. J. Baerends, J. Chem. Phys., 1998, 109, 10657–10668 CrossRef CAS.
- F. J. E. Scheijen, D. C. Ferre and J. W. Niemantsverdriet, J. Phys. Chem. C, 2009, 113, 11041–11049 CrossRef CAS.
- P. B. Johnson and R. W. Christy, Phys. Rev. B: Solid State, 1974, 9, 5056–5070 CrossRef CAS.
- M. A. Ordal, R. J. Bell, R. W. Alexander, L. L. Long and M. R. Querry, Appl. Opt., 1987, 26, 744–752 CrossRef CAS.
- M. Morkel, H. Unterhalt, T. Klüner, G. Rupprechter and H.-J. Freund, Surf. Sci., 2005, 586, 146–156 CrossRef CAS.
- A. Ouvrard, A. Ghalgaoui, C. Michel, C. Barth, J. J. Wang, S. Carrez, W. Q. Zheng, C. R. Henry and B. Bourguignon, J. Phys. Chem. C, 2017, 121, 5551–5564 CrossRef CAS.
- G. Rupprechter, H. Unterhalt, M. Morkel, P. Galletto, L. J. Hu and H.-J. Freund, Surf. Sci., 2002, 502, 109–122 CrossRef.
- N. Podda, M. Corva, F. Mohamed, Z. J. Feng, C. Dri, F. Dvorak, V. Matolin, G. Comelli, M. Peressi and E. Vesselli, ACS Nano, 2017, 11, 1041–1053 CrossRef CAS.
- A. Haghofer, P. Sonström, D. Fenske, K. Föttinger, S. Schwarz, J. Bernardi, K. Al-Shamery, M. Bäumer and G. Rupprechter, Langmuir, 2010, 26, 16330–16338 CrossRef CAS.
- M. Roiaz, L. Falivene, C. Rameshan, L. Cavallo, S. M. Kozlov and G. Rupprechter, J. Phys. Chem. C, 2019, 123, 8112–8121 CrossRef CAS.
- T. Luo, R. D. Zhang, X. X. Peng, X. T. Liu, C. Y. Zhou, X. M. Yang and Z. F. Ren, Surf. Sci., 2019, 689, 121459 CrossRef CAS.
- A. S. Eppler, G. Rupprechter, L. Guczi and G. A. Somorjai, J. Phys. Chem. B, 1997, 101, 9973–9977 CrossRef CAS.
- A. Avoyan, G. Rupprechter, A. S. Eppler and G. A. Somorjai, Top. Catal., 2000, 10, 107–113 CrossRef CAS.
- A. S. Eppler, G. Rupprechter, E. A. Anderson and G. A. Somorjai, J. Phys. Chem. B, 2000, 104, 7286–7292 CrossRef CAS.
- S. Baldelli, A. S. Eppler, E. Anderson, Y. R. Shen and G. A. Somorjai, J. Chem. Phys., 2000, 113, 5432–5438 CrossRef CAS.
- J. P. R. Symonds, H. Arnolds, V. L. Zhang, K. Fukutani and D. A. King, J. Chem. Phys., 2004, 120, 7158–7164 CrossRef CAS.
- G. Rupprechter, M. Morkel, H.-J. Freund and R. Hirschl, Surf. Sci., 2004, 554, 43–59 CrossRef CAS.
- M. Morkel, G. Rupprechter and H.-J. Freund, Surf. Sci., 2005, 588, L209–L219 CrossRef CAS.
- M. Bäumer, J. Libuda, K. M. Neyman, N. Rösch, G. Rupprechter and H.-J. Freund, Phys. Chem. Chem. Phys., 2007, 9, 3541–3558 RSC.
- D. Vogel, C. Spiel, Y. Suchorski, A. Trinchero, R. Schlögl, H. Grönbeck and G. Rupprechter, Angew. Chem., Int. Ed., 2012, 51, 10041–10044 CrossRef CAS.
- Y. Suchorski, I. Bespalov, J. Zeininger, M. Raab, M. Datler, P. Winkler and G. Rupprechter, Catal. Lett., 2020, 150, 605–612 CrossRef CAS.
- K. Wolter, O. Seiferth, H. Kuhlenbeck, M. Bäumer and H.-J. Freund, Surf. Sci., 1998, 399, 190–198 CrossRef CAS.
- A. F. Gusovius, T. C. Watling and R. Prins, Appl. Catal., A, 1999, 188, 187–199 CrossRef CAS.
| This journal is © The Royal Society of Chemistry 2021 |