
 Open Access Article
 This Open Access Article is licensed under a
 Creative Commons Attribution 3.0 Unported Licence
The role of excited-state character, structural relaxation, and symmetry breaking in enabling delayed fluorescence activity in push–pull chromophores†
Patrick
Kimber
 ,
Pooja
Goddard
,
Iain A.
Wright
and
Felix
Plasser
*
,
Pooja
Goddard
,
Iain A.
Wright
and
Felix
Plasser
*
Department of Chemistry, Loughborough University, Loughborough, LE11 3TU, UK. E-mail: f.plasser@lboro.ac.uk; Tel: +44-1509-226946
First published on 8th November 2021
Abstract
Thermally activated delayed fluorescence (TADF) is a current promising route for generating highly efficient light-emitting devices. However, the design process of new chromophores is hampered by the complicated underlying photophysics. In this work, four closely related donor–π–acceptor–π–donor systems are investigated, two of which were synthesised previously, with the aim of elucidating their varying effectiveness for TADF. We outline that the frontier orbitals are insufficient for discriminating between the molecules. Subsequently, a detailed analysis of the excited states at a correlated ab initio level highlights the presence of a number of closely spaced singlet and triplet states of varying character. Results from five density functionals are compared against this reference revealing dramatic changes in, both, excited state energies and wavefunctions following variations in the amount of Hartree–Fock exchange included. Excited-state minima are optimised in solution showing the crucial role of structural variations and symmetry breaking for producing a strongly emissive S1 state. The adiabatic singlet–triplet gaps thus obtained depend strongly on the range separation parameter used in the hybrid density functional calculations. More generally, this work highlights intricate differences present between singlet and triplet excited state wavefunctions and the challenges in describing them accurately.
1 Introduction
Thermally activated delayed fluorescence (TADF) constitutes a promising route toward creating organic electroluminescent materials with the potential to obtain 100% internal quantum efficiency through the possibility of harvesting both singlet and triplet excitons.1–3 On a microscopic level, TADF is governed by the reverse intersystem crossing (rISC) process whereby a non-emissive molecular triplet excited state is converted into an emissive singlet state capable of efficient luminescence. Most prominently, the rISC process depends on the energy gap (ΔEST) between the lowest excited singlet and triplet states, which enters exponentially into the rate expression1 and can be seen as an effective activation energy to the TADF process. Other influences are related to spin–orbit coupling (SOC), enabling the formally spin-forbidden rISC process,1 and the oscillator strength (f) of the emitting singlet state.4 All three properties crucially depend on the state character where enhanced charge transfer (CT) is expected to lower both ΔEST and f.5 SOC, on the other hand, is promoted by a difference in state character between the singlet and triplet states1,6,7 where small amounts of mixed character can already lead to appreciable coupling.8 Furthermore, the importance of a second, locally excited (LE), triplet state has been emphasised.6,9,10 Finally, multipolar systems are of interest where one acceptor unit is connected to two or more donor units and vice versa.4,11 Aside from the above considerations, the possibility of symmetry breaking in the excited state is particularly intriguing in such multipolar systems.11,12The intricate photophysics of TADF emitters poses severe challenges for its computational description while also providing an ideal test bed for evaluating the newest computational tools. The importance of CT states already makes it clear that the application of time-dependent density functional theory (TDDFT) is challenging in terms of describing energies13 as well as state characters.14 Suggestions for addressing this problem range from empirical corrections15 to optimal tuning of range-separated functionals7,16 to the avoidance of TDDFT altogether in favour of unrestricted ground-state DFT.8,17 Furthermore, state-specific excited-state solvation effects have to be described at a high level considering that the common linear-response polarizable continuum model (LR-PCM) is inadequate for CT states with large electron–hole separation18,19 and does not even provide any correction beyond zeroth order to triplet states due to their vanishing transition densities. Finally, the importance of dynamic mixing effects,20 structural deformations,10 and vibronic coupling between the LE and CT triplet states9,21 has been emphasised.
A common theme in the above discussions of TADF photophysics and its computational description is the importance of excited states of different character, in particular LE and CT states. Accurately analysing these states and the mixing between them can become a challenge on its own and a simple discussion of frontier orbitals is often inadequate. Thus, aside from the necessity of choosing an accurate electronic structure method, it becomes exceedingly important to choose a meaningful and reproducible method for analysing the computations. Indeed, a range of tools for categorising excited states are available. Categorisation of excited states occurs prominently via different measures of charge transfer,22–25 which are a natural choice for push–pull systems. However, special care has to be taken for symmetric systems, including the molecules studied here, noting that the dipole moment and related charge displacement metrics are not reliable descriptors for the charge transfer character in symmetric systems.24,26,27 A powerful option to overcome this problem amounts to base the analysis on a correlated electron–hole pair within an effective exciton picture;28 and this was shown to be particularly suitable even for challenging cases with high symmetry.29–31 Aside from categorising excited states, there has been an increasing push toward a rationalisation of the underlying energetics and, in particular, the singlet–triplet gap. The applied approaches range from a formal discussion of the underlying molecular orbital integrals1,7 to a direct extraction of computational data from actual electronic structure computations and applying it for energy decomposition and visualisation.5,32,33
It is the purpose of this work to exemplify the above discussion on four different TADF candidates highlighting their intricate photophysics as well as methodological challenges in the computational description. The four molecules studied are shown in Fig. 1, all possessing a D–π–A–π–D structure where a central accepting moiety (A) is symmetrically connected to two donors (D) whose separation is controlled by 1,4-phenylene π-bridges. All molecules employ a carbazole (Cz) donor group and we use four different core groups, benzo[1,2-b:4,5-b′]dithiophene-4,8-dione (BDT), anthraquinone (AQ), benzo[1,2-b:4,5-b′]dithiophene-S,S-dioxide-4,8-dione (BDT-SO2), and benzo[1,2-b:4,5-b′]difuran-4,8-dione (BDF). Two of these molecules Cz-BDT34 and Cz-AQ4 have been previously synthesised and characterised. We will study these in detail before moving on to predicting the properties of Cz-BDT-SO2 and Cz-BDF. Within this work, we contrast these four related molecules highlighting the profound changes in their observed photophysical properties following seemingly inconspicuous changes in the acceptor unit.
 | ||
| Fig. 1 The molecular structures of the four D–π–A–π–D molecules studied within this work. The dihedral angles and bond distances discussed throughout are indicated by θn and dn, and are defined in the same way for all molecules in this work. | ||
The employed acceptor unit BDT is an electron deficient ring-fused heterocycle and a synthetic intermediate towards the synthesis of the fully aromatic and strongly-electron donating benzodithiophene moiety which is widely exploited in high performance donor polymers for organic solar cells.35–41 While benzodithiophene has seen great utilisation as a donor, BDT itself has received much less attention as an acceptor unit despite its deep LUMO energy which is ca. 0.39 V lower than that of the carbocyclic homologue anthraquinone.42,43
Cz-BDT was designed to complement one of the best reported red TADF luminogens at the time, Cz-AQ,4 and induce a red-shift in emission due to the lower LUMO of BDT. This did lead to a >100 nm redshift in emission wavelength compared to Cz-AQ, and TADF was evident from the characteristic double decay in the transient absorbance spectra, however the photoluminescence quantum yield (PLQY) was greatly reduced in both solution and dilute thin film measurements from ≈0.60 for Cz-AQ in solution to <0.10 for Cz-BDT. We note that in the meantime alternative strategies in the design of red TADF emitters have led to high PLQY extending into the near infrared range.44–51 Nonetheless, identifying the root cause of the vast drop in PLQY between Cz-AQ and Cz-BDT presents a useful challenge to inform future molecular design and to provide insight into the intricate photophysics of TADF emitters.
Here, we also study Cz-BDT-SO2 where dearomatisation of the fused heterocycles will serve to further reduce the LUMO (and to a lesser extent the HOMO) through inductive effects and remove the influence of the S lone pairs on the electronic properties of the molecule. Oxidation of S to SO2 serves to stabilise the LUMO and red-shift emission while it is also expected to enhance PLQYs and modulate singlet and triplet energies, ΔEST, spin–orbit coupling effects, and solvatochromism.52–55 Finally, Cz-BDF is studied in order to identify the impact of light vs. heavy heteroatoms on molecular geometries, excited state energies, and characters.
Within this work, we first explain the methods used discussing the general strategy employed for analysing excited-state wavefunctions and proceeding to specifics of the computational details. The results are presented in some detail starting with general structural parameters and frontier orbitals, proceeding to a discussion of the vertical excitations in terms of the state characters present and the computational description, finishing with an exploration of excited-state minima in solution. Before concluding, we proceed by a compact discussion summarising the main photophysical properties computed using two values of the hybrid DFT range separation parameter, highlighting general differences between singlet and triplet state wavefunctions, and reviewing the most critical methodological aspects.
2 Methods
2.1 Wavefunction analysis
Analysis of excited state wavefunctions is performed via TheoDORE,56 which provides automatic, fragment-based assignment of state character. Specifically, the analysis uses the one-electron transition density matrix (1TDM), which is formally defined as: | (1) |
 | (2) |
Excited states can also be analysed via the natural transition orbitals (NTOs),22,59 computed through a singular value decomposition where the 1TDM is expressed as57,58
 | (3) |
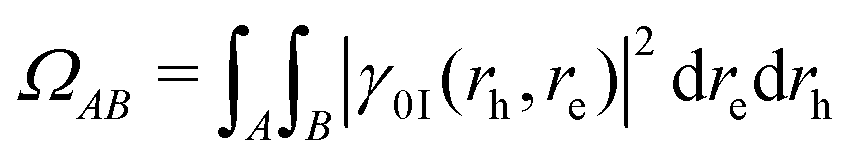
| γ0I(rh, re) = ψh(rh)ψe(re) | (4) |
 | (5) |
The CT numbers constitute a versatile tool and have been applied successfully for, e.g., interacting chromophores,60 push–pull systems31 and transition metal complexes.61,62 However, a downside of this analysis is that it depends on the a priori definition of a fragmentation scheme. To overcome this problem and obtain a more fundamental measure of charge transfer, we compute an exciton size defined as the root-mean-square separation of electron and hole
 | (6) |
In addition we will utilise the absolute mean electron–hole separation
 | (7) |
2.2 Computational details
Computations are performed on Cz-BDT, Cz-AQ, Cz-BDT-SO2 and Cz-BDF as shown in Fig. 1. The tertiary butyl groups used to improve solubility in the experimental studies have been excluded.4,34 Computations in this study are divided into three parts: (i) an initial optimisation of the ground state geometry, (ii) vertical excitations with different functionals, and (iii) excited-state geometry optimisations in solution.For step (i) the molecular geometries of Cz-BDT and Cz-AQ were optimised at the ωB97X-V/def2-SVP level of theory64,65 and confirmed as being minimum energy structures by a vibrational analysis at the same level. For step (ii), to determine an appropriate computational method to describe the excited state character of the molecules, the first 10 vertical excitations are first computed at the ri-ADC(2) level,66 using the def2-TZVP basis set.65,67 The first 10 excited states are, then, recomputed using five different density functionals with TD-DFT in the Tamm–Dancoff approximation (TDA).68 The TDA is used here and in all following computations considering that the TDA is expected to reduce problems associated with triplet instabilities.69 The density functionals evaluated are PBE,70 PBE0,71ωPBEh,72 CAM-B3LYP,73–75 and ωB97X-V,64 with the def2-SV(P)65 basis set. In the case of ωPBEh, we used a range separation parameter of ω = 0.1 a.u. and a global amount of Hartree–Fock exchange of 20% following previous experience on related donor/acceptor systems.52
The ωPBEh/def2-SV(P) level of theory is selected for step (iii) based on results from density functional benchmarking to the experimental absorption maximum and the ri-ADC(2) state characters. A tuned value of ω = 0.040 a.u. is used for these calculations. The ground state (S0) structures of all four molecules were optimised using spin-restricted Kohn–Sham DFT (RKS) along with the ωPBEh functional in toluene solution (ε = 2.3741) using a conductor-like polarisable continuum model (PCM).76,77 Excited singlet states (S1) were optimised using time-dependent density functional theory (TDDFT) along with the ωPBEh functional using a toluene solvent model (ε = 2.3741, ε∞ = 2.2403) using a linear response (LR-PCM)78,79 approach for excited-state solvation. Excited-triplet states (T1) were optimised at the TDDFT/LR-PCM level of theory along with additional ground-state spin-unrestricted Kohn–Sham DFT computations (UKS/PCM). No empirical dispersion correction is used as there is no clear way of choosing appropriate parameters for a manually adjusted functional and since preliminary observations showed that dispersion only has a minor effect on these linear molecules.
Based on the S0 optimised geometries, we compute the TDDFT vertical excitation energies of the first 7 excited states using two different solvation methods, LR-PCM and a perturbative state-specific solvation model (pt-SS).19,80 At the excited-state geometries we perform TDDFT computations using the LR-PCM and SS-PCM18,80,81 models. Specifically, the following workflow is used: all three PCM approaches start with a RKS/PCM ground-state calculation. LR-PCM, which is the default approach, proceeds with a TDDFT computation including a correction for non-equilibrium solvation added directly to the TDDFT response matrix. The ptSS approach, on the other hand, starts with a zeroth order TDDFT response matrix – not including any corrections for solvation. It proceeds by computing a state-specific correction term based on the zeroth order response vector and the relaxed ground state density. Oscillator strengths (f) for ptSS were computed as f = 2/3 × ΔE × μ2 by combining the original transition dipole moments μ with the perturbatively corrected excitation energies ΔE. Finally, SS-PCM is technically carried out via two subsequent TDDFT jobs. In the first step the solvent field is fully equilibrated to the state of interest and for technical reasons the optical dielectric constant ε∞ is set to 1. In the second step the DFT orbital optimisation as well as TDDFT are carried out in the equilibrated solvent field using again ε = 2.3741 and ε∞ = 2.2403. SS-PCM vertical emission energies were computed as the difference between the SCF energy of the first step and the total excited-state energy of the second step.
All (TD)DFT computations were performed with Q-Chem 5.2.82 ri-ADC(2) computations used Turbomole 7.2.83 Wavefunction analysis, following the ideas outlined in Section 2.1, were carried out in TheoDORE 2.3.56,58
The underlying research data (molecular geometries, input/output files of Q-Chem and Turbomole) is provided via a separate repository.84
3 Results
3.1 Molecular structures and frontier orbitals
The D–π–A–π–D molecules studied here are comprised of carbazole (Cz) donor units, phenylene (Ph) ring π bridges, and the acceptor core (BDT or AQ). These molecules have a significant degree of conformational flexibility because rotation is possible around the carbazole–phenyl bonds and the phenyl–core bonds. This gives rise to four independent dihedral angles, denoted as and
and  (see Fig. 1). To restrict the associated number of conformers, we will consider only molecules of C2 symmetry
  and Ci symmetry
  . Furthermore, we find that the energy difference between the Ci and C2 conformers is negligible (see Table S1, ESI†) indicating that both, along with other conformers, should be present at room temperature. To obtain consistent results, we select C2 conformers for all subsequent calculations, unless specified explicitly.
Optimised ground-state geometries, considering the C2 case, are presented in Fig. 2 and the geometric data for C2 and Ci are shown in Table 1. Generally speaking, we find significant twisting for both torsion angles considered. Starting with the discussion of the C2 geometries, the Cz/Ph twisting angles  are consistently ≈57° for both molecules. By comparison, the twisting around the Ph/core junction
  is notably reduced owing to reduced steric hindrance. Twisting in Cz-AQ is larger than in Cz-BDT (39° vs. 26°) which can be understood by considering that the AQ group has two hydrogen atoms in the vicinity of the Ph group whereas BDT only has one. Cz-BDT is, thus, expected to allow for enhanced conjugation between the Ph and BDT groups and we will explore the consequences of this on the observed photophysics in more detail below. Proceeding to the bond distances, we find that the Cz–Ph distances
  are very similar for both molecules (≈1.417 Å). For the
  values however, the bond distance is shorter in Cz-BDT (1.479 Å) than Cz-AQ (1.491 Å) following the same trends as expected for the bond angles, i.e. conjugation is stronger for Cz-BDT. Table 1 also presents results for the Ci geometry as well as data from previous work on the two molecules4,34 using the B3LYP functional. The observed trends between the three data sets are consistent indicating that these geometric parameters are fairly robust with respect to both the precise conformer studied and the functional chosen.
 | ||
| Fig. 2 The 3D structures of Cz-BDT and Cz-AQ optimised at the ωB97X-V/def2-SVP level of theory in C2 symmetry. | ||
 , θ2,
, θ2,  in degrees) and bond distances (d1,
  , d2,
, d2,  in Å) for the Cz-BDT and Cz-AQ molecules obtained at the ωB97X-V/def2-SVP level of theory. Computational results from ref. 34 and 4 are shown for comparison


To discuss the electronic structure of this system, we start with the frontier molecular orbitals as is usually done for these types of molecules. The highest occupied molecular orbital (HOMO) and lowest unoccupied MO (LUMO) for Cz-BDT are shown in Fig. 3, and for Cz-AQ in Fig S1 (ESI†). The HOMO and LUMO look the same for both molecules; the HOMO is located on the carbazole donor units and the LUMO is located on the acceptor core and there are only negligible contributions on the bridging Ph units. A transition from the HOMO to the LUMO would, therefore, produce an excited state with a large amount of charge transfer (CT) character, shifting electron density from the donor to the acceptor. However, HOMO/LUMO plots can only ever provide a very rough picture of the electronic structure and we will proceed to a detailed analysis of the excited states and all orbitals involved, below.
 | ||
| Fig. 3 The HOMO (bottom) and LUMO (top) for Cz-BDT calculated at the ωB97X-V/def2-SVP level of theory. | ||
3.2 Vertical excitations
Proceeding to the excited states of Cz-BDT and Cz-AQ, we first endeavour to find a computational method that describes their states accurately. To do so, we consider experimental results as well as reference calculations at the ab initio ri-ADC(2)/def2-TZVP level of theory. Experimental results are presented in Table 2. Cz-BDT is found to have an absorption maximum at 2.65 eV and a strongly red-shifted emission at 1.87 eV. In the case of Cz-AQ both values are about 0.3 eV higher. Table 2 also highlights the considerable difference of the fluorescence quantum yield Φ measured in solution between the two molecules, showing a more than six-fold drop when going from Cz-AQ to Cz-BDT. Whereas, the shift in absorption and emission maxima can be explained by the lowering of the LUMO, it is harder to gain understanding of the drop in quantum yield and we will endeavour to study this in detail.To obtain computational reference data, we compute the first ten excited states of Cz-BDT and Cz-AQ at the ri-ADC(2) level in gas phase at the ground state C2 geometries. To show the results of these computations, we use a graphical representation, developed in ref. 30 and 56, that provides compact information about excited energies and characters based on the CT numbers [eqn (2)] and the natural transition orbitals [eqn (3)]. For the CT number analysis, the molecule is first divided into different fragments. In the case of Cz-BDT, these are (i) the Cz donors, (ii) the phenylene (Ph) bridges, (iii) the BDT core, and (iv) the oxygen groups on the core. Using these fragments, we can now decompose the excited states into different contributions as shown in Fig. 4(a). We will consider the following five contributions:
 | ||
| Fig. 4 Analysis of excited states in Cz-BDT at the ri-ADC(2)/def2-TZVP level of theory: (a) Schematic of the fragment based decomposition, (b) excited state energies for singlets in black and triplets in red with oscillator strengths as shading (top) and characters (bottom) of the first ten excited states of Cz-BDT, and (c) natural transition orbitals (NTOs) for selected states. | ||
• Cz → BDT charge transfer (red),
• Ph → BDT charge transfer (green),
• local BDT excitations (blue),
• excitations from the oxygen atoms to BDT indicating nπ* character (orange), and
• excitations within the Cz and Ph units (purple).
These are shown schematically in Fig. 4(a) and a detailed definition of the different contributions is given in Fig. S2 (ESI†). Any excited state is a combination of these elementary contributions in varying weights and we will use bar graphs to represent the composition of the individual states.
The excitation energies for Cz-BDT are presented in the upper panel in Fig. 4(b) showing that this molecule possesses four low-energy triplet states (red) before the first singlet state (black). Viewing the lower panel of Fig. 4(b), we find that T1 is dominated by local ππ* character on the BDT core, represented in blue, with smaller Ph → BDT CT contributions (green). The corresponding NTOs are shown in panel (c) highlighting that the hole NTO (shown in blue/red) is a π-orbital on BDT with some contributions on the Ph bridge whereas the electron NTO (shown in green/orange) is a π*-orbital located right at the centre of BDT resembling the LUMO shown in Fig. 3. Proceeding to the next three triplet states, we find that these are a mixture of local ππ* character on BDT (blue) and nπ* character (orange) with increasing nπ* character from T2 to T4. The first singlet state (S1) lies just above 3.0 eV and is similar in character to T1 albeit with more charge transfer character (red and green). This is also reflected by the dominant hole NTO, shown at the bottom in panel (c), which has extended contributions on the Ph bridges. The vertical gap between T1 and S1 is calculated to be 0.42 eV. The S2 and S3 states are locally excited states dominated by nπ* character. The S4 state lying at 3.28 eV is a CT state which contains significant Cz → BDT character (red). For the T5 and T6 states, we find a mixture of state characters with roughly 40% of the excitation character attributed to local excitations on Ph and Cz.
Reviewing the states in the canonical orbital picture, we find that all states go predominantly into the LUMO, with only the T5 and T6 states also containing significant contributions into higher virtual orbitals (LUMO+1 and LUMO+3). Conversely, the HOMO only plays a minor role for the low energy states and of all the states considered here, only S1 and S4 and none of the triplet states have notable HOMO–LUMO character (62% for S1, 85% for S4). This highlights that a simple visualisation of the HOMO and LUMO can by no means explain the photophysics of complicated TADF systems as studied here.
The oscillator strengths are represented via the colour shading in the upper panel of Fig. 4(b). At the highly symmetric geometry shown, the first bright state is S4 at 3.28 eV, with an oscillator strength of 0.45. The lowest ππ* state, S1 at 3.06 eV, possesses vanishing oscillator strength within the computation. This can be understood by the fact that the analogous state is symmetry forbidden under Ci symmetry and by assuming that similar orbital interactions are also present at the C2 geometry. However, once the symmetry is broken, this state is expected to borrow intensity from the bright state suggesting that this state contributes to the lowest energy band in the absorption spectrum, which is found experimentally at 2.65 eV.
Next, we move to the second molecule studied here, Cz-AQ. As opposed to Cz-BDT where the lowest state was of local ππ* character, we find in the case of Cz-AQ that the first three states (S1, T1, T2) are all of nπ* character (orange). The calculated vertical gap between S1 and T1 is 0.32 eV which is 0.1 eV smaller than found in Cz-BDT. The T3 and T4 states are mixed in character, with mostly local contributions on AQ and smaller amounts of charge transfer from Ph and Cz to the core. The S2 state is an nπ* state. S3 and S4 are both described as charge transfer states with significant Cz → BDT character. Only S4 has an appreciable oscillator strength, which can, again, be understood in terms of symmetry properties. The S4 excitation energy is 3.55 eV which is 0.64 eV higher than the experimentally determined absorption maximum, thus ri-ADC(2) overestimates the energy of the bright state by about 0.5 eV for both Cz-BDT and Cz-AQ. Conversely, ri-ADC(2) is expected to underestimate the energies of nπ* states and CT states by a few tenths of an eV.8,85,86 Nonetheless, we believe that ri-ADC(2) provides a good reference for the expected state characters involved. In particular, these results indicate that all types of states, i.e., local ππ*/nπ* states and CT states, play a role.
Finally, viewing the difference between Fig. 4 and 5, we find that the S1 and T1 states of Cz-BDT have significant locally excited ππ* contributions on BDT whereas S1 and T1 are dominated by nπ* character for Cz-AQ. Proceeding to the higher excited states, we find enhanced CT (red) for Cz-AQ. Thus, we can already anticipate that the photophysics of Cz-AQ will be dominated by its CT states whereas locally excited ππ* contributions are more important for Cz-BDT.
 | ||
| Fig. 5 Analysis of excited states in Cz-AQ at the ri-ADC(2)/def2-TZVP level of theory: (a) excited state energies for singlets in black and triplets in red with oscillator strengths as shading (top) and characters (bottom) of the first ten excited states of Cz-BDT, and (b) natural transition orbitals (NTOs). | ||
Having described the states at the ab initio ri-ADC(2) level, it is of interest whether an approximate density functional can be used with the aim of both saving computational time, and to find a method that matches closer with experimental absorption wavelengths. For this purpose, the first five singlet and triplet states for Cz-BDT and Cz-AQ are calculated using TDDFT with the PBE, PBE0, ωPBEh, CAM-B3LYP and ωB97X-V functionals. Fig. 6 and Fig. S3 (ESI†) contain the results for Cz-BDT and Cz-AQ respectively, with the state characters assigned as explained in Fig. 4(a). The experimental absorption maximum is shown as a dashed orange line. The exciton size (dexc) for the excited state [eqn (6)], an alternative measure for charge transfer,28,29 is shown in the bottom panel. In Fig. 6 the functionals are arranged according to an effective increase in Hartree–Fock exchange from left to right: PBE (0%), PBE0 (25%), ωPBEh (20–100%, ω = 0.1 bohr−1), CAM-B3LYP (19–65%, μ = 0.33 bohr−1) and ωB97X-V (16-100%, ω = 0.3 bohr−1) where the amount of Hartree–Fock exchange (HFX) and the range-separation parameter (ω/μ) are given in parentheses. Overall, with increasing HFX we find that the state energies, vertical singlet–triplet gaps, and the oscillator strengths of bright states increase.
 | ||
| Fig. 6 Analysis of the first five singlet and triplet states of Cz-BDT in C2 symmetry computed using five different functionals (displayed in the top row) in vacuum. Top: Excited-state energies (singlets black, triplets red) along with the experimental absorption maximum as dotted orange line and oscillator strengths shown as shading; middle: excited-state characters; bottom: exciton size dexc. | ||
More strikingly, the middle panel in Fig. 6 reveals the dramatic difference in the state characters obtained with the different functionals. In the case of PBE on the left, the first 8 states are almost entirely of Cz → BDT CT character (red). By contrast, any substantial CT is missing for ωB97X-V on the right. Only the three functionals in the middle contain the mixture of local ππ*/nπ* states and CT states as found for ri-ADC(2). The same trend is also found for the exciton sizes in the lower panel. The first eight states for PBE show enhanced charge separation (dexc > 10 Å) whereas no state with an exciton size above 6 Å is found for ωB97X-V. And, again, more diverse values are found for the functionals in between. The difference in state character is reflected by changes in oscillator strength, shown as shading in the top panel of Fig. 6, which is strongly increased for the functionals with more HFX. These differences highlight the charge transfer problem in TDDFT showing that varying amount of HFX does not only affect the energies13,87 but also excited-state properties.29,88 It is noteworthy, here, that a larger amount of “exact” exchange does not necessarily produce better agreement with higher-level computational methods considering that a reduced amount of exchange corresponds to a physically meaningful screened Coulomb interaction, cf. ref. 5.
We proceed to detailed results for the individual functionals. For PBE we find two sets of four almost degenerate CT states (two singlets and two triplets). These can be understood in the sense that they are composed of independent Cz → BDT transitions on the left and right hand side of the molecule, which are effectively decoupled and neither split via Coulomb nor exchange interactions. The exciton sizes are all above 10 Å, which is similar to the distance from the centre of the Cz donor to the centre of the BDT acceptor highlighting that charge transfer between them dominates with no intermediate locally excited contributions playing a role. Considering the global hybrid PBE0, we still find significant amounts of CT character for the first four states but there is already much more structure when compared to PBE. In particular, it is found that the T1 state has enhanced local character (blue) and an associated reduction in exciton size to 7.1 Å. Moving to ωPBEh, we find that the first four states are triplets of local ππ* and nπ* character. These are followed by three singlet states around 3 eV with a mixture of local ππ* and nπ* as well as CT character. We find two bright states at 3.01 and 3.06 eV, which possess significant amounts of, both, nπ* and CT character. This should be understood in the sense that there is an accidental degeneracy between an nπ* and CT state, producing this mixing. Moving to the remaining two functionals, we find that the first state with appreciable CT character is above 3.5 eV for CAM-B3LYP and no CT state is found at all for ωB97X-V within the energy window considered (up to 4.5 eV).
For Cz-AQ (Fig. S3, ESI†), we find broadly the same story: PBE and PBE0 overestimate the amount of CT character of the lowest lying states and underestimate the energy of the bright state, while ωB97X-V underestimates the CT character and severely overestimates the energy of the bright state. The main differences between ωPBEh and CAM-B3LYP are the energy of the bright singlet CT state, with ωPBEh providing a better value relative to the experimental absorption maximum, and the ordering of the states with respect to the state character. With the ωPBEh functional, we find a similar mixture of local ππ*/nπ* and CT states as for ri-ADC(2). The only difference is that the relative energies of the nπ* states are somewhat raised yielding a different ordering of the dark low-energy states. However, as discussed above, ri-ADC(2) is expected to slightly underestimate nπ* state energies, thus supporting the description by ωPBEh.
For both Cz-BDT and Cz-AQ, the ωPBEh functional gives a vertical excitation energy for the lowest bright state at a value in close proximity to the experimental value (indicated as dotted orange line in Fig. 6 and Fig. S1, ESI†). Here, experience suggests that due to vibronic effects, the vertical excitation should be about 0.1 eV above the experimental maximum,89 therefore indicating excellent agreement of the computed values. Furthermore, ωPBEh succeeds in describing the state characters of the low-energy states involved when compared to the higher-level ri-ADC(2) method and is expected to capture the overall photophysics well. Therefore, we will proceed by using the ωPBEh functional in the further course of the study.
3.3 Excited state minima and solvation
Having described the vertical excitations and identifying ωPBEh as a method for providing the overall excited state characters effectively, we now turn to an analysis of the excited state minimum geometries in solution for Cz-BDT and Cz-AQ. Before proceeding, we aim at fine tuning the range separation parameter ω.90,91 For this purpose, we use the equation | (8) |
 | ||
| Fig. 7 Optimal tuning procedure for the ωPBEh functional applied to Cz-BDT and Cz-Aq in toluene solution (dashed lines) and vacuum (solid lines). | ||
First, the geometries of the S0, S1, and T1 minima are optimised using ωPBEh/def2-SVP within toluene solvation, considering that toluene was used in the experimental studies.4,34 The S1 is always optimised with TDDFT whereas, following ref. 8, 17 and 92, we investigate two possibilities for optimising the T1 minimum, an excited-state optimisation using TDDFT and a formal ground-state optimisation using UKS. The key structural parameters obtained from these optimisations are outlined in Table 3, and the geometries are shown in Fig. 8. For BDT, we find that upon excitation it planarises, i.e. dihedral angles become smaller, that the interring distances become shorter, and that the molecule retains its symmetry. Variations in the Cz-Ph torsion  are relatively minor whereas the
  values become close to zero for S1 and T1. This means that the Ph-BDT-Ph system becomes almost planar after photoexcitation, see also Fig. 8, effectively producing one extended π-system, and we will revisit this point below. For Cz-AQ, on the other hand, we find pronounced symmetry breaking in the TDDFT computations as evidenced by the variations in the two torsion angles (
 and
and  ). Generally speaking, the torsion angles remain at larger absolute values when compared to Cz-BDT. Interestingly, when we perform the optimisation using UKS, no symmetry breaking is observed here.
| Molecule | Geometry | Method |
|
|
|
|
|---|---|---|---|---|---|---|
| Cz-BDT | ||||||
| S0 min | RKS | −54.1 | 1.411 | −14.9 | 1.465 | |
| S1 min | TDDFT | −50.3 | 1.408 | 4.9 | 1.458 | |
| T1 min | TDDFT | −47.9 | 1.402 | 3.3 | 1.446 | |
| T1 min | UKS | −47.9 | 1.402 | 3.3 | 1.445 | |
| Cz-AQ | ||||||
| S0 min | RKS | −54.1 | 1.412 | −31.8 | 1.481 | |
| S1 min | TDDFT | −58.1/−53.6 | 1.418/1.416 | −31.3/−31.0 | 1.483/1.481 | |
| T1 min | TDDFT | −43.9/−58.2 | 1.391/1.416 | 8.2/35.2 | 1.452/1.481 | |
| T1 min | UKS | −48.5 | 1.403 | 20.6 | 1.465 |


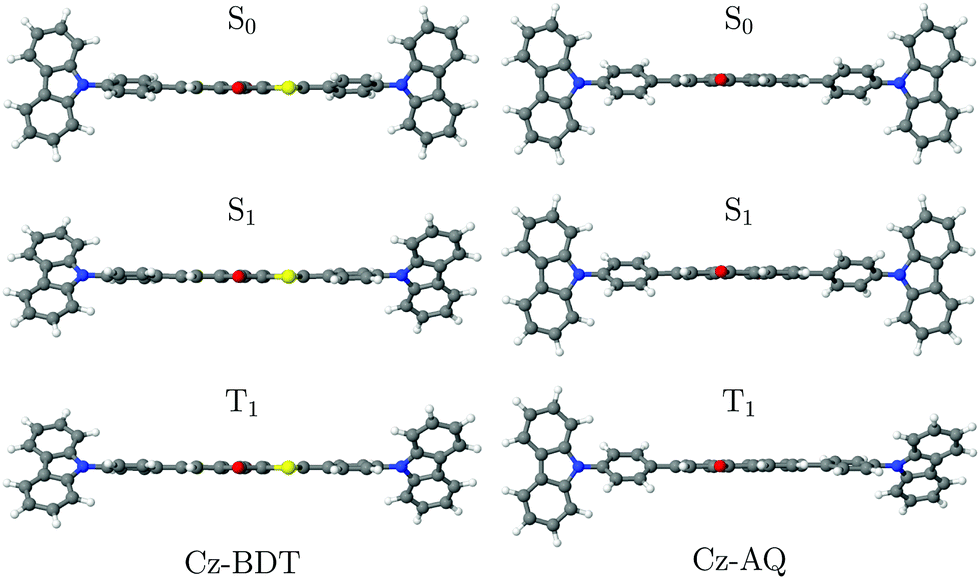 | ||
| Fig. 8 The S0, S1 and T1 minimum geometries of Cz-BDT and Cz-AQ optimised at the ωPBEh/def2-SVP level of theory. | ||
We proceed by discussing the excited states at the individual geometries. For this purpose, we consider two different approaches, the standard LR-PCM method also used for the TDDFT optimisations, as well as a more involved state-specific approach, which is expected to provide an improved description of CT states.18,19 For the vertical absorption (S0), we use the perturbative (ptSS) approach whereas for emission (S1/T1) we use the equilibrated SS-PCM approach. Starting the discussion with Cz-BDT, we present data for the lowest four triplet and three singlet excited states in Fig. 9. The T1 state, located at 1.81 eV, is dominated by local BDT character whereas the next four states (T2, S1, S2, T3) have enhanced CT character (red). These are followed by an nπ* state (T4) and another CT state (S3). Using the ptSS solvation scheme leaves T1 largely unaffected but stabilises the states with more CT character. S1 becomes the bright state, located at only 1.94 eV, which is notably below the experimental absorption maximum of 2.65 eV. We note, here, that an ω value of 0.10 a.u. improves the absorption maximum (predicted at 2.71 eV as shown in Fig. S4, ESI†) but it does so at the cost of producing an unreasonably large singlet–triplet gap (see below).
 | ||
| Fig. 9 Analysis of the lowest singlet and triplet states of Cz-BDT at the S0, T1 and S1 minimum geometries: Adiabatic energies and oscillator strengths (top), excited-state characters (middle), and charge transfer measures (dexc, dhe, bottom). The excited-state solvation model and method for computing the geometry are given in the top two lines, always in connection with the ωPBEh/def2-SVP level of theory. | ||
Next, we proceed to the optimised minimum of the S1 state. The S1 energy is found at an adiabatic energy of 1.99 and 1.83 eV using LR-PCM and SS-PCM, respectively. The obtained emission energy is 1.71 eV, which is in reasonable agreement with the experimental value of 1.87 eV.34 The S1 state at the optimised geometry has a similar character to the vertical excitation, i.e. mixed local and CT, only that the exciton size dexc of 9.65 Å (SS-PCM) is slightly reduced when compared to the ground state geometry (10.37 Å). The S1 state retains the formal gerade symmetry present at the S0 geometry and, therefore, has vanishing oscillator strength. An optically dark S1 minimum with only partial CT character certainly runs counter to the initial design strategy of using a D–π–A–π–D system and may well explain the poor performance of Cz-BDT in TADF applications.
Proceeding to T1, we compare data using three different methods: TDDFT/LR-PCM and TDDFT/SS-PCM at the TDDFT/LR-PCM geometry, as well as TDDFT/SS-PCM at the UKS/PCM T1 geometry. We find that optimisation of T1 leads to a notable stabilisation of T1 obtaining adiabatic T1 energies between 1.33 and 1.59 eV for the three methods. In all cases, the rather local character is retained obtaining exciton sizes just above 6 Å.
Results for geometry optimisations of the individual states for Cz-AQ are presented in (Fig. 10). At the S0 minimum, we find similar state characters as for BDT only that CT character is enhanced (as seen by more pronounced red bars in the middle panel and larger exciton sizes in the lower panel). The bright S2 state is found at 2.44 eV, which is again notably lower than the experimental maximum of 2.91 eV. The ptSS solvation scheme is, again, found to strongly affect the CT states. On the other hand, the triplet nπ* state (T3) is almost unaffected by the solvation. Viewing the other panels in Fig. 10, one finds that the energies but also other properties of the different states are quite strongly affected by the different geometries and solvation schemes. Crucially, we find for the TDDFT optimised S1 geometry that the S1 state becomes bright and has a significant amount of charge transfer character (red) along with an enhanced exciton size of 10.39 Å (SS-PCM). We propose to interpret this phenomenon in the context of excited-state symmetry breaking:12,93 The S1 state is Laporte forbidden at the ground state geometry due to its approximate inversion symmetry but this restriction is lifted once the symmetry is broken in the excited state as one half of the molecule planarises (see Table 3). To represent the symmetry breaking, we use the linear electron–hole separation (dhe, eqn (7)). This value vanishes for symmetric charge transfer systems but approaches the value of dexc in the idealised case where charge is transferred from one donor to one acceptor, both represented as a point charge.27 As expected, dhe is zero for the symmetric S0-optimised geometries. In the case of S1, by contrast, we find that for all the ππ* states dhe differs strongly from zero reaching almost the value of dexc. This highlights that symmetry breaking of the geometry does indeed also localise the excited states.
 | ||
| Fig. 10 Analysis of the lowest singlet and triplet states of Cz-AQ at the S0, T1 and S1 minimum geometries: Adiabatic energies and oscillator strengths (top), excited-state characters (middle), and charge transfer measures (dexc, dhe, bottom). The excited-state solvation model and method for computing the geometry are given in the top two lines, always in connection with the ωPBEh/def2-SVP level of theory. | ||
The T1 state at the T1 geometry has enhanced local character (blue, green) and a reduced exciton size (<8 Å) when compared to S1 at the S1 geometry considering all three levels of theory considered. Nonetheless, pronounced symmetry-breaking occurs, which is reflected by the brightness of the S1 state and the non-vanishing dhe values.
Reviewing Fig. 9 and 10, we find adiabatic singlet triplet gaps of 0.36 eV and 0.11 eV for Cz-BDT and Cz-AQ, respectively, highlighting the suitability for TADF of the latter. Furthermore, a clear difference is observed in terms of excited-state character of the optimised S1 state. This state remains dark for Cz-BDT whereas it becomes a bright symmetry-broken CT state for Cz-AQ. The enhanced optical brightness is certainly beneficial for luminescence while also enhanced CT agrees with the underlying design strategy.
3.4 Outlook – Cz-BDT-SO2 and Cz-BDF
Having provided a detailed analysis of Cz-BDT and Cz-AQ, we will now proceed to two additional molecules, alluded to briefly in the introduction and shown in Fig. 1: (i) Cz-BDT-SO2 containing an oxidised derivative of the BDT acceptor, with two oxygen atoms bound to each sulfur atom; and (ii) Cz-BDF, the benzodifuran derivative of BDT, where the sulfur atoms are replaced with oxygen atoms. As opposed to Cz-BDT and Cz-AQ, which have been synthesised and well-characterised, these two molecules have not yet been synthesised.The geometric parameters for Cz-BDT-SO2 and Cz-BDF, obtained in analogy to Table 3, are listed in Table 4. Starting with the S0 state of Cz-BDT-SO2, we find that its Cz/Ph torsion angles  are similar to the previous two molecules whereas the core/Ph torsion angles
  are significantly reduced indicating that the central Ph–core–Ph system is almost planar. Excitation into S1 induces pronounced symmetry breaking with one of the Cz-core angles (θ1) almost reaching 90°. In addition, the
  angles are slightly increased, which is the opposite trend to what was seen for Cz-BDT. Excitation into T1 only causes minor alterations in the geometry. Proceeding to Cz-BDF, we find that this molecule stays symmetric and fairly rigid in all states considered possessing a largely planar central Ph–core–Ph system. Finally, it is interesting to note that for all four molecules in this work, the bond distances change with the twisting angles. An increase/decrease in θ leads to an increase/decrease in d showing that the effect of enhanced conjugation produced by a smaller torsion angle also affects the bond distances.
| Molecule | Geometry | Method |
|
|
|
|
|---|---|---|---|---|---|---|
| Cz-BDT-SO 2 | ||||||
| S0 min | RKS | −48.6 | 1.402 | 4.1/4.0 | 1.445 | |
| S1 min | TDDFT | −89.3/−56.5 | 1.435/1.415 | 15.4/16.9 | 1.462/1.459 | |
| T1 min | TDDFT | −47.9/−48.0 | 1.401/1.402 | 4.1/4.0 | 1.443/1.444 | |
| Cz-BDF | ||||||
| S0 min | RKS | −54.3 | 1.411 | −2.8 | 1.455 | |
| S1 min | TDDFT | −49.5 | 1.407 | 4.1 | 1.448 | |
| T1 min | TDDFT | −47.7 | 1.402 | 3.2 | 1.438 |


An analysis of the excited states of Cz-BDT-SO2 and Cz-BDF at their S0, S1, and T1 optimised geometries in solution is presented in Fig. 11. The data shown is analogous to Fig. 9 and 10 with the exception that we only present results using the higher-level state-specific solvation models here. Starting with Cz-BDT-SO2, shown on the left in Fig. 11, we find that the excitation energies are significantly reduced when compared to Cz-BDT with all seven calculated excited states at or below 1.5 eV in the ptSS scheme at S0 geometry. All states possess notable amounts of CT character (red bars) and exciton sizes above 8.0 Å, their CT character slightly enhanced when compared to Cz-BDT. The S1 is found to be a CT state with predominant Cz → core contributions located at 1.21 eV possessing an oscillator strength of 0.553. The following three states (T3, S2, S3) are found to possess almost pure Cz → core character (red). These latter states show clear symmetry breaking as indicated by the dhe values in the lower panel despite the near symmetric structure of the molecule.
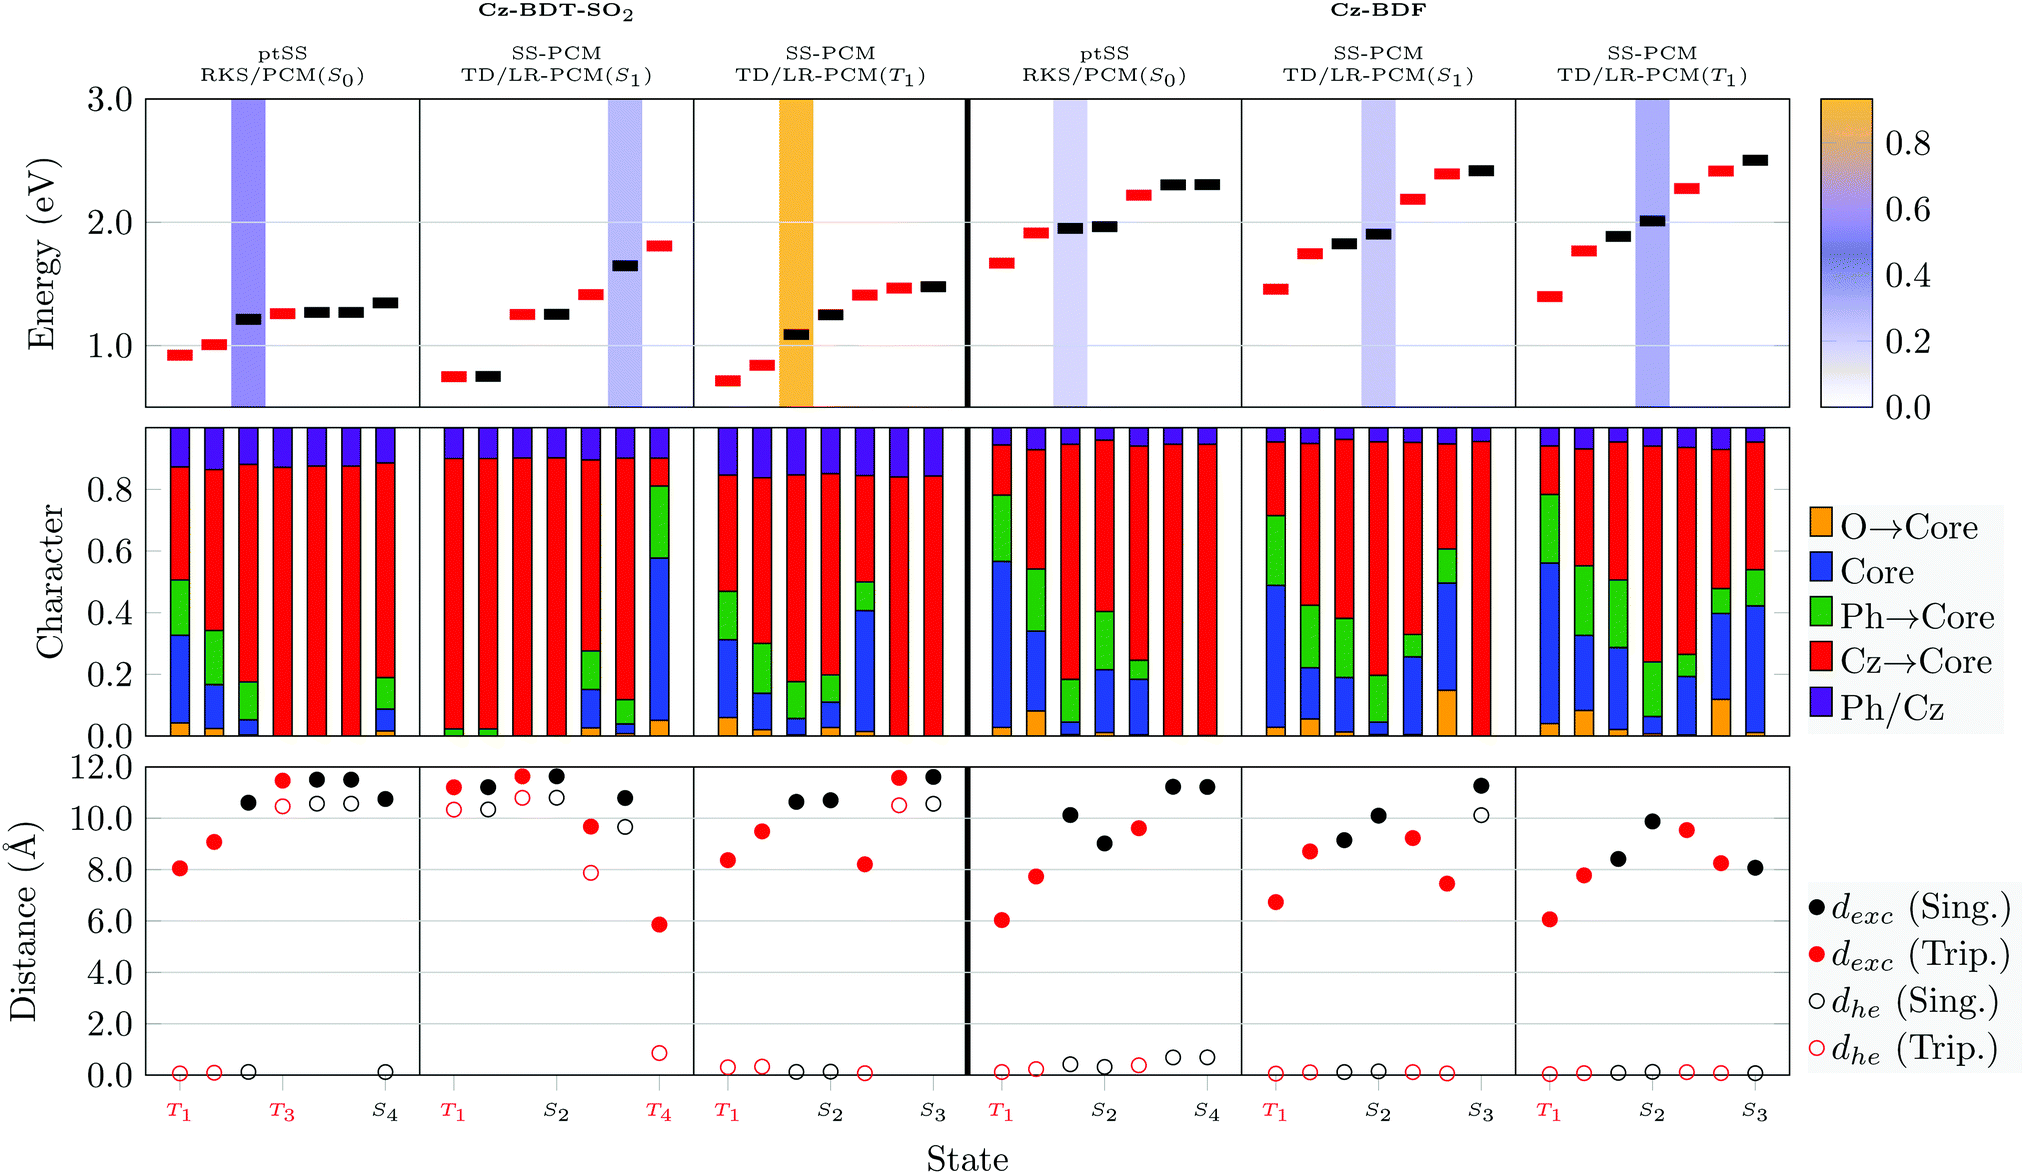 | ||
| Fig. 11 Analysis of the lowest singlet and triplet states of Cz-BDT-SO2 (left) and Cz-BDF (right) at the S0, T1 and S1 minimum geometries: adiabatic energies and oscillator strengths (top), excited-state characters (middle), and charge transfer measures (dexc, dhe, bottom). | ||
Optimisation of Cz-BDT-SO2 in the S1 state strongly stabilises the CT states. The S1 and T1 are both of almost pure Cz → core character and almost degenerate. The vertical emission energy from these computations (ω = 0.04 a.u.) comes out at 0.44 eV whereas the emission energy for ω = 0.10 a.u. is 1.41 eV. Optimisation of T1 produces a more local T1 lying at almost the same energy as T1 and S1 at the S1-geometry. More generally, the lower lying states have a similar appearance to the S0-minimum with mixed local and CT character.
The excited states of Cz-BDF (Fig. 11, right) bear resemblance to those of Cz-BDT (Fig. 9). At the S0 geometry two mixed local/CT triplet states are found before S1, which is dominated by CT character and bright. S1 is found at 1.95 eV, which is almost equivalent to Cz-BDT. All remaining states are dominated by CT character (red) and possess exciton sizes above 8 Å. Optimisation of S1 slightly lowers its adiabatic energy (from 1.95 eV to 1.83 eV) yielding an emission energy of 1.69 eV. The S1 and S2 states remain almost degenerate only that S2 becomes the bright state, here. Optimisation of T1 slightly stabilises the energy of this state inducing an adiabatic singlet–triplet gap of 0.43 eV. Otherwise, the states remain largely unaffected.
4 Discussion
Before concluding, we want to summarise and discuss the results, presented above, in the context of three specific issues: (i) the overall photophysics of the molecules studied, (ii) general differences in singlet and triplet state wavefunctions and their relevance in terms of photophysics and computational modelling, and (iii) further methodological aspects concerned with the density functionals and solvation models used.4.1 Summary of the photophysics
A summary of the key photophysical data for the four molecules is presented in Table 5. Here, we consider our highest level results, i.e., absorption energies at the TDDFT/ptSS level and emission energies using TDDFT/SS-PCM all with the ωPBEh functional. Two different values for the range-separation parameter ω are contrasted: (i) a value of ω = 0.040 a.u., the optimal value in solution and used for the above discussion, and (ii) a value of ω = 0.100 a.u., which is about the average between the values optimised for solution and gas phase (cf.Fig. 7). We find that an ω value of 0.100 a.u. works well in reproducing the absorption maxima of Cz-BDT and Cz-AQ whereas their energies are underestimated for ω = 0.040 a.u. Also the emission maxima of both molecules are reproduced more accurately with ω = 0.100 a.u. On the other hand, this larger ω value produces an unreasonably large adiabatic singlet–triplet gap (ΔEST,ad.), above 0.5 eV, which would render TADF almost impossible. Literature values for ΔEST,ad. are not available for any of the molecules studied here but, using the data from ref. 4, we can estimate the adiabatic gap of Cz-AQ to be about 0.1–0.2 eV, which is well reproduced with the lower ω value. In addition, we find that experimental oscillator strength for absorption (fabs = 0.19) is accurately reproduced with ω = 0.040 whereas about twice this value is obtained with ω = 0.100. Note, that the same trend of increasing oscillator strength with the amount of HFX is also seen in Fig. 6.| E abs,max (eV) | f abs | E em,max (eV) | f em | Φ | ΔEST,vert. (eV) | ΔEST,ad. (eV) | |
|---|---|---|---|---|---|---|---|
| a Ref. 34, measured in toluene. b Ref. 4, measured in toluene. c Estimated from data in ref. 4. | |||||||
| Cz-BDT (ω = 0.040) | 1.94 | 0.181 | 1.71 | 0.000 | — | 0.19 | 0.36 |
| Cz-BDT (ω = 0.100) | 2.71 | 0.478 | 2.06 | 0.000 | — | 0.54 | 0.58 |
| Cz-BDT (exp.)a | 2.65 | — | 1.87 | — | 0.095 | — | — |
| Cz-AQ (ω = 0.040) | 2.14 | 0.184 | 1.86 | 0.106 | — | 0.02 | 0.11 |
| Cz-AQ (ω = 0.100) | 2.97 | 0.453 | 2.49 | 0.340 | — | 0.35 | 0.49 |
| Cz-AQ (exp.)b | 2.91 | 0.19 | 2.22 | — | 0.60 | — | 0.1–0.2c |
| Cz-BDT-SO2 (ω = 0.040) | 1.21 | 0.553 | 0.44 | 0.000 | — | 0.29 | 0.04 |
| Cz-BDT-SO2 (ω = 0.100) | 1.73 | 0.684 | 1.41 | 0.511 | — | 0.51 | 0.63 |
| Cz-BDF (ω = 0.040) | 1.95 | 0.151 | 1.69 | 0.000 | — | 0.28 | 0.43 |
| Cz-BDF (ω = 0.100) | 2.73 | 0.419 | 1.99 | 0.000 | — | 0.60 | 0.63 |
Independently of the value of ω, we find two crucial differences between Cz-BDT and Cz-AQ, which explain its lower TADF efficiency. First, the larger singlet–triplet gap of Cz-BDT (considering vertical and adiabatic values) will hamper repopulation of S1. Second, the vanishing oscillator strength for emission (fem) of Cz-BDT will slow down emission from S1 even if it is populated. Conversely, Cz-AQ obtains a strongly emissive S1 state due to symmetry breaking.
Considering all four molecules studied, the absorption energies are arranged as Cz-AQ > Cz-BDF ≈ Cz-BDT ≫ Cz-BDT-SO2 reflecting the different acceptor properties of the cores used. Cz-BDF is not expected to be a suitable TADF chromophore due to its similar properties to Cz-BDT, i.e. large singlet–triplet gap and vanishing oscillator strength for emission. The conclusion is not so clear for Cz-BDT-SO2 due to the strong discrepancy between the results using the two ω values.
Reviewing Fig. 10, we can speculate that, aside from its lower singlet–triplet gap, Cz-AQ also profits from a high density of states connecting the T1 and S1 states (see also ref. 11). In addition, the presence of nπ* states in this area is expected to mediate SOC efficiently. The presence of a number of different excited states with varying properties, as found here, is certainly consistent with the rich photophysics measured experimentally for a related D–AQ–D molecules.94,95
4.2 Differences between singlet and triplet states
A striking observation made in the above plots relates to the differences in excited state character found between singlet and triplet states. It is tempting to think of singlet and triplet excited states as involving the same orbital transitions, only differing in their spin coupling. However, the above results show that this picture is oversimplified for realistic push–pull systems. Specifically, we find that low energy triplet states have enhanced local character whereas CT is enhanced for the singlets. This is reflected in all the bar graphs shown in the centre panels of Fig. 9–11 with enhanced blue and orange bars for the triplets and more red/green for the singlets. The difference is even more apparent in terms of the exciton sizes (bottom panels of Fig. 9–11) showing that the triplet states (red dots) are consistently below the singlet states (black dots).Differences between singlet and triplet states can be understood by considering the different contributing energy terms.1,5,7,33 Singlet and triplet states are both affected by an attractive Coulomb interaction favouring locally excited states while singlets are also affected by a repulsive exchange interaction favouring CT states.5 The effect on exchange for triplet energies is a bit more ambiguous and depends on the reference chosen. If one considers the Kohn–Sham orbital energies as reference, then one finds that triplets are independent of any exchange contribution.5 However, if one further considers that the LUMO energy is lowered by the exchange interaction between HOMO and LUMO, then one finds that triplet energies are indeed stabilised by this exchange interaction.7 Independently of this discussion one finds that low-energy triplets should be more localised, which is well represented by the data shown. Furthermore, the above plots highlight the differences between singlet and triplet states, which cannot be explained by simply reordering the states without also mixing them. Clearly, there is no one-to-one correspondence between the singlet and triplet states.
These differences are important for at least three reasons. First, it should be understood that the photophysics of these molecules cannot be understood in terms of a simplified picture containing only two or three MOs but that a number of terms ultimately influence the final energies of the states. In this context, it has been pointed out, before, that the idealised picture where singlets and triplets differ by twice the exchange energy would only hold if their wavefunctions were the same except for the spin coupling.96 Discussions of how to go beyond this and understand singlet–triplet gaps within and beyond the orbital picture are provided in ref. 5 and 33. Second, the discussion shows that the available space for molecular design is larger than one would anticipate viewing only two or three MOs. Indeed, there are a large number of terms that can potentially be fine-tuned to optimise the overall photophysics. Third, differences in the wavefunctions of singlet and triplet states explain why singlets and triplets differ strongly in their computational description using, e.g., TDDFT69,97 or the Bethe–Salpeter equation.98 Being aware of these differences may help in the development of computational methods that provide a balanced and accurate description of singlets and triplets.
4.3 Methodological aspects
Reviewing the computations within this manuscript we found that the density functional used, and in particular the amount of non-local HFX, plays a critical role. As shown in Fig. 6 and Table 5 increasing the amount of HFX has four critical consequences: (i) raising the overall excitation energies, (ii) widening ΔEST, (iii) reducing CT character, and (iv) increasing oscillator strengths. This illustrates how a change in density functional does not only shift excitation energies but potentially affects many different aspects of the predicted photophysics. Table 5 highlights the challenges in finding a method that describes all aspects correctly: using an ω value of 0.100 improves absorption and emission energies whereas a value of 0.040 gives better singlet triplet gaps and oscillator strengths.Furthermore, we found that geometry optimisation in the excited state was critical for two individual effects. First, it allowed for adjustments in the torsion angles altering delocalisation and CT for the individual states. Second, it was seen as the basis for excited state symmetry breaking yielding a strongly emissive state for Cz-AQ whereas for Cz-BDT the S1 state remained dark at its symmetric minimum.
Solvation effects were considered using three different approaches: the LR-PCM and SS-PCM methods in connection with TDDFT as well as ground-state PCM in connection with UKS. It was found that the different solvation models produced different excitation energies, especially in terms of a stabilisation of CT states. However, differences between these solvation models were comparatively small suggesting that the choice of solvation model is not as critical as the choice of density functional and an appropriate treatment of geometry relaxation, at least for weakly polar solvents.
5 Conclusions
Within this work, we have presented a detailed study of four closely related D–π–A–π–D molecules: the effective TADF chromophore Cz-AQ, its close analogue Cz-BDT, which undergoes red-shifted TADF albeit with a much lower quantum yield, and two molecules not yet synthesised Cz-BDT-SO2 and Cz-BDF. After presenting the main structural parameters, we have presented a detailed evaluation of computational methods benchmarking five density functionals to experimental absorption data and the high-level ab initio computational reference ri-ADC(2). This highlighted that not only the energies but also the overall wavefunctions depend heavily on the functional used and particularly the amount of Hartree–Fock exchange. Increased HFX was found to raise the computed absorption and emission energies, singlet–triplet gaps, and oscillator strengths; we have highlighted the challenges of producing accurate results for all four values simultaneously.Using the ωPBEh functional, which was shown to represent energies and wavefunctions accurately, we have studied excited-state minima in solution. The Cz-AQ and Cz-BDT molecules were shown to not only differ in terms of their singlet–triplet gaps but we also highlighted the importance of planarisation and excited-state symmetry breaking leading to markedly different photophysics between the molecules despite their similar molecular structures. In addition, we have related the strong TADF activity of Cz-AQ to the existence of a strongly emissive symmetry broken S1 minimum with CT character whereas Cz-BDT formed a dark locally excited S1 minimum. Moreover, Cz-AQ was characterised by a dense set of states of different character connecting the T1 and S1 states providing a pathway between them.
In a more general sense, we showed that a detailed analysis of excited-state wavefunctions can provide insight into the photophysics of push–pull systems far beyond a simple analysis of energies and frontier orbitals. General differences between singlet and triplet states have been outlined with triplets being more compact and local whereas enhanced CT was found for singlets. We believe that the presented protocol will be valuable for studying various push–pull systems in the future providing detailed insight into the properties of existing chromophores and providing new design ideas for the future.
Conflicts of interest
There are no conflicts to declare.Acknowledgements
We acknowledge the Lovelace high-performance computing cluster at Loughborough University. PK acknowledges Loughborough University for a university studentship. FP and IAW acknowledge support from the EPSRC (EP/V048686/1 and EP/T028688/1).References
- F. B. Dias, T. J. Penfold and A. P. Monkman, Methods Appl. Fluoresc., 2017, 5, 012001 CrossRef PubMed.
- Z. Yang, Z. Mao, Z. Xie, Y. Zhang, S. Liu, J. Zhao, J. Xu, Z. Chi and M. P. Aldred, Chem. Soc. Rev., 2017, 46, 915–1016 RSC.
- M. Godumala, S. Choi, M. J. Cho and D. H. Choi, J. Mater. Chem. C, 2019, 7, 2172–2198 RSC.
- Q. Zhang, H. Kuwabara, W. J. Potscavage, S. Huang, Y. Hatae, T. Shibata and C. Adachi, J. Am. Chem. Soc., 2014, 136, 18070–18081 CrossRef CAS PubMed.
- P. Kimber and F. Plasser, Phys. Chem. Chem. Phys., 2020, 22, 6058–6080 RSC.
- P. K. Samanta, D. Kim, V. Coropceanu and J.-L. Brédas, J. Am. Chem. Soc., 2017, 139, 4042–4051 CrossRef CAS PubMed.
- X. K. Chen, D. Kim and J. L. Brédas, Acc. Chem. Res., 2018, 51, 2215–2224 CrossRef CAS PubMed.
- J. M. Mewes, Phys. Chem. Chem. Phys., 2018, 20, 12454–12469 RSC.
- J. Gibson, A. P. Monkman and T. J. Penfold, ChemPhysChem, 2016, 17, 2956–2961 CrossRef CAS PubMed.
- A. Y. Freidzon and A. A. Bagaturyants, J. Phys. Chem. A, 2020, 124, 7927–7934 CrossRef CAS PubMed.
- J. Eng, J. Hagon and T. J. Penfold, J. Mater. Chem. C, 2019, 7, 12942–12952 RSC.
- B. Dereka, D. Svechkarev, A. Rosspeintner, A. Aster, M. Lunzer, R. Liska, A. M. Mohs and E. Vauthey, Nat. Commun., 2020, 11, 1–11 Search PubMed.
- A. Dreuw, J. L. Weisman and M. Head-Gordon, J. Chem. Phys., 2003, 119, 2943–2946 CrossRef CAS.
- S. A. Mewes, F. Plasser, A. Krylov and A. Dreuw, J. Chem. Theory Comput., 2018, 14, 710–725 CrossRef CAS PubMed.
- S. Huang, Q. Zhang, Y. Shiota, T. Nakagawa, K. Kuwabara, K. Yoshizawa and C. Adachi, J. Chem. Theory Comput., 2013, 9, 3872–3877 CrossRef CAS PubMed.
- J. Shee and M. Head-Gordon, J. Chem. Theory Comput., 2020, 16, 6244–6255 CrossRef CAS PubMed.
- L. Kunze, A. Hansen, S. Grimme and J.-M. Mewes, J. Phys. Chem. Lett., 2021, 12, 8470–8480 CrossRef CAS PubMed.
- R. Improta, V. Barone, G. Scalmani and M. J. Frisch, J. Chem. Phys., 2006, 125, 054103 CrossRef PubMed.
- J. M. Mewes, Z. Q. You, M. Wormit, T. Kriesche, J. M. Herbert and A. Dreuw, J. Phys. Chem. A, 2015, 119, 5446–5464 CrossRef CAS PubMed.
- Y. Olivier, B. Yurash, L. Muccioli, G. D'Avino, O. Mikhnenko, J. C. Sancho-García, C. Adachi, T.-Q. Nguyen and D. Beljonne, Phys. Rev. Mater., 2017, 1, 075602 CrossRef.
- T. J. Penfold, F. B. Dias and A. P. Monkman, Chem. Commun., 2018, 54, 3926–3935 RSC.
- A. V. Luzanov, A. A. Sukhorukov and V. E. Umanskii, Theor. Exp. Chem., 1976, 10, 354–361 CrossRef.
- M. J. G. Peach, P. Benfield, T. Helgaker and D. J. Tozer, J. Chem. Phys., 2008, 128, 044118 CrossRef PubMed.
- C. A. Guido, P. Cortona and C. Adamo, J. Chem. Phys., 2014, 140, 104101 CrossRef PubMed.
- T. Etienne, X. Assfeld and A. Monari, J. Chem. Theory Comput., 2014, 10, 3896–3905 CrossRef CAS PubMed.
- P. Petelenz and B. Pac, J. Am. Chem. Soc., 2013, 135, 17379–17386 CrossRef CAS PubMed.
- F. Plasser, B. Thomitzni, S. A. Bäppler, J. Wenzel, D. R. Rehn, M. Wormit and A. Dreuw, J. Comput. Chem., 2015, 36, 1609–1620 CrossRef CAS PubMed.
- S. A. Bäppler, F. Plasser, M. Wormit and A. Dreuw, Phys. Rev. A: At., Mol., Opt. Phys., 2014, 90, 052521 CrossRef.
- S. A. Mewes, F. Plasser and A. Dreuw, J. Phys. Chem. Lett., 2017, 8, 1205–1210 CrossRef CAS PubMed.
- S. Mai, F. Plasser, J. Dorn, M. Fumanal, C. Daniel and L. González, Coord. Chem. Rev., 2018, 361, 74–97 CrossRef CAS.
- F. Glöcklhofer, A. Rosspeintner, P. Pasitsuparoad, S. Eder, J. Fröhlich, G. Angulo, E. Vauthey and F. Plasser, Mol. Syst. Des. Eng., 2019, 4, 951–961 RSC.
- Z. Pei, J. Yang, J. Deng, Y. Mao, Q. Wu, Z. Yang, B. Wang, C. M. Aikens, W. Liang and Y. Shao, Phys. Chem. Chem. Phys., 2020, 22, 26852–26864 RSC.
- Z. Pei, Q. Ou, Y. Mao, J. Yang, A. de la Lande, F. Plasser, W. Liang, Z. Shuai and Y. Shao, J. Phys. Chem. Lett., 2021, 12, 2712–2720 CrossRef CAS PubMed.
- S. Montanaro, A. J. Gillett, S. Feldmann, E. W. Evans, F. Plasser, R. H. Friend and I. A. Wright, Phys. Chem. Chem. Phys., 2019, 21, 10580–10586 RSC.
- L. Ye, S. Zhang, W. Zhao, H. Yao and J. Hou, Chem. Mater., 2014, 26, 3603–3605 CrossRef CAS.
- L. Ye, X. Jiao, H. Zhang, S. Li, H. Yao, H. Ade and J. Hou, Macromolecules, 2015, 48, 7156–7163 CrossRef CAS.
- D. Patra, W. Budiawan, T. Y. Huang, K. H. Wei, P. C. Wang, K. C. Ho, M. Al-Hashimi and C. W. Chu, ACS Appl. Energy Mater., 2018, 1, 3684–3692 CrossRef CAS.
- G. Huang, H. Jiang, J. Zhang, F. Liu, M. Zhu, H. Tan, Y. Wang, W. Chen, R. Yang and W. Zhu, ACS Appl. Energy Mater., 2018, 1, 1506–1511 CrossRef CAS.
- T. Nakamura, Macromolecules, 2020, 53, 9836–9846 CrossRef CAS.
- T. J. Aldrich, W. Zhu, S. Mukherjee, L. J. Richter, E. Gann, D. M. DeLongchamp, A. Facchetti, F. S. Melkonyan and T. J. Marks, Chem. Mater., 2019, 31, 4313–4321 CrossRef CAS.
- T. J. Aldrich, A. S. Dudnik, N. D. Eastham, E. F. Manley, L. X. Chen, R. P. Chang, F. S. Melkonyan, A. Facchetti and T. J. Marks, Macromolecules, 2018, 51, 9140–9155 CrossRef CAS.
- K. Kobayashi, C. L. Gajurel, K. Umemoto and Y. Mazaki, Bull. Chem. Soc. Jpn., 1992, 65, 2168–2172 CrossRef CAS.
- S. Yamaguchi, H. Tatemitsu, Y. Sakata and S. Misumi, Chem. Lett., 1983, 1229–1230 CrossRef CAS.
- J. H. Kim, J. H. Yun and J. Y. Lee, Adv. Opt. Mater., 2018, 6, 1800255 CrossRef.
- C. J. Christopherson, D. M. Mayder, J. Poisson, N. R. Paisley, C. M. Tonge and Z. M. Hudson, ACS Appl. Mater. Interfaces, 2020, 12, 20000–20011 CrossRef CAS PubMed.
- D. G. Congrave, B. H. Drummond, P. J. Conaghan, H. Francis, S. T. Jones, C. P. Grey, N. C. Greenham, D. Credgington and H. Bronstein, J. Am. Chem. Soc., 2019, 141, 18390–18394 CrossRef CAS PubMed.
- J. Chen, W. Tao, W. Chen, Y. Xiao, K. Wang, C. Cao, J. Yu, S. Li, F. Geng, C. Adachi, C. Lee and X. Zhang, Angew. Chem., Int. Ed., 2019, 58, 14660–14665 CrossRef CAS PubMed.
- X. Gong, P. Li, Y. Huang, C. Wang, C. Lu, W. Lee, C. Zhong, Z. Chen, W. Ning, C. Wu, S. Gong and C. Yang, Adv. Funct. Mater., 2020, 30, 1908839 CrossRef CAS.
- E. Avellanal-Zaballa, A. Prieto-Castaneda, F. Garcia-Garrido, A. R. Agarrabeitia, E. Rebollar, J. Banuelos, I. Garcia-Moreno and M. J. Ortiz, Chem. – Eur. J., 2020, 26, 16080–16088 CrossRef CAS PubMed.
- T. Yang, Z. Cheng, Z. Li, J. Liang, Y. Xu, C. Li and Y. Wang, Adv. Funct. Mater., 2020, 30, 2002681 CrossRef CAS.
- B. Zhao, H. Wang, C. Han, P. Ma, Z. Li, P. Chang and H. Xu, Angew. Chem., Int. Ed., 2020, 59, 19042–19047 CrossRef CAS PubMed.
- P. Kautny, F. Glöcklhofer, T. Kader, J.-M. Mewes, B. Stöger, J. Fröhlich, D. Lumpi and F. Plasser, Phys. Chem. Chem. Phys., 2017, 19, 18055–18067 RSC.
- S. Zhen, S. Wang, S. Li, W. Luo, M. Gao, L. G. Ng, C. C. Goh, A. Qin, Z. Zhao, B. Liu and B. Z. Tang, Adv. Funct. Mater., 2018, 28, 1706945 CrossRef.
- E. Varathan and V. Subramanian, Phys. Chem. Chem. Phys., 2017, 19, 12002–12012 RSC.
- E. Varathan and A. Patnaik, J. Phys. Chem. A, 2019, 123, 8755–8765 CrossRef CAS PubMed.
- F. Plasser, J. Chem. Phys., 2020, 152, 084108 CrossRef CAS PubMed.
- F. Plasser, M. Wormit and A. Dreuw, J. Chem. Phys., 2014, 141, 024106 CrossRef PubMed.
- F. Plasser and H. Lischka, J. Chem. Theory Comput., 2012, 8, 2777–2789 CrossRef CAS PubMed.
- R. L. Martin, J. Chem. Phys., 2003, 118, 4775–4777 CrossRef CAS.
- F. Plasser, A. J. Aquino, W. L. Hase and H. Lischka, J. Phys. Chem. A, 2012, 116, 11151–11160 CrossRef CAS PubMed.
- S. Rupp, F. Plasser and V. Krewald, Eur. J. Inorg. Chem., 2020, 1506–1518 CrossRef CAS.
- P. A. Sánchez-Murcia, J. J. Nogueira, F. Plasser and L. González, Chem. Sci., 2020, 11, 7685–7693 RSC.
- S. Yang, D. Streater, C. Fiankor, J. Zhang and J. Huang, J. Am. Chem. Soc., 2021, 143, 1061–1068 CrossRef CAS PubMed.
- N. Mardirossian and M. Head-Gordon, Phys. Chem. Chem. Phys., 2014, 16, 9904–9924 RSC.
- F. Weigend and R. Ahlrichs, Phys. Chem. Chem. Phys., 2005, 7, 3297–3305 RSC.
- C. Hättig, Adv. Quantum Chem., 2005, 50, 37–60 CrossRef.
- A. Schäfer, C. Huber and R. Ahlrichs, J. Chem. Phys., 1994, 100, 5829–5835 CrossRef.
- S. Hirata and M. Head-Gordon, Chem. Phys. Lett., 1999, 314, 291–299 CrossRef CAS.
- M. J. Peach, M. J. Williamson and D. J. Tozer, J. Chem. Theory Comput., 2011, 7, 3578–3585 CrossRef CAS PubMed.
- J. P. Perdew, K. Burke and M. Ernzerhof, Phys. Rev. Lett., 1996, 77, 3865–3868 CrossRef CAS PubMed.
- C. Adamo and V. Barone, J. Chem. Phys., 1999, 110, 6158–6170 CrossRef CAS.
- M. A. Rohrdanz, K. M. Martins and J. M. Herbert, J. Chem. Phys., 2009, 130, 054112 CrossRef PubMed.
- T. Yanai, D. P. Tew and N. C. Handy, Chem. Phys. Lett., 2004, 393, 51–57 CrossRef CAS.
- A. D. Becke, J. Chem. Phys., 1993, 98, 5648–5652 CrossRef CAS.
- C. Lee, W. Yang and R. G. Parr, Phys. Rev. B: Condens. Matter Mater. Phys., 1988, 37, 785–789 CrossRef CAS PubMed.
- V. Barone and M. Cossi, J. Phys. Chem. A, 1998, 102, 1995–2001 CrossRef CAS.
- M. Cossi, N. Rega, G. Scalmani and V. Barone, J. Comput. Chem., 2003, 24, 669–681 CrossRef CAS PubMed.
- R. Cammi and B. Mennucci, J. Chem. Phys., 1999, 110, 9877–9886 CrossRef CAS.
- M. Cossi and V. Barone, J. Chem. Phys., 2001, 115, 4708–4717 CrossRef CAS.
- Z. Q. You, J. M. Mewes, A. Dreuw and J. M. Herbert, J. Chem. Phys., 2015, 143, 204104 CrossRef PubMed.
- J. M. Mewes, J. M. Herbert and A. Dreuw, Phys. Chem. Chem. Phys., 2017, 19, 1644–1654 RSC.
- E. Epifanovsky, et al. , J. Chem. Phys., 2021, 155, 084801 CrossRef CAS PubMed.
- Turbomole V7.2 2017, a development of University of Karlsruhe and Forschungszentrum Karlsruhe GmbH, 1989–2007, TURBOMOLE GmbH, since 2007, available from http://www.turbomole.com.
- Supporting research data available: molecular geometries, input/output files of Q-Chem and Turbomole, DOI:10.17028/rd.lboro.15111870.
- D. Kánnár and P. G. Szalay, J. Mol. Model., 2014, 20, 2503 CrossRef PubMed.
- B. Kozma, A. Tajti, B. Demoulin, R. Izsák, M. Nooijen and P. G. Szalay, J. Chem. Theory Comput., 2020, 16, 4213–4225 CrossRef CAS PubMed.
- D. J. Tozer, R. D. Amos, N. C. Handy, B. O. Roos and L. Serrano-Andres, Mol. Phys., 1999, 97, 859–868 CrossRef CAS.
- S. A. Mewes, F. Plasser and A. Dreuw, J. Chem. Phys., 2015, 143, 171101 CrossRef PubMed.
- S. Bai, R. Mansour, L. Stojanović, J. M. Toldo and M. Barbatti, J. Mol. Model., 2020, 26, 1–9 CrossRef PubMed.
- R. Baer, E. Livshits and U. Salzner, Annu. Rev. Phys. Chem., 2010, 61, 85–109 CrossRef CAS PubMed.
- L. Kronik, T. Stein, S. Refaely-Abramson and R. Baer, J. Chem. Theory Comput., 2012, 8, 1515–1531 CrossRef CAS PubMed.
- G. M. Barca, A. T. Gilbert and P. M. Gill, J. Chem. Theory Comput., 2018, 14, 1501–1509 CrossRef CAS PubMed.
- Z. Szakács, F. Glöcklhofer, F. Plasser and E. Vauthey, Phys. Chem. Chem. Phys., 2021, 23, 15150–15158 RSC.
- J. Choi, D.-S. Ahn, K. Y. Oang, D. W. Cho and H. Ihee, J. Phys. Chem. C, 2017, 121, 24317–24323 CrossRef CAS.
- Z. Kuang, G. He, H. Song, X. Wang, Z. Hu, H. Sun, Y. Wan, Q. Guo and A. Xia, J. Phys. Chem. C, 2018, 122, 3727–3737 CrossRef CAS.
- D. Kim, J. Phys. Chem. C, 2015, 119, 12690–12697 CrossRef CAS.
- D. Jacquemin, E. A. Perpète, I. Ciofini and C. Adamo, J. Chem. Theory Comput., 2010, 6, 1532–1537 CrossRef CAS PubMed.
- D. Jacquemin, I. Duchemin, A. Blondel and X. Blase, J. Chem. Theory Comput., 2017, 13, 767–783 CrossRef CAS PubMed.
Footnote |
| † Electronic supplementary information (ESI) available: Relative energies of conformers, fragment definitions, range separation parameter tuning data, analysis of vertical excitations, and results for excited state geometries with larger range separation parameter. See DOI: 10.1039/d1cp03792g |
| This journal is © the Owner Societies 2021 |