Electric fields and potentials in condensed phases
Shawn M.
Kathmann

Physical Sciences Division, Pacific Northwest National Laboratory, Richland, WA 99354, USA. E-mail: shawn.kathmann@pnnl.gov
First published on 13th October 2021
Abstract
The electric fields and potentials inside and at the interface of matter are relevant to many branches of physics, chemistry, and biology. Accurate quantification of these fields and/or potentials is essential to control and exploit chemical and physical transformations. Before we understand the response of matter to external fields, it is first important to understand the intrinsic interior and interfacial fields and potentials, both classically and quantum mechanically, as well as how they are probed experimentally. Here we compare and contrast, beginning with the hydrogen atom in vacuum and ending with concentrated aqueous NaCl electrolyte, both classical and quantum mechanical electric potentials and fields. We make contact with experimental vibrational Stark, electrochemical, X-ray, and electron spectroscopic probes of these potentials and fields, outline relevant conceptual difficulties, and underscore the advantage of electron holography as a basis to better understand electrostatics in matter.
Introduction
The characteristics of the intrinsic electric fields and potentials throughout stable matter are due to the quantum mechanical uncertainty and Pauli principles.1–3 The elements in the periodic table share some common features: each has a negative electron cloud superimposed on a very tightly packed bundle of positive protons located in the nucleus (well-described by a delta function). The specific details of the electronic distributions on each atom as well as all their compounds and physical states (solid, liquids, gases) are unique to each particular system and set of conditions as dictated by the laws of quantum mechanics, statistical mechanics, and thermodynamics. Although the electric field is often characterized in a classical mechanics framework, quantum mechanical concepts such as the uncertainty principle and Pauli exclusion play a fundamental and significant role in determining their ultimate behavior. This is particularly relevant to molecular scale systems. Because of this, it is important to broaden one's view of electrodynamic aspects of physical phenomena.The resulting electric fields arising from these charge distributions, at distances on the order of several angstroms, are extremely large compared to electric fields achievable on the macroscopic scale. For example, at r ≈ 1.5 Å from the nucleus of a hydrogen atom the electric field strength is ≈ 0.3 V Å−1 = 3 × 10⁹ V m−1 = 3 GV m−1. These intense electric fields can only be achieved macroscopically using very high-energy laser pulses, inertial confinement fusion implosions, and particle accelerators.4–6 In contrast, the far field produced in an electromagnetic pulse from a nuclear detonation is a million times smaller! Several areas of research require better quantification of electric fields and potentials7,8 such as: vibrational Stark spectroscopy9,10 (electrochromic and solvatochromic shifts), electrochemistry,11,12 catalysis,13–16 and electrocatalysis (surface potentials, overpotentials, and activation barriers), vibrational surface spectroscopy (surface potentials), nucleation17–22 (homogeneous, heterogeneous, and field-induced), and electron microscopy, diffraction and holography.23 In this article we will discuss how this manifests itself in fields associated with: (1) atomic/ionic electronic structure, (2) vibrational Stark spectroscopy, (3) molecules and condensed phases, (4) electric potentials and electron densities in condensed phases, (5) surface electric potentials and electrochemistry. To help calibrate ourselves to these large fields lets begin with a closer look at the hydrogen atom as it will illustrate several key physical concepts.
Fields of atoms and ions
Ostensibly, hydrogen is a “neutral” atom. Indeed, very far away from hydrogen the field strength is vanishingly small and thus it appears to be uncharged. But, as we come closer to it we begin to discriminate the electric cloud from the nucleus. The total charge density for any atom is just the sum of nuclear and electronic charge densities, with that for hydrogen given by| ρ(r) = ρnuc(r) + ρelec(r) = e[δ(r) − |ψ100|2], | (1) |
 is the 1s hydrogen ground state wavefunction, and ao is the Bohr radius. Using Poisson's equation, ∇2V(r) = −4πρ(r), and the relation between the field E and potential V, i.e., E(r) = −∇V(r), it can be shown that the total electric potential and field are given by
 | (2) |
 | (3) |
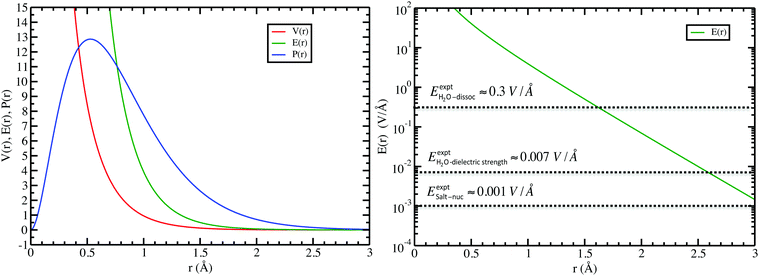
In the left panel of Fig. 1 we show the radial dependence of the potential V(r), field E(r), and radial probability density P(r) = 4πr2|ψ100|2. Importantly, both V(r) and E(r) are positive for all r, meaning that up close, the quantum hydrogen atom appears as a screened positive charge. The same is true for the rest of the elements in the periodic table – up close, they too can be viewed as electronically screened positive nuclear charges. On the right panel of Fig. 1 we show just the electric field E(r) on a log-scale along with several reference fields such as those required for dissociation of water,24 dielectric breakdown, and those used to induce salt to crystallize from concentrated aqueous KCl.20 An additional important physical quantity (to be discussed further below) is Hans Bethe's mean inner potential25 (MIP) given by
 | (4) |
 . We can estimate Vo for the hydrogen atom using V(r), r = 3 Å, and
  , to give
 | (5) |
This estimate of hydrogen's Vo is the difference in electric potential between the spatial average of V(r) over the atom with respect to a zero reference potential at r = ∞. Bethe commented that since Vo ∝ 〈r2〉, it represents the 2nd moment of the electrons of the atom, with the 〈r2〉 being sensitive to the wings of the electron densities. Given the large nuclear contribution to the total electric potential, the single 1s electron does a very reasonable job of screening it. For convenience, it is sometimes easier to visualize what is happening with the electric potentials compared to the fields keeping in mind they are simply related by a negative gradient – fields converge into regions of negative potential and diverge from regions of positive potential. Unfortunately, the analytic results for the hydrogen atom do not exist for the rest of the elements in the periodic table, however, they can be obtained through numerical quantum mechanical (QM) calculations for clusters as well as periodic systems. For example, consider the Na0 atom (with eleven protons and electrons) in its 1s22s22p63s1 electronic ground state. From a QM calculation, one finds that the electric fields are indeed very large some distance from the sodium nucleus e.g., E = 6.3 and 0.8 V Å−1 at r = 1.5 and 2.5 Å, respectively. In Fig. 2 we show another important difference between QM and classical (CL) descriptions of cations and anions e.g., with Na+ and Cl−. There are three key differences: (1) the negative potential for the QM anion turns around and becomes positive as r decreases due the potential of the Z nuclear protons, (2) the positive potential for the QM cation also becomes more positive as r decreases for the same reason, and (3) the QM cations and anions only appear as CL ± unit point charges in the “far-field” sense. As one gets closer to these ion's nuclei their intrinsic QM behaviour reveals itself where the QM and CL “near-field” regions are quite different. In particular, the negative CL charge displays an unphysical negative potential divergence at small distances.
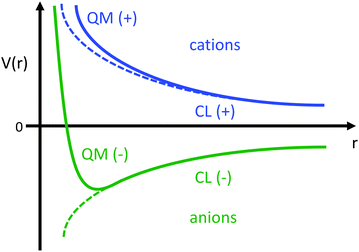 | ||
| Fig. 2 Illustration of the differences between the of electric potentials of an atomic QM cation (blue) and anion (green) vs. CL ± unit point charges. | ||
Computational details
In what follows we used a combination of Gaussian gas phase26 and condensed phase CP2K QM calculations27–36 to illustrate key concepts. The level of theory and basis sets used are provided in the relevant figure captions. From these QM calculations, the corresponding cube files are processed to obtain the electric potentials and fields. In the case of CL results, the potentials and fields where evaluated, on the same computational grid (spacing = 0.095 Å) as the QM cases, using their point charge representations. For the 6.7 M aqueous NaCl periodic molecular dynamics simulation, a cubic box of length L = 24.346 Å containing 58 NaCl and 396 H2O sampled for 1 ns using the Smith-Dang37 and SPC/E38 CL models, then re-sampled using CP2K to obtain the QM electric potentials and fields.Fields in vibrational stark spectroscopy
The influence of electric fields on frequency shifts of condensed phase molecules, a.k.a. vibrational Stark spectroscopy, has a long history.9,10,39–53 Early work in Stark spectroscopy employed continuum electrostatic descriptions while more current work utilizes electric fields from CL point charges in molecular dynamics simulations of the average projected “effective” fields. The central concept is the use of particular vibrational shifts as antennas (or probes) capable of sensing the “effective” electric fields from their “local surroundings”. The assumption most commonly used is to consider the system as composed of independent uncoupled single mode oscillators (e.g., CO, CN−, OH in H2O).48 Given these caveats, Stark spectroscopy has provided key insights into the sensitivity of frequency shifts to local electrostatics such that the vibrational probe acts as an empirical voltmeter that detects subtle polarity changes in the environment. Vibrational Stark spectroscopy focuses on: (1) internal spectroscopy where shifts are from the solvent (solvatochromism), and (2) external spectroscopy where the shifts are induced by applied fields (electrochromism). The frequency shifts Δω and electric field E used in 2nd order vibrational Stark spectroscopy are related by | (6) |
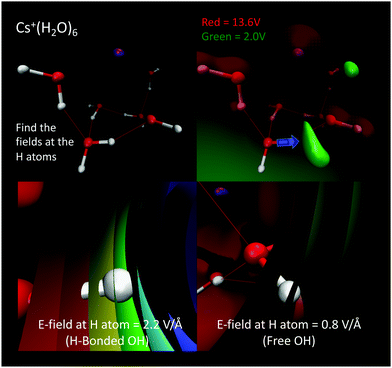
Recently, we explored a QM description of electric fields and solvochromic frequency shifts of the OH vibrations in a low temperature Cs+(H2O)6 cluster experimentally investigated by Johnson and coworkers.56 As shown in Fig. 3, the projected electric fields at each water molecule's H sites are calculated as those arising from the QM charge densities of all the other atoms, Cs+(H2O)5, in the system excluding only those atoms (nuclei, electrons, and basis functions) of the H2O probe for which the field are being evaluated. Here it is important to note that in the QM case we are wanting to evaluate the “effective” fields when the total system is at a stationary point (i.e., a stable minimum energy configuration, as opposed to sampling from a thermal ensemble such as those investigated using molecular dynamics simulations17,43,45,48).
The calculation was repeated five times for the remaining water molecules, where each subsequent H2O was removed with the previous H2O included again. These electric fields are then projected onto the OH bond vectors corresponding to each vibrational antenna. Fig. 4 shows that the projected E fields are indeed large and can be approximately grouped into two OH sets that are H-bonded and free. Again, that these “effective” fields are so intense that they would dissociate any water molecule if not for that molecule's self-field and response to the “effective” field. The parameters Δμ and Δα are best fit to the measured vibrations and the black bars (right plot of Fig. 4) broadened with Lorentzians as is standard in vibrational spectroscopy. Amazingly, these “effective” projected fields describe the frequency shifts quite well. Furthermore, similar results were found where the electric field projectors were used to quantify the coupled CO vibrational frequency shifts in hydrating the carboxylate group in Ca2+–propionate system through field projections on the C–C bond.57 In this case, the CO vibrations are coupled through the C–C bond that connects the head group to the hydrocarbon tail.
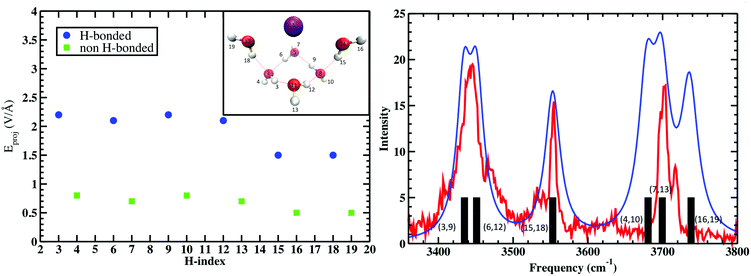 | ||
| Fig. 4 (Left) Projected QM E fields (left) on the H atoms in Cs+(H2O)6 where the blue and green symbols denote those OH groups that are H-bonded and free, respectively (the H-indices correspond to those in the inset). (Right) Comparison of the measured vibrational spectra (red) and that from the projected QM fields (black bars) and Lorentzian fits to QM fields (blue). See Wolke et al.56 for more details. QM level: MP2/aug-cc-pVDZ. | ||
Using 1st order electrochromic shifts of C![[double bond, length as m-dash]](https://www.rsc.org/images/entities/char_e001.gif) O in various nonpolar and polar solvents, Fried et al.51 found that the “effective” electric fields from CL point charges needed to be reduced by a correction factor of 2.5 to match the observed Δω. The measured Stark tuning rates (in externally applied fields), |Δμ|f, where f is a local field correction factor will, in general, be different from the true QM microscopic electric field as well as from a QM “effective” field. Our QM calculations, as well a future investigations, may provide some necessary closure as we have found that the “effective” QM fields are, at least, smaller than the “effective” CL fields in the solvatochromatic shifts for propionate discussed above by ≈0.2 V Å−1. Moreover, if we compare the liquid water OH Stark tuning rates for solvatochromic shifts of Skinner et al.52 Δμ ≈ 2 cm−1 (MV−1 cm−1) to the electrochromic shifts calculated by English et al.58 Δμ ≈ 10 cm−1 (MV−1 cm−1), then one is left wondering if the difference can be accounted for by the field factor f, or some other limitation of the Stark spectroscopy formalism. These “effective” fields should be considered as valuable quantities that correlate well with vibrational shifts Δω encoded in the surrounding environment, however, accurate full QM electric fields and potentials are needed to provide benchmarks for future vibrational studies of these aqueous systems.
O in various nonpolar and polar solvents, Fried et al.51 found that the “effective” electric fields from CL point charges needed to be reduced by a correction factor of 2.5 to match the observed Δω. The measured Stark tuning rates (in externally applied fields), |Δμ|f, where f is a local field correction factor will, in general, be different from the true QM microscopic electric field as well as from a QM “effective” field. Our QM calculations, as well a future investigations, may provide some necessary closure as we have found that the “effective” QM fields are, at least, smaller than the “effective” CL fields in the solvatochromatic shifts for propionate discussed above by ≈0.2 V Å−1. Moreover, if we compare the liquid water OH Stark tuning rates for solvatochromic shifts of Skinner et al.52 Δμ ≈ 2 cm−1 (MV−1 cm−1) to the electrochromic shifts calculated by English et al.58 Δμ ≈ 10 cm−1 (MV−1 cm−1), then one is left wondering if the difference can be accounted for by the field factor f, or some other limitation of the Stark spectroscopy formalism. These “effective” fields should be considered as valuable quantities that correlate well with vibrational shifts Δω encoded in the surrounding environment, however, accurate full QM electric fields and potentials are needed to provide benchmarks for future vibrational studies of these aqueous systems.
It should be apparent that the use of “effective” fields formally neglects the “self” and self-consistent response electric fields arising from the H2O probes as well as the total system response to an applied field. Here, the probe molecule is being removed from the picture entirely, and the surrounding fields pass unhindered through it's ghostly vacuum and the fields projected onto the H atom locations where the molecule was. Clearly, these “effective” fields cannot be the physical fields. This distinction is relevant because the total E field at any nucleus in a ground state minimum energy configuration must be identically zero! Otherwise, the nuclei would experience a Lorentz force (F = qE) arising from a non-zero electric field E. Importantly, the QM calculation of the Hellmann–Feynman force59 requires that the system wavefunction be variational and the basis sets complete, which is true if the wavefunction is not constructed from nuclear-centered atomic orbitals e.g., with plane waves.60 Even though Feynman wrote61 that “The force on any nucleus (considered fixed) in any system of nuclei and electrons is just the classical electrostatic attraction exerted on the nucleus in question by the other nuclei and by the electron charge density distribution for all electrons, ρelec(r)”, in practice care must be exercised for non-variational incomplete wavefunction methods (typical Gaussian basis sets) since they give rise to Pulay forces/fields even at an energy minimum because the system wavefunction depends on nuclear positions. Even considering the errors arising from Pulay fields, the electric fields and their fluctuations evaluated at nuclear sites are going to be very different depending upon whether one includes/excludes the molecule's self-fields either from point charges or the QM nuclear and electronic charge densities.17,60,62,63 Future work should compare and contrast QM versus CL representations of the projected electric fields and their fluctuations on the vibrational probes as well as applying external fields to accurately determine the local field correction factor f.
In summary, “effective” fields can be considered “far-fields” inside condensed phases whereas the actual QM electric fields, including the self- and response fields of the atoms and molecules, are to be considered “near-fields”. A common approach in electrostatics is to approximate the total charge density by an expansion in multipoles. The multipole approximation is only valid in the “far-field” sense such that the electric potentials and fields are determined outside the charge distribution itself. Another approximation frequently employed is to mimic the screening of charge distribution by a solvent by using its dielectric constant to modify the Coulomb interactions in specific regions of space as opposed to explicit inclusion of the solvent molecules themselves. In both cases, one must use caution as we would like to understand what the exact electric properties are in between atoms and molecules before we make approximations to them. From the outset, it must be understood that there are several ambiguities surrounding where QM and CL fields should be evaluated and from what sources. Ultimately, this is due to the inherent QM difficulty and arbitrariness in knowing where to cut the system wavefunction, or electron density, into two parts: (1) a local vibrational probe, and (2) its environment. Stated simply, where does one thing end and the other thing begin within a condensed phase system?
Fields of molecules and condensed phases
We now know, generally, that the QM electric potential of any bare (“neutral”) element is positive definite everywhere and gradually decreases to zero as one heads into the vacuum. But, when the elements form matter this is no longer necessarily the case, e.g., , during which there is electron orbital hybridization/spatial redistribution in the form of covalent bonds and perhaps lone pairs – see Fig. 5. Lone pairs show up as regions of negative electric potential. Regions of negative electric potential can also exist in the space between atoms such as non-nuclear attractors (NNAs) of electron density such as in metals, semiconductors, solvated electrons, F-centers, and electrides.64–70 A NNA is a point where the electron density has local maxima in a region of space where there is no nucleus. These regions with negative and positive electric potentials are chemically relevant, for example, in Lewis bases that can be electronically tuned along with their Lewis acids by substitution of electron withdrawing or donating adjacent atoms or other relevant chemical groups.71,72
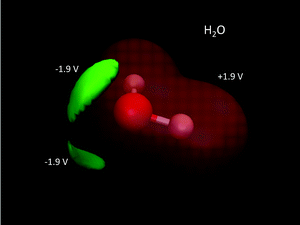
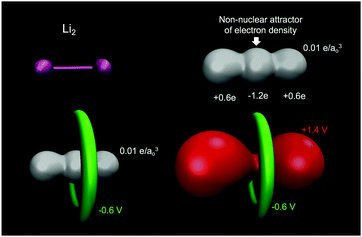
A common misconception is that the electric potential always accompanies the electron density in that electron rich regions have negative potentials – this is the case sometimes.64,72 But, care must be exercised since the total QM electric potential arises from both electrons and nuclear protons. Fig. 5 shows a few electric potential isosurfaces H2O noting, importantly, that there are no NNAs in the lone pair regions (not shown) and yet the lone pairs are easily seen as regions of negative electric potential.73 But, note that the negative lone pair region (green), shown in the upper left panel of Fig. 3 next to the probe H2O molecule H-bond donor, would not occur if the probe's self-field and response was included in the QM calculation. Metal dimers, such as Li2 have a NNA64 of −1.2e without a collocated negative electric potential. But, interestingly the influence of the NNA occurs as a halo of negative electric potential of −0.6 V (green) surrounding the NNA due to the nearness of the Li Z = 3 nuclei yielding the +1.4 V potential isosurface (red) in Fig. 6. Accurate modeling the QM behaviour of NNAs and lone pairs in condensed phases remains an outstanding challenge for molecular simulations as their accurate description requires a high level of electronic structure and thus significant computational resources.74
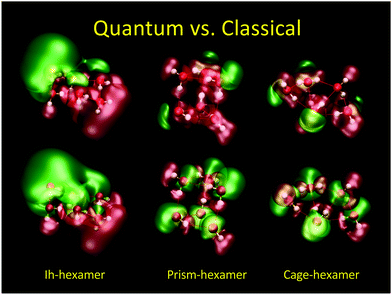
In Fig. 7 we show the difference between QM (top) and CL (bottom) electric potential representations of three minimum energy (H2O)6 configurations (Ih, prism, and cage). Here, SPC/E charges38 were placed at the positions of the QM nuclei. In the QM cases one can see regions of negative/positive (±1.4 V green/red) potentials arising from the lone electron pairs and nuclei in contrast to the CL cases where one can see the negative isosurface around the oxygen atoms and the positive isosurface around the hydrogen atoms as expected from point charges.
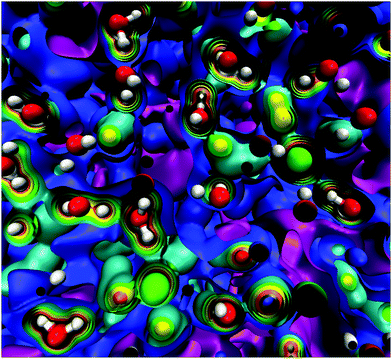
At this point, it should be clear that there are important as well as strange differences between the QM and CL representations of charge, fields, and potentials. Keeping the magnitude of these fields and potentials in mind, Fig. 8 shows a QM snapshot of various electric potential isosurfaces for highly concentrated (6.7 M) NaCl solution. One can see that close to the nuclei the potential is positive (red, orange, and yellow isosurfaces) and as one moves out encountering the neutral potential (green isosurface) and then in between the atoms the potential exhibits quite complicated and counter-intuitive behaviour where the negative potentials (cyan, blue and purple isosurfaces) are due to water's lone electron pairs as well as from the electrons on the Cl− anions. During the molecular dynamics the ions and molecules are translating, rotating, and vibrating on various timescales making the picture even more complicated.
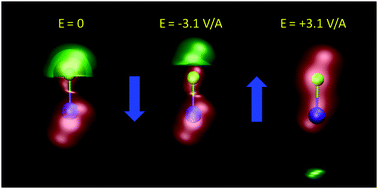
A curious observation is that upon supersaturation, aqueous NaCl (as well as other systems) emits visible and ultraviolet light during crystallization in a phenomena called crystalloluminescence.22,75 How do the internal fields alter the manifold of excited electronic state lifetimes, internal conversions, intersystem crossings, and subsequent emissions? From high-level QM calculations on the NaCl dimer, we found17 that an applied field E = 0.5 V Å−1 can stabilize the excited singlet and triplet electronic states with triplet–singlet energy differences consistent with the light emission seen in the experiments. In Fig. 9 we show the simple case of the QM response of a NaCl molecule (with fixed internuclear distance, thus the response is only electronic) to an applied E field. One can see that these large fields can completely reverse the dipole polarity. Here, if the NaCl internuclear distance was allowed to vary, then these strong fields would easily dissociate the molecule. To further understand whether the condensed phase fields are consistent with the QM fields needed for these transitions, we calculated17 the concentration dependent distributions of electric fields on the Na+ and Cl− ions and H2O molecules from CL molecular dynamics simulations of aqueous NaCl. The distributions of field magnitudes on the ions for the 6.7 M case is shown in Fig. 10, noting that the concentration dependence of he field strengths was very slight. But, the fields on the H2O molecule O and H sites were larger ∼2 V Å−1 and distributions broader than those on the ions ∼0.5 V Å−1. The CL field magnitudes at the ions are clearly large enough to cause changes in the electronic levels. The ion and water molecule self-fields are, of course, not included in this analysis as they represent the fields coming from all other ions and water molecules in the system (see Sellner et al.17 and Fetisov et al.18 for more details). When considering how electric fields alter electronic transitions, like internal conversions and intersystem crossings, perhaps a more relevant location to evaluate the field would be at the centroids of the orbitals involved in the processes instead of at the positions of the nuclei or projections onto bonds. Our future effort is focused on a more complete QM understanding of the electronic changes (including possible formation of NNAs), fields, and potentials underlying the crystalloluminescence mechanism.
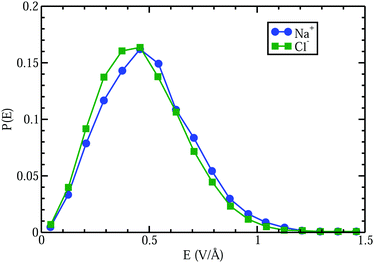 | ||
| Fig. 10 Comparison of electric field distributions at the locations of the Na+ and Cl− ions from CL simulations of a 6.7 M aqueous NaCl electrolyte. | ||
In the condensed phase QM electric fields and potentials are large almost everywhere (e.g., in Fig. 8) as the wings of the atomic and molecular electron densities repel and confine each other compared to how the atomic and molecular electron densities spread from the interface out into the vacuum. Furthermore, small changes in electron density can cause large variations in potentials and fields. Once you consider yourself outside of a given atom's electron density you're already inside the electron density of an adjacent atom. The sharp contrast between the QM and CL descriptions (i.e., field magnitudes and directions, potential sign and magnitudes and the complicated spatial distributions) highlights the need to better understand and quantify the appropriate regions of space where we evaluate electric fields and potentials relevant to a particular phenomena, reaction coordinates, or order parameters as well as how to compare to experimental probes of these fields and potentials.
Measurement of electric potentials and electron densities in condensed phases
When isolated atoms come together into substances or compounds, the electron densities in the core regions change little with the most significant chemical changes occurring in the valence regions – see Fig. 8.76–79 X-ray and electron scattering have provided a tremendous wealth of information about the structure of matter in ways no other measurements are able to provide. These more direct measurement methods, in contrast to indirect inference of effective fields from vibrational shifts or other80 less direct probes, represent the “gold standard” for interrogating atom–atom correlations, interactions, electron densities and electric potentials and the fields resulting from them.63,81–83 But, some of the most relevant chemical changes are relatively small (δρelec(r) ≪ 0.1e/ao3), thus making accurate experimental quantification via X-ray or electron diffraction quite challenging.84 Although variations in electron density have been reported using both X-rays and electrons, it has been argued that, in principle, it is easier to measure valence charge densities via electron scattering because of the higher sensitivity to differences in electric potential to changes in the valence electrons.82,85 The X-ray and electron scattering structure factors, related by the Mott–Bethe86,87 formula fel(k) = (8π2me2/h2)[Z − fX(k)/k2], are given by the Fourier transforms and
and  , respectively, where the integral relation between the total charge density ρ(r) = ρnuc(r) + ρelec(r) and electric potential V(r) is
  , and k is the scattering vector. Thus, one may interpret these structure factors as saying that X-rays scatter off the electron density and electrons scatter off the electric potential.85
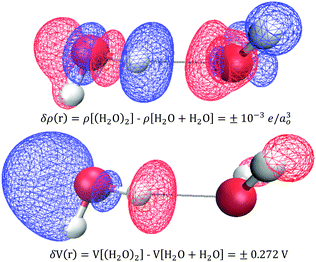
In practice, X-ray and electron scattering employ the independent atom model (IAM),88–90 where a hypothetical representation of the electron density or electric potential is constructed as a superposition of high-level QM Dirac–Fock spherical atom electron densities or electric potentials from the vacuum. The difference between the IAM density and the real QM density is called the deformation density, δρ(r) = ρQM(r) − ρIAM(r), and is a 3D measure of all the changes that occur forming the atoms into compounds/substances. Similarly, one can consider deformation electric potentials, δV(r) = VQM(r) − VIAM(r), where VQM(r) is the QM electric potential of bulk sample, and VIAM(r) is a superposition of atomic electric potentials. Fortunately, small changes in δρ(r) yield large changes in δV(r) such that the signal-to-noise is improved in quantifying changes in electric potential compared to those of the electron density. Fig. 11 shows an example of using an independent molecule model (as a generalization to the independent atom model) to calculate the deformations resulting from bringing two water molecules together: H2O + H2O → (H2O)2. One can see that these QM deformations δρ(r) and δV(r) are quite complicated and largely non-intuitive, however, it is clear that small electron density changes are accompanied by large changes in electric potential. For example, a small increase in electron density on the hydrogen donor causes a large decrease in the electric potential.
Electron scattering directly probes the total QM electric potential (including the self- and response potentials in both the “near-” and “far-fields” regions) throughout matter. These high-energy electrons penetrate deep into matter and hence are able to probe the entire V(r) from the valence regions to very close to the nuclei. Lets reconsider our previous expression for Bethe's MIP noting that we can identify it simply as the zeroth (k = 0) Fourier component of the electron scattering structure factor
 | (7) |
The MIP is the substance dependent difference in the spatial average of the electric potential with respect to zero vacuum potential. All the elements share a common difference in their electric charge distributions such that all the positive protons are highly concentrated in the nucleus (i.e., to good approximation a Dirac delta function of charge Z) superimposed on a diffuse background of negative electron density. Electrons never concentrate their charge density like protons do, even for NNA electrons. Thus, the spatial average of the electric potential, Vo, corresponds to a positive definite electronically screened nuclear electric potential of matter. As such it provides an experimentally accessible measure of the average QM electric potential inside matter. Historically, the connections between these physical quantities and their measurement was developed by four Nobel prize winners. In 1927 Davisson and Germer91 confirmed the de Broglie hypothesis (that electrons could behave as waves) by observing the diffraction pattern of electrons scattered by Nickel, however, they were unable to index the reflections without knowing Vo. In 1928 Bethe25 successfully indexed the reflections for Nickel using his derivation for Vo. A few decades later, Gabor92 invented electron holography which ultimately allowed direct measurement of Vo given by
 | (8) |
 | (9) |
 is the ith atomic electron scattering factor at zero scattering angle (e.g., felH(0) = ao ≈ 0.529 Å for the hydrogen atom).
As a practical matter, the MIP as defined in eqn (7) isn’t of much use when calculating Vo using QM molecular simulation. Instead, we use
 | (10) |
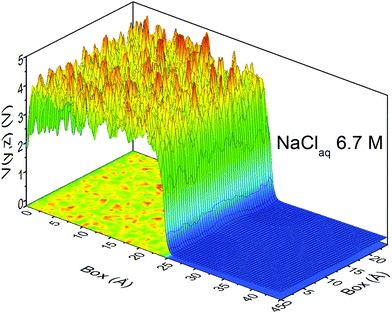 | ||
| Fig. 12 The profile of the electric potential for a slab of 6.7 M aqueous NaCl spanning both the bulk and vacuum regions. QM level: PBE/DZVP. | ||
Let's use liquid water as an example to illustrate some key points in understanding Vo. Using the IAM approximation one obtains VIAMo = 4.87 V. The best estimate from a bulk QM calculation94 gives VQMo = 4.32 V, and the most accurate liquid phase electron holography measurement95 is VEXPTo = 4.48 V. Notice that the difference between the IAM and experiment is −0.39 V. The negative sign indicates that forming the water molecules (OH bonds and lone electron pairs) and bringing them together (hydrogen bonding, etc.) in the condensed phase allows, on average, for better screening of the positive electric potential of the nuclei (think mutual Pauli-repulsion where the tails of the electron densities are pushed closer to the nuclei compared to atoms in vacuum). The magnitude of the difference points to the subtlety of these chemical effects with ∼2/3 going to making covalent OH bonds and lone pairs, and ∼1/3 for hydrogen bonding, etc.63Fig. 12 shows the profile of the QM electric potential for a single configurational snapshot going from inside a 6.7 M aqueous NaCl solution out into the vacuum region. Using our best estimates from previous calculations yields a VQMo ≈ 4.95 V for 6.7 M aqueous NaCl. Unfortunately, no electron holography measurements exist to compare with our aqueous NaCl results, but we note the an upper bound can be obtained using the IAM that gives VIAMo = 5.5 V. Table 1 compares the experimental MIPs23,93 for various systems. Generally, one might expect that the MIPs increase monotonically as one goes to higher Z in the periodic table, however, this is not the case as subtle variations in packing and the spatial distribution of electrons are particular to each substance.
| System | V EXPTo (V) |
|---|---|
| H2O | 4.5 |
| NaCl | 8.3 |
| Al | 13.0 |
| Si | 11.5 |
| CaF2 | 11.6 |
| Ni | 18.0 |
| Cu | 23.5 |
| Ag | 20.7 |
The inclusion of nuclear quantum effect (NQE) (i.e., zero-point energy) on pure water, as well as anions F− and I− in water, has been shown to yield relatively large changes in electronic charge transfer between water molecules and from the anions to water, however, how this will alter the electric potentials and fields has yet to determined.96 An in-depth analysis of the electron densities of aqueous NaCl electrolytes reveals that the water molecules, on average, act as electronic sinks for electric charges arising from the Cl− anions, consistent with the NQE findings of Markland.17,63 Importantly, the measured and calculated QM MIP (without NQE included) of liquid water differ by only ΔVo = 0.16 V, suggesting that NQEs cause a decrease in electronic screening of the electric potentials of the nuclei.95
The measured MIPs only report on the electric potential difference between the spatial average of the potential inside matter and the zero vacuum reference – essentially a Heaviside step function. But, it doesn't tell us what the average interfacial electric fields are as this requires knowing how the electric potential decays into the vacuum or at the interface between one substance and another. Indeed, the QM slab simulations can provide the interfacial potential profile from which the field can be computed. For convenience, consider a more gradual interfacial step using the function
 | (11) |
 | (12) |
Electric potentials and electrochemistry
At this point we must mention a closely related quantity from electrochemistry,97–99 that is also used to quantify single ion hydration free energies,94,100–102 called the surface potential (see Kathmann et al.62 for more details): χ = ϕ −ψ, where ϕ is the inner or Galvani potential and ψ is the outer or Volta potential. The ϕ and ψ potentials are rather loosely defined as those potentials measured by a nonperturbative test charge inside and outside the sample, respectively. Simple enough, but this doesn't make χ, ϕ or ψ physically or mathematically well-defined. For example, if we perform the same analysis we did above for the QM case using eqn (10), with CL SPC/E point charges instead, we find VCLo = −0.55 V. VCLo is unable to get the sign of the MIP correct much less the magnitude. Again, this is due to the unphysical behaviour of the “near field” CL point charges seen in Fig. 2. Furthermore, the electrochemical experimental estimates of χ range from −1.1 to +0.5 V. Various authors have used the fact that since VCLo falls within the experimental range of χ as evidence for its correctness as opposed to numerical coincidence. Again, the MIP results from averaging the electric potential over the entire charge density from the valence regions all the way to the nuclei due to the high-energy electrons. It's not clear where in the charge density the electrochemical measurements probe, however, it's safe to assume they are probing “somewhere in between” the atoms or molecules. We have explored this “somewhere in between” by using various electron isosurfaces as a well-defined way to partition the space over which the electric potential is averaged given by| Ṽ(r) = V(r)Θ[ρcutelec − ρelec(r)], | (13) |
 | (14) |
 | (15) |
Interestingly, the most recent electrochemical measurements by Allen and co-workers,103 using a modified equivalent circuit model to characterize their cell, obtain a surface potential χ = −0.49 V. From an analysis of their measurements, it's not clear how one could set up the corresponding condensed phase QM calculations required to test the assumptions and limitations of the circuit model. Further study of the connection between VCLo and χ is certainly warranted.
Conclusions
We discussed several key points worth summarizing: (1) all “neutral” elements can be considered as screened positive charges when in the “near-field” regions, (2) vibrational groups can act as local field probes and correlate well with observed frequency shifts for single mode independent oscillators, (3) when atoms are brought together into substances, the electrons rearrange into chemical bonds, cations/anions, lone pairs, and NNAs, (4) lone pairs are not NNAs but arise from the delicate balance in the lone pair region between nuclear and electronic electric potentials, (5) the electric fields are extremely large almost everywhere inside and at the interface of matter and thus care must be taken when considering which part(s) of the system act as source(s) and receiver(s), (6) that small changes in electron density lead to large changes in electric potential, (7) there are large differences in electric potentials and fields between CL and QM representations of charge density, (8) X-ray and electron scattering measurements in general provide very direct information on the QM charge densities and electric potentials and fields, (9) the MIP, Vo, is a key measure of the average electric potential of matter and is very sensitive to the wings of the electron densities, and (10) a rigorous comparison between condensed phase QM electric potential and electrochemical surface potentials still requires further analysis.The excellent agreement between the experimental and QM MIPs underscores the proper description of the electric potentials (and fields) inside matter and stand as “gold standard” benchmarks of accurate representations of charge densities, potentials, and fields inside and at the interfaces of condensed phases.104 From these types of measurements and QM calculations one can build better CL and coarse grained models of the electric potentials and fields of matter.
Conflicts of interest
There are no conflicts to declare.Acknowledgements
The author acknowledges helpful discussions with Greg Schenter, Chris Mundy, Murat Valiev, Sotiris Xantheas, and Marcel Baer at PNNL, Murat Yesibolati, Marco Beleggia, and Kristian Molhave at the Technical University of Denmark, Mark Johnson at Yale, Kenneth Jordan at the University of Pittsburgh, Stephan Boxer at Stanford, Heather Allen at the Ohio State University, Tom Beck at the University of Cincinnati, Rafal Dunin–Borkowski at the Research Centre Julich, Jean-Sabin McEwen at Washington State University, Bernhard Sellner, William Isley III, and Evgenii Fetisov. The author was supported by the U.S. Department of Energy, Office of Science, Office of Basic Energy Sciences, Division of Chemical Sciences, Geosciences and Biosciences. Pacific Northwest National Laboratory (PNNL) is operated by Battelle for the U.S. Department of Energy under Contract No. DE-AC05-76RL01830. This research used resources of the National Energy Research Scientific Computing Center, which is supported by the Office of Science of the U.S. Department of Energy under Contract No. DE-AC02-05CH11231. Additional computing resources were generously allocated by PNNL's Institutional Computing program.References
- F. J. Dyson and A. Lenard, Stability of Matter. I, J. Math. Phys., 1967, 8, 423–434 CrossRef CAS.
- E. H. Lieb, The stability of matter, Rev. Mod. Phys., 1976, 48, 553–569 CrossRef.
- E. H. Lieb and R. Seiringer, The Stability of Matter in Quantum Mechanics, Cambridge University Press, New York, 2009, pp. 89–100 Search PubMed.
- V. Malka, in Laser Pulse Phenomena and Applications, ed. F. Duarte, InTechOpen, 2010, pp. 289–308 Search PubMed.
- K. Nakajima, in Science of Superstrong Field Interactions, ed. K. Nakajima and M. Deguch, American Institute of Physics, Hayama, Japan, 2002, p. 398 Search PubMed.
- P. Amendt, S. C. Wilks, C. Bellei, C. K. Li and R. D. Petrasso, The potential role of electric fields and plasma barodiffusion on the inertial confinement fusion database, Phys. Plasmas, 2011, 18, 056308 CrossRef.
- N. J. English and C. J. Waldron, Perspectives on external electric fields in molecular simulation: progress, prospects, and challenges, Phys. Chem. Chem. Phys., 2015, 17, 12407 RSC.
- M. L. Karahka and H. J. Kreuzer, New physics and chemistry in high electrostatic fields, Surf. Sci., 2016, 643, 164 CrossRef CAS.
- W. Liptay, Electrochromism and Solvatochromism, Angew. Chem., Int. Ed. Engl., 1969, 8, 177 CrossRef CAS.
- N. S. Hush and J. R. Reimers, Vibrational Stark Spectroscopy, J. Phys. Chem., 1995, 99, 15798 CrossRef CAS.
- C. Zhang, T. Sayer, J. Hutter and M. Sprik, Modelling electrochemical systems with finite field molecular dynamics, J. Phys. Energy, 2020, 2, 032005 CrossRef CAS.
- K. Schwarz and R. Sundararaman, The electrochemical interface in first-principles calculations, Surf. Sci. Rep., 2020, 75, 100492 CrossRef CAS PubMed.
- A. Warshel, P. K. Sharma, Y. Kato, Y. Xiang, H. Liu and M. H. M. Olsson, Electrostatic Basis for Enzyme Catalysis, Chem. Rev., 2006, 106, 3210 CrossRef CAS PubMed.
- S. Shaik, D. Danovich, Z. Joy, J. Wang and T. Stuyver, Electric-Field Mediated Chemistry: Uncovering and Exploiting the Potential of (Oriented) Electric Fields to Exert Chemical Catalysis and Reaction Control, J. Am. Chem. Soc., 2020, 142, 12551 CrossRef CAS PubMed.
- F. Che, J. T. Gray, S. Ha, N. Kruse, S. L. Scott and J.-S. McEwen, Elucidating the Roles of Electric Fields in Catalysis: A Perspective, ACS Catal., 2018, 8, 5153 CrossRef CAS.
- V. Vaissier Welborn and T. Head-Gordon, Fluctuations of Electric Fields in the Active Site of the Enzyme Ketosteroid Isomerase, J. Am. Chem. Soc., 2019, 141, 12487 CrossRef PubMed.
- B. Sellner, M. Valiev and S. M. Kathmann, Charge and Electric Field Fluctuations in Aqueous NaCl Electrolytes, J. Phys. Chem. B, 2013, 117, 10869 CrossRef CAS PubMed.
- E. O. Fetisov, W. C. Isley III, G. J. Lumetta and S. M. Kathmann, Electric Potentials of Metastable Salt Clusters, J. Phys. Chem. C, 2019, 123, 14010–14023 CrossRef CAS.
- K. W. Hall, Z. Zhang, C. J. Burnham, G.-J. Guo, S. Carpendale, N. J. English and P. G. Kusalik, Does Local Structure Bias How a Crystal Nucleus Evolves, J. Phys. Chem. Lett., 2018, 9, 6991 CrossRef CAS PubMed.
- A. J. Alexander and P. J. Camp, Single Pulse, Single Crystal Laser-Induced Nucleation of Potassium Chloride, Cryst. Growth Des., 2009, 9, 958 CrossRef CAS.
- L. F. Alexander and N. Radasci, Application of electric fields for controlling crystallization, CrystEngComm, 2019, 21, 5014 RSC.
- M. Barsanti and F. Maccarrone, Crystalloluminescence, Riv. Nuovo Cimento Soc. Ital. Fis., 1991, 14, 1 CrossRef CAS.
- E. Volkl, L. F. Allard and D. C. Joy, Introduction to Electron Holography, Springer Science + Business Media New York, 1999 Search PubMed.
- A. M. Saitta, F. Saija and P. V. Gaiquinta, Ab Initio Molecular Dynamics Study of Dissociation of Water under an Electric Field, Phys. Rev. Lett., 2012, 108, 207801 CrossRef PubMed.
- H. Bethe, Theorie der Beugung von Elektronen an Kristallen, Ann. Phys., 1928, 392, 55 CrossRef.
- M. J. Frisch, G. W. Trucks, H. B. Schlegel, G. E. Scuseria, M. A. Robb, J. R. Cheeseman, V. G. Zakrzewski, J. A. J. Montgomery, R. E. Stratmann and J. C. Burant, Gaussian, 1998, 98, https://gaussian.com Search PubMed.
- CP2K, https://cp2k.org.
- J. Vandevondele and J. Hutter, Gaussian basis sets for accurate calculations on molecular systems in gas and condensed phases, J. Chem. Phys., 2007, 127, 114105 CrossRef PubMed.
- M. Krack, Pseudopotentials for H to Kr optimized for gradient-corrected exchange-correlation functionals, Theor. Chem. Acc., 2005, 114, 145 Search PubMed.
- J. Vandevondele, M. Krack, F. Mohamed, M. Parrinello, T. Chassaing and J. Hutter, QUICKSTEP: Fast and accurate density functional calculations using a mixed Gaussian and plane waves approach, Comput. Phys. Commun., 2005, 167, 103 CrossRef CAS.
- M. Frigo and S. G. Johnson, The design and implementation of FFTW3, Proc. IEEE, 2005, 93, 216 Search PubMed.
- J. Vandevondele and J. Hutter, An efficient orbital transformation method for electronic structure calculations, J. Chem. Phys., 2003, 118, 4365 CrossRef CAS.
- C. Hartwigsen, S. Goedecker and J. Hutter, Relativistic separable dual-space Gaussian pseudopotentials from H to Rn, Phys. Rev. B: Condens. Matter Mater. Phys., 1998, 58, 3641 CrossRef CAS.
- G. Lippert, J. Hutter and M. Parrinello, A hybrid Gaussian and plane wave density functional scheme, Mol. Phys., 1997, 92, 477 CrossRef CAS.
- J. P. Perdew, K. Burke and M. Ernzerhof, Generalized gradient approximation made simple, Phys. Rev. Lett., 1996, 77, 3865 CrossRef CAS PubMed.
- S. Goedecker, M. Teter and J. Hutter, Separable dual-space Gaussian pseudopotentials, Phys. Rev. B: Condens. Matter Mater. Phys., 1996, 54, 1703 CrossRef CAS PubMed.
- D. E. Smith and L. X. Dang, Computer simulations of NaCl association in polarizable water, J. Chem. Phys., 1994, 100, 3757 CrossRef CAS.
- H. J. C. Berendsen, J. R. Grigera and T. P. Straatsma, The Missing Term in Effective Pair Potentials, J. Phys. Chem., 1987, 91, 6269–6271 CrossRef CAS.
- L. Onsager, Electric Moments of Molecules in Liquids, J. Am. Chem. Soc., 1936, 58, 1486 CrossRef CAS.
- J. R. Platt, Electrochromism, a Possible Change of Color Producible in Dyes by an Electric Field, J. Chem. Phys., 1961, 34, 862 CrossRef CAS.
- J. R. Schmidt, S. T. Roberts, J. J. Loparo, A. Tokmakoff, M. D. Fayer and J. L. Skinner, Are water simulation models consistent with steady-state and ultrafast vibrational spectroscopy experiments?, Chem. Phys., 2007, 341, 143 CrossRef CAS.
- H. Lee, G. Lee, J. Jeon and M. Cho, Vibrational Spectroscopic Determination of Local Solvent Electric Field, Solute-Solvent Electrostatic Interaction Energy, and Their Fluctuation Amplitudes, J. Phys. Chem. A, 2012, 116, 347 CrossRef CAS PubMed.
- J. D. Smith, R. J. Saykally and P. L. Geissler, The Effects of Dissolved Halide Anions on Hydrogen Bonding in Liquid Water, J. Am. Chem. Soc., 2007, 129, 13847 CrossRef CAS PubMed.
- J. D. Eaves, A. Tokmakoff and P. L. Geissler, Electric Field Fluctuations Drive Vibrational Dephasing in Water, J. Phys. Chem. A, 2005, 109, 9424 CrossRef CAS PubMed.
- P. L. Geissler, C. Dellago and D. Chandler, Autoionization in Liquid Water, Science, 2001, 291, 2121 CrossRef CAS PubMed.
- B. Reischl, J. Kofinger and C. Dellago, The statistics of electric field fluctuations in liquid water, Mol. Phys., 2009, 107, 495 CrossRef CAS.
- P. Geissinger, Quantitative Measurement of Internal Molecular Electric Fields in Solids, Anisotropic Organic Materials, 2001, vol. 798, p. 16 Search PubMed.
- S. D. Fried and S. G. Boxer, Measuring Electric Fields and Noncovalent Interactions Using the Vibrational Stark Effect, Acc. Chem. Res., 2015, 48, 998 CrossRef CAS PubMed.
- S. Shin, H. Kang, D. Cho, J. Y. Lee and H. Kang, Effect of Electric Field on Condensed-Phase Molecular Systems. II. Stark Effect on the Hydroxyl Stretch Vibration of Ice, J. Phys. Chem. C, 2015, 119, 15596 CrossRef CAS.
- S. D. Fried, L.-P. Wang, S. G. Boxer, P. Ren and V. S. Pande, Calculations of the Electric Fields in Liquid Solutions, J. Phys. Chem. B, 2013, 117, 16236 CrossRef CAS PubMed.
- S. D. Fried, S. Bagchi and S. G. Boxer, Measuring Electrostatic Fields in Both Hydrogen-Binding and Non-Hydrogen-Bonding Environment Using Carbonyl Vibrational Probes, J. Am. Chem. Soc., 2013, 135, 11181 CrossRef CAS PubMed.
- S. A. Corcelli, C. P. Lawrence and J. L. Skinner, Combined electronic structure/molecular dynamics approach for ultrafast infrared spectroscopy of dilute HOD in liquid H2O and D2O, J. Chem. Phys., 2004, 120, 8107 CrossRef CAS PubMed.
- B. Auer, R. Kumar, J. R. Schmidt and J. L. Skinner, Hydrogen bonding and Raman, IR, and 2D-IR spectroscopy of dilute HOD in liquid D2O, Proc. Natl. Acad. Sci. U. S. A., 2007, 104, 14215 CrossRef CAS PubMed.
- G. U. Bublitz and S. G. Boxer, STARK SPECTROSCOPY: Applications in Chemistry, Biology, and Materials Science, Annu. Rev. Phys. Chem., 1997, 48, 213 CrossRef CAS PubMed.
- J. R. Reimers and N. S. Hush, Vibrational Stark Spectroscopy 3. Accurate Benchmark ab initio and Density Functional Calculations for CO and CN−, J. Phys. Chem. A, 1999, 103, 10580 CrossRef CAS.
- C. T. Wolke, J. A. Fournier, E. Miliordos, S. M. Kathmann, S. Xantheas and M. A. Johnson, Isotopomer-selective spectra of a single intact H2O molecule in the Cs+(D2O)5H2O isotopologue: Going beyond pattern recognition to harvest the structural information encoded in vibrational spectra, J. Chem. Phys., 2016, 144, 074305 CrossRef PubMed.
- J. K. Denton, P. J. Kelleher, M. A. Johnson, M. D. Baer, S. M. Kathmann, C. J. Mundy, B. A. Wellen-Rudd, H. C. Allen, T. H. Choi and K. D. Jordan, Molecular-level origin of the carboxylate head group response to divalent metal ion complexation at the air-water interface, Proc. Natl. Acad. Sci. U. S. A., 2019, 116, 14874 CrossRef CAS PubMed.
- Z. Futera and N. J. English, Communication: Influence of external static and alternating electric fields on water from long-time non-equilibrium an initio molecular dynamics, J. Chem. Phys., 2017, 147, 031102 CrossRef PubMed.
- P. Pulay, Ab initio calculation of force constants and equilibrium geometries in polyatomic molecules, Mol. Phys., 1969, 17, 197 CrossRef CAS.
- D. Marx and J. Hutter, Ab Initio Molecular Dynamics, Cambridge University Press, New York, 2009 Search PubMed.
- R. P. Feynman, Forces in Molecules, Phys. Rev., 1939, 56, 340 CrossRef CAS.
- S. M. Kathmann, I.-F. W. Kuo, C. J. Mundy and G. K. Schenter, Understanding the Surface Potential of Water, J. Phys. Chem. B, 2011, 115, 4369 CrossRef CAS PubMed.
- B. Sellner and S. M. Kathmann, A matter of quantum voltages, J. Chem. Phys., 2014, 141, 18C534 CrossRef PubMed.
- L. A. Terrabuio, T. Q. Teodoro, C. F. Matta and L. A. Haiduke, Nonnuclear Attractors in Heteronuclear Diatomic Systems, J. Phys. Chem. A, 2016, 120, 1168 CrossRef CAS PubMed.
- J. M. Herbert and M. P. Coons, The Hydrated Electron, Annu. Rev. Phys. Chem., 2017, 68, 447 CrossRef CAS PubMed.
- A. Kumar, J. A. Walker, D. M. Bartels and M. D. Sevilla, A Simple ab initio Model for the Hydrated Electron That Matches Experiment, J. Phys. Chem. A, 2015, 119, 9148 CrossRef CAS PubMed.
- B. G. Janesko and S. I. Jones, Quantifying the delocalizatiion of surface and bulk F-centers, Surf. Sci., 2017, 659, 9 CrossRef CAS.
- S. G. Dale, A. Otero-de-la Roza and E. R. Johnson, Density-functional description of electrides, Phys. Chem. Chem. Phys., 2014, 16, 14584 RSC.
- W. L. Cao, C. Gatti, P. J. Macdougall and R. F. W. Bader, On the Presence of Non-Nuclear Attractors in thee Charge Distributions of Li and Na Clusters, Chem. Phys. Lett., 1987, 141, 380 CrossRef CAS.
- Q. K. Timerghazin and G. H. Peslherbe, Non-nuclear attractor of electron density as a manifestation of the solvated electron, J. Chem. Phys., 2007, 127, 064108 CrossRef PubMed.
- D. M. Camaioni, B. Ginovska-Pangovska, G. K. Schenter, S. M. Kathmann and T. Autrey, Analysis of the Activation and Heterolytic Dissociation of H2 by Frustrated Lewis Pairs: NH3/BX3 (X = H, F, and Cl), J. Phys. Chem. A, 2012, 116, 7228 CrossRef CAS PubMed.
- J. S. Murray and P. Politzer, Interaction and Polarization Energy Relationships in σ-Hole and π-Hole Bonding, Crystals, 2020, 10, 76 CrossRef.
- A. Kumar, S. R. Gadre, N. Mohan and C. H. Suresh, Lone Pairs: An Electrostatic Viewpoint, J. Phys. Chem. A, 2014, 118, 526 CrossRef CAS PubMed.
- V. V. Rybkin and J. VandeVondele, Spin-Unrestricted Seccond-Order Mlller-Plesset (MP2) Forces for the Condensed Phase: From Molecular Radicals to F-Centers in Solids, J. Chem. Theory Comput., 2016, 12, 2214 CrossRef CAS PubMed.
- A. J. Alexander, Ultraviolet and visible crystalloluminescence of sodium chloride, J. Chem. Phys., 2012, 136, 064512 CrossRef PubMed.
- S. R. Gadre and R. N. Shirsat, Electrostatics of Atoms and Molecules, Universities Press (India) Limited, 2000 Search PubMed.
- Chemical Applications of Atomic and Molecular Electrostatic Potentials: Reactivity, Structure, Scattering, and Energetics of Organic, Inorganic, and Biological Systems, ed. P. Politzer and D. G. Truhlar, Springer Science + Business Media, New York, 1981 Search PubMed.
- P. Politzer and J. S. Murray, Electrostatic potentials at the nuclei of atoms and molecules, Theor. Chem. Acc., 2021, 140, 7 Search PubMed.
- Molecular Electrostatic Potentials, ed. J. S. Murray and K. Sen, Elsevier, Netherlands, 1996 Search PubMed.
- D. P. Shelton, Electric field of Ions in solution probed by hyper-Raleigh scattering, J. Chem. Phys., 2009, 130, 114501 CrossRef PubMed.
- E. O. Fetisov, C. J. Mundy, G. K. Schenter, C. J. Benmore, J. L. Fulton and S. M. Kathmann, Nanometer-Scale Correlations in Aqueous Salt Solutions, J. Chem. Phys. Lett., 2020, 11, 2598 CrossRef CAS PubMed.
- J.-C. Zheng, Y. Zhu, L. Wu and J. W. Davenport, On the sensitivity of electron and X-ray scattering factors to valence charge distributions, J. Appl. Crystallogr., 2005, 38, 648 CrossRef CAS.
- R. F. Stewart, On The Mapping of Electrostatic Properties From Bragg Diffraction Data, Chem. Phys. Lett., 1979, 65, 335 CrossRef CAS.
- B. B. Iversen, F. K. Larsen, A. A. Pinkerton, A. Martin, A. Darovsky and P. A. Reynolds, Accurate charge densities in days - use of synchrotrons, image plates and very low temperatures, Acta Crystallogr., Sect. B: Struct. Sci., 1999, 55, 363 CrossRef PubMed.
- L. M. Peng, Electron atomic scattering factors and scattering potentials of crystals, Micron, 1999, 30, 625 CrossRef CAS.
- N. F. Mott, The scattering of Electrons by Atoms, Proc. R. Soc. London, Ser. A, 1930, 127, 658 CAS.
- H. Bethe, Zur Theorie des Durchgangs schneller Korpuskularstrahlen durch Materie, Ann. Phys., 1930, 397, 325 CrossRef.
- J. C. H. Spence, On the accurate measurement of structure-factor amplitudes and phases by electron diffraction, Acta Crystallogr., Sect. A: Found. Crystallogr., 1993, 49, 231 CrossRef.
- K. Hermansson, A simulated X-ray diffraction study of liquid water: beyond the spherical-atom approximation, Chem. Phys. Lett., 1996, 260, 229 CrossRef CAS.
- M. A. Spackman, P. G. Byrom, M. Alfredsson and K. Hermansson, Influence of intermolecular interactions on multi-pole refined electron densities, Acta Crystallogr., Sect. A: Found. Crystallogr., 1999, 55, 30 CrossRef PubMed.
- C. Davisson and L. H. Germer, Diffraction of Electrons by a Crystal of Nickel, Phys. Rev., 1927, 3o, 705 CrossRef.
- D. Gabor, Microscopy by reconstructed wave-fronts, Proc. R. Soc. London, Ser. A, 1949, 197, 454 Search PubMed.
- G. G. Dvoryankina, V. F. Dvoryankin and A. G. Petrov, Calculation of the Atomic Scattering Factors of Fast Electrons at Zero Angle of Incidence of an Electron Beam and Mean Inner Crystal Potentials, Crystallogr. Rep., 2008, 53, 187 CrossRef CAS.
- R. C. Remsing, M. D. Baer, G. K. Schenter, C. J. Mundy and J. D. Weeks, The Role of Broken Symmetry in Solvation of a Spherical Cavity in Classical and Quantum Water Models, J. Phys. Chem. Lett., 2014, 5, 2767 CrossRef CAS PubMed.
- M. N. Yesibolati, S. Lagana, H. Sun, S. M. K. T. Beleggia, M. Kathmann and K. Mllhave, Mean Inner Potential of Liquid Water, Phys. Rev. Lett., 2020, 124, 065502 CrossRef CAS PubMed.
- C. Schran, O. Marsalek and T. E. Markland, Unravelling the influence of quantum proton delocalization on electronic charge transfer through the hydrogen bond, J. Phys. Chem. Lett., 2017, 678, 289 CrossRef CAS.
- L. R. Pratt, Contact potentials of solution interfaces: Phase equilibrium and interfacial electric fields, J. Phys. Chem., 1992, 96, 25 CrossRef CAS.
- B. A. Pethica, Are electrostatic potentials between regions of different chemical com- position measurable? The Gibbs–Guggenheim principle reconsidered, extended and its consequences revisited, Phys. Chem. Chem. Phys., 2007, 9, 6253 RSC.
- J. Lyklema, Interfacial potentials: Measuring the immeasurable, Substantia, 2017, 1, 75 Search PubMed.
- Y. Shi and T. L. Beck, Absolute ion hydration free energy scale and the surface potential of water via quantum simulation, Proc. Natl. Acad. Sci. U. S. A., 2020, 117, 30151 CrossRef CAS PubMed.
- S. J. Cox and P. L. Geissler, Interfacial ion solvation: Obtaining the thermodynamic limit from molecular simulations, J. Chem. Phys., 2018, 148, 222823 CrossRef PubMed.
- T. T. Duignan, S. M. Kathmann, G. K. Schenter and C. J. Mundy, Toward a First-Principles Framework for Predicting Collective Properties of Electrolytes, Acc. Chem. Res., 2021, 54, 2833 CrossRef CAS PubMed.
- T. Adel, J. Velez-Alvarez, A. C. Co and H. C. Allen, Circuit Analysis of Ionizing Surface Potential Measurements of Electrolyte Solutions, J. Electrochem. Soc., 2021, 168, 016507 CrossRef CAS.
- H. Lichte, Electron Holography: phases matter, Microscopy, 2013, 62(suppl. 1), S17–S28 CrossRef PubMed.
| This journal is © the Owner Societies 2021 |

