Coherent internal conversion from high lying electronic states to S1 in boron-dipyrromethene derivatives†
Changmin
Lee‡§
 ,
Kiho
Seo‡
,
Munnyon
Kim
and
Taiha
Joo
,
Kiho
Seo‡
,
Munnyon
Kim
and
Taiha
Joo
 *
*
Department of Chemistry, Pohang University of Science and Technology (POSTECH), Pohang, 37673, South Korea. E-mail: thjoo@postech.ac.kr
First published on 16th October 2021
Abstract
Internal conversion is the first step after photoexcitation to high lying electronic states, and plays a central role in many photoinduced processes. In this report, we demonstrate a truly ultrafast internal conversion (IC) in large molecules by time-resolved fluorescence (TF). Following photoexcitation to the Sn (n ≥ 2) state, TF of the S1 state was recorded for two boron-dipyrromethene (BODIPY) derivatives in solution. IC to S1 takes place nearly instantaneously within 20 fs for both molecules. Abundant nuclear wave packet motions in the S1 state are manifest in the TF signals, which demonstrates that the IC in these BODIPY molecules is coherent with respect to most of the vibrational modes. Theoretical calculations assuming impulsive IC to S1 account for the wave packet dynamics accurately.
1. Introduction
Upon photoexcitation of a molecule from the ground state to higher electronic states Sn (n ≥ 2), ultrafast internal conversion (IC) to S1 occurs in much less than 1 ps to result in emission from the S1 state exclusively, which is known as Kasha's rule.1 Features of the IC process such as the IC rate, reaction coordinate, association with a conical interaction,2,3 and ergodicity4,5 are of prime importance towards elucidating and manipulating photophysical properties of molecules.For an impulsive photoexcitation to Sn, that is, the pulse duration is shorter than the periods of vibrations, coherent nuclear wave packets (NWPs) can be generated in S1 as well as Sn. The NWPs in S1 following an ultrafast IC have been observed by time-resolved photoelectron spectroscopy,3,4 pump–probe transient absorption (TA),6–8 and time-resolved fluorescence (TF).9 Direct observation of such NWP motions in excited states may provide valuable information on the reaction coordinate of the IC and vibronic coupling between excited electronic states.7 For a direct photoexcitation to S1, the amplitude of a NWP in S1 depends on the displacement (d) between the potential energy surfaces (PESs) of the ground (G) and S1 states along the vibrational mode. For a photoexcitation to Sn, however, the amplitude of a NWP in S1 is determined by the PESs of G, S1, and Sn. The IC rate also affects the amplitudes of NWPs. In the limit of IC occurring much faster than a vibrational period, amplitude of the NWP should be the same as that of direct photoexcitation to S1 because the IC itself acts as an impulsive excitation to S1 with respect to the nuclear motion.10
Accurate measurements of the IC rate and the NWPs in S1 following photoexcitation to Sn provide valuable information concerning vibronic coupling and the role of IC in a photochemical reaction. In particular, relative rates of the IC and intramolecular vibrational energy redistribution (IVR) processes may have a profound effect on chemical reactions and their mechanisms.5 Although dynamics of the NWPs can be observed directly by various time-resolved techniques, TF with a time-resolution higher than the vibrational periods of interest is the most direct and unambiguous way, because TF probes excited-state dynamics of an emitting state exclusively, whereas TA and other methods based on resonant nonlinear spectroscopies may be complicated due to multiple contributions from ground-state bleach, stimulated emission, excited-state absorption, and product absorption. Moreover, the amplitude of NWP oscillation present in a TF signal can be calculated because it is proportional to the Huang–Rhys factor (D) between G and S1 states (for D ≪ 1), whose structures and vibrational modes can be calculated generally accurately by quantum chemistry. However, in a TA experiment, where excited state absorption is usually employed for the measurement of the NWPs in S1, their amplitudes are determined by D between S1 and higher-lying electronic states that are usually unknown and difficult to calculate.
In this work, we have investigated the IC and NWPs in the S1 state of boron-dipyrromethene (BODIPY) derivatives following photoexcitation to the S2 (or S3) state. Because of their favorable spectroscopic characteristics such as large extinction coefficient, high quantum yield, narrow linewidth, and tunability by structural modification, BODIPY compounds have wide applications in biological imaging,11 laser dyes, luminescent switches and sensors,12 light harvesting antenna systems13 and photovoltaic devices.14 Because BODIPY dyes are relatively nonpolar in both ground and S1 states, their spectroscopic properties are not much sensitive to the choice of solvent. BODIPY compounds in general do not form aggregates as well.15 These attributes make BODIPY dyes an excellent model system for the study of IC and excited state dynamics.
Most of the molecules exhibit IC times less than 100 fs, notable exceptions are Zn–tetraphenylporphyrin16 and azulene.17 Some BODIPY dyes that have a cyclic ring in position 8 show slow S2–S1 IC times in the range of 100 fs to a few hundred femtoseconds.18,19 A BODIPY derivative, 2,6-diethyl-1,3,5,7-tetramethyl-8-phenyl-4-difluorobora-3a,4a-diaza-(s)-indacene also shows the IC time between 100 and 230 fs depending on solvents.20 In this work, two BODIPY compounds PM597 and PM650, whose structures are shown in Fig. 1, were employed. The lifetime of the S1 state of PM597 is ca. 4 ns, and it is constant in all solvents,15 whereas that of PM650 shortens from 4 to 2 ns in polar solvents due to intramolecular charge transfer.21 By taking advantage of the high time resolution TF apparatus, we observed the fluorescence from S2 directly and the NWPs in the S1 state following the photoexcitation to the Sn state to establish the ultrafast IC rates accurately for these compounds and to get insight on coupling between excited electronic states. Note that observation of the S2 fluorescence by no means implies breakdown of Kasha's rule. During the short (≪100 fs) period of time residing in the S2 state, the molecule emits strongly with an intensity which is proportional to the oscillator strength of the S2 state. NWPs in S1 were also obtained by direct photoexcitation to S1, and compared with those formed by photoexcitation to S2 followed by IC.
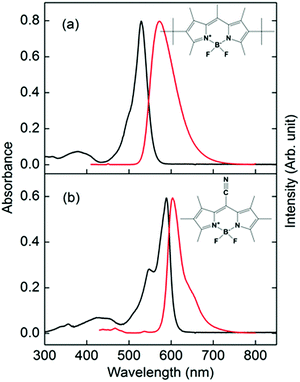 | ||
| Fig. 1 Absorption (black lines, left axis) and fluorescence (red lines, right axis) spectra of (a) PM597 and (b) PM650 in cyclohexane. Molecular structures of PM597 and PM650 are also shown. | ||
2. Experiment
The light source and TF apparatus utilizing fluorescence up-conversion by the sum frequency generation (SFG) method have been described in detail elsewhere.22,23 A home-built cavity-dumped Ti:sapphire laser was used for the excitation of the Sn (n ≥ 2) state. Pump pulses at 400 nm (PM597) and 415 nm (PM650) were generated by the second harmonic generation (SHG) in a 100 μm thick beta-barium borate (BBO) crystal, and the residual fundamental laser pulses were used as gate pulses. SFG of the fluorescence and the gate pulse was carried out by using a 100 μm thick BBO crystal. The instrument response function (IRF) estimated by the SFG of the scattered pump pulse and the gate was 50 fs FWHM (full width at half-maximum). For the direct photoexcitation of the S1 state, a home-built cavity-dumped optical parametric oscillator (OPO) employing a periodically poled lithium niobate (PPLN) as a gain medium was used to generate the fundamental pulses centered at 1100 nm.24 The PPLN crystal was pumped by a femtosecond Ti:sapphire laser (Tsunami, Spectra-Physics), which provided 1.8 W at 800 nm at a repetition rate of 81.5 MHz. Because pulse duration of the OPO output at 1100 nm was 70 fs, which was too long to measure NWPs, a pulse compression scheme employing a photonic crystal fiber was used to attain a pulse duration of ∼25 fs. For the TF experiment, pump pulses at 550 nm were generated by the SHG using a 100 μm thick BBO crystal. The IRF was estimated to be 35 fs FWHM using the SFG of the scattered pump pulse and the gate (1100 nm). The shape of the IRF was non-Gaussian (Fig. S1, ESI†). In actual TF experiments, where fluorescence wavelengths are longer than those of the pump pulses, the time-resolution should be higher because of the smaller group velocity mismatch in the SFG between the fluorescence and the gate. All TF measurements were performed at the magic angle configuration. For TF spectra measurements, the phase matching angle of the BBO crystal for SFG and monochromator were controlled simultaneously.25 Time delay was also controlled at the same time to compensate the group velocity dispersion (GVD) introduced by the sample solution (100 μm) and the exit window of the flow cell (1.25 mm). Time resolution of the TF spectra measurement was estimated to be 60 fs. Time-zeros in TF signals and TF spectra were determined by a method reported previously.25 We first determined time zero by the cross-correlation between the gate and scattered pump pulses. Time-zeroes at other detection wavelengths were calculated by considering GVD of the materials in the optical path for fluorescence light. The uncertainty of time-zero depends on the fluorescence wavelengths, and is estimated to be ±5 fs.High purity PM597 and PM650 dyes were purchased from Exciton Inc., and used without further purification. Because of the small extinction coefficients of the S2 transitions, the concentration of ca. 3 × 10⁻³ M was used for the TF experiment, which gives an absorbance of ∼0.2 at the excitation wavelength. Aggregation was not observed for the concentration used in this work as judged from the absorption and fluorescence spectra. Steady-state fluorescence spectra were recorded with a laser excitation at 400 nm and a CCD detector (Princeton Instruments). All the measurements were carried out at ambient temperature.
To obtain the vibrational reorganization energies for the electronic transitions, quantum chemical calculations were performed in gas phase by using the Gaussian 09 software package.26 Density functional theory (DFT) and time-dependent DFT (TDDFT) methods were used for the geometry optimizations and vibrational frequencies of the ground and excited states, respectively. Several functionals were tested for consistency, and we employed a functional CAM-B3LYP27 with 6-31+G(d,p) basis for DFT and TDDFT calculations.28,29 The Hartree–Fock configuration-interaction singles (HF-CIS) method was used for the calculation of the vibrational reorganization of the S2 state of PM597 because we were not able to obtain optimized geometries of the S2 state by using the TDDFT method.
3. Results
Absorption and fluorescence spectra of PM597 and PM650 in cyclohexane are shown in Fig. 1 together with their molecular structures. The spectra of PM597 in polar solvents methanol and acetonitrile are blue-shifted slightly implying larger dipole moment in the ground state (4.2 D) than S1 (3.7 D),15 whereas the fluorescence spectrum of PM650 in methanol shows a small red-shift.21 The Stokes shifts are small indicating minimal solvation contribution for the two BODIPY dyes in the S1 state, although dynamic Stokes shift due to solvation was observed for BODIPY dyes in a 2-dimensional electronic spectroscopy process.30 Because of the electron withdrawing property of the cyano group, both the absorption and fluorescence maxima of PM650 are red-shifted compared to PM597.31 The absorption bands attributable to S2 and higher electronic states are apparent at around 390 and 430 nm for PM597 and PM650, respectively. Therefore, wavelengths of the pump pulses were chosen to be 400 and 415 nm for PM597 and PM650, respectively, for the TF experiments. The pump pulses should excite predominantly the S2 state for both dyes, although minor contribution of the S3 state cannot be excluded considering the transition frequencies and oscillator strengths of the S3 state (Table S1, ESI†).3.1. IC dynamics
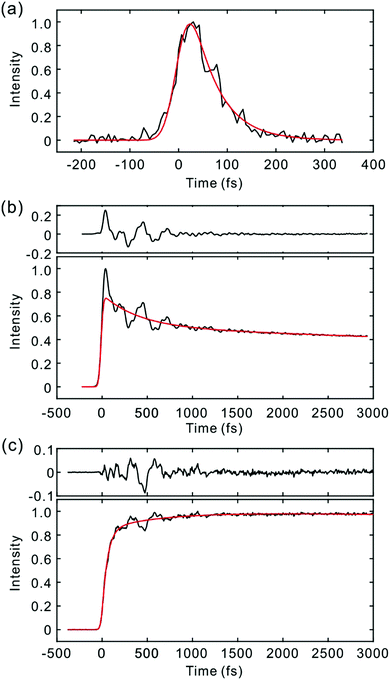
Fig. 2 and 3 show the TF signals of PM597 and PM650 in cyclohexane recorded at the emission wavelengths of S1 and S2 states following the photoexcitation to S2. The pump pulse may lead to the excitation of the high-lying vibrational manifold of the S1 state. However, Huang–Rhys factors, which represent the average vibrational excitation in the excited state (S1), are much smaller than 1 for all vibrational modes of both PM597 and PM650 except for a couple of low frequency modes (Table S2, ESI†). In addition, total vibrational reorganization energies are 616 and 512 cm−1 for PM597 and PM650, respectively. Therefore, considering that the difference of the excitation pulse energy and the S1 fluorescence energy is >8000 cm−1, the probability of exciting the high-lying vibrational manifold of the S1 state is practically zero, and the pump pulses lead to excitation to the Sn (n ≥ 2) state. The TF signals of the S1 state at a longer time range are shown in Fig. 4. We were unable to record the TF of S2 fluorescence of PM650, possibly because the IC is still too fast to be measured even at 50 fs time resolution. Previous studies on the IC of BODIPY derivatives suggest that the IC times are between 100 fs and a few hundred femtoseconds.18–20 Some of the reported IC times are estimations rather than accurate measurements because of the limited time resolution. The TF signals were fitted to a sum of exponentials, and the results are summarized in Table 1.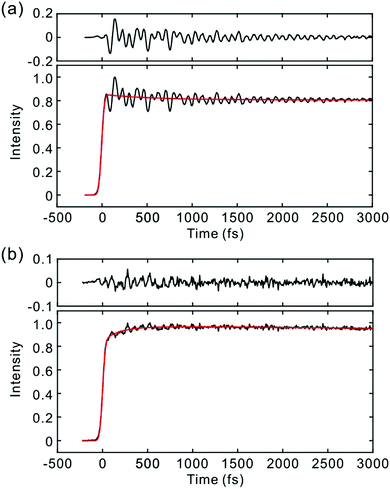 | ||
| Fig. 3 TF signals of the S1 state of PM650 in cyclohexane detected at (a) 590 nm and (b) 652 nm. Exponential fits (red lines) are shown together with the residuals. | ||
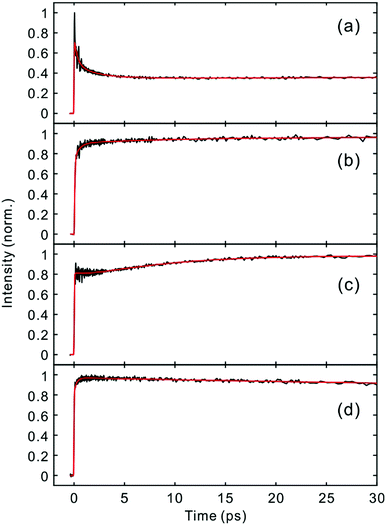 | ||
| Fig. 4 Time-resolved fluorescence signals of the S1 state in the longer time range. (a) PM597, 543 nm; (b) PM597, 630 nm; (c) PM650, 586 nm; (d) PM650, 652 nm. | ||
| λ det (nm) | A 1 | τ 1 (fs) | A 2 | τ 2 (ps) | A 3 | τ 3 (ps) | A 4 | τ 4 (ns) | |
|---|---|---|---|---|---|---|---|---|---|
| PM597 | 450 | 1 | 51 | ||||||
| 543 | 0.31 | 350 | 0.19 | 2.2 | −0.03 | 44 | 0.47 | 4 | |
| 630 | −0.44 | 57 | −0.08 | 0.53 | −0.03 | 15 | 0.45 | 4 | |
| PM650 | 586 | 0.07 | 2100 | −0.20 | 8.5 | 0.73 | 4 | ||
| 652 | −0.14 | 240 | 0.20 | 98 | 0.66 | 4 | |||
The S2 fluorescence of PM597 at 450 nm decays by a time constant of 51 ± 10 fs. Interestingly however, the S1 fluorescence at 550 nm rises immediately within the IRF, although the TF of S1 at 630 nm reveals a rise time of 57 fs. The rise at 630 nm is caused by the dynamic Stokes shift arising from the vibrational relaxation within the manifold of the S1 PES and to a minor part solvation dynamics as shown by the TF spectra (Fig. 5). Note that nonpolar solvation dynamics in 100 fs to picoseconds time scale is also significant.32,33 The inconsistency of the lifetimes, that is, the decay of S2 is slower than the rise of S1, may be interpreted by a distribution of IC rates. Because of the broad spectral width of the femtosecond excitation pulses, the distribution of vibrational states and/or conformations may be created in S2. Provided they undergo IC at different rates, nearly instantaneous for the major part and slowly at 51 fs for the minor part, S2 decay could be slow, whereas the rise of S1 could be nearly instantaneous. Alternatively, the 51 fs decay of the S2 state may represent internal conversion from S2 to the ground state for a small portion of molecules for which the ultrafast IC to S1 is not feasible. The integrated intensity of S1 fluorescence does not show the 51 fs rise, suggesting that the latter may be more probable (vide infra).
The TFs of PM650 show instrument-limited rise at all detection wavelengths. Absence of the S2 fluorescence and instrument-limited rise of S1 fluorescence indicate that the IC of PM650 proceeds nearly instantaneously. We set the upper-limit to 20 fs for the instantaneous IC pathway for PM597 and PM650 from a numerical simulation of the convolution between the IRF and an exponential decay. Note that we were able to determine decay times less than 20 fs with the current TF apparatus.10,34 The TFs of PM650 show an uncharacteristic rise at the blue side and a decay at the red side of the fluorescence spectrum on the picosecond time scale as shown in Fig. 4 (Table 1).
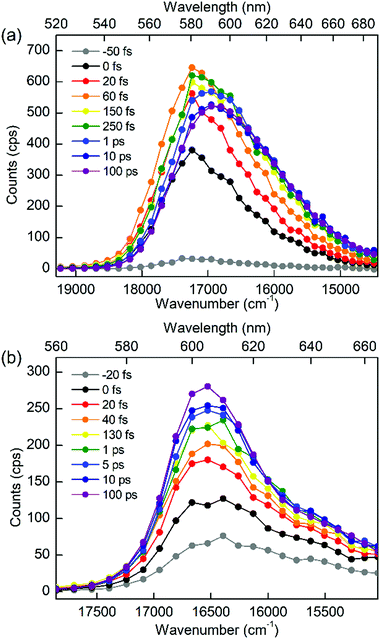
To discriminate the IC dynamics from other processes that cause spectral relaxation such as solvation dynamics, vibrational relaxation, and IVR, TF spectra were recorded over the full spectral region of interest at 60 fs time resolution. Fig. 5 shows the TF spectra of PM597 and PM650 in cyclohexane. Area normalized TF spectra (Fig. S2, ESI†) together with the first moments (Fig. S3 and S4, ESI†) and integrated intensities (Fig. S5 and S6, ESI†) of the TF spectra are also shown in the ESI.† TF spectra of both PM597 and PM650 clearly show that the S1 fluorescence bands rise immediately following photoexcitation to Sn (n ≥ 2) over the full emission wavelength region, which demonstrates that the IC occurs within 20 fs for both dyes. The IC kinetics of PM597 and PM650 are summarized schematically in Fig. 6.
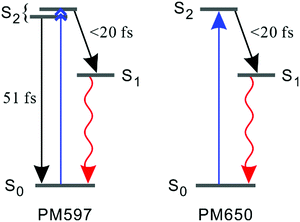 | ||
| Fig. 6 Schematic representation of the kinetics following photoexcitation to the S2 state. The black and red arrows indicate internal conversion and fluorescence, respectively. | ||
The TF spectra of PM597 show redshift in femtosecond to picosecond time scales due to the vibrational relaxation in the S1 manifold and solvation as inferred from the TF signals above. Integrated fluorescence intensities (Fig. S5, ESI†), however, do not exhibit the 51 fs time component observed in the TF of S2, which suggests that the 51 fs decay of S2 may represent the internal conversion directly to the ground state. The TF spectra of PM650 display a blue shift in picosecond time scale along with a slight increase of the integrated fluorescence intensity. Sajadi and Ernsting reported that a molecule with large excess vibrational energy undergoes excess dynamic Stokes shift beyond the stationary state followed by a blue-shift on 10 ps time scale.35 This effect was observed only in PM650 because of the larger excess vibrational energy and its narrower emission spectrum. In addition, this effect is smaller in polar solvent methanol (data not shown), which is also consistent with the previous report.35 The origin of the minor increase of the integrated fluorescence intensity, however, is not clear.
3.2. Nuclear wave packets in S1
The TFs of S1 states show strong oscillations for both molecules, which must arise from the NWP motions in the S1 state as we measure the spontaneous fluorescence from S1 exclusively. Phases of the oscillations measured at the blue and red sides of the fluorescence spectrum are 180° out of phase for both PM597 and PM650. This is a clear indication that the modulation of the TF intensity at a fixed wavelength is caused by the modulation of the fluorescence center frequency in time. When the non-Condon effect is dominant as in the S1 transition of cis-stilbene, where a pronounced non-Condon effect was observed,36 phases at the blue and red sides of the fluorescence spectrum should be in phase, and the amplitude of the NWP should be constant at all wavelengths for the vibrational mode.In a simple displaced harmonic oscillator model with the Condon approximation, modulation of the TF intensity by a classical NWP is
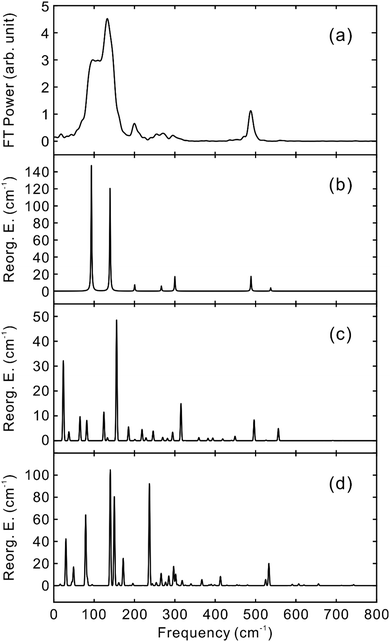
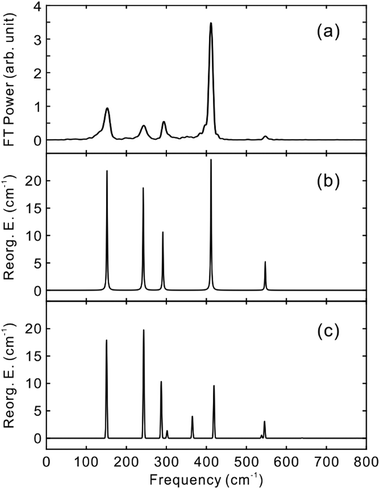
To obtain the vibrational spectrum of the S1 state (VSS1) from each TF signal, the residual in Fig. 2 and 3 was analyzed by the linear prediction singular value decomposition (LPSVD) method38,39 as well as the Fourier transform, because Fourier power transform can be very misleading when peaks overlap.40 The results are shown in Fig. 7 and 8, and the vibrational modes below 800 cm−1 in S1 are listed in Table 2. In contrast to a TA signal, in which an oscillation may originate from NWP motions in both the ground and excited electronic states,41 the oscillations observed in the TF must arise from the emitting state here S1. For the vibrational analyses, we used TFs measured at the half height point of the short wavelength side of the fluorescence spectra, where the oscillation amplitudes are the highest and not mixed with the rise component seen at the long detection wavelengths. The VSS1 of PM597 and PM650 show peaks up to 600 cm−1. According to the convolution of a Gaussian IRF and a sinusoid, amplitude of the oscillation is attenuated by exp(−ω2σ2/2), where ω is the oscillation frequency and σ is the standard deviation of the Gaussian.37 At 50 fs time resolution, amplitude of a 500 cm−1 mode is attenuated by a factor of 7.4.
| Modea | Experiment | Calculation | ||||
|---|---|---|---|---|---|---|
| ω (cm−1) | λ vib (cm−1) | T 2 (fs) | ω (cm−1) | λ vib (cm−1) | ||
| a Vibrational mode number of the S1 state. | ||||||
| PM597 | ν7 | 93 | 168 | 300 | 83 | 8.6 |
| ν11 | 139 | 154 | 390 | 158 | 59 | |
| ν14 | 201 | 11 | 1050 | 188 | 7.3 | |
| ν22 | 267 | 12 | 770 | 250 | 6.3 | |
| ν30 | 306 | 30 | 390 | 320 | 33 | |
| ν47 | 489 | 115 | 930 | 504 | 60 | |
| ν51 | 540 | 31 | 620 | 565 | 58 | |
| PM650 | ν13 | 152 | 26 | 790 | 153 | 21 |
| ν18 | 243 | 30 | 580 | 247 | 32 | |
| ν22 | 292 | 22 | 1000 | 292 | 20 | |
| ν27 | — | — | — | 371 | 12 | |
| ν30 | 412 | 93 | 1400 | 425 | 39 | |
| ν36 | 548 | 55 | 1200 | 554 | 33 | |
To fully account for the VSS1 following the ultrafast IC, a fully quantum chemical nonadiabatic molecular dynamics simulation utilizing PESs of the S1 and S2 states as well as the ground state is required. Instead, we calculated Huang–Rhys factors and vibrational reorganization energies between the ground and S1 to account for the VSS1 and to explore the vibrational modes that may contribute to the IC process. This approach was quite successful for the description of the NWPs in a product PES following ultrafast proton transfer and charge transfer reactions.10,42
Molecular structures and normal modes of the ground and S1 states were obtained by DFT and TDDFT methods, respectively, and a difference vector between the geometries of the ground and S1 states was projected onto the normal modes of S1 to calculate the Huang–Rhys factors and vibrational reorganization energies.43 Several different functionals were evaluated for the DFT calculations, and CAM-B3LYP was chosen for both PM597 and PM650. An attempt to calculate the Huang–Rhys factors between the ground and S2 states using the DFT method was unsuccessful. Although we were able to calculate the Huang–Rhys factors by the HF and HF-CIS methods for PM597, the calculated spectrum shown in Fig. 7(d) does not match well with the experiment. The calculated VSS1 scaled by the attenuation factors are also shown in Fig. 7(c) and 8(c). All the vibrations below 800 cm−1 that have large vibrational reorganization energies (>10 cm−1) are listed in Table 2. At this level of theory, the calculated VSS1 of PM650 shows quantitative match with the experiment, whereas the agreement is moderate for PM597. Assignment of the peaks is mostly straightforward, except the one at 267 cm−1 of PM597, by taking advantage of the amplitude information, and they are listed in Table 2 as well. The Raman spectrum of PM597 (Fig. S7, ESI†) shows two peaks at 503 and 567 cm−1, which can be assigned to the two strong vibrational modes ν47 and ν51, respectively.
To investigate the influence of the IC dynamics, VSS1 of the two dyes were measured by direct photoexcitation of S1 states. Fig. 9 and 10 show the TFs of PM597 and PM650, respectively, and their VSS1 by Fourier power transform and LPSVD. The VSS1 of PM597 shows strong peaks at 90 and 130 cm−1, and small peaks at 273 and 486 cm−1. The VSS1 of PM650 shows peaks at 145, 245, 292, 413, and 543 cm−1. The peak positions match well with those of VSS1 obtained by photoexcitation of S2, as they should be. Peak intensities in the high frequency region, however, are somewhat different. We suspect that the intensity difference arises in part due to the difference of the detection wavelengths and excitation wavelengths. The two VSS1 obtained by the photoexcitation of S1 and S2 states, however, generally show excellent match. This observation is consistent with the ultrafast IC. Because the IC is faster than 20 fs, the IC itself acts as an impulsive excitation to S1 with respect to the vibrational modes below 600 cm−1.
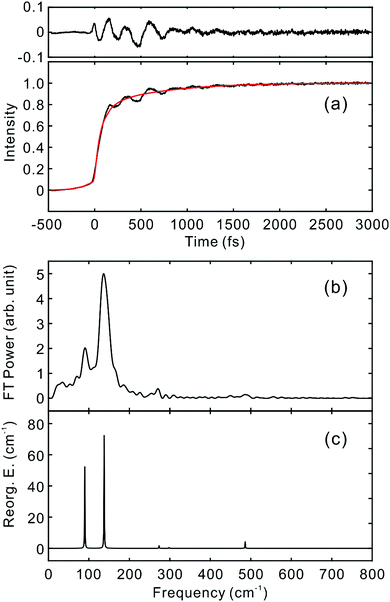 | ||
| Fig. 9 (a) TF for PM597 excited at 550 nm, and detected at 650 nm (S1). VSS1 of PM597 obtained by (b) Fourier transform power spectrum and (c) LPSVD. | ||
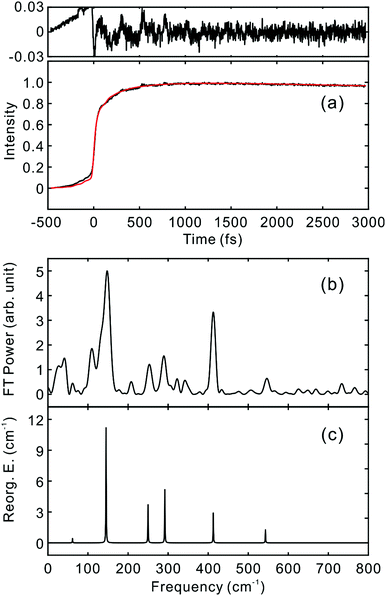 | ||
| Fig. 10 (a) TF for PM650 excited at 550 nm, and detected at 650 nm (S1). VSS1 of PM650 obtained by (b) Fourier transform power spectrum and (c) LPSVD. | ||
4. Discussion
The IC processes in PM597 and PM650 are truly ultrafast. Most of the BODIPY molecules should also exhibit ultrafast IC times, although some BODIPY dyes that have a cyclic ring in position 8 show slower S2–S1 IC times in the range of 100 fs to a few hundred femtoseconds.18–20 We were unable to resolve the IC time even with the best time resolution ever reported in TF measurements, and we set the upper bound to 20 fs. Thus, the IC is certainly coherent with respect to the molecular vibrations, and it occurs much faster than most of the time scales occurring in a molecule including IVR and vibrational relaxation in an electronic excited state.The excellent agreement between the experimental VSS1 following S2 excitation and the calculated vibrational reorganization energies between the ground and S1 states implies that the passage through the S2 state may have a minor role in the NWPs in the S1 state for these two BODIPY dyes. Because the IC is faster than the period of molecular vibrations observed in this work, the IC itself can be treated as an impulsive excitation from the ground to the S1 state. The similarity of the two VSS1 obtained by the excitation of S1 and S2 states corroborates this conclusion.
All the vibrational modes that appear strongly in the VSS1 of PM650 are in-plane ring skeletal (stretching) vibrations. Quantum chemical calculation indicates that most of the structural change from the ground state to the S1 state occurs in the C–C and C–N bond lengths within the ring. Dihedral angles within the ring are all 180° in both ground and S1 states showing that the molecule is planar. Consequently, provided the overall transition from the ground to S1 state via S2 is fast enough to be impulsive on the vibrations, only the in-plane ring skeletal vibrations acquire large Huang–Rhys factors for the transition, and appear strongly in the VSS1 of S1. Quantitative agreement between the experiment and theory corroborates this conclusion.
The VSS1 of PM597 is also comprised of in-plane modes except the rather small amplitude ν22, although several out-of-plane and mixed modes such as ν8, ν11, and ν22 appear strongly in the calculation. In particular, the out-of-plane ν11 mode that possesses large vibrational reorganization energy in the calculation is absent in the experimental VSS1. Quantum chemical calculation shows that the dihedral angles as well as the C–C and C–N bond lengths within the ring change due to the transition from the ground state to the S1 state. The average dihedral angles within the ring are 174.8° for both ground and excited states, and they change by 2.4° on average and as much as 7° during the transition, which leads to the strong presence of the out-of-plane modes in the calculated spectrum. The discrepancy may be accounted for in two ways. First, the calculated structures by the DFT method, particularly the excited state, may not be accurate enough. In a recent study for the determination of the tetrahydrofuran cation structure by mass-analyzed threshold ionization (MATI) spectroscopy, experimental and calculated Franck–Condon factors did not match. Minor tuning of the structure of the cation calculated by the DFT method successfully reproduced experimental Franck–Condon factors.44 Secondly, the dynamics in the S2 state may play a role. If this is true, Huang–Rhys factors for the initial photoexcitation from the ground state to the S2 state are needed to properly account for the VSS1 of PM597. Unfortunately, however, such information is not available currently because of the lack of an accurate method of calculation of high lying electronic states.
Involvement of the S2 → S1 IC to the wave packets in S1 can be verified by comparing their phases resulting from the excitation of S2 or direct excitation of S1. The phases of a vibrational mode obtained by the two different ways (Table S3, ESI†) are similar, but their equivalence cannot be concluded because of the differences in experimental parameters such as pulse duration and detection wavelength. For this problem of ultrafast internal conversion to S1, we believe that a high-level non-adiabatic molecular dynamics (NAMD) simulation is required to reveal in detail the role of the IC including phase changes, which is beyond the scope of the current work.
5. Conclusions
We have established that the S2 → S1 IC in two BODIPY molecules is faster than 20 fs by employing time resolved spontaneous fluorescence. Abundant nuclear NWP motions in the S1 state are also directly observed through modulation of intensities of spontaneous time-resolved fluorescence. It is well known that IC between excited states is ultrafast for molecules in liquids. However, it is critical to determine if it is really ultrafast in terms of IVR and periods of vibrations. Considering that the period of a vibration of 1000 cm−1 mode is 33 fs and that IVR usually proceeds in 100 fs time scale, one may argue that a process is ultrafast if it is faster than these time scales. In this sense, the IC process reported in this work is ultrafast. Accordingly, the IC is coherent and impulsive with respect to the nuclear motions. Theoretical model calculations assuming that the overall process from the ground state to the S1 state via S2 is impulsive on the vibrations were largely successful. However, full account and implications of the NWP motions in the S1 state following IC from higher electronic states await accurate information on the Sn (n ≥ 2) state, which is hardly available at present.Conflicts of interest
There are no conflicts to declare.Acknowledgements
This work was supported by the National Research Foundation of Korea (NRF) grant funded by the Korea government (MSIT) (No. 2019R1A2C2010445 and 2020R1A5A1019141).References
- M. Kasha, Discuss. Faraday. Soc., 1950, 9, 14–19 RSC.
- T. Horio, T. Fuji, Y.-I. Suzuki and T. Suzuki, J. Am. Chem. Soc., 2009, 131, 10392–10393 CrossRef CAS PubMed.
- Y.-I. Suzuki, T. Fuji, T. Horio and T. Suzuki, J. Chem. Phys., 2010, 132, 174302–174308 CrossRef PubMed.
- T. S. Kuhlman, T. I. Sølling and K. B. Møller, ChemPhysChem, 2012, 13, 820–827 CrossRef CAS PubMed.
- E. W. G. Diau, J. L. Herek, Z. H. Kim and A. H. Zewail, Science, 1998, 279, 847–851 CrossRef CAS PubMed.
- T. Fuji, H. J. Ong and T. Kobayashi, Chem. Phys. Lett., 2003, 380, 135–140 CrossRef CAS.
- J. L. P. Lustres, A. L. Dobryakov, A. Holzwarth and M. Veiga, Angew. Chem., Int. Ed., 2007, 46, 3758–3761 CrossRef PubMed.
- M. Liebel, C. Schnedermann and P. Kukura, Phys. Rev. Lett., 2014, 112, 198302 CrossRef CAS PubMed.
- S. Y. Kim and T. Joo, J. Phys. Chem. Lett., 2015, 6, 2993–2998 CrossRef CAS PubMed.
- C. H. Kim and T. Joo, Phys. Chem. Chem. Phys., 2009, 11, 10266–10269 RSC.
- T. Kowada, H. Maeda and K. Kikuchi, Chem. Soc. Rev., 2015, 44, 4953–4972 RSC.
- H. Sunahara, Y. Urano, H. Kojima and T. Nagano, J. Am. Chem. Soc., 2007, 129, 5597–5604 CrossRef CAS PubMed.
- F. D'Souza, P. M. Smith, M. E. Zandler, A. L. McCarty, M. Itou, Y. Araki and O. Ito, J. Am. Chem. Soc., 2004, 126, 7898–7907 CrossRef PubMed.
- H. Imahori, H. Norieda, H. Yamada, Y. Nishimura, I. Yamazaki, Y. Sakata and S. Fukuzumi, J. Am. Chem. Soc., 2001, 123, 100–110 CrossRef CAS PubMed.
- J. Bañuelos Prieto, F. López Arbeloa, V. Martínez Martínez, T. Arbeloa López and I. López Arbeloa, J. Phys. Chem. A, 2004, 108, 5503–5508 CrossRef.
- G. G. Gurzadyan, T. H. Tran-Thi and T. Gustavsson, J. Chem. Phys., 1998, 108, 385–388 CrossRef CAS.
- S. Murata, C. Iwanaga, T. Toda and H. Kokubun, Chem. Phys. Lett., 1972, 13, 101–104 CrossRef CAS.
- D. W. Cho, M. Fujitsuka, J. H. Ryu, M. H. Lee, H. K. Kim, T. Majima and C. Im, Chem. Commun., 2012, 48, 3424–3426 RSC.
- G. J. Hedley, A. Ruseckas, A. Harriman and I. D. Samuel, Angew. Chem., Int. Ed., 2011, 50, 6634–6637 CrossRef CAS PubMed.
- P. Toele, H. Zhang, C. Trieflinger, J. Daub and M. Glasbeek, Chem. Phys. Lett., 2003, 368, 66–75 CrossRef CAS.
- F. López Arbeloa, J. Bañuelos Prieto, V. Martínez Martínez, T. Arbeloa López and I. López Arbeloa, ChemPhysChem, 2004, 5, 1762–1771 CrossRef PubMed.
- H. Rhee and T. Joo, Opt. Lett., 2005, 30, 96–98 CrossRef PubMed.
- W. Heo, N. Uddin, J. W. Park, Y. M. Rhee, C. H. Choi and T. Joo, Phys. Chem. Chem. Phys., 2017, 19, 18243–18251 RSC.
- C. K. Min and T. Joo, Opt. Lett., 2005, 30, 1855–1857 CrossRef PubMed.
- I. Eom and T. Joo, J. Chem. Phys., 2009, 131, 244507 CrossRef PubMed.
- M. J. Frisch, G. W. Trucks, H. B. Schlegel, G. E. Scuseria, M. A. Robb, J. R. Cheeseman, G. Scalmani, V. Barone, B. Mennucci, G. A. Petersson, H. Nakatsuji, M. Caricato, X. Li, H. P. Hratchian, A. F. Izmaylov, J. Bloino, G. Zheng, J. L. Sonnenberg, M. Hada, M. Ehara, K. Toyota, R. Fukuda, J. Hasegawa, M. Ishida, T. Nakajima, Y. Honda, O. Kitao, H. Nakai, T. Vreven, J. A. Montgomery, J. E. Peralta, F. Ogliaro, M. Bearpark, J. J. Heyd, E. Brothers, K. N. Kudin, V. N. Staroverov, R. Kobayashi, J. Normand, K. Raghavachari, A. Rendell, J. C. Burant, S. S. Iyengar, J. Tomasi, M. Cossi, N. Rega, J. M. Millam, M. Klene, J. E. Knox, J. B. Cross, V. Bakken, C. Adamo, J. Jaramillo, R. Gomperts, R. E. Stratmann, O. Yazyev, A. J. Austin, R. Cammi, C. Pomelli, J. W. Ochterski, R. L. Martin, K. Morokuma, V. G. Zakrzewski, G. A. Voth, P. Salvador, J. J. Dannenberg, S. Dapprich, A. D. Daniels, Ö. Farkas, J. B. Foresman, J. V. Ortiz, J. Cioslowski and D. J. Fox, Gaussian 09, Revision B.01, Gaussian, Inc, Wallingford CT, 2010 Search PubMed.
- T. Yanai, D. P. Tew and N. C. Handy, Chem. Phys. Lett., 2004, 393, 51–57 CrossRef CAS.
- S. Chibani, B. Le Guennic, A. Charaf-Eddin, A. D. Laurent and D. Jacquemin, Chem. Sci., 2013, 4, 1950–1963 RSC.
- M. R. Momeni and A. Brown, J. Chem. Theory Comput., 2015, 11, 2619–2632 CrossRef CAS PubMed.
- Y. Lee, S. Das, R. M. Malamakal, S. Meloni, D. M. Chenoweth and J. M. Anna, J. Am. Chem. Soc., 2017, 139, 14733–14742 CrossRef CAS PubMed.
- I. Esnal, I. Valois-Escamilla, C. F. Gómez-Durán, A. Urías-Benavides, M. L. Betancourt-Mendiola, I. López-Arbeloa, J. Bañuelos, I. García-Moreno, A. Costela and E. Peña-Cabrera, ChemPhysChem, 2013, 14, 4134–4142 CrossRef CAS PubMed.
- M. L. Horng, J. A. Gardecki, A. Papazyan and M. Maroncelli, J. Phys. Chem., 1995, 99, 17311–17337 CrossRef CAS.
- B. M. Ladanyi and M. Maroncelli, J. Chem. Phys., 1998, 109, 3204–3221 CrossRef CAS.
- J. Lee, C. H. Kim and T. Joo, J. Phys. Chem. A, 2013, 117, 1400–1405 CrossRef CAS PubMed.
- M. Sajadi and N. P. Ernsting, J. Phys. Chem. B, 2013, 117, 7675–7684 CrossRef CAS PubMed.
- K. Ishii, S. Takeuchi and T. Tahara, J. Phys. Chem. A, 2008, 112, 2219–2227 CrossRef CAS PubMed.
- G. Lee, J. Kim, S. Y. Kim, D. E. Kim and T. Joo, ChemPhysChem, 2017, 18, 670–676 CrossRef CAS PubMed.
- H. Barkhuijsen, R. De Beer, W. M. M. J. Bovee and D. Van Ormondt, J. Magn. Reson., 1985, 61, 465–481 CAS.
- F. W. Wise, M. J. Rosker, G. L. Millhauser and C. L. Tang, IEEE J. Quantum Electron., 1987, 23, 1116–1121 CrossRef.
- I. Eom, E. Yoon, S.-H. Baik, Y.-S. Lim and T. Joo, Opt. Express, 2014, 22, 30512–30519 CrossRef PubMed.
- I. A. Walmsley, M. Mitsunaga and C. L. Tang, Phys. Rev. A: At., Mol., Opt. Phys., 1988, 38, 4681–4689 CrossRef PubMed.
- J. Kim, D. E. Kim and T. Joo, J. Phys. Chem. A, 2018, 122, 1283–1290 CrossRef CAS PubMed.
- J. R. Reimers, J. Chem. Phys., 2001, 115, 9103–9109 CrossRef CAS.
- S. M. Park, Y. R. Lee, D. W. Kang, H. L. Kim and C. H. Kwon, Phys. Chem. Chem. Phys., 2017, 19, 30362–30369 RSC.
Footnotes |
| † Electronic supplementary information (ESI) available: IRF of TF experiment by excitation at 550 nm, area normalized time-resolved fluorescence spectra, first moments of TF spectra vs. time, area of TF spectra vs. time, Raman spectrum of PM597 in benzene, and calculated Huang-Rhys factors and geometries. See DOI: 10.1039/d1cp03513d |
| ‡ These authors contributed equally to the work. |
| § Present address: Department of Chemistry, Northwestern University, Evanston, IL 60208, USA. |
| This journal is © the Owner Societies 2021 |

