
 Open Access Article
 This Open Access Article is licensed under a
 Creative Commons Attribution 3.0 Unported Licence
On the intersystem crossing rate in a Platinum(II) donor–bridge–acceptor triad†
G. A.
Farrow
a,
M.
Quick
b,
S. A.
Kovalenko
b,
G.
Wu
a,
A.
Sadler
a,
D.
Chekulaev
a,
A. A. P.
Chauvet
 a,
J. A.
Weinstein
*a and
N. P.
Ernsting
*b
a,
J. A.
Weinstein
*a and
N. P.
Ernsting
*b
aDepartment of Chemistry, University of Sheffield, Sheffield, S3 7HF, UK. E-mail: Julia.Weinstein@Sheffield.ac.uk
bDepartment of Chemistry, Humboldt-Universität zu Berlin, Brook-Taylor-Str. 2, 12489 Berlin, Germany. E-mail: nernst@chemie.hu-berlin.de
First published on 20th September 2021
Abstract
The rates of ultrafast intersystem crossing in acceptor–bridge–donor molecules centered on Pt(II) acetylides are investigated. Specifically, a Pt(II) trans-acetylide triad NAP–![[triple bond, length as m-dash]](https://www.rsc.org/images/entities/char_e002.gif) –Pt––Ph-CH2-PTZ [1], with acceptor 4-ethynyl-N-octyl-1,8-naphthalimide (NAP) and donor phenothiazine (PTZ), is examined in detail. We have previously shown that optical excitation in [1] leads to a manifold of singlet charge-transfer states, S*, which evolve via a triplet charge-transfer manifold into a triplet state 3NAP centered on the acceptor ligand and partly to a charge-separated state 3CSS (NAP−–Pt–PTZ+). A complex cascade of electron transfer processes was observed, but intersystem crossing (ISC) rates were not explicitly resolved due to lack of spin selectivity of most ultrafast spectroscopies. Here we revisit the question of ISC with a combination and complementary analysis of (i) transient absorption, (ii) ultrafast broadband fluorescence upconversion, FLUP, which is only sensitive to emissive states, and (iii) femtosecond stimulated Raman spectroscopy, FSR. Raman resonance conditions allow us to observe S* and 3NAP exclusively by FSR, through vibrations which are pertinent only to these two states. This combination of methods enabled us to extract the intersystem crossing rates that were not previously accessible. Multiple timescales (1.6 ps to ∼20 ps) are associated with the rise of triplet species, which can now be assigned conclusively to multiple ISC pathways from a manifold of hot charge-transfer singlet states. The analysis is consistent with previous transient infrared spectroscopy data. A similar rate of ISC, up to 20 ps, is observed in the trans-acetylide NAP––Pt––Ph [2] which maintains two acetylide groups across the platinum center but lacks a donor unit, whilst removal of one acetylide group in mono-acetylide NAP––Pt–Cl [3] leads to >10-fold deceleration of the intersystem crossing process. Our work provides insight on the intersystem crossing dynamics of the organo-metallic complexes, and identifies a general method based on complementary ultrafast spectroscopies to disentangle complex spin, electronic and vibrational processes following photoexcitation.
–Pt––Ph-CH2-PTZ [1], with acceptor 4-ethynyl-N-octyl-1,8-naphthalimide (NAP) and donor phenothiazine (PTZ), is examined in detail. We have previously shown that optical excitation in [1] leads to a manifold of singlet charge-transfer states, S*, which evolve via a triplet charge-transfer manifold into a triplet state 3NAP centered on the acceptor ligand and partly to a charge-separated state 3CSS (NAP−–Pt–PTZ+). A complex cascade of electron transfer processes was observed, but intersystem crossing (ISC) rates were not explicitly resolved due to lack of spin selectivity of most ultrafast spectroscopies. Here we revisit the question of ISC with a combination and complementary analysis of (i) transient absorption, (ii) ultrafast broadband fluorescence upconversion, FLUP, which is only sensitive to emissive states, and (iii) femtosecond stimulated Raman spectroscopy, FSR. Raman resonance conditions allow us to observe S* and 3NAP exclusively by FSR, through vibrations which are pertinent only to these two states. This combination of methods enabled us to extract the intersystem crossing rates that were not previously accessible. Multiple timescales (1.6 ps to ∼20 ps) are associated with the rise of triplet species, which can now be assigned conclusively to multiple ISC pathways from a manifold of hot charge-transfer singlet states. The analysis is consistent with previous transient infrared spectroscopy data. A similar rate of ISC, up to 20 ps, is observed in the trans-acetylide NAP––Pt––Ph [2] which maintains two acetylide groups across the platinum center but lacks a donor unit, whilst removal of one acetylide group in mono-acetylide NAP––Pt–Cl [3] leads to >10-fold deceleration of the intersystem crossing process. Our work provides insight on the intersystem crossing dynamics of the organo-metallic complexes, and identifies a general method based on complementary ultrafast spectroscopies to disentangle complex spin, electronic and vibrational processes following photoexcitation.
Introduction
Transition metal complexes (TMCs) are widely used for light-driven applications owing to their strong absorption of visible light and ensuing population of excited states of different origin and spin. In contrast to organic chromophores, transition metal complexes often populate lowest triplet excited states with high efficiency on an ultrafast timescale, due to strong spin-orbit coupling associated with the presence of a heavy atom. Intersystem crossing (ISC) thus underpins much of the photophysical and photochemical properties of TMCs and of their applications as light-harvesting units in photocatalysis, DSSC, or photodynamic therapy.1Ultrafast (femtosecond) creation of the primary excited electronic state leads to a manifold of vibrationally hot states where cooling, state- and spin-dynamics are convolved. The disentangling of the dynamics of the initially populated Franck–Condon-excited state presents a particularly difficult task. Such states are typically extremely short-lived with multiple ultrafast decay processes occurring in parallel, contrary to the frequently-used cascade model where vibrational relaxation, internal conversion and intersystem crossing are assumed to occur sequentially on different time-scales. ISC is often rapid in such systems, with lifetimes in the region of tens of femtoseconds to picoseconds.2–8
Numerous observations of ISC in metal complexes have been reported in the past two decades, containing, for example Cr,9,10 Fe,11–17 Cu,18 Zn,19 Ni,20 Ru,21–26 Re,27 Os,28 Pt,20,29–36 Pd,20 or Mo.37 ISC has been reported to occur in metal complexes over a large range of timescales, from <30 fs11,38 to hundreds of picoseconds, but it is not clear yet what mechanisms govern the rates of ISC,3 which can be vastly different even in compounds of similar structure.29 There may be dependence of ISC rates upon metal-ligand bond stretch frequency,27 ligand size,29 and in some cases solvent.31,39–41
The reported rates of ISC in Pt(II) complexes span a similarly large range. Some of us previously reported a series of Pt(II) donor-acceptor complexes, Scheme 142 in which high-frequency acetylide stretching vibrations were used as a tool to manipulate excited state dynamics. In all compounds, the initial excitation populates a state of a charge-transfer character, CT, with the shift of electron density from the Pt/acetylide moiety to the naphthalimide (NAP) acceptor. In the triad [1], the formation of a charge-separated state, CSS, where the electron density is shifted from the donor, PTZ, to the acceptor NAP, was also observed. The presence of a strongly coupled manifold of charge-transfer states was established by transient absorption (TA) and transient infrared (TIR) spectroscopies, with branching occurring from hot states enabling IR-control of excited state dynamics. However, the full resolution of the earliest events – including ISC – in these compounds was hindered by spectrally overlapping bands with different dynamics. More specifically, a strong overlap of the excited-state absorption with stimulated emission rendered impossible the elucidation of optical coupling with the electronic ground state using TA. In TIR, on the other hand, spectral congestion during the first few picoseconds was caused by several electronic states evolving simultaneously on this time scale.
 | ||
| Scheme 1 | ||
The present work offers an alternative approach to disentangle the early spin dynamics. We use broadband fluorescence upconversion (FLUP) spectroscopy43 that selectively tracks only emissive excited states with femtosecond resolution, which currently is not achievable with any other method of monitoring emission. Another method implemented here is femtosecond-stimulated Raman (FSR) scattering44,45 which is selective only to the excited states which are in resonance with the Raman excitation. FSR can follow “dark” excited states evolving on the same time-scale individually, by tuning the experimental condition from being in resonance with one state at a time. Together, FLUP and FSR allows one to resolve the dynamics of multiple states which evolve simultaneously on a sub-ps time-scale. Comparing FLUP and FSR results for [1]–[3], alongside with transient absorption and transient infrared data, we show that the strength of radiative coupling to the electronic ground state remains constant during the decay process, at a value similar to that of (strong) absorption. It follows that the emissive manifold is of primarily singlet spin-orbit character. A generic set of rate equations that includes branching from the hot excited-state casts the dynamics from TA, TIR, FLUP and FSR into a self-consistent picture, and resolves the rates of ISC in model acceptor–bridge–donor Pt(II) complexes.
Results
All data discussed have been obtained from solutions in dichloromethane, at room temperature (r.t.), under ∼400 nm excitation.Transient absorption spectra of NAP–Pt–Cl [3] and NAP–Pt–PTZ [1] recorded here are shown in Fig. 1a and b, respectively. Compared to the previous report42 we see further into the UV, uncovering the range 280–370 nm, and improve the signal-to-noise ratio. Stimulated emission (SE) is observed alongside with the ground state bleach and transient absorbencies. Multi-exponential global fits were carried out for the time range from −1 ps to 4 ns. To achieve a satisfactory fit to the spectral changes, three exponential components and one long-lived component were required for [3] (best fit: τa = 0.97 ps, τb = 59 ps, τc = 193 ps). Four exponential components and one long-lived component were required for [1] (best fit: τa = 0.50 ps, τb = 2.46 ps, τc = 10.57 ps, and τd = 742 ps; see Table 1 and the ESI†). The latter set of time constants τi is not uniquely defined as they are highly correlated, which indicates the dispersive character of the dynamics (i.e., a smooth distribution of time constants is required in principle, reflecting a distribution of molecular geometries in the electronic ground state). The corresponding decay-associated spectra (DAS) for transient absorption data with deconvolved instrument response function (0.10 ps full width at half-maximum, fwhm) are provided in Fig. 2a and b. For both compounds, the “constant” contribution that does not decay on the time scale of the experiment – black lines in the figure – corresponds to the 3NAP state in agreement with previous studies.
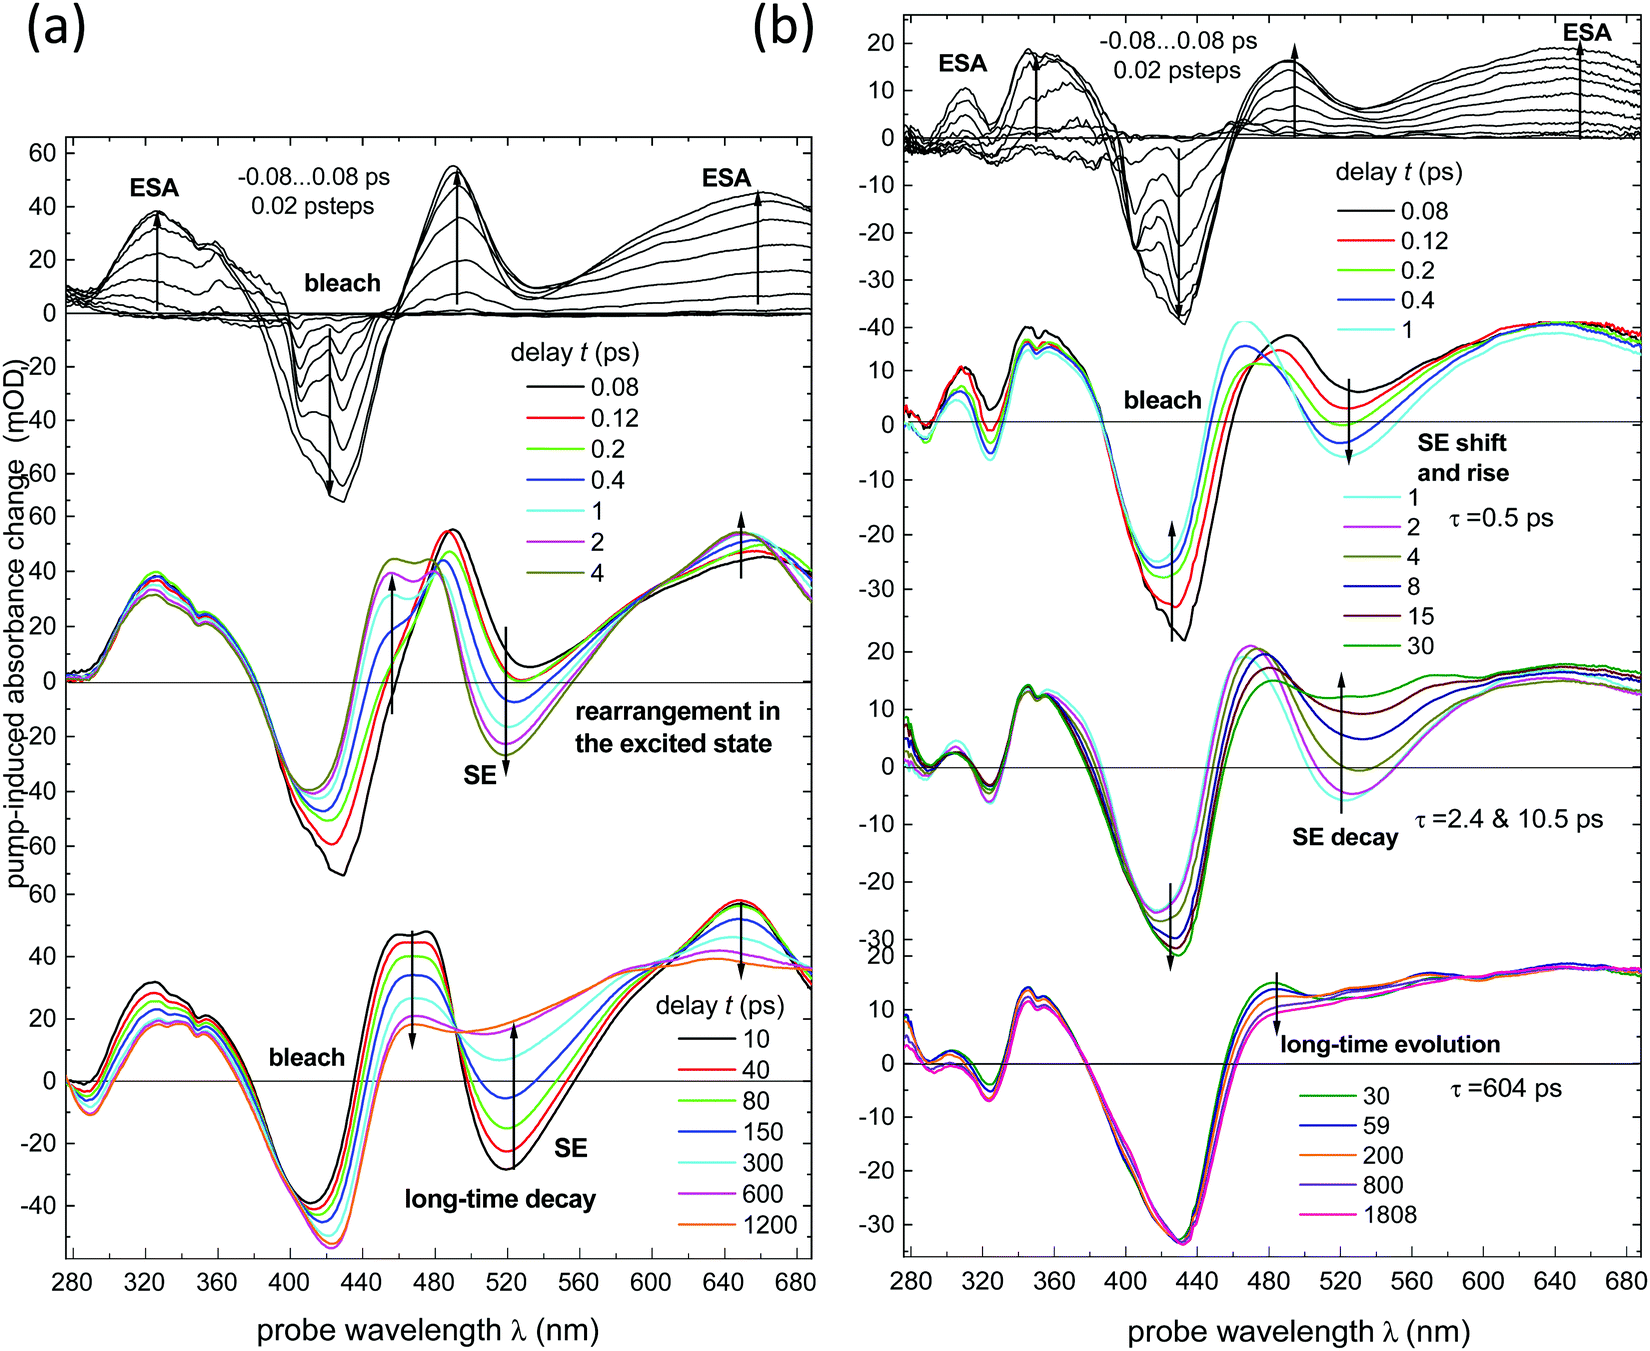 | ||
| Fig. 1 Transient absorption (TA) spectra recorded in dichloromethane (dcm) upon excitation with 405 nm, 50 fs pulses. The magic-angle spectra have been calculated from results with parallel and perpendicular angle between pump and probe polarisations. (a) NAP–Pt–Cl [compound 3], (b) NAP–Pt–PTZ [compound 1]. Time-steps were 20 fs until 5 ps, then 200 fs until 60 ps and 8 ps until ∼1800 ps. | ||
| FSR | TIR42 | TA42 | TA | FLUP | ||||
|---|---|---|---|---|---|---|---|---|
| a Only 3NAP is observed in FSR experiments due to the choice of the wavelength. b GSR = ground-state recovery. | ||||||||
| FC | τ a = 0.5 ± 0.3 | τ a = 0.50 | Red-shift | τ a = 0.61 | Red-shift | |||
| X | τ a = 1.6 (26%) | Decay S* & rise 3NAP | τ a = 1.1 ± 0.3 | τ b = 1.8 ± 0.3 | τ b = 2.46 | Decay, blue-SE | τ b = 1.65 | Decay, blue SE (40%) |
| τ b = 3.1 ± 1 | ||||||||
| Y | τ b = 5.9 (28%) | Continued risea | τ c = 14 ± 1 | τ c = 13 ± 1 | τ c = 10.57 | Main SE decay | τ c = 9.53 | Decay, red SE (60%) |
| Z | τ c = 18.2 (46%) | τ d = 53.6 | ||||||
| 3CSS | τ d = 1000 ± 100 | τ d = 800 ± 200 | τ d = 742 | Decay of 3CSS& GSRb | ||||
| 3NAP | τ d = ∞ | τ e = ∞ | τ e = ∞ | τ e = ∞ | ||||
| % Gives relative amplitude of 1359 cm−1 line integrala | α = 2.0, β = 1.5 | α = 0.87, β = 0.25 | ||||||
 | ||
Fig. 2 Decay-Associated Spectra (DAS) from multi-exponential analysis of transient absorption data in Fig. 1: (a) NAP–Pt–Cl, (b) NAP–Pt–PTZ. (c) For NAP–Pt–Cl, band integral  of the TA spectra over the band for stimulated emission. A low-frequency oscillation is due to an active vibrational mode in the excited electronic state. Red line: fit with a damped cosine function ( of the TA spectra over the band for stimulated emission. A low-frequency oscillation is due to an active vibrational mode in the excited electronic state. Red line: fit with a damped cosine function (![[small nu, Greek, tilde]](https://www.rsc.org/images/entities/i_char_e0e1.gif) ≈ 156 cm−1). Gray line: multiexponential background contribution. ≈ 156 cm−1). Gray line: multiexponential background contribution. | ||
Vibrational coherence is observed at early time in the TA spectra of [3]. Fig. 2c shows the time-dependent integral 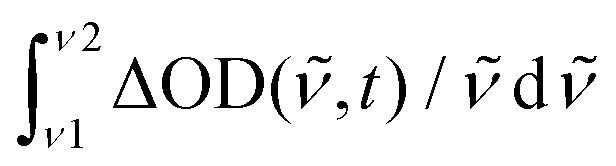 of the observed induced optical density in this case, over a window central to the stimulated emission region. A fit with a damped cosine function, together with Gaussian-convoluted step- and exponential functions,46 provides the vibrational frequency of 156 cm−1. It matches a low-frequency Raman mode of the primary excited state, as will be shown later.
FLUP spectra43 for [3] and [1] obtained under 400 nm, ∼40 fs excitation are shown in Fig. 3a and b, respectively; the spectra for [2] are provided in the ESI.† They are generally shown as transient spectra for stimulated emission or gain −γ() ∼ F()/2, where F() = ∂Φ/∂ is the measured distribution of photons over wavenumbers, so that a direct comparison with TA bleach or gain bands may be made. The essential result is expressed by the underlying DAS for stimulated emission which are shown in Fig. 4a and b. For [1] (Fig. 4b), following a fast initial red-shift in the spectral position (τa = 0.61 ps, gray line), the emission band decays with two main components, τb = 1.65 ps and τc = 9.53 ps (blue and green). The relative contributions of these two decay channels of ≈0.40![[thin space (1/6-em)]](https://www.rsc.org/images/entities/char_2009.gif) :0.60 (fast:slow) was estimated by the areas under the corresponding DAS. The remaining low-intensity signal has a lifetime of τd = 53.6 ps (red line). The data for [3] and the corresponding time constants (Fig. 4a) demonstrate clear similarities in the spectral shape of some of the DAS components of emission between [3] and [1].
:0.60 (fast:slow) was estimated by the areas under the corresponding DAS. The remaining low-intensity signal has a lifetime of τd = 53.6 ps (red line). The data for [3] and the corresponding time constants (Fig. 4a) demonstrate clear similarities in the spectral shape of some of the DAS components of emission between [3] and [1].
 | ||
| Fig. 3 Fluorescence upconversion (FLUP) spectra are generally presented as stimulated emission, allowing direct comparison with TA. The raw data have been time- and photometrically corrected. An apparent rise until ∼0.20 ps is due to the limited time resolution (0.29 ps fwhm). When the temporal instrument response is deconvolved, the band is seen to red-shift and decay on a 1 ps time scale. Representative spectra for: (a and c) NAP–Pt–Cl, (b) NAP–Pt–PTZ. | ||
 | ||
| Fig. 4 Decay-Associated Spectra (DAS), from global analysis of the stimulated emission spectra obtained by FLUP and shown in Fig. 3. (a) NAP–Pt–Cl, (b) NAP–Pt–PTZ. The IRF has been deconvolved from these spectra. stst – stationary stimulated-emission spectrum obtained with a fluorometer. | ||
FSR45 spectra for [3] and [1] are shown in Fig. 5 and 6, respectively. In the latter case, time delays were scanned in 20 fs steps from −2 ps to 8 ps and then in 200 fs steps to 80 ps. The data are globally fitted with three exponential time-functions and a constant term (see ESI†). We note the presence of a 149 cm−1 FSR line in [3], which within experimental uncertainty corresponds well to the 156 cm−1 oscillation of S* observed in the TA data. The final FSR spectra for [3] and [1] are identical within experimental uncertainty (see Fig. S3, ESI†). They may therefore be assigned to the 3NAP state, on the basis of the previous work and the new TA data. A vibrational mode observed at the earliest times at 1193 cm−1 [1] and 1195 cm−1 [3] is indicative of the primary excited state, which we call S*. For NAP–Pt–Cl [3] the decay of this mode is accompanied by growth of the adjacent mode at ∼1225 cm−1, in what appears to be a precursor → successor process with 193 ps time constant. However, in the FSR spectra of NAP–Pt–PTZ [1] the 1193 cm−1 band decays with τa = 1.6 ps, but the 1217 cm−1 mode, as well as all other product lines shown in Fig. 6b, continue to grow with τb = 5.9 ps and τc = 18.2 ps even after the initial signal from S* has disappeared (Fig. 6c). We find that the signal integrated over the strongest Raman line, at 1352–1358 cm−1, can be fitted by y = −1.00 + 0.26 exp[−t/τa] + 0.28exp[−t/τb] + 0.46exp[−t/τc]. This time-dependence may be equated with that of the total population accumulated in the 3CT manifold and 3NAP state (see below) and will help to understand the other spectral evolutions in this work quantitatively.
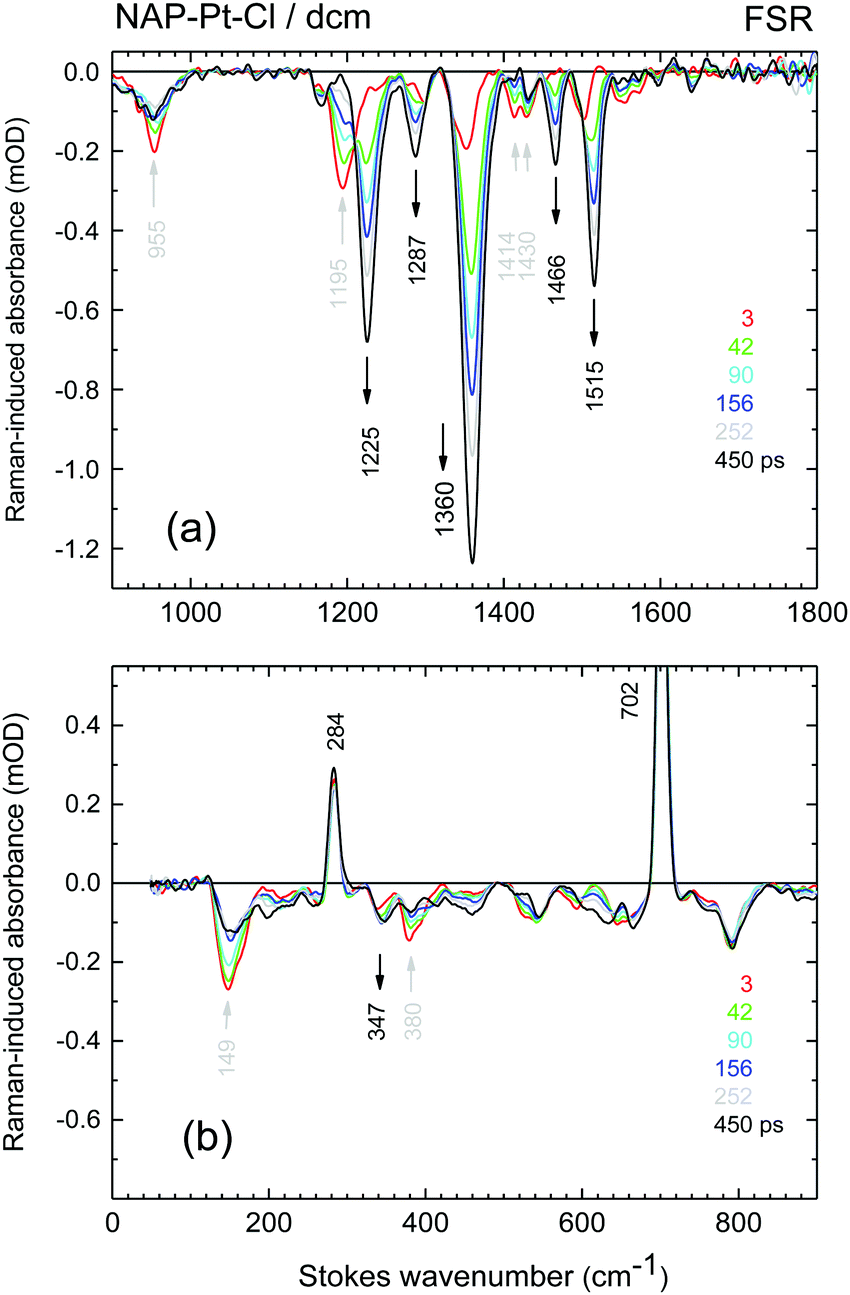 | ||
| Fig. 5 Representative transient stimulated Raman spectra of NAP–Pt–Cl. Actinic excitation was performed at 388 nm and Raman pumping at 683 nm. The time resolution is 0.47 ps (fwhm). Electronic background has been subtracted, and the raw data have been smoothed in a model-free manner using SVD. Arrows indicate vibrational bands (black – rising; grey – decaying). | ||
 | ||
| Fig. 6 Representative transient stimulated Raman spectra of NAP–Pt–PTZ for the range 1000–1600 cm−1. The Raman pump at 683 nm is in resonance specifically with 3NAP. (The range 0–1000 cm−1 is not shown because signals there are much weaker, and vibrational lines there cannot be recognized with confidence from the results of our measurement.) (a) Early part during and immediately after the actinic pump pulse. The time resolution was 0.35 ps (fwhm). All lines are rising during this initial time window due to ongoing optical pumping. (b) For delay times > 0.50 ps. Arrows indicate vibrational bands and their development with τa = 1.6 ps time constant (black – rising; grey – decaying). (c) For delay times > 2 ps until stationarity is attained. Lines continue to grow with τb = 5.9 and τc = 18.2 ps. Note that the vertical scale range has been more than doubled compared to the previous panels. | ||
Discussion
1. A kinetic model for NAP–Pt–PTZ [1]
For a model of the early photodynamics of NAP–Pt–PTZ [1] let us consider the Raman results in the frame of observations with fluorescence upconversion. Experimentally determined time constants are collected in Table 1. A kinetic scheme is proposed in Fig. 7 where, as in previous work,42 homogeneous photo-processes are assumed. Optical pumping populates the Franck–Condon excited state FC in the singlet charge-transfer manifold 1CT. Subsequent relaxation within the 1CT manifold is described by a sequence of electronic states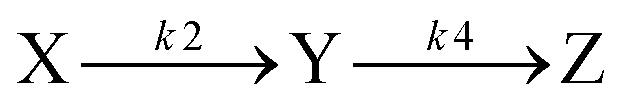 . The latter may represent stable intermediates on the singlet potential energy surface, or else judiciously placed “virtual intermediates” on a reaction path that is essentially barrier-less. In either case, these electronic states allow us to describe the observations in terms of rate equations. An initial sub-ps process
  is resolved only by TA and FLUP, as the time resolution was not sufficient with FSR. Therefore, in the case of FSR, the combined population of FC and X will be attributed to excited state S*.
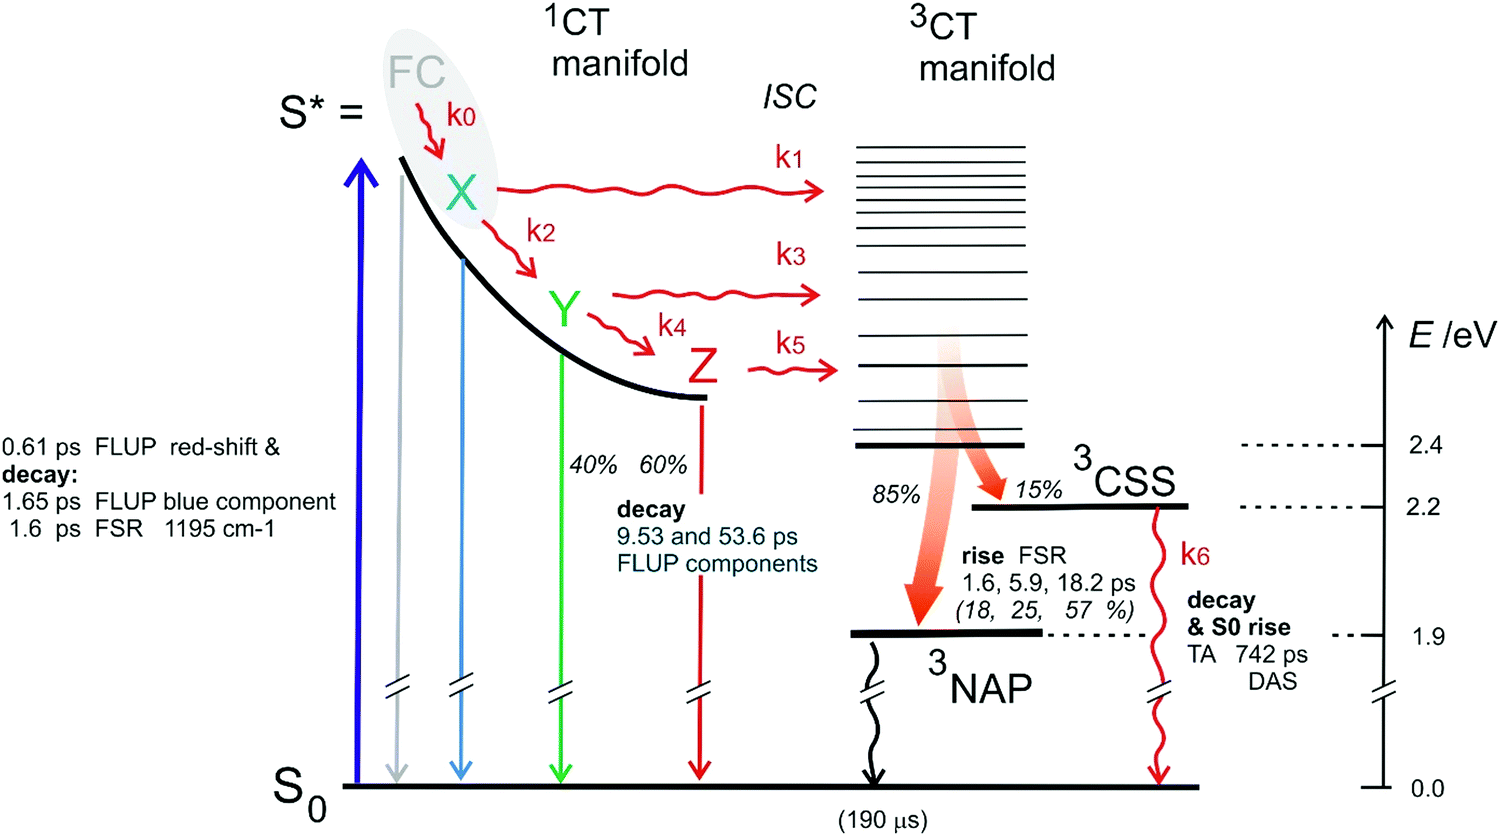 | ||
| Fig. 7 Kinetic scheme for NAP–Pt–PTZ following ref. 42. FC—Franck–Condon excited state, Z—relaxed “thermalized” lowest 1CT state. Multiexponential descriptions of the observed evolutions call for states X and Y (either virtual or true intermediates). Time constants extracted from FSR and FLUP results are indicated; percentages refer to relative amplitudes of decay or rise terms. Branching ratios are defined as α = k2/k1 and β = k4/k3. (Note that observations by TA have mostly been omitted for this figure.). | ||
The 1.6 ps decay of the initial Raman mode at 1193 cm−1 corresponds to the 1.65 ps decay component of fluorescence. Both observations are assigned to the primary-excited singlet state S*. As S* decays the triplet product states are being formed. This is evidenced by a 1.6 ps rise component of all 3NAP Raman lines or slightly blue-shifted lines (cf.Fig. 6b) which are attributed to the 3CT manifold. Hence a direct process  must exist, i.e. a precursor → successor relationship with intrinsic rate constant k1.
Whilst some 3CT (26%, as measured by FSR scattering) is produced on a short time scale of a few picoseconds, the larger part of the total fluorescence amplitude decays on a longer timescale. On this slower timescale, the 3CT/3NAP Raman signal rises in two stages, with time constant of 5.9 ps (28%) and finally with 18 ps (46%, see text above). The latter component is similar to the major fluorescence decay component, which must therefore come from excited states Y and Z. Thereafter the fluorescence is exhausted, and the rise of Raman lines assigned to the triplet manifold has ceased.
The co-existence of (i) fast-generated 3CT and (ii) fluorescent states present long thereafter, implies that the evolving population must have branched. The scheme presented in Fig. 7 assumes that branching takes place in the excited singlet manifold. Because of the tri-exponential rise of 3NAP-like Raman signal, there should be at least three intersystem crossing channels (for a kinetic model, we consider them “discrete”). These are indicated by arrows  ,
,  and
and  in Fig. 7. Subsequent vibrational relaxation to the lowest 3CT state and beyond is assumed to be unresolved in our model (no significant population accumulates in higher 3CT states because the corresponding rate constants are much larger than the preceding k1, k3, k5), and a mixture of 3NAP and 3CSS is created concurrently.‡
The fully charge-separated state 3CSS ≡ 3[NAP−–Pt–PTZ+] has no transient absorption at the Raman pump wavelength used (683 nm) and will not be detected by our FSR experiment. (The analysis of the TA spectra (Fig. 1b, lower panel) reveals a component with ∼740 ps time constant whose spectral signature (red line in Fig. 2b) is assigned to 3CSS absorption, minus the equivalent ground-state bleach. The 3CSS decays with rate constant k6 to the ground state on the nanosecond timescale.)
There is a possibility of branching in the singlet manifold that directly populates two different triplet states, 3NAP and 3CSS, without the intermediate population of 3CT. However, the timescale of the decay of SE is not accompanied by a significant shift in the transient IR spectra, and the FSR spectroscopy was performed being selectively sensitive to 3NAP. To account for all the kinetic parameters observed, a presence of another state, in between the 1CT manifold and 3NAP/3CSS, is required.
2. Evolution of fluorescence upconversion spectra from NAP–Pt–PTZ [1]
The DAS for stimulated emission from compound [1], expressed in terms of stimulated emission or gain, γ(,t), were already shown in Fig. 4b. The time dependence of the relative oscillator strength of the emission corresponds to the time-evolution of the band integral defined as  . The resulting emission decay profile matches the previously extracted time-dependence of the growth of the Raman band assigned jointly to 3CT and 3NAP (flipped and rescaled for visual purposes), Fig. 8. Both the emission decay and the Raman signal growth curves are primary dynamic observations, free from constraints of modelling. The similarity of these two curves suggest that the loss of emission intensity is due primarily to a loss of the population of the excited state, and that radiative coupling to S0 remains unaffected upon relaxation of the excited electronic state.
 | ||
| Fig. 8 Two measures of singlet-excited state population: oscillator band integral over stimulated emission band (green), and band integral over the 1358 cm−1 FSR line (red). | ||
Next, we extract the species-associated spectra (SAS) for stimulated emission of [1] from the experimental data, using the kinetic model of Fig. 7. Note that the model requires the known experimental time constants τa–τd (taken from the FLUP column in Table 1) and, in addition, unknown branching ratios α = k2/k1 and β = k4/k3. Using trial values for α and β we calculate the tri-exponential rise of the population of the triplet state. This prediction is compared to the observed growth of 3NAP Raman signal (red line in Fig. 8) which tracks the population accumulating in the 3NAP state experimentally. By comparison we find optimal values of α = 0.87 and β = 0.25. The corresponding SAS are shown in Fig. 9. The relative oscillator strengths of the FC, X, Y, and Z species may be estimated from the corresponding band integral. We find the relative oscillator strengths to be 1.0, 0.88, 1.15, 0.91, respectively – essentially a constant value, considering the errors inherent in the determination. As was mentioned before, it follows that radiative coupling of the population relaxing in the 1CT manifold is unaffected by the evolution.
 | ||
| Fig. 9 Species-Associated Spectra (SAS) of stimulated emission, for the model in Fig. 7. The relative oscillator strengths of the “species” are estimated to be 1.0, 0.9, 1.1, 0.9. | ||
The initial emission spectrum labelled FC may be assigned to the Franck–Condon state by virtue of its spectral position and shape relative to the absorption band. As can also be seen from the TA spectra, initial stimulated emission and ground-state bleach have almost the same amplitude. The radiative coupling for stimulated emission, FC → S0, may therefore be assumed identical to that of stationary absorption, FC ← S0. Then follows the series of intermittent states X, Y, Z which describe the electronic evolution. The species X and Y are downshifted from their predecessors each by ca 1000 cm−1 and become less asymmetric. Population decreases along the reaction path due to successive losses to the triplet manifold. This explains the remaining weak Z population after 40 ps. As a consequence, the species-associated spectrum of Z is noisier, and its vibrational structure could be an artifact. However, because the relative oscillator strengths of X, Y, Z are close to that of the FC state, it is assumed that their electronic character is the same, namely, singlet as that of FC. Our measurements are therefore ruling out the population of 3NAP with time constant corresponding to, or smaller than, the laser pulse width.
Finally, we are addressing the multi-exponential spectral evolutions of NAP–Pt–PTZ (Table 1). We find a correlation of time constants between the different observation modes but no strict one-to-one correspondence. This is probably due to the dispersive character of the evolution of the population in the 1CT manifold. Different observation modes may require different placements of a limited number of exponential terms. Given this deficiency, a set of experimental τa, τb, τc… etc. should be considered together with the corresponding branching ratios α, β. In this way, the model adequately describes both the observed spectral evolution and the observed rise of triplet population. The parameters may differ in each case, but the resulting descriptions are essentially the same. This idea is now tested with transient infrared data.
3. Consistency with the previous TIR spectra of NAP–Pt–PTZ [1]
Transient infrared spectra of NAP–Pt–PTZ published in ref. 42 show the 1525–1710 cm−1 range; for convenience that figure is reproduced in the support as Fig. S5 (ESI†). Induced absorbance ΔOD is observed even at earliest times, around 0.5 ps, at positions where 3NAP has strong IR-active vibrational modes (1590 cm−1 and 1640 cm−1).§It was concluded that the initial process, S* → 3NAP, was too fast to be resolved by the TIR setup used. However, in the current work, a combination of FLUP and FSR spectroscopies allowed us to resolve this process, by reaching out into sub-500 fs domain. We are now applying the kinetic model proposed here to the previous TIR data.
Time delays from 100 ps to 3 ns are dominated by a constant spectral contribution (red line in Fig. S7, ESI†) which is readily decomposed into the bleached S0 spectrum (<0) and the above-mentioned 3NAP bands (>0). A weak decaying contribution (black line), with ∼900 ps decay time, is assigned to the difference IR spectrum (induced absorption minus corresponding bleach) of the 3CSS state. By comparing of the two kinds of bleach signals, the branching ratio is roughly estimated to be [3CSS]:[3NAP] ≈ 15:85. The bleach spectrum of the S0 state is subtracted from all earlier spectra, and the resultant data matrix is analysed.
The first 100 ps of the resultant data matrix is satisfactorily fitted with three exponential decay components and a temporally constant contribution. In a next step the kinetic scheme of Fig. 7 is applied, thus introducing the branching ratios α and β in addition to the experimental time constants. As before, the optimal values for α, β are found on the condition that the predicted triplet yield behaves as seen by FSR spectroscopy. The fit parameters are collected in Table 1.
The species-associated TIR spectra for [1] according to our scheme are shown in Fig. 10 (the corresponding population traces are shown in Fig. S8 of the ESI†). Hot excited states S* (= FC + X) and Y are both characterized by a broad band at 1570 cm−1, a strong band at 1613 cm−1, and a broad structure peaking at 1890 cm−1. By comparison, relaxed Z in the 1CT manifold has less IR background and narrower features. Regarding the product mixture, the characteristic 3NAP bands at 1594 cm−1 and 1640 cm−1 are almost isosbestic with the preceding, broader IR absorptions by S* and Y. This is why it appears as if 3NAP were present already at earliest time with TIR (≈0.5 ps), whilst the FSR data show that the fastest component in the rise of the 3NAP population takes 1.6 ps. Thus, we can describe the dynamics of [1] from the excitation (fs) to nanoseconds in a self-consistent manner across four different spectroscopic methods, electronic transient absorption, transient infrared, fluorescence upconversion, and femtosecond stimulated Raman scattering, as shown in Fig. 7.
 | ||
| Fig. 10 Decomposition of transient infrared (TIR) spectra of NAP–Pt–PTZ from ref. 42. Shown are species-associated spectra according to the kinetic scheme in Fig. 7. Bleached bands were quantified at 3 ns delay and have been subtracted. The solid black line represents the IR spectrum of the product mixture 3NAP + 3CSS. The underlying TIR data cover the contiguous range 1520–2150 cm−1; results are represented here in two spectral sections on different vertical scales. The corresponding amplitude traces are shown in the ESI† (Fig. S8). | ||
Conclusions
The rates and mechanism of ultrafast ISC in metal complexes remains a hot topic of discussion. Here, a combination of fluorescence upconversion (FLUP) and femtosecond stimulated Raman (FSR) spectroscopies have led to establishing the timescales of intersystem crossing in Pt(II) donor-acceptor systems shown in Scheme 1. Previous work, on the basis of transient absorption (TA) and time-resolved infrared (TIR) spectroscopy, led to two puzzling observations for the triad NAP–Pt–PTZ [1], namely (i) strong stimulated emission in the fluorescence region until ∼10 ps, but also (ii) near-instantaneous appearance of infrared absorption at characteristic 3NAP frequencies. It was concluded that the excited electronic state S* in [1] evolves into a triplet manifold unresolvably fast, and that the resulting manifold of spin-mixed state is the carrier of the emission.The puzzle has been solved here with broadband fluorescence upconversion (FLUP) and femtosecond-stimulated Raman (FSR) spectroscopies. These methods do not suffer from band overlap because they are selective, respectively, to the radiative S* → S0 transition and to the population of the reaction product, i.e. the triplet state 3NAP centered on the donor moiety, by virtue of an electronic resonance with Raman pump light at ∼680 nm. We find generally that the loss of fluorescence is matched by a rise in triplet signal. It follows that radiative coupling, of the state(s) relaxing in the 1CT manifold with the electronic ground state, is unaffected by the evolution and of a strength similar to the S*← S0 transition.
For the triad NAP–Pt–PTZ, the rise of 3NAP population proceeds on multiple timescales (1.6, 5.9, and 18.2 ps) by successive branching during relaxation in the excited singlet manifold. A rate model is proposed and shown to be consistent with the transient infrared data, mentioned above, from previous work. Raman modes are observed for the S* (149 and 1193 cm−1) and 3NAP (including 1225 and 1360 cm−1) states. We also observe a blue-shift of 3NAP Raman modes on picosecond time scales, probably due to cooling. This effect, and monitoring –CC– modes expected at ∼2220 cm−1 (currently the observed Stokes range is Δ ≤ 1600 cm−1) would merit future experimental work.
FLUP data on NAP–Pt–Ph [2] which has two trans-acetylide groups but lack the donor unit show the similar rate of ISC as in [1]: a replacement of the –Pt–CC– fragment with the trans-CC–Pt–CC– one leads to an at least 10-fold acceleration of intersystem crossing. These data provide an insight into the factors governing rates of intersystem crossing in platinum acetylide complexes.
Thus, FLUP and FSR spectroscopies provide complimentary tools to the more traditional TA and TIR. They are helpful to resolve ultrafast dynamics when even fingerprint bands in TIR overlap due to multiple concurrent electronic states, common in charge-transfer organometallics.
Experimental
Compounds 1–3 were prepared and characterised according to the published procedure.42 Spectroscopy-grade solvent was purchased from Sigma-Aldrich. All spectroscopic measurements were performed in air-saturated solutions. The absorption spectra before and after the experiments were checked to ensure lack of sample degradation.Transient Absorption (TA)47 and Femtosecond Stimulated Raman (FSR)45 spectroscopies were performed at HUB.
Time-resolved broadband Fluorescence UPconversion (FLUP) spectroscopy experiments were performed in the https://www.sheffield.ac.uk/laser-spectroscopy at the University of Sheffield, using the set-up developed by one of the authors (NPE) and supplied by LIOP-TEC GmbH; the detection set-up is described in detail in ref. 43.
Excitation was provided by a Ti:Sapphire regenerative amplifier (Spitfire ACE PA-40, Spectra-Physics) that generates 800 nm pulses (40 fs fwhm, 10 kHz, 1.2 mJ). 800 nm seed pulses (25 fs fwhm, 84 MHz) for the amplifier were provided by a Ti:Sapphire oscillator (Mai Tai, Spectra-Physics). Two Nd:YLF lasers (Empower, Spectra-Physics) were used to pump the two amplification stages of the Spitfire ACE PA-40. Frequency doubling of the 800 nm output of the amplifier, in a β-barium borate crystal within a commercially available doubler/tripler (TimePlate, Photop Technologies), was used to generate the 400 nm pump pulses (40 fs fwhm, 10 kHz, ∼0.3 μJ). The pump pulses were passed through a computer-controlled optical delay line (M-IMS400LM, Newport), translation of which gave control of time delay between pump and gate pulses, within a 4 ns window with a temporal resolution of 1.67 fs. The power of the pump pulses was controlled using a variable attenuation neutral-density filter wheel. Pump pulses were compressed in a double-pass two-prism compressor (AFS-FS Fused Silica Prism Pair, Thorlabs) to achieve minimal fwhm of a cross-correlation between the gate and pump pulses. Polarization was set to magic angle, with respect to vertical, with a λ/2 plate. Pump pulses were then focused by a lens (f = 200 nm, fused silica) onto the sample cell, to a spot diameter of ≤0.1 mm. The sample was placed in a fused silica cuvette with an internal path length of 1.0 mm. The sample solution was stirred with a magnetic stirrer.
Signal gating
The 1320 nm gate pulses (80 fs fwhm, 10 kHz, 60 μJ) were generated by a traveling-wave optical parametric amplifier of superfluorescence (TOPAS prime, Light Conversion) pumped by the 800 nm (40 fs fwhm, 10 kHz, 0.5 mJ) output of Ti:Sapphire regenerative amplifier. The polarization of the gate pulses was set to horizontal using a wire-grid polariser in conjunction with a λ/2 plate. The wire-grid polarizer and λ/2 plate pair were used to attenuate the power of the gate pulses.Signal collection
Emission from the sample was collected in a forward-scattering geometry. A beam-stopper was used to block any transmitted pump light. The fluorescence was directed onto a 100 μm thick β-barium borate crystal (BBO crystal, EKSMA OPTICS) where it was upconverted by sum-frequency generation with the 1320 nm gate pulses. The fluorescence and gate beams met at an angle of ∼21° at the crystal, in a spot of 0.6 mm diameter. Type II phasematching was used in order to provide broadest spectral window for upconversion.Upconverted fluorescence signal detection
The upconverted fluorescence was spatially filtered and then focused on the entrance of a fiber bundle (Ceram Optek) with a concave mirror. A homebuilt spectrograph was used to disperse the upconverted fluorescence onto a CCD detector (iDus 420 DU440A-BU2, Andor). The detectable spectral range was ∼286–500 nm, this corresponds to original fluorescence of ∼360–780 nm.Conflicts of interest
There are no conflicts to declare.Acknowledgements
The authors are grateful to Dr I Sazanovich, Prof. A. W. Parker, Prof. M. Towrie (STFC), Prof. A. Meijer (University of Sheffield), Dr P. Scattergood (University of Huddersfield) and Prof. M. Delor (Columbia University, NY) for discussions and collaborations. Loan of precious metal salts by Johnson Matthey is gratefully acknowledged. Financial support of the EPSRC UK, China Scholarship Council (PhD studentship to GW), the EPSRC Capital Equipment award to the Lord Porter Laser Laboratory, the University of Sheffield, and Humboldt University Berlin are gratefully acknowledged.Notes and references
- S. Archer and J. A. Weinstein, Coord. Chem. Rev., 2012, 256, 2530–2561 CrossRef CAS.
- M. Chergui, Acc. Chem. Res., 2015, 48, 801–808 CrossRef CAS PubMed.
- T. Moitra, P. Karak, S. Chakraborty, K. Ruud and S. Chakrabarti, Phys. Chem. Chem. Phys., 2021, 23, 59–81 RSC.
- J. W. Kim, D. G. Kang, S. K. Kim and T. Joo, Phys. Chem. Chem. Phys., 2020, 22, 25811–25818 RSC.
- L. Mewes, R. A. Ingle, S. Megow, H. Böhnke, E. Baranoff, F. Temps and M. Chergui, Inorg. Chem., 2020, 59, 14643–14653 CrossRef CAS PubMed.
- K. Li, G. S. M. Tong, J. Yuan, C. Ma, L. Du, C. Yang, W. M. Kwok, D. L. Phillips and C. M. Che, Inorg. Chem., 2020, 59, 14654–14665 CrossRef CAS PubMed.
- J. P. Zobel, O. S. Bokareva, P. Zimmer, C. Wölper, M. Bauer and L. González, Inorg. Chem., 2020, 59, 14666–14678 CrossRef CAS PubMed.
- S. Mai and L. González, Chem. Sci., 2019, 10, 10405–10411 RSC.
- J. N. Schrauben, K. L. Dillman, W. F. Beck and J. K. McCusker, Chem. Sci., 2010, 1, 405–410 RSC.
- E. A. Juban, A. L. Smeigh, J. E. Monat and J. K. McCusker, Coord. Chem. Rev., 2006, 250, 1783–1791 CrossRef CAS.
- W. Gawelda, A. Cannizzo, V. T. Pham, F. van Mourik, C. Bressler and M. Chergui, J. Am. Chem. Soc., 2007, 129, 8199–8206 CrossRef CAS PubMed.
- C. Consani, M. Prémont-Schwarz, A. Elnahhas, C. Bressler, F. van Mourik, A. Cannizzo and M. Chergui, Angew. Chem., Int. Ed., 2009, 48, 7184–7187 CrossRef CAS PubMed.
- Ch. Bressler, C. Milne, V.-T. Pham, A. ElNahhas, R. M. van der Veen, W. Gawelda, S. Johnson, P. Beaud, D. Grolimund, M. Kaiser, C. N. Borca, G. Ingold, R. Abela and M. Chergui, Science, 2009, 323, 489 CrossRef CAS PubMed.
- A. L. Smeigh, M. Creelman, R. A. Mathies and J. K. McCusker, J. Am. Chem. Soc., 2008, 130, 14105–14107 CrossRef CAS PubMed.
- N. C. Cole-Filipiak, J. Troß, P. Schrader, L. M. McCaslina and K. Ramaseshaa, J. Chem. Phys., 2021, 154, 134308 CrossRef CAS PubMed.
- J. Tribollet, G. Galle, G. Jonusauskas, D. Deldicque, M. Tondusson, J. F. Letard and E. Freysz, Chem. Phys. Lett., 2011, 513, 42–47 CrossRef CAS.
- A. Lapini, P. Foggi, L. Bussotti, R. Righini and A. Dei, Inorg. Chim. Acta, 2008, 361, 3937–3943 CrossRef CAS.
- M. Iwamura, H. Watanabe, K. Ishii, S. Takeuchi and T. Tahara, J. Am. Chem. Soc., 2011, 133, 7728–7736 CrossRef CAS PubMed.
- M. T. Colvin, A. L. Smeigh, E. M. Giacobbe, S. M. M. Conron, A. B. Ricks and M. R. Wasielewski, J. Phys. Chem. A, 2011, 115, 7538–7549 CrossRef CAS PubMed.
- F. Frei, A. Rondi, D. Espa, M. L. Mercuri, L. Pilia, A. Serpe, A. Odeh, F. van Mourik, M. Chergui, T. Feurer, P. Deplano, A. Vlček and A. Cannizzo, Dalton Trans., 2014, 43, 17666–17676 RSC.
- A. Cannizzo, F. van Mourik, W. Gawelda, G. Zgrablic, C. Bressler and M. Chergui, Angew. Chem., Int. Ed., 2006, 45, 3174–3176 CrossRef CAS PubMed.
- O. Bräm, F. Messina, A. M. El-Zohry, A. Cannizzo and M. Chergui, Chem. Phys., 2012, 393, 51–57 CrossRef.
- A. T. Yeh, C. V. Shank and J. K. McCusker, Science, 2000, 289, 935 CrossRef CAS PubMed.
- N. H. Damrauer, G. Cerullo, A. Yeh, T. R. Boussie, C. V. Shank and J. K. McCusker, Science, 1997, 275, 54 CrossRef CAS PubMed.
- A. C. Bhasikuttan, M. Suzuki, S. Nakashima and T. Okada, J. Am. Chem. Soc., 2002, 124, 8398–8405 CrossRef CAS PubMed.
- W. R. Browne, C. G. Coates, C. Brady, P. Matousek, M. Towrie, S. W. Botchway, A. W. Parker, J. G. Vos and J. J. McGarvey, J. Am. Chem. Soc., 2003, 125, 1706–1707 CrossRef CAS PubMed.
- A. Cannizzo, A. M. Blanco-Rodríguez, A. el Nahhas, J. Šebera, S. Záliš, A. Vlček and M. Chergui, J. Am. Chem. Soc., 2008, 130, 8967–8974 CrossRef CAS PubMed.
- O. Bräm, F. Messina, E. Baranoff, A. Cannizzo, M. K. Nazeeruddin and M. Chergui, J. Phys. Chem. C, 2013, 117, 15958–15966 CrossRef.
- G. Ramakrishna, T. Goodson, E. R. H. Joy, T. M. Cooper, D. G. McLean and A. Urbas, J. Phys. Chem. C, 2009, 113, 1060–1066 CrossRef CAS.
- R. Monni, G. Capano, G. Auböck, H. B. Gray, A. Vlček, I. Tavernelli and M. Chergui, Proc. Natl. Acad. Sci. U. S. A., 2018, 115, E6396–E6403 CrossRef CAS PubMed.
- R. M. van der Veen, A. Cannizzo, F. van Mourik, A. Vlček and M. Chergui, J. Am. Chem. Soc., 2011, 133, 305–315 CrossRef CAS PubMed.
- I. L. Zheldakov, M. N. Ryazantsev and A. N. Tarnovsky, J. Phys. Chem. Lett., 2011, 2, 1540–1545 CrossRef CAS.
- P. Wang, Y. H. Koo, W. Kim, W. Yang, X. Cui, W. Ji, J. Zhao and D. Kim, J. Phys. Chem. C, 2017, 121, 11117–11128 CrossRef CAS.
- F. Zhong, J. Zhao, M. Hayvali, A. Elmali and A. Karatay, Inorg. Chem., 2019, 58, 1850–1861 CrossRef CAS PubMed.
- J. E. Yarnell, I. Davydenko, P. V. Dorovatovskii, V. N. Khrustalev, T. V. Timofeeva, F. N. Castellano, S. R. Marder, C. Risko and S. Barlow, J. Phys. Chem. C, 2018, 122, 13848–13862 CrossRef CAS.
- S. E. Brown-Xu, M. S. J. Kelley, K. A. Fransted, A. Chakraborty, G. C. Schatz, F. N. Castellano and L. X. Chen, J. Phys. Chem. A, 2016, 120, 543–550 CrossRef CAS PubMed.
- G. T. Burdzinski, R. Ramnauth, M. H. Chisholm and T. L. Gustafson, J. Am. Chem. Soc., 2006, 128, 6776–6777 CrossRef CAS PubMed.
- A. J. S. Valentine, J. J. Radler, A. Mills, P. Kim, F. N. Castellano, L. X. Chen and X. Li, J. Chem. Phys., 2019, 151, 114303 CrossRef PubMed.
- T. J. Penfold, E. Gindensperger, C. Daniel and C. M. Marian, Chem. Rev., 2018, 118, 6975–7025 CrossRef CAS PubMed.
- F. Plasser, S. Mai, M. Fumanal, E. Gindensperger, C. Daniel and L. González, J. Chem. Theory Comput., 2019, 15, 5031–5045 CrossRef CAS PubMed.
- M. Fumanal, E. Gindensperger and C. Daniel, J. Phys. Chem. Lett., 2018, 9, 5189–5195 CrossRef CAS PubMed.
- P. A. Scattergood, M. Delor, I. V. Sazanovich, O. V. Bouganov, S. A. Tikhomirov, A. S. Stasheuski, A. W. Parker, G. M. Greetham, M. Towrie, E. S. Davies, A. J. H. M. Meijer and J. A. Weinstein, Dalton Trans., 2014, 43, 17677–17693 RSC.
- M. Gerecke, G. Bierhance, M. Gutmann, N. P. Ernsting and A. Rosspeintner, Rev. Sci. Instrum., 2016, 87, 053115 CrossRef PubMed.
- D. R. Dietze and R. A. Mathies, ChemPhysChem, 2016, 17, 1224–1251 CrossRef CAS PubMed.
- S. A. Kovalenko, A. L. Dobryakov and N. P. Ernsting, Rev. Sci. Instrum., 2011, 82, 063102 CrossRef CAS PubMed.
- N. P. Ernsting, S. A. Kovalenko, T. Senyushkina, J. Saam and V. Farztdinov, J. Phys. Chem. A, 2001, 105, 3443–3453 CrossRef CAS.
- A. L. Dobryakov, S. A. Kovalenko, A. Weigel, J. L. Pérez-Lustres, J. Lange, A. Müller and N. P. Ernsting, Rev. Sci. Instrum., 2010, 81, 113106 CrossRef CAS PubMed.
Footnotes |
| † Electronic supplementary information (ESI) available. See DOI: 10.1039/d1cp03471e |
| ‡ We generally write τa < … < τd for experimentally observed lifetimes or exponential time constants, whilst k0, …, k5etc. refer to rate constants belonging to a kinetic scheme. |
| § These modes are not observed in FSR spectroscopy due to different selection rules. |
| This journal is © the Owner Societies 2021 |