
 Open Access Article
 This Open Access Article is licensed under a
 Creative Commons Attribution 3.0 Unported Licence
Structural effects in nanotribology of nanoscale films of ionic liquids confined between metallic surfaces†
Silvia
Di Lecce
 a,
Alexei A.
Kornyshev
a,
Michael
Urbakh
b and
Fernando
Bresme
*a
a,
Alexei A.
Kornyshev
a,
Michael
Urbakh
b and
Fernando
Bresme
*a
aDepartment of Chemistry, Molecular Sciences Research Hub, Imperial College, London, W12 0BZ London, UK. E-mail: f.bresme@imperial.ac.uk
bSchool of Chemistry and The Sackler Center for Computational Molecular and Materials, Science, Tel Aviv University, 69978, Tel Aviv, Israel
First published on 17th September 2021
Abstract
Room Temperature Ionic Liquids (RTILs) attract significant interest in nanotribology. However, their microscopic lubrication mechanism is still under debate. Here, using non-equilibrium molecular dynamics simulations, we investigate the lubrication performance of ultra-thin (<2 nm) films of [C2MIM]+ [NTf2]− confined between plane-parallel neutral surfaces of Au(111) or Au(100). We find that films consisting of tri-layers or bilayers, form ordered structures with a flat orientation of the imidazolium rings with respect to the gold surface plane. Tri-layers are unstable against loads >0.5 GPa, while bi-layers sustain pressures in the 1–2 GPa range. The compression of these films results in monolayers that can sustain loads of several GPa without significant loss in their lubrication performance. Surprisingly, in such ultra-thin films the imidazolium rings show higher orientational in-plane disorder, with and the rings adopting a tilted orientation with respect to the gold surface. The friction force and friction coefficient of the monolayers depends strongly on the structure of the gold plates, with the friction coefficient being four times higher for monolayers confined between Au(100) surfaces than for more compact Au(111) surfaces. We show that the general behaviour described here is independent of whether the metallic surfaces are modelled as polarizable or non-polarizable surfaces and speculate on the nature of this unexpected conclusion.
1 Introduction
The reduction of friction between sliding surfaces is a problem of prime interest in many engineering and medical applications. Efficient lubrication reduces energy losses significantly and increases the life span of materials, preventing mechanical failure and degradation of sliding surfaces. While tribological phenomena are receiving significant attention, the complex nature of friction1 makes it often difficult to identify individual mechanisms controlling the lubrication response, and each particular case may require special analysis. A microscopic understanding of these mechanisms is essential to optimise the composition of lubricants, such as Room Temperature Ionic Liquids (RTILs), which are of particular interest in nanotribology.Electrostatic fields induce drastic changes in the structure and dynamics of RTIL nanoscale films, opening new opportunities to control friction dynamically, a principle called electrotunable lubricity.2–4 The friction response of RTILs depends on the applied load,4,5 electrostatic potential,3,6,7 RTILs composition and RTILs molecular structure,8–10 water adsorption in the confined region,11–13 and substrate roughness14. Crystallisation under confinement conditions might also influence friction. Recent experiments showed evidence for the crystallisation of [C2MIM]+ [NTf2]− when it is confined between a gold electrode (100) and a laterally oscillating magnetic Atomic Force Microscopy (AFM) tip.9
Under nanoconfinement conditions between electrified plates, RTILs form ionic layers with alternating charge. Under a normal load, the film thickness decreases and the friction force changes in discrete steps, featuring the so-called quantized friction phenomenon5. Recent experiments9,15 and computer simulations7 showed that the in-plane ordering of the RTIL influences the friction force.16 In-plane ordering has been observed in other lubricants too. Alkene nanofilms confined between mica surfaces15 form hexagonal structures, and the friction force changes with the relative orientation of the confining surfaces.
Recently, we presented theoretical evidence for the formation of ordered structures in RTIL nanofilms confined between charged surfaces mimicking mica (111).16 [C2MIM]+ [BF4]− and [C2MIM]+ [NTf2]− nanofilms form ordered nanostructures, while [C2MIM]+ [C2SO4]− remains disordered. The ordering results in a significant reduction of the friction force. We did not observe significant epitaxial effects; namely, the ordered RTIL layers did not replicate the underlying structure of the confining substrate. In our previous work, we studied surfaces that did not have the lattice constant of Au(111). Furthermore, our model did not include electronic polarization effects, the role of which for the case of metallic surfaces is widely discussed nowadays.17,18
In this article, we investigate using Non-Equilibrium Molecular Dynamics (NEMD) simulations the structure and lubrication properties of 1-ethyl-3-methylimidazolium bis(trifluoromethylsulfonyl)imide ([C2MIM]+ [NTf2]−), confined between neutral gold surfaces. We consider Au(111) and Au(100) surfaces, incorporating the substrate polarization. We show that the topography of the gold plate in contact with the RTIL has a significant impact on the structure of the confined film and the corresponding friction force. The RTIL features in-plane ordering at both surfaces (Au(100) and Au(111)), but the friction coefficients are significantly higher in ionic liquid monolayers confined between Au(100) surfaces. Interestingly, the electronic polarizability of the surfaces appears to have a weak impact on the general friction behaviour of the confined films. We will consider possible reasons for this.
2 Simulation model
We performed NEMD simulations to investigate the properties of [C2MIM]+ [NTf2]− confined between neutral plates made of gold (Fig. 1) using the simulation set-up described in ref. 4, 7, 10 and 19. Briefly, we applied a load FL = 2fL on the confined liquid by imposing a force fL on each plate to mimic the experimental Surface Force Apparatus (SFA) and AFM setup. The load was applied in the z direction, i.e. along the vector normal to plates surface (x, y). We generated shear by moving one of the plates at velocity vdir in the y direction (see Fig. 1 and the Methods section for further simulations details). The slabs move freely in the z direction to respond to the load, while the motion in the x direction was restrained with harmonic springs, acting on each atom in the slabs. The plates are periodic along the y axis while they are not periodic in the x direction to allow the exchange of the RTIL molecules with the bulk reservoir (see Fig. S1 in ESI† for a snapshot of the full simulated cell). The cations and anions move in and out the confined region in response to the plate fluctuations, and preserve the chemical potential, which is defined by the liquid reservoir.19 The thickness of the confined RTIL readjusts according to the load applied. Considering Aslab the surface area of the slab, the normal pressure applied on the solid plates, P = FL/Aslab, ranged between 10 MPa and 2 GPa. The stationary confined films consisted of 1 to 5 layers in this pressure range. To investigate the relationship between the friction force and the structure of the confining surfaces, we simulated the Au(111) and Au(100) planes. Furthermore, we performed simulations using both polarizable (pol)20 and non-polarizable (nopol)21 force-fields to model the gold plates. Our polarization model builds on the method introduced recently by Gaeda et al.20 which models the gold atoms as harmonically bonded core–shell particles following a Drude model approach. The ratio of masses of the (shell![[thin space (1/6-em)]](https://www.rsc.org/images/entities/char_2009.gif) :core) particles is (1:195.96). This model reproduces the classical image potential and experimental interfacial properties of the gold surface and the gold–water interface.
:core) particles is (1:195.96). This model reproduces the classical image potential and experimental interfacial properties of the gold surface and the gold–water interface.
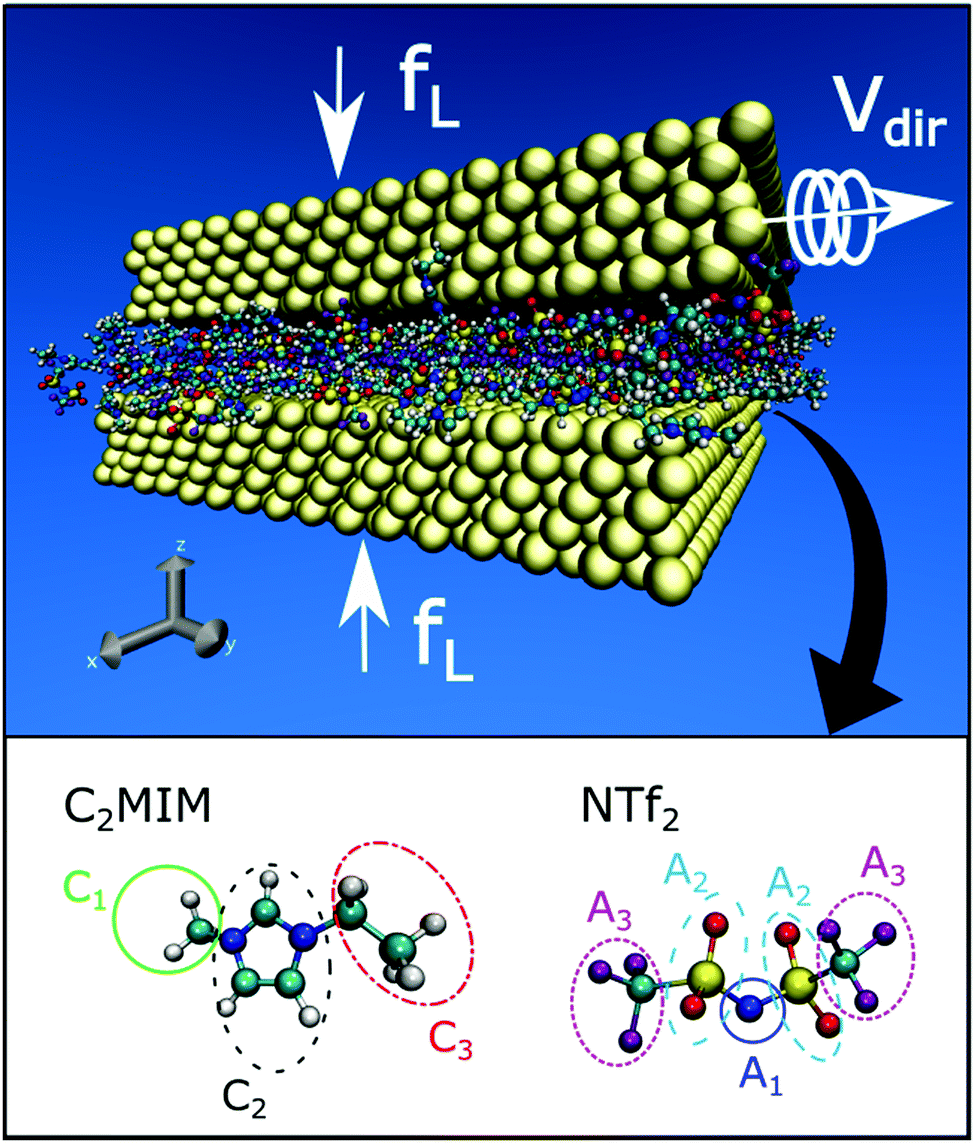 | ||
| Fig. 1 Snapshot showing the simulation set-up. A normal load fL is applied to the gold slabs, indicated with yellow spheres. The bottom slab is fixed, while the top slab moves in the y direction at constant velocity vdir. [C2MIM]+ [NTf2]− is confined between the slabs. A snapshot of the cation and anion is shown in the bottom panel, highlighting the chemical groups we have used to analyse the density profiles. | ||
3 Results
3.1 The effect of substrate structure and electronic polarisability of the metal plates
We show in Fig. 2 that the friction force increases with the normal load in all cases. Thinner films feature higher friction forces, see Fig. 3 and number of confined ionic layers, “n”, in the caption of Fig. 2. For the same number “n”, the friction force obtained with the Au(111) surface is ∼25–40% lower than for Au(100), showing the impact of the structure of the substrate on friction is significant. The dependence of the friction force, Ff, with normal load, FL, might be approximated using a modified Amontons' law, Ff = a + μFL, where the slope μ is the friction coefficient and a the friction force at zero load, which is >0 for adhesive forces. The friction coefficient of RTILs confined between Au(100) surfaces was similar for polarizable and non-polarizable substrates, μpol = 0.037 and μnopol = 0.035, respectively (see Fig. 2). The friction force of the Au(111) features a weaker dependence with load, and the friction coefficient is approximately four times lower than for Au(100) surfaces. The friction coefficients reported in Fig. S2 (ESI†) are similar to the simulation results reported before for thicker films confined between negatively charged plates (see Fig. S2 in the ESI† and ref. 16), and to experimental data, typically in the range of 0.009–0.8 (0.23–1.8 nm22–24). Overall, [C2MIM]+ [NTf2]− is a better lubricant when it is confined between the Au(111) solid plates since the magnitude of the friction force is lower. We have analysed further the microscopic origin of the different friction forces at (100) and (111) surfaces. We calculated the potential energy curves for cations and anions sliding on the two surfaces (see Fig. S11 in the ESI†). The potential energy of cations and anions features higher activation energies when the ions slide along the (100) surfaces, indicating that this surface has a rougher energy landscape. This result agrees with the higher friction reported in Fig. 2. | ||
| Fig. 2 Friction force as a function of the normal load FL, for [C2MIM]+ [NTf2]− confined between neutral gold substrates, Au(111) and Au(100). The slope of the fitted line (see main text) gives the friction coefficient μ for each set of data corresponding to n = 1 (dashed lines) and n = 2 (dotted lines) layers. The x axis is represented in a logarithmic scale to help to visualize the data corresponding to low P. | ||
 | ||
| Fig. 3 (a) Pressure-distance isotherms for [C2MIM]+ [NTf2]− confined between the neutral gold substrates (111) and (100). The error bars represent the standard deviation of the mean. The empty circles and left triangles are data taken from ref. 16, with [C2MIM]+ [NTf2]− confined between (111) charged plates with surface charges ±32 μC cm−2. The “n” value next to each isotherm indicates the number of RTIL layers. The arrows indicate the systems used to calculate the number density profiles in the direction normal to the surfaces (z), shown in panel (b) for n = 3, 0.1 GPa (top), n = 2, 0.3 GPa (center) and n = 1, 0.4 GPa (bottom). All the data correspond to the Au(111) – pol plates. The coloured areas indicate the location of the gold plates. Similar results were obtained using non-polarizable substrates, see Fig. S8 in ESI.† | ||
Comparing our results with previous data16 for the friction force of [C2MIM]+ [NTf2]− confined between negatively and positively charged surfaces with a lattice constant of 0.36 nm, we observe that for the same load, the films confined between charged surfaces are thicker, and the friction force is higher. This observation is consistent with the mechanism of electrotunable lubricity,4,7,10 which predicts the increase of the friction force with the charge of the confining plates, with the force reaching maximum friction at high charge densities. We find that the friction coefficients for the Au(111) charged surfaces in those works are similar to the neutral Au(100) surfaces investigated here (see Fig. S2, ESI†).
The friction force changes only slightly when considering bilayers and trilayers (n = 2, 3) confined between polarizable or non-polarizable substrates. The impact of polarization is more evident in ultra-thin RTILs (monolayers, n = 1) with an increase in the friction force to 5.6 ± 0.2% and 7.8 ± 0.1% for (100) and (111) surfaces, respectively. In contrast, the friction coefficients are very similar and within the uncertainty of our computations. The difference in the friction forces observed for polarizable or non-polarizable substrates for n = 1 indicates that the ions slide on surfaces featuring slightly different energy landscapes.
The polarizable model engenders slightly different charge distributions on the surfaces in direct contact with the RTIL (see Fig. S3 and discussion in ESI†) and slightly different surface densities (see number density profiles of Au(111)/pol – nopol and Au(100)/pol – nopol layers in contact with the RTIL in Fig. S4, ESI†), with the pol model showing some deviation with respect to a perfect crystalline structure (cf. Fig. S4-a, c and S4-b, d, ESI†). These deviations emerge from differences in the sliding potential surfaces due to the delocalization and the effective size of the charged sites employed to model the polarization with the Drude model. To test this idea, we performed additional simulations reducing the diameter of the lighter shell site and found that the friction forces converge towards the values obtained with the non-polarizable model (see Fig. S5 in the ESI†).
Is such a weak effect of polarizabilty of confining plates expected? The answer to this question is ambiguous. The polarizability induces screening of interionic interactions in ultra-narrow nanopores that can admit just one layer (for slit pores) or one row (for cylindrical pores) of ions. This leads to a significant reduction of the interionic interactions in the nanogap, enhancing the accumulation of like-charged ions under the action of an applied electrode potential, modifying the capacitance–voltage dependence on the distance between the confining metallic plates25 and unbinding ion pairs in an initial electroneutral liquid.26–28 Simulations of RTILs nanofilms (1–10 nm thick) showed that the electrode polarizability has a significant impact on the structure of the confined film at very high voltages ≥4 V,17,29 which are close to or above the limit that most RTILs at electrodes can withstand without oxidation or reduction. For voltages below 2 V the electrode polarizability leads to minor increases of the ion concentration or ion orientation.29
Why does the electrode polarizability have such a weak impact in our simulations? There are several aspects that might contribute to this: (1) the strong screening of image charges by the first layer of ions at the metallic surface significantly reduces the effect of electrode polarizability on the ion-pair interactions. When the distance between the plates increases, the effect rapidly disappears (see ref. 25); (2) the charges in our ions are not point-like; they are distributed. If the distance from each other is much shorter than the gap width, the difference from the Coulomb interaction is expected to be minor; (3) our simulations show that the friction is determined mainly by the lateral ordering and alignment of confined ions. These properties are only slightly affected by the electrode polarizability. These are qualitative arguments that may justify the observed effect, or more precisely – its absence, but further investigation of this issue is needed.
3.2 Dependence of the nanofilm lateral structure with pressure and substrate type
Fig. 3a shows the pressure-distance isotherms, which give information on the structural forces in the confined films. The isotherms were obtained by simulating confined system with inter-plate distances between 0.7 and 3.5 nm. A normal load, between 10 MPa and 2 GPa, was applied on the slabs during 0.1 μs. The isotherms feature the characteristic squeeze-out “jump” with an inter-branch distance of 0.428 ± 0.016 nm at 400 MPa and 0.364 ± 0.088 nm at 1 GPa. These distances are shorter than the characteristic size of the ions in bulk (see main peaks for cations and anions feature maxima around 0.8 nm, see Fig. S6 in ESI†), indicating a stronger preference for the ions to adopt specific orientations under confinement, unlike in the bulk system where the liquid is isotropic, and the rotations are not hindered. The film thicknesses 0.7–0.74 nm and 1.09–1.16 nm for the first and second branches, respectively, do not depend significantly on the substrate structure, namely (100) vs. (111) surface nor on the substrate polarizability.The density profiles (see Fig. 3b) in the direction normal to the confining surfaces show that the ionic layers are approximately equally populated by both cations and anions. The adsorption at the (111) plates is slightly higher than at the (100) surfaces, ∼14% for P = 2 GPa (see Fig. S7, ESI†). The polarization effects are again negligible; we do not observe a higher/lower tendency for ion adsorption. This conclusion agrees with recent studies using the same polarizable model, which concluded that the incorporation of polarization does not significantly impact the structure of RTILs.30 We show here that polarization effects do not significantly influence the structure and friction forces of ultra-thin films consisting of 1 single layer of RTIL.
The films confined between neutral surfaces feature low resistance to squeeze-out. Upon increasing the pressure to 50 MPa, the film thickness drops from 3.29 nm to ∼2.68 nm. At 0.2 GPa, the film thickness is slightly above 1 nm (two ionic layers) and above 1 GPa the film thickness reduces to one layer, n = 1 (see Fig. 3a and b). Under these high confinement conditions, the confining surface properties and the solid–liquid interactions become dominant, strongly influencing the friction force (see Fig. 2). In the monolayers, n = 1, the [NTf2]− anions distribute across two planes (see maxima in Fig. 3b bottom), and the CF3 groups are located mostly in one layer. For thicker films, n = 2 and 3 the CF3 groups are distributed in two maxima in the interior of the confined region (see A3 in Fig. 3b). This structure is consistent with the formation of the “boat” conformation discussed in ref. 16.
We have shown that RTILs confined between neutral surfaces can be squeezed out easily. We compare in Fig. 3 the surface forces for these films with data published before16 for charged surfaces (111) with a charge density ±32 μC cm−2 and a lattice parameter of 0.36 nm. RTIL films confined between equally charged surfaces contain an odd number of layers, cation- or anion-rich (see empty circles and left triangles). For the same pressure conditions, the films are thicker than those confined between neutral surface, and therefore they are less compressible. At 100 MPa the film thicknesses of neutral and charged surfaces are 2.534 ± 0.050 nm, n = 6 and 2.957 ± 0.023 nm (−32 μC cm−2) or 2.998 ± 0.033 nm (+32 μC cm−2), n = 7, respectively. The films confined between charged surfaces stand higher loads, 400 MPa (see n = 5 equivalent to 2.3 nm, for ±32 μC cm−2 systems in Fig. 3a). The thinning process between neutral surfaces is very fast. Starting with an inter-slab distance of 4 nm, the ions are squeezed out in the first 10–20 ns, reaching three layers for loads between 50 MPa and 200 MPa and two layers for P > 200 MPa. At very high pressures we observe ultra-thin RTIL, one layer thick, films that sustain loads as high as 2 GPa. The increase in the friction force is relatively weak in this large pressure interval. For instance, for (100) surfaces, the friction force increases 25% in going from 0.1 GPa to 2 GPa.
3.3 Friction force traces and dynamics of the confined layers
We have analysed the dynamics of the sliding process in the presence of the RTIL lubricant considering films of different thicknesses. We show in Fig. 4 (polarizable model) and Fig. S9 (ESI†) (non polarizable model) the friction force-displacement/time curves for the RTILs confined between Au(111) and Au(100) substrates calculated for different pressures/thicknesses. For thicker films (100 MPa, n > 1), the force-distance curves show a chaotic behaviour without clear stick-slip events. Stick-slip can be observed at 300 MPa, when the RTIL bilayer is formed, but the trajectory is still dominated by chaotic dynamics. Clear stick-slip motion is observed in ultra-thin films, n = 1, and very high loads (see 400 MPa and 2 GPa panels in Fig. 4). In this instance, we observe quasi-periodic saw-tooth-like (gradual rise and sharp fall) and triangular-like (symmetrical rise and fall) friction forces with a well defined period, for (111) and for (100), respectively. | ||
| Fig. 4 Friction force-displacement and friction force-time curves for [C2MIM]+ [NTf2]− confined between Au(111) (a) and Au(100) (b) polarizable model (d) and different external loads. The black lines represent the raw data and the green lines a running average over 500 points. 100 MPa corresponds to n = 3, 300 MPa to n = 2 and, 400 MPa and 2 GPa to n = 1. The red lines show linear fittings to the friction. The corresponding friction constants are show in next to each line. | ||
At the highest load, 2 GPa, the RTIL monolayer confined between the Au(100) shows the most pronounced stick-slip motion (cf. Au(100) and Au(111) 2 GPa in Fig. 4). The typical distance between the maxima is of the order of 0.49 ± 0.01 nm and 0.45 ± 0.01 nm for (111) and for (100), respectively. A similar behaviour is observed with the non-polarizable model, with period of the order of 0.46 ± 0.05 nm and 0.50 ± 0.01 nm for (111) and for (100), respectively, although the maximum forces achieved in the stick-slip curves are lower than in the polarizable case (see Fig. S9, ESI†). The distance between maxima is of the same order as the jump distance in the structural forces and of the order of one ion diameter. Moreover, the distances agree well with the distance between potential energy maxima inferred from Fig. S11 (ESI†) (0.4–0.55 nm). This distance range corresponds to ∼2nd nearest neighbour Au–Au distance in the gold lattice.
To analyse further the dynamic behaviour of the confined layers, we calculated the velocity profiles of films of different thicknesses (see Fig. S12, ESI†). The velocities for the n = 2 and n = 3 cases conform to the “plug” profile, with the ionic layers sliding approximately at the same speed. This behaviour is characteristic of strong interlayer correlations, and it has been observed before in simulations of RTILs confined between weakly charged surfaces10. The velocity profiles indicate that the slippage plane is located between the RTIL film and the gold substrate, and therefore the friction force is determined by the direct contact between the RTIL and the gold surface. This result explains the higher friction force observed for the (100) face at all loads (see Fig. 2), as this plane features a more corrugated potential energy landscape (see Fig. S11, ESI†).
3.4 In-plane structure of the confined films and ion orientation
Table 1 collects our results for the in-plane structure of the RTIL “contact layer” adsorbed directly on the Au(100) substrate, for different pressures in the range 0.1–2 GPa and film thicknesses, corresponding to n = 3, n = 2 and n = 1 ionic layers. The pressure (film thickness) influences significantly the ion orientation. At low pressures, 100 MPa (thicker films with n = 3), the imidazolium ring lies flat on the gold surface (see snapshots Table 1 first column). The normalised angular probability distribution functions (PDF) (see fourth column in Table 1) show that this orientation is dominant. The angles between the vector defining the orientation of the anion or cation (see arrows in the snapshots of the molecules) and the unit vector parallel to the surface are distributed around θ = 0°.
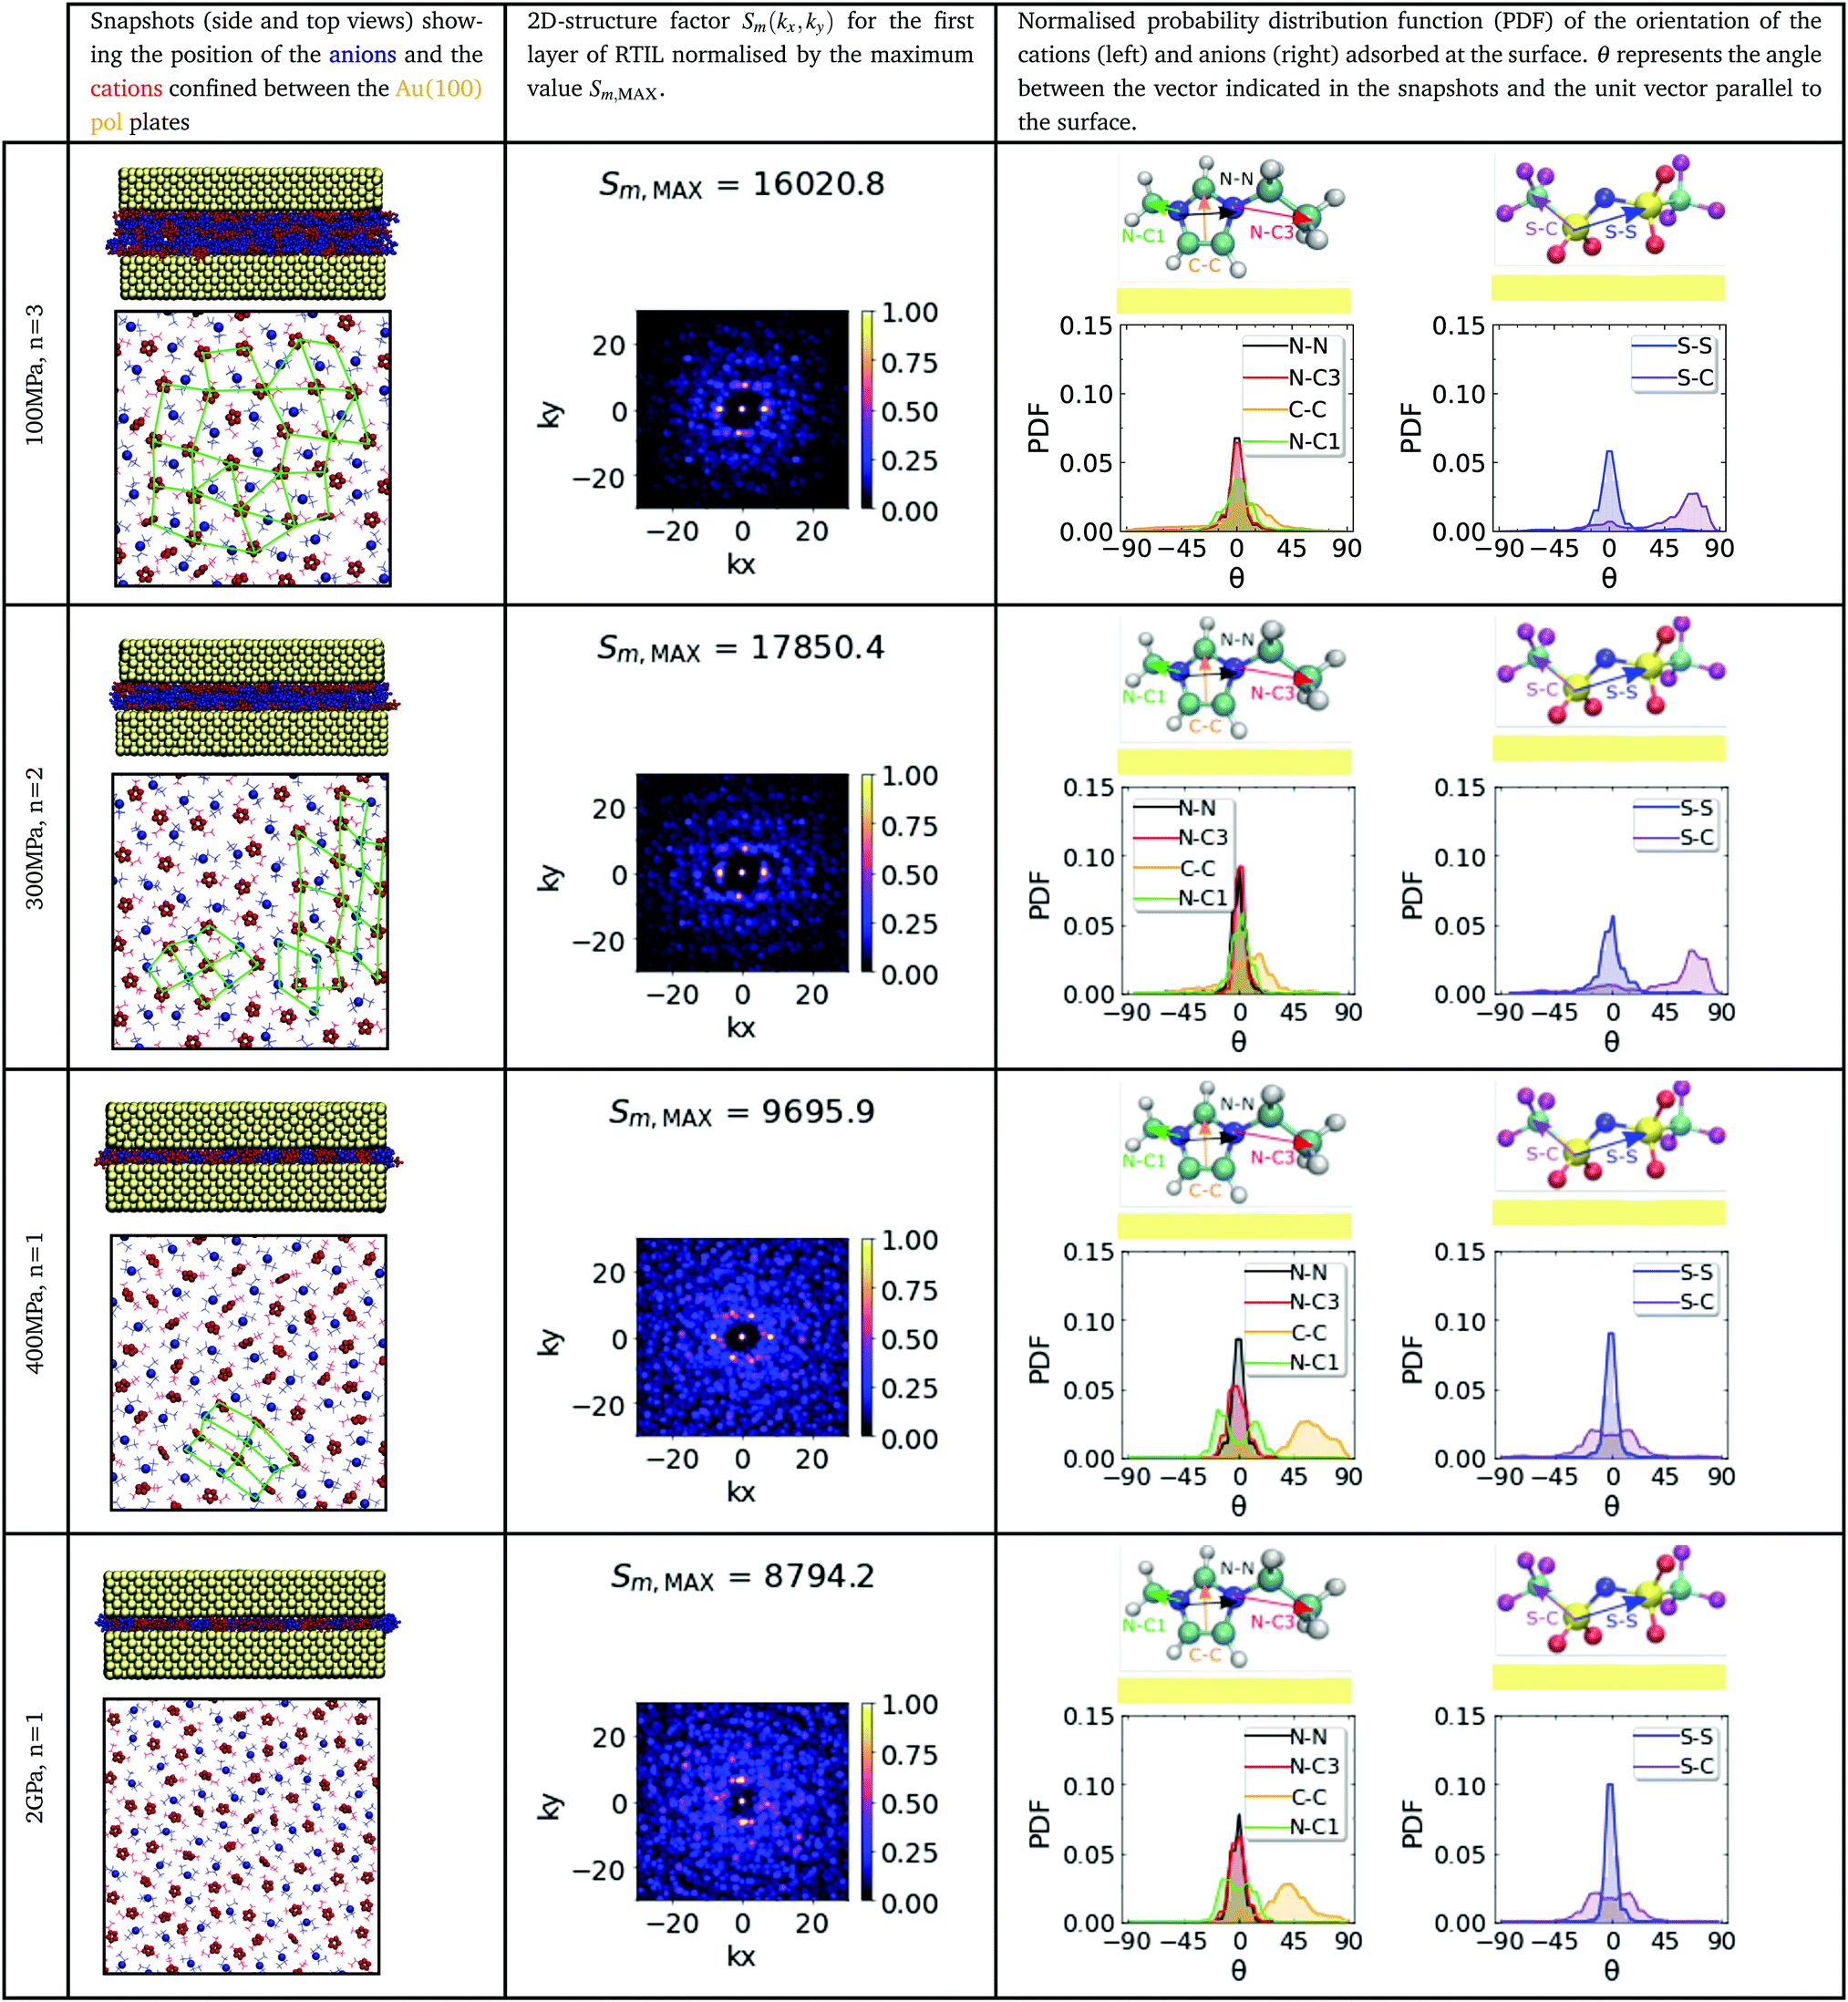
|
At high pressure, 2 GPa, the film forms a monolayer, ∼0.7–0.8 nm (n = 1) (see Fig. 3a), and the orientational distribution functions for the imidazolium ring changes significantly with respect to those obtained for thicker films. The plane of the imidazolium ring is now tilted (C–C vector Table 1) relative to the gold surface, while the tail of the cation (see PDF for the N–C3 vector in Table 1) lies flat on the surface. This result may seem counter-intuitive as one may expect a flatter orientation of the imidazolium ring at higher pressure. However, the simulations indicate the opposite and highlight the importance of the ionic layers in the interior of the film in defining the structure of the “contact layers” for thicker films (n > 1). The [NTf2]− anion also experiences significant conformational changes, from a cisoid (low pressure, 100 and 200 MPa) to a transoid (high pressure, 400 MPa and 2 GPa) conformation (C–S⋯S–C ≃ 180°). The structural changes described above were found for both types of gold surfaces, (100) and (111) (cf.Tables 1 and 2, second and fourth columns). We observe the same pressure-induced reorientation effects for non-polarizable substrates (see Tables S1 and S2, ESI†). Hence, this behaviour is connected to confinement only and not to substrate polarization.

|
We have investigated the microscopic origin of the tilt observed in the imidazolium rings in the confined monolayers. We performed additional simulations of monolayers consisting of ten ion pairs (see Fig. S13 in the ESI†). The initial configurations were obtained from previous simulations of non-polarizable substances (111) at 400 MPa, where the imidazolium rings feature a tilt orientation. Two simulations were performed: under confinement conditions and for an unconfined systems, where one of the gold slabs was removed. The simulations were performed at equilibrium conditions. We find that the monolayers relax quickly for the unconfined system, and the imidazolium rings adopt a “flat on” orientation on the gold substrate. This result is consistent with previous simulation studies using ab initio density functional theory.31 Signatures of flat conformations have also been observed using Surface enhance Rahman Scattering of methylimidazole adsorbed on (111) copper.32
Interestingly, by confining the RTIL with the second substrate and recovering the confinement conditions compatible with a load of 400 MPa, we find that the imidazolium rings adopted a tilt orientation. Since these results were obtained using equilibrium simulations, we can discard shear as responsible for the tilt of the imidazolium rings. The dependence of the orientation with the degree of confinement is a very interesting result, which emerges from the different conformations of the imidazolium and [NTf2]− ions under free or confinement conditions. The results discussed above are consistent with the behaviour reported in our orientational distribution functions (Tables 1 and 2), which are distinctively different for n = 2, 3 and n = 1 layers. For multilayers, the lack of direct contact of the RTIL with both substrates facilitates the relaxation of the structure resulting in the flat orientation of the imidazolium ring and, therefore, a reduction of the orientational disorder.
The orientational disorder of the imidazolium group at high pressure has important implications for the in-plane ordering of the ionic liquid film. We analyse the structural changes using the 2D structure factor (see ESI† for computational details). The structure factors show well defined bright spots for the thicker films n = 2, 3 (see second column in Tables 1 and 2), indicating stronger in-plane ordering. We observe four bright spots for the (100) surface (see n = 3, 100 MPa and n = 2, 300 MPa data in Table 1) consistent with a square planar lattice, and six bright spots for the (111) surface (see n = 2, 3 systems in Table 2), more consistent with a honeycomb structure. Hence, the symmetry of the surfaces in contact with the RTIL matters and induces measurable structural effects. These epitaxy effects are likely responsible for the friction forces observed at ultra-high confinement (n = 1), since the ions in direct contact with the surfaces experience different sliding energy landscapes (see Fig. S4 and S11, ESI†).
We observe a loss of in-plane ordering in ultra-thin RTIL films confined between (100) surfaces. For n = 1 and 400 MPa, some bright spots can be observed, but the dominant structure is not as well defined as in the thicker films. At the highest pressure, the structure factor of the RTIL does not show evidence for in-plane order (see structure factor for the 2 GPa, n = 1 system in Table 1). The RTIL monolayers confined between the (111) surfaces do not exhibit in-plane order either at P = 400 MPa. However, at the highest pressure, 2 GPa (see Table 2) the structure factor features well defined bright spots indicating in-plane order. We have highlighted in the snapshots presented in Tables 1 and 2 the regions corresponding to the formation of regular structures of cations and anions. Our simulations show that the in-plane structure of the RTIL films is fairly complex and strongly dependent on the structure of the confining plates. The general behaviour discussed above holds also for non-polarizable surfaces, with the structure factors showing, in general, better defined bright spots in thicker films n = 2, 3.
The lack of strong ordering in all the ultra-thin films (n = 1) investigated here is in contrast with previous simulations of ionic liquid monolayers, which showed the formation of crystalline structures33 in 1,3-dimethylimidazolium chloride monolayers. These structures disappeared in thicker films (bilayers). However, our work shows that thicker films can also feature in-plane ordering, and this is even better defined than the one obtained with some of the monolayers studied here. The ordering is facilitated by the favourable orientation of the imidazolium ring. When the ring lies flat on the surface (for bilayers and trilayers) the films features extended in-plane order. The differences between the results reported before33 and ours indicate that the higher complexity of the anions considered here, involving orientational degrees of freedom and charge delocalization, influences the ability of the RTIL monolayers to crystallise under strong confinement conditions.
4 Conclusions
We have investigated the lubrication behaviour of the ionic liquid [C2MIM]+ [NTf2]−, confined between neutral gold surfaces and addressed three key aspects: the impact of confinement and the substrate structure and the role of electronic polarizability of the confining metallic plates-in ultra-thin lubricating films. We conclude the following from our investigation:• The pressure and film thickness significantly impact the conformation, orientation and lateral ordering of the cations and anions in the confined region. Counter-intuitively, thinner films (high loads) form in general less ordered structures than in sliding thicker films (2 or 3 layers). The disorder is characterised by a tilt of the imidazolium rings with the substrate plane. We have shown that the tilt appears under conditions of strong confinement (loads ∼0.4 GP and above, while in unconfined monolayers deposited on the gold substrate, the imidazolium rings lie flat on the surface. This observation for unconfined systems is consistent with previous simulation and experimental studies. Hence, we show a microscopic mechanism for orientation disorder induced by nano-confinement, which translates in a decrease of lateral order.
• RTILs confined between charged surfaces are less compressible than those confined between neutral surfaces. This difference could favour the use of charged surfaces over neutral ones. However, ultra-thin films consisting of one or two layers of mixed cations and anions confined between neutral surface can sustain very high pressures, up to 1–2GPa, without being squeezed out from the confined region. Hence, the confinement of RTILs between neutral surfaces reveals itself as a valid approach for nanotribological applications using RTILs.
• The friction force for monolayers of RTIL confined between Au(100) surfaces is ∼25–40% higher than that obtained using Au(111) surfaces. The higher friction force at (100) surfaces is consistent with a rougher potential energy profile, involving higher activation energies for the motion of the ions in contact with the solid. The friction coefficient calculated at the Au(111) surface is lower (about four times) than the coefficient obtained with the Au(100) surface. However, the differences in the friction forces of (100) and (111) surfaces are lost quickly when the film thickness increases from 1 to 2, 3 ionic layers, and the friction force for bilayers and trilayers practically stops depending on the symmetry of the confined plate.
• The polarization of the metallic surfaces appears to have a negligible impact on the lubricating and structural properties of the confined RTILs investigated here. We obtain fairly similar film thickness, friction forces and friction coefficients, with or without electronic polarizability of the metallic plates.
Our work supports the view that RTILs under strong nanoconfined can form crystalline structures. This notion is consistent with experimental and simulation observations. However, we also find a complex scenario regarding the ordering of confined RTILs, which results from the interplay of orientational degrees of freedom of cations and anions with the pressure/film thickness and the structure of the confining plates. Further investigations using other neutral substrates with different atomic structure would be helpful to advance our understanding of the lubrication properties of these fascinating liquids.
5 Methods
We confined 1-ethyl-3-methylimidazolium bis(trifluoromethylsulfonyl)imide, [C2MIM]+ [NTf2]−, between metallic substrates with lattice structure Au(100) or Au(111). The gold atoms in the substrate were described using a polarizable20 and non-polarizable Lennard Jones models21 that reproduced accurately bulk and surface properties of gold. For the polarizable force-field, each gold atom was described using a Drude pair, consisting of a core with positive charge +1e, and a shell particle negatively charged, −1e. The shell particle is attached to the core one with a harmonic spring. This Drude model allows the metallic surface to polarize and therefore respond to local changes in the position and structure of the ions.All the trajectories were obtained using GROMACS v.2018.234,35 with a Leap Frog algorithm and a time step of 2 fs. The simulation set-up used, imitates SFA and AFM experiments, ensuring the chemical potential in the confined region is kept constant by coupling this region to a liquid reservoir. We follow the implementation discussed in ref. 7, 10 and 19. Two metal slabs were placed at a nanometer separation and immersed in a bulk ionic liquid. The surface to surface distance was controlled by applying a normal load, fL, on both slabs, resulting in a total force FL = 2fL. The shear was induced by pulling one of the plates along the y axis (see Fig. 1), attaching to its center of mass a spring with force constant ∼16 N m−1, and moving the plate at constant velocity, vdir = 5 m s−1. The position and orientation of the plates were controlled with harmonic restraints, with a force constant of 104 kJ mol−1 nm−2. The restraints were applied in the x and y directions to the atoms in the static slab and, in the x direction only, to the atoms of the sliding slab. No restrain was applied in the z direction to allow the surfaces to adjust as a response to the normal force FL.
The dimension of the simulation cell were {lx, ly, lz} = {16.00, 7.94, 17.25} nm. The total simulation cell is fully periodic in all three directions (see Fig. S1, ESI†). The density of the RTIL in the reservoir region far from the slab was adjusted to the value corresponding to the bulk liquid at 350 K and 1 bar. The gold plates were built using faced-centered cubic (111) and simple cubic (100) crystals with lattice parameter of 0.408 nm. The plate dimension were {lx, ly, lz} = {7.79, 7.94, 1.41} nm for (111) and {lx, ly, lz} = {7.75, 7.75, 1.22} nm for (100).
[C2MIM]+ [NTf2]− was modelled using the Köddermann et al.36 force-filed. This force-field is based on the Canongia Lopes et al.37 model, but it has been modified, by reducing some of the Lennard-Jones interactions, to reproduce densities, self-diffusion coefficient of the ionic liquid and NMR rotational correlation times for the ions in [C2MIM]+ [NTf2]− at 303 K. The cutoff radius used for the Lennard-Jones interactions and the Coulombic forces (in real space) was 1.2 nm. The Coulombic interactions were computed in full using the Particle Mesh Ewald method38, with a mesh width of 0.12 nm and a fourth order interpolation.
The simulations involved an NVT equilibration cycle of 4 ns at 350 K, using the v-rescale thermostat39 with time constant 0.1 ps. The thermostat was applied to all the particles in the system. Following the equilibration, we applied the normal load FL for 4 ns, followed by extra 4 ns in which one of the slabs was pulled along the y axis. During this 8 ns and the production run, the thermostats were applied to the gold atoms only, and kept at an average temperature of 350 K using the v-rescale thermostat. The ionic liquid molecules were not thermostatted. The average temperature of the whole system is maintained constant (typically heating up slightly, a few degrees) during the shearing process. The friction force was computed by calculating the average lateral spring force acting on the slabs. A typical production run was 0.1 μs long. We ensured that the slab-slab average distance was constant for at least 40 ns before calculating average properties. The density profiles, number of molecules in the confined region, molecular orientation and structure factors were computed by analyzing configurations corresponding to the last 5 ns of each run.
Conflicts of interest
There are no conflicts to declare.Acknowledgements
The authors thank The Leverhulme Trust for the award of research grant RPG-2016-223, the Imperial College High Performance Computing Service and the ICL RCS High Performance Computing facility and the UK Materials and Molecular Modelling Hub partially funded by the EPSRC (EP/P020194/1 and EP/T022213/1), for providing computational resources. M. U. acknowledges the financial support of the Israel Science Foundation, Grant No. 1141/18.Notes and references
- A. Vanossi, N. Manini, M. Urbakh, S. Zapperi and E. Tosatti, Rev. Mod. Phys., 2013, 85, 529–552 CrossRef CAS.
- C. Drummond, Phys. Rev. Lett., 2012, 109, 154302 CrossRef PubMed.
- J. Sweeney, F. Hausen, R. Hayes, G. B. Webber, F. Endres, M. W. Rutland, R. Bennewitz and R. Atkin, Phys. Rev. Lett., 2012, 109, 155502 CrossRef PubMed.
- O. Y. Fajardo, F. Bresme, A. A. Kornyshev and M. Urbakh, Sci. Rep., 2015, 5, 7698 CrossRef CAS PubMed.
- A. M. Smith, K. R. J. Lovelock, N. N. Gosvami, T. Welton and S. Perkin, Phys. Chem. Chem. Phys., 2013, 15, 15317–15320 RSC.
- H. Li, M. W. Rutland and R. Atkin, Phys. Chem. Chem. Phys., 2013, 15, 14616–14623 RSC.
- O. Y. Fajardo, F. Bresme, A. A. Kornyshev and M. Urbakh, J. Phys. Chem. Lett., 2015, 6, 3998–4004 CrossRef CAS PubMed.
- H. Li, R. J. Wood, M. W. Rutland and R. Atkin, Chem. Commun., 2014, 50, 4368–4370 RSC.
- G. Krämer and R. Bennewitz, J. Phys. Chem. C, 2019, 123, 28284–28290 CrossRef.
- S. Di Lecce, M. Urbakh, A. A. Kornyshev and F. Bresme, ACS Appl. Mater. Interfaces, 2020, 12, 4105–4113 CrossRef CAS PubMed.
- A. M. Smith, K. R. Lovelock, N. N. Gosvami, P. Licence, A. Dolan, T. Welton and S. Perkin, J. Phys. Chem. Lett., 2013, 4, 378–382 CrossRef CAS PubMed.
- R. Espinosa-Marzal, A. Arcifa, A. Rossi and N. Spencer, J. Phys. Chem. C, 2014, 118, 6491–6503 CrossRef CAS.
- O. Y. Fajardo, F. Bresme, A. A. Kornyshev and M. Urbakh, ACS Nano, 2017, 11, 6825–6831 CrossRef CAS PubMed.
- A. David, O. Y. Fajardo, A. A. Kornyshev, M. Urbakh and F. Bresme, Faraday Discuss., 2017, 199, 279–297 RSC.
- A. M. Smith, J. E. Hallett and S. Perkin, Proc. Natl. Acad. Sci. U. S. A., 2019, 116, 25418–25423 CrossRef CAS PubMed.
- S. Di Lecce, A. A. Kornyshev, M. Urbakh and F. Bresme, ACS Nano, 2020, 14, 13256–13267 CrossRef CAS PubMed.
- C. Merlet, C. Péan, B. Rotenberg, P. A. Madden, P. Simon and M. Salanne, J. Phys. Chem. Lett., 2013, 4, 264–268 CrossRef CAS PubMed.
- L. Scalfi, M. Salanne and B. Rotenberg, Annu. Rev. Phys. Chem., 2021, 72, 189–212 CrossRef CAS PubMed.
- L. G. Camara and F. Bresme, J. Chem. Phys., 2003, 119, 2792–2800 CrossRef CAS.
- I. L. Geada, H. Ramezani-Dakhel, T. Jamil, M. Sulpizi and H. Heinz, Nat. Commun., 2018, 9, 1–14 CrossRef CAS PubMed.
- H. Heinz, R. A. Vaia, B. L. Farmer and R. R. Naik, J. Phys. Chem. C, 2008, 112, 17281–17290 CrossRef CAS.
- C. Ye, W. Liu, Y. Chen and L. Yu, Chem. Commun., 2001, 2244–2245 RSC.
- S. Perkin, T. Albrecht and J. Klein, Phys. Chem. Chem. Phys., 2010, 12, 1243–1247 RSC.
- B. Bhushan, M. Palacio and B. Kinzig, J. Colloid Interface Sci., 2008, 317, 275–287 CrossRef CAS PubMed.
- A. A. Kornyshev, Faraday Discuss., 2013, 164, 117–133 RSC.
- C. Merlet, B. Rotenberg, P. A. Madden, P.-L. Taberna, P. Simon, Y. Gogotsi and M. Salanne, Nat. Mater., 2012, 11, 306–310 CrossRef CAS PubMed.
- R. Futamura, T. Iiyama, Y. Takasaki, Y. Gogotsi, M. J. Biggs, M. Salanne, J. Ségalini, P. Simon and K. Kaneko, Nat. Mater., 2017, 16, 1225–1232 CrossRef CAS PubMed.
- T. Mendez-Morales, M. Burbano, M. Haefele, B. Rotenberg and M. Salanne, J. Chem. Phys., 2018, 148, 193812 CrossRef PubMed.
- J. B. Haskins and J. W. Lawson, J. Chem. Phys., 2016, 144, 184707 CrossRef PubMed.
- S. Ntim and M. Sulpizi, Phys. Chem. Chem. Phys., 2020, 22, 10786–10791 RSC.
- K. C. Jha, H. Liu, M. R. Bockstaller and H. Heinz, J. Phys. Chem. C, 2013, 117, 25969–25981 CrossRef CAS.
- Y.-X. Yuan, T.-C. Niu, M.-M. Xu, J.-L. Yao and R.-A. Gu, J. Raman Spectrosc., 2010, 41, 516–523 CrossRef CAS.
- M. Sha, G. Wu, H. Fang, G. Zhu and Y. Liu, J. Phys. Chem. C, 2008, 112, 18584–18587 CrossRef CAS.
- H. Berendsen, D. van der Spoel and R. van Drunen, Comput. Phys. Commun., 1995, 91, 43–56 CrossRef CAS.
- E. Lindahl, B. Hess and D. van der Spoel, J. Mol. Model., 2001, 7, 306–317 CrossRef CAS.
- T. Köddermann, D. Paschek and R. Ludwig, ChemPhysChem, 2007, 8, 2464–2470 CrossRef PubMed.
- J. N. Canongia Lopes and A. A. Pádua, J. Phys. Chem. B, 2006, 110, 3330–3335 CrossRef CAS PubMed.
- U. Essmann, L. Perera, M. L. Berkowitz, T. Darden, H. Lee and L. G. Pedersen, J. Chem. Phys., 1995, 103, 8577–8593 CrossRef CAS.
- G. Bussi, D. Donadio and M. Parrinello, J. Chem. Phys., 2007, 126, 014101 CrossRef PubMed.
Footnote |
| † Electronic supplementary information (ESI) available: Additional information on structual calculations, adsorption, and data for non-polarizable models. See DOI: 10.1039/d1cp03345j |
| This journal is © the Owner Societies 2021 |