Development of a coupled geophysical–geothermal scheme for quantification of hydrates in gas hydrate-bearing permafrost sediments†
Received
6th July 2021
, Accepted 6th October 2021
First published on 6th October 2021
Abstract
Quantification of hydrates in permafrost sediments using conventional seismic techniques has always been a major challenge in the study of the climate-driven evolution of gas hydrate-bearing permafrost sediments due to almost identical acoustic properties of hydrates and ice. In this article, a coupled geophysical–geothermal scheme is developed, for the first time, to predict hydrate saturation in gas hydrate-bearing permafrost sediments by utilising their geophysical and geothermal responses. The scheme includes a geophysical part which interprets the measured elastic wave velocities using a rock-physics model, coupled with a geothermal part, interpreting the measured effective thermal conductivity (ETC) using a new pore-scale model. By conducting a series of sensitivity analyses, it is shown that the ETC model is able to incorporate the effect of the hydrate pore-scale habit and hydrate/ice-forced heave as well as the effect of unfrozen water saturation under frozen conditions. Given that the geophysical and geothermal responses depend on the overburden pressure, the elastic wave velocities and ETC of methane hydrate-bearing permafrost sediment samples were measured at different effective overburden pressures and the results were provided. These experimental data together with the results of our recent study on the geophysical and geothermal responses of gas hydrate-bearing permafrost sediment samples at different hydrate saturations are used to validate the performance of the coupled scheme. By comparing the predicted saturations with those obtained experimentally, it is shown that the coupled scheme is able to quantify the saturation of the co-existing phases with an acceptable accuracy in a wide range of hydrate saturations and at different overburden pressures.
1. Introduction
Permafrost is any ground that remains at or below 0 °C for at least two consecutive years.1 It forms a layer with a thickness of centimetres to kilometres, which is sandwiched between a seasonally-thawed active layer on top and an unfrozen ground at the bottom.2 Permafrost underlies almost 25% of the entire northern hemisphere; it is widespread in the Arctic regions of Siberia, Canada, Greenland, and Alaska, and also found on the Tibetan plateau and the floor of the Arctic Ocean.1,3 Permafrost is a key component of the cryosphere, playing an important role in global climate, environmental systems, and human activities in the Arctic regions.4 Presently, the Arctic is warming twice as fast as the rest of the planet, resulting in a pronounced permafrost degradation,5 which in turn raises concerns about the integrity of ecosystems, the sustainability of water resources, and altered hydrological risks under climate change scenarios.6 These concerns have attracted increasing attention from the scientific community and the general public. A combination of field studies, remote sensing analyses and accurate modelling approaches is necessary to understand the potential impacts associated with the permafrost degradation on the ecosystems and infrastructures in the Arctic regions (local and regional scale) as well as the potential enhancement of climatic change through the emission of greenhouse gases (global scale).7 Several studies have been carried out so far to model the dynamics of permafrost sediments exposed to a warming climate, attempting to characterise their hydrologic alterations and thermal responses due to the climate-driven thawing.8–10 Accurate modelling of the future evolution of permafrost in response to the thermal stimuli and assessment of the hazard potential due to its degradation require a profound understanding of the internal structure of the host sediment and its interaction with the co-existing phases in pore space which typically include ice, unfrozen water, and free gas.11 In regions where natural gas is supplied from the subsurface and the thermodynamic conditions are favourable, gas hydrates may form and co-exist with the other phases, hence adding further complexities to the interactions.12,13
The physical properties of permafrost are essentially controlled by the relative contribution of each phase (grains, ice, unfrozen water, hydrates, and gas) to the bulk sediment, hence depending on the saturation, and pore-scale spatial distribution of the various co-existing phases in pore space.14 Moreover, it is essential to account for the complexities associated with the interaction of the co-existing phases with each other and the host sediment to be able to predict their geophysical, geothermal, geomechanical, and hydrologic properties.15 Therefore, it is of the utmost importance to accurately quantify the saturation of the co-existing phases in permafrost sediments.
Analysis of the geophysical response of permafrost using the available rock-physics models is a common method to infer the saturation of the co-existing phases.14,16 The main reason is that the presence of ice in the pore space with elastic moduli higher than those of the other co-existing pore fluids (free gas and unfrozen water) enhances the skeletal stiffness of the host sediments and results in elevated elastic wave velocities. Thanks to this feature, seismic techniques have been widely used in permafrost research to understand the physical characteristics of ice-bearing sediments at both lab and field scales.17–22 Some models have also been developed to explain the evolution of elastic wave velocities under frozen conditions as well as during the freeze–thaw transition.23,24 However, there is still a lack of fundamental understanding of the pore-scale phenomena which influence the physical properties of permafrost, particularly gas hydrate-bearing permafrost sediments.11 The biggest challenge is that conventional seismic techniques are unable to distinguish gas hydrates from ice because they both exhibit almost identical acoustic properties. Thus, despite its significance, the co-existence of gas hydrates and ice has not been incorporated into the available models yet. It should be noted that the intrinsic thermal and mechanical properties of ice and natural gas hydrates, and even their pore-scale distribution in pore space are markedly different.11,12 Given that the physical properties of a gas hydrate-bearing permafrost porous sediment depend on the relative contributions of all co-existing phases (ice, hydrates, unfrozen water, and gas) to the bulk sediment, prediction of its evolution in response to climate change is not possible unless the co-existence and interactions of these phases are well understood and appropriately incorporated into the predictive models.
In our previous studies, we shed light on the co-existence of gas hydrates and ice in porous media with particular interest in its effect on the geophysical, geothermal, and geomechanical properties of gas hydrate-bearing permafrost sediments. The results of our triaxial compression tests revealed that gas hydrates and ice distinctively influence the shearing characteristics and deformation behaviour of sediments.11 While frozen hydrate-free sediments experienced a brittle-like failure, hydrate-bearing sediments exhibited a large dilatation without any rapid failure. This is because hydrate formation in sediments resulted in a reduction in the internal friction, while freezing did not. In addition, it was shown that gas hydrates play a dominant role in the reinforcement of frozen sediments. Our study on the geophysical and geothermal responses of gas hydrate-bearing permafrost sediments at different hydrate saturations confirmed that the development of hydrate micro-frame structures throughout the frozen sediment reinforces its stiffness, leading to higher elastic moduli and, consequently, shifting the elastic wave velocities toward the elevated values.25 The results also showed that the amount and pore-scale distribution of unfrozen water control the evolution of the elastic wave velocities and efficiency of the heat transfer under frozen conditions, particularly at temperatures close to the freezing point. Furthermore, we demonstrated that the effective thermal conductivity (ETC) can be utilised as a distinctive physical property to account for the unfrozen water content and, more interestingly, distinguish gas hydrates from ice under frozen conditions. Eventually, a conceptual pore-scale model was proposed for gas hydrate-bearing permafrost sediments according to their geophysical and geothermal responses at different temperatures.
This work completes our previous studies. For the first time, a coupled scheme is developed to quantify hydrates in gas hydrate-bearing permafrost sediments using their geophysical (P- and S-wave velocities) and geothermal (ETC) responses. The scheme employs a rock-physics model coupled with a new ETC model to interpret the geophysical and geothermal responses, respectively, and is able to work in a wide range of hydrate saturations and under different PT conditions and overburden pressures. Prior to our detailed discussion regarding the performance of the new ETC model and coupled scheme, we provide insights into the effect of the overburden pressure on the geophysical and geothermal responses of gas hydrate-bearing permafrost sediment samples to temperature changes by measuring and reporting their elastic wave velocities and ETC at different effective overburden pressures.
2. Experimental section
A detailed description of the materials (pure methane, deionised water, and natural silica sand), illustration of the experimental apparatus, and demonstration of the experimental procedure, together with the saturation calculation process, can be found in our recently published articles25,26 and hence not discussed here for the sake of brevity. It should be noted that a well-characterised natural silica sand from Fife, Scotland was used as the porous medium for the experiments (a detailed characterisation of which can be found elsewhere27) and the test specimens were made by mixing the natural silica sand and deionised water at a constant mass ratio. In this work, the elastic wave velocities and ETC were measured for methane hydrate-bearing permafrost sediment samples with a constant initial water content of 14.46 wt.% (initial water saturation of ∼65% in the porosity range of 37–39%) and ultimate methane hydrates, water, and gas saturations of ∼31%, ∼40%, and ∼29%, respectively. It should be noted that the saturation of the gas phase in permafrost sediments is typically less than 30%.1 However, it is difficult to make samples with a homogeneous initial water distribution at lower gas saturations in laboratories because there would be much more free water available to move readily prior to hydrate formation. In particular, at lower gas saturations, the initial water distribution could be greatly disturbed during vacuuming (in which the air in the cell is extracted using a vacuum pump) and gas injection, and when the sample is left to reach the thermodynamic equilibrium (due to the gravity). For our natural silica sand sediments, the initial water content of 14.46 wt.% has been shown to render the optimum initial saturations, where the water distribution remains homogeneous during these stages.27–29
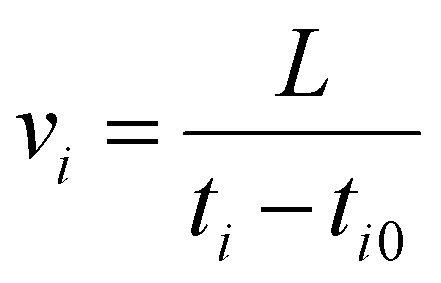
The measurements of the P- and S-wave velocities were conducted using the ultrasonic transmission method. The method requires accurate measurements of the travel time (t) of the elastic waves together with the propagation distance through the specimen (L). Having the inherent travel time (t0) of a given elastic wave, the velocity (v) is calculated using eqn (1):
| |  | (1) |
in which
i stands for P and S.
The transient hot wire method was used to measure ETC. In this method, a needle probe, as a long and thin heating source, is inserted into the sediment sample and heated with a constant power. Having the temperature time series data of the sample during the heating cycle, thermal conductivity can be obtained using eqn (2):
| |  | (2) |
where
λ,
Q, Δ
T,
t, and
t1 are the thermal conductivity, applied heat per unit length of the needle probe, temperature change, measurement time, and heating time, respectively. The measurements of the elastic wave velocities and ETC were carried out at temperatures of 3.0, 0.5, −0.5, and −3.0 °C and two different effective overburden pressures (
POB,eff.) of 6.89 and 10.34 MPa, enabling us to compare the results with those already reported in our previous study at a
POB,eff. of 3.45 MPa with similar saturations.
25
3. Modelling section
3.1. The elastic wave velocity model
In this study, the rock-physics models proposed by Ecker30 were employed to interpret the geophysical response of the gas hydrate-bearing permafrost sediment samples. Ecker's model works based on the rock-physics model of Dvorkin et al., which uses the effective medium theory (EMT) to relate the stiffness of the sediment dry frame to porosity, mineralogy, and effective pressure, and uses Gassmann's equation to model the effect of water saturation.31 In Ecker's models, the elastic moduli of the hydrate-free sediment are firstly expressed as a function of porosity, mineral and fluid moduli, and effective pressure, and then modified with respect to the presence of gas hydrates. Depending on its saturation, hydrate could be placed in the pore-fluid (pore-filling habit, EMT-A), in the sediment frame (load-bearing habit, EMT-B), or as a grain contact cement (cementing habit, EMT-C). To date, several studies have used this model to estimate the amount of gas hydrate from seismic data due to its reliability compared to the other available models and also its consistency with in situ wireline log data.32–37 A detailed discussion regarding the elastic wave velocity model together with its formulation can be found in Appendix A.
3.2. The effective thermal conductivity (ETC) model
An innovative physical model was developed in this study to interpret the geothermal response of gas hydrate-bearing permafrost sediments. This new model principally works based on the pore-scale model we recently developed for the prediction of the ETC of gas hydrate-free sediments under both unfrozen and frozen conditions.26 We briefly review the basic model here and demonstrate how it is modified to incorporate the presence of hydrates in conjunction with the pore-scale associated phenomena.
The basic model uses a 3D standard unit cell containing two monosized touching hemispheres (representing sediment grains) with a simple cubic (SC) packing configuration and a flat Hertzian contact interface in contact with the static co-existing fluids under equilibrium conditions in order to predict ETC at a specific temperature and pore pressure. To do so, four main steps are followed. First, the 3D standard unit cell is constructed, as introduced above, and the contact radius (rc) is calculated according to the Hertz contact equation as a function of POB,eff.:
| |  | (3) |
in which
r,
ν, and
E are the hemisphere radius, Poisson's ratio, and Young's modulus, respectively. This step is followed by placing the unit cell in a cubic domain, voxelising the geometry with an optimum resolution (in terms of the stabilisation of results and computational cost), and conducting a multicomponent lattice Boltzmann (LB) simulation to establish the spatial distribution of the co-existing phases (water and gas) in the pore space, ensuring that the fluid–fluid and solid–fluid interactions are accounted for. In this work, a free-energy LBM implemented in OpenLB
38 was used to conduct the LB simulations, and detailed information regarding the implementation can be found elsewhere.
39 Water, as the wetting phase, forms a film on the grain surfaces and builds a bridge in the grain contact region, in contact with the gas phase when the system reaches its equilibrium. The status value of each voxel,
i.e. its volumetric water content, under equilibrium conditions is then extracted and used in the next step, where the thermal conductivity of each voxel is assigned according to its status and a 3D space renormalisation technique is utilised to find the ETC of the cubic domain. The final step is to obtain the ETC of the unit cell from that of the cubic domain by applying a weighted averaging method. It should be noted that the LB simulations can be simply conducted in the lattice units as it is not necessary to have any unit conversion from the physical units to the lattice units when starting the LB simulation or
vice versa when exporting the simulation results. This is because the extracted volumetric water contents are essentially unitless. In addition, ETC is an intensive parameter and hence must not depend on the size of the physical domain. Therefore, each voxel has a dimension of 1 × 1 × 1 LL
3 (LL stands for the lattice length). Further details in this regard can be found in our published research article.
26
In this work, prior to calculating the ETC of the cubic domain, the spatial distribution of the co-existing phases is modified in order to incorporate the presence of hydrates and the pore-scale associated phenomena. The key property for the implementation of desired modifications is the status value of the voxels located in the pore space under equilibrium conditions. The status value of each voxel in the pore space is in fact its local water saturation; hence it must be a fraction between 0.0 (pure gas) and 1.0 (pure water). These values would be expected to be 1.0 in the vicinity of the grain surfaces due to their water-wet characteristics, decrease gradually while approaching the gas–water interface, and eventually become 0.0 in the gas phase. The saturation gradient depends on the total water saturation (which controls the water film thickness formed around the grain surfaces), interfacial width, and surface tension. Tuning the status values of the voxels makes it possible to alter the initial gas and water distributions as well as the gas–water interface and, accordingly, implement the above modifications. Here, for simplicity, we introduce an auxiliary parameter called “voxel content (VC)” indicating the constituent an individual voxel is occupied by, which could be 0 (grain), 1 (water), 2 (ice), 3 (hydrates), or 4 (gas). When the pore space is only filled with water and gas, the gas–water interface and consequently the saturations could be modified by conducting a segmentation on the status values with an appropriate threshold and then assigning VC for each voxel. However, when more than two phases co-exist in the pore space, which is the case in this study, the segmentation procedure becomes more complicated because it involves considering more threshold values. It is also essential for the segmentation process to be physically meaningful.
The co-existence of hydrates, water, ice, and gas in the pore space was incorporated into the ETC model by following a procedure detailed below and illustrated in Fig. 1, assuming the saturation of each co-existing phase is known.
 |
| | Fig. 1 Pore-scale spatial distribution of the co-existing phases in the pore space of the standard unit cell: (a) initial water and gas distributions exported from the LB simulation, (b) water and gas distributions after the gas saturation adjustment, (c) water, gas, and hydrate distributions after incorporating hydrates in the pore space, (d) unfrozen water, gas, hydrate, and ice distributions after incorporating the unfrozen water content in the pore space under frozen conditions, and (e) hydrate/ice-forced heave incorporation. | |
i. Gas saturation adjustment.
Our experimental studies indicate that hydrate formation in a partially saturated sediment sample is associated with a water saturation decrease, implying that the volume occupied by hydrate crystals is mainly provided by water.25 As the hydrate density is lower than water, hydrate formation results in a slight decrease in gas saturation as well. Therefore, the initial saturations of gas and water and their spatial distributions are not the same as theirs when hydrates exist in the pore space. In order to adjust the initial gas and water distributions exported from the LB simulation results (Fig. 1(a)) and get new distributions (Fig. 1(b)), segmentation is carried out on the status values. The threshold value should be carefully selected to ensure that the new gas saturation is the same as its known value. Upon completion of the gas saturation adjustment, the VC of the voxels filled with gas is set to 4. Depending on the thermal state, the VC of the other voxels is set to 1 (water) or 2 (ice) temporarily.
ii. Hydrate incorporation.
Hydrate formation in porous media is a stochastic process and most possibly occur in the gas–water interface.12 Besides, hydrates could exist in the pore space with different pore-scale habits (see Section 3.1). To fulfil these concerns, the spatial distribution of hydrates was placed in the pore space with a Gaussian pattern in the z-direction (Fig. 1(c)), where the position of the voxels with the water/ice content (VC: 1 or 2) located in a given xy-plane (having a specific z-coordinate) is compared with a threshold value (H(z)) determined by eqn (4):| |  | (4) |
and their VC is set to 3 (hydrates) if they are farther than the threshold. In eqn (4), N is the number of voxels in the x-, y-, and z-directions, determined by the optimum number of stages required for the renormalisation process. A and σ are two tuning parameters, controlling the hydrate distribution pattern.
iii. Unfrozen water saturation adjustment (only under frozen conditions).
At sub-zero temperatures, ice forms in larger pores with a lower capillary pressure first.40,41 Therefore, water in smaller pores remains unfrozen, critically contributing to the heat transfer.26 The amount of unfrozen water essentially depends on the freezing temperature and further freezing results in a transformation of a higher amount of unfrozen water to ice,42 hence a lower TCR. In order to incorporate the presence of unfrozen water on the grain surfaces (Fig. 1(d)), another segmentation is carried out on the status values of the voxels with the ice content (VC: 2). Therefore, under frozen conditions, the pore space would be expected to include all four co-existing phases (unfrozen water, ice, hydrates, and gas).
iv. Hydrate/ice-forced heave incorporation.
The literature on ice/hydrates in fine-grained sediments has shown that the hydrate/ice-forced heave could impact the hydrologic and thermal properties of permafrost sediments.43–45 Our recent experimental study on the geothermal characteristics of gas hydrate-bearing permafrost sediments revealed the significant influence of the hydrate-forced heave on the efficiency of heat conduction.25 In particular, at high hydrate saturations, hydrate crystals could act as coarse grains, pushing apart the sediment grains, enlarging the sediment pores, and adversely affecting the heat transfer. The hydrate/ice-forced heave was incorporated in the model by placing a hollow “heave disk” containing gas with an adjustable thickness (h) and width (w) in the regions used to be occupied by hydrates (Fig. 1(e)). It should be noted that the presence of the heave disk increases the gas saturation (depending on its thickness and width), which necessitates revisiting the segmentation conducted to adjust the gas saturation.
The saturations are calculated after the VC of all the voxels is assigned, followed by assigning a thermal conductivity value for each individual voxel according to its VC, and eventually implementing the 3D renormalisation technique to obtain ETC.
3.3. Coupled geophysical–geothermal scheme
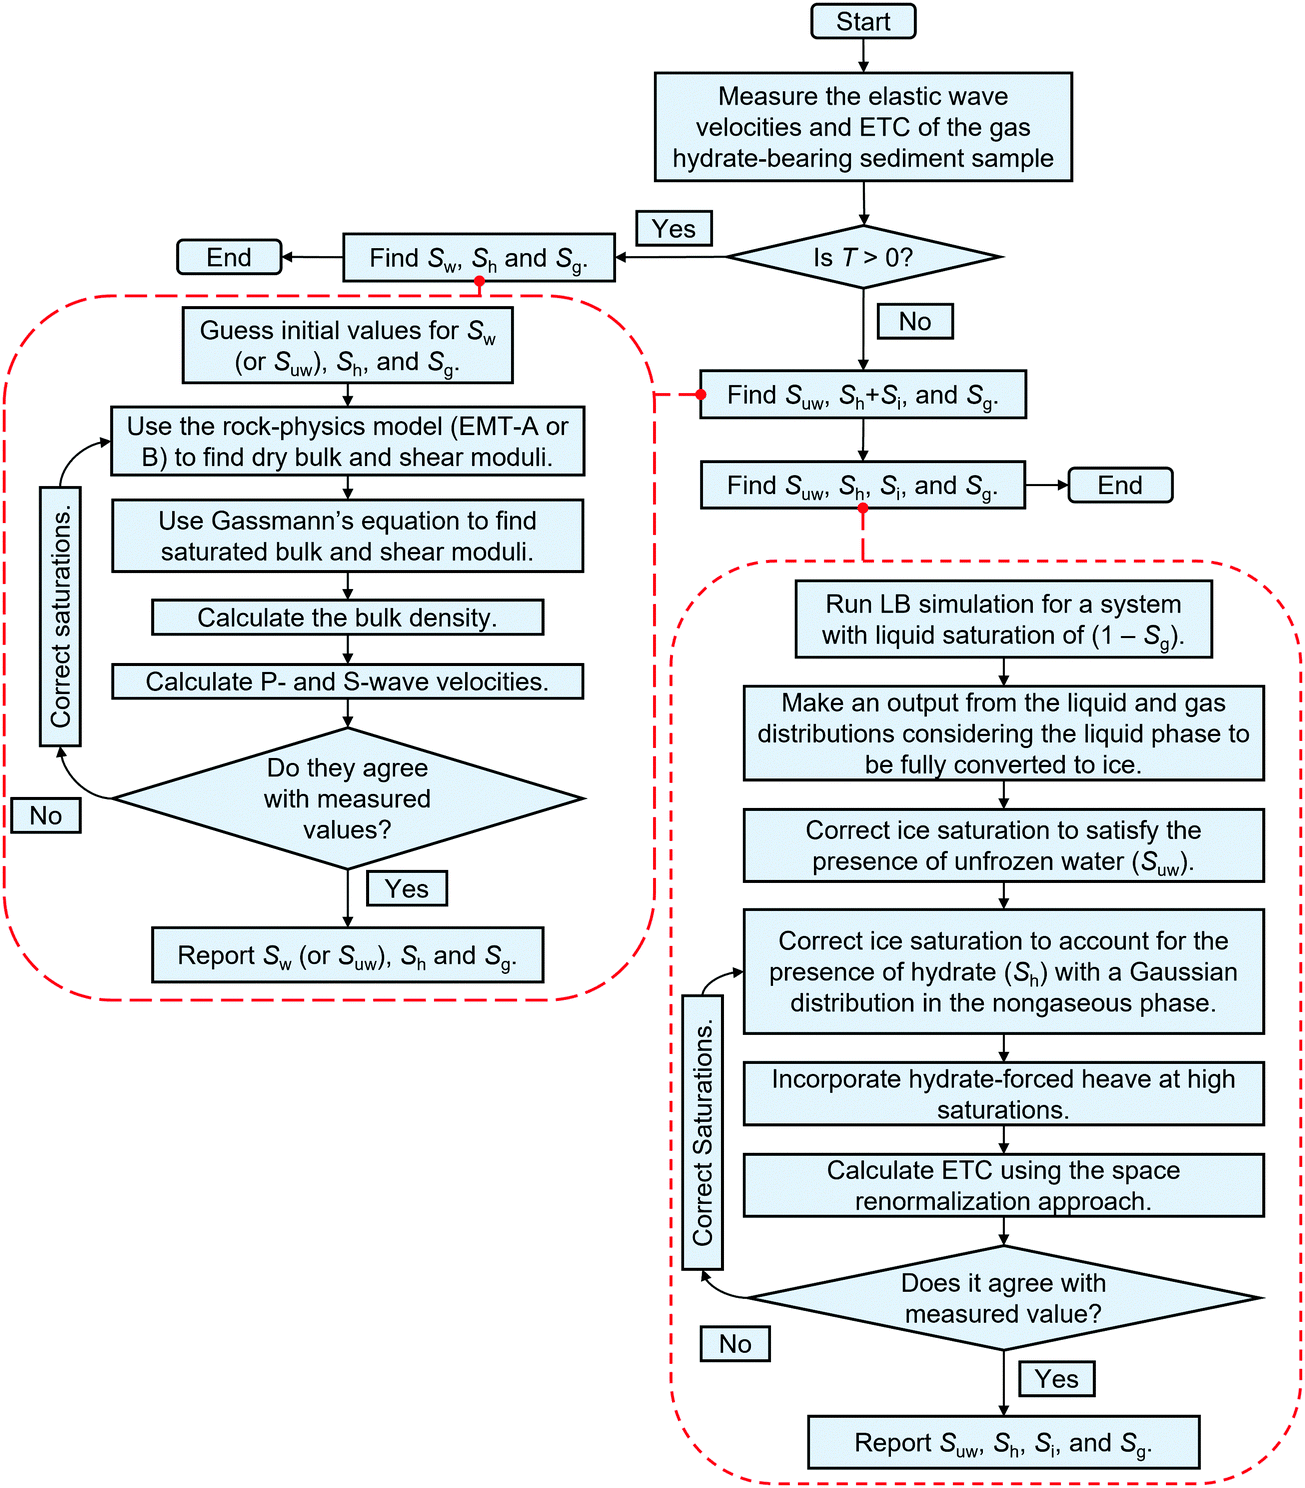
The coupled scheme developed for the prediction of hydrate saturation in gas hydrate-bearing permafrost sediments comprises two essential geophysical and geothermal parts, which are responsible for interpretation of the geophysical response using an elastic wave velocity model and the geothermal response using an ETC model, respectively. The scheme is general and works based on two fundamental facts. First, the geophysical response of the sediments could be used for the determination of the pore water content under both unfrozen and frozen conditions due to its different acoustic properties compared to the other co-existing phases (ice, gas, and hydrates). Second, the geothermal response of the sediments assists in distinguishing gas hydrates from ice under frozen conditions, thanks to their different intrinsic thermal conductivity.46 Therefore, all elastic wave velocity and ETC models available in the literature could be employed in the coupled scheme if they satisfy the abovementioned criteria. In this study, we employed the elastic wave velocity and ETC models detailed in Sections 3.1 and 3.2, respectively, because they are capable of quantifying the saturations and sufficiently assist with the determination of the dominant hydrate pore-scale habit.
The procedure followed by the coupled scheme is detailed below and illustrated in Fig. 2. It includes two main steps in which the experimentally measured elastic wave velocities and ETC of a gas hydrate-bearing permafrost sediment at a given thermal state (unfrozen/frozen) are interpreted in order to quantify the saturation of co-existing phases and determine the dominant hydrate pore-scale habit:
 |
| | Fig. 2 Coupled geophysical–geothermal scheme algorithm. | |
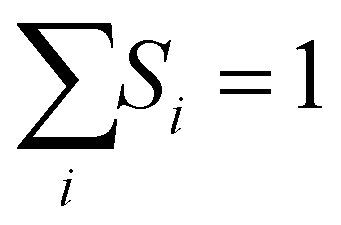
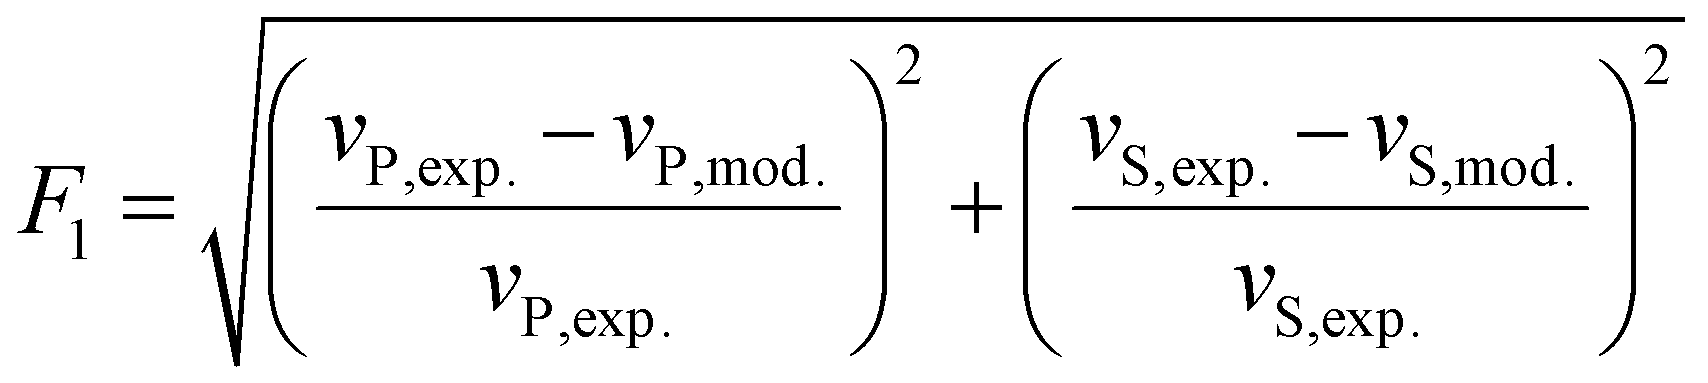
i. To begin with, the water, hydrate, and gas saturations (Sw, Sh, and Sg, respectively) under unfrozen conditions or the unfrozen water, ice + hydrate, and gas saturations (Suw, Si + Sh, and Sg, respectively) under frozen conditions are estimated from the elastic wave velocities by employing an appropriate rock-physics model and imposing a hard constraint expressed in eqn (5):
| |  | (5) |
and minimising an objective function provided in
eqn (6):
| |  | (6) |
where
vP,exp. and
vS,exp. are the experimentally measured P- and S-wave velocities, and
vP,mod. and
vS,mod. are the estimated velocities by the rock-physics model (EMT-A, B, or C), respectively. The first arrival of the S-wave is usually difficult to accurately determine, particularly for low hydrate saturations under unfrozen conditions. If the measured S-wave velocity is not accurate enough,
eqn (7) could be used instead to avoid uncertain minimisations (which might lead to unrealistic recognition of the hydrate pore-scale habit):
| |  | (7) |
A suitable initial guess for the saturations could be their values when there is no hydrate in the system (hydrate-free case). In lab-scale studies, these saturations are the values prior to hydrate formation, and in field-scale studies the saturations recorded in hydrate-free zones could be used.
ii. Under frozen conditions, the estimated saturations from the previous step are imported to the ETC model and spatial distribution of the co-existing phases (unfrozen water, gas, hydrates, and ice) is established in the pore space. This is followed by predicting ETC and comparing the estimated value with the experimentally measured ETC. The main goal here is to minimise another objective function expressed in eqn (8):
| |  | (8) |
The above objective function should be minimised by tuning the spatial distribution of the voxels with hydrate content (adjusting A and σ in eqn (4)) as well as incorporating the hydrate/ice-forced heave in the pore space, consistent with the saturations obtained in the previous step. It should be clarified that the second step is not essential to be taken under unfrozen conditions (because all the saturations are obtained in the first step). Nevertheless, the ETC model can still be used to provide further insights regarding the pore-scale associated phenomena such as the hydrate pore-scale habit and hydrate/ice-forced heave.
4. Results and discussion
4.1. Experimental results
Fig. 3 illustrates the measured values of the elastic wave velocities and ETC of methane hydrate-bearing permafrost sediment samples (with constant hydrates, water, and gas saturations of ∼31%, ∼40%, and ∼29%, respectively) against POB,eff. under both unfrozen and frozen conditions. The measured values at a POB,eff. of 3.45 MPa are those already reported in our recently published article.25 As observed, increasing POB,eff. results in higher P- and S-wave velocities and also ETC. These behaviours are expected and could be simply attributed to the dependence of the sediment stiffness and TCR on POB,eff.. According to the Hertz–Mindlin contact theory, a higher grain contact area is expected when POB,eff. increases.47 In addition, it is more likely that the number of sediment grains in contact with a given grain increases at higher POB,eff. values, resulting in further stiffening of the sediment and enhancing the heat transfer via grain–grain and grain–fluid–grain mechanisms.
 |
| | Fig. 3 The measured values of the elastic wave velocities and ETC of gas hydrate-bearing permafrost sediment samples versus the effective overburden pressure under (a) unfrozen and (b) frozen conditions. | |
The average enhancement rates of the elastic wave velocities and ETC are provided in Table 1. As can be seen, both the P- and S-wave velocities become less sensitive to POB,eff. when the system temperature goes below the freezing point. The underlying reason for this behaviour is that the transformation of pore water to ice further stiffens the host sediment, making it less compressible. Therefore, further freezing, corresponding to the transformation of more unfrozen water to ice, results in the elastic wave velocities becoming less compressible and, accordingly, less sensitive to POB,eff.. The enhancement rate of ETC, however, is different; it increases remarkably when the system temperature goes below the freezing point, and further freezing makes it less sensitive to POB,eff.. Since ice formation starts at larger pores,40 the pore-scale habit of ice crystals is pore-filling at temperatures just below the freezing point and it is less likely for these crystals to be in contact with the sediment grains. Increasing POB,eff. can make it possible for the ice crystals to come in contact with the sediment grains and enhance the heat conduction. Further freezing, however, changes the pore-scale habit of ice from pore-filling to load-bearing and/or cementing, where ice crystals bridge/cement neighbouring grains and have a substantial contribution to the heat transfer with a less sensitivity to the magnitude of POB,eff..
Table 1 Average enhancement rates of the elastic wave velocities and ETC of gas hydrate-bearing permafrost sediment samples
| No. |
Average enhancement rate |
Temperature |
| 3.0 °C |
0.5 °C |
−0.5 °C |
−3.0 °C |
| 1 |
P-wave velocity, km (s−1 MPa−1) |
0.042 |
0.044 |
0.027 |
0.017 |
| 2 |
S-wave velocity, km (s−1 MPa−1) |
0.033 |
0.031 |
0.030 |
0.025 |
| 3 |
ETC, W (m−1 K−1 MPa−1) |
0.033 |
0.029 |
0.050 |
0.037 |
In our previous study, we showed that the ETC of gas hydrate-free sediments does not increase monotonously as a result of freezing and transformation of unfrozen water to ice.26 It was demonstrated that ETC may experience a number of stages of elevation depending on the pore-scale distribution of water, which was understood based on the unification of the thermal conductivity behaviour and soil water retention mechanisms.48 In this study, we explored how the elastic wave velocities and ETC of gas hydrate-bearing sediments change due to the transformation of water to ice. We conducted further elastic wave velocity and ETC measurements for the hydrate-bearing sediment sample at temperatures between −0.5 and −4.0 °C and a constant POB,eff. of 6.89 MPa. The results are provided in Fig. 4. As observed, there are two stages of elevation experienced by the P-wave velocity and ETC, very similar to what was observed in the hydrate-free case. The underlying reason is that the water saturation after hydrate formation is ∼40% and its distribution could be described by the funicular retention regime, where water films form around the grains and may build up a water network. When transformed to ice, this network may markedly contribute to stiffening of the sediment skeleton as it joins the hydrate micro-frame structure; however, it does not affect the ETC as critically as water in small pores (referred to as the pendular regime). Therefore, when water in small pores starts to freeze (around −2.0 °C), a relatively sharp elevation occurs in ETC, while a mild increase in the P-wave velocity and an almost monotonous increase in the S-wave velocity are observed.
 |
| | Fig. 4 Measured elastic wave velocities and ETC of the hydrate-bearing sediment sample at temperatures between −0.5 and −4.0 °C and a constant POB,eff. of 6.89 MPa. Insets show the pore-scale distribution of unfrozen water under frozen conditions schematically. | |
4.2. Performance of the ETC model
The modifications detailed in Section 3.2 to incorporate the presence of hydrates into the basic ETC model must be physically meaningful, making it necessary to analyse the sensitivity of the new ETC model to the implemented modifications. Here, we analyse the sensitivity of the ETC model to the saturation and pore-scale distribution of hydrates and the hydrate/ice-forced heave under unfrozen/frozen conditions together with its sensitivity to the unfrozen water saturation under frozen conditions. Identical initial saturation (Swi) and spatial distribution were considered for water in the pore space, prior to applying the modifications on the model for all the sensitivity analysis cases. To find the spatial distributions of water and gas, the geometry of the unit cell was set up, followed by creating, classifying, and initialising mesh (porosity: 0.40, Swi: 0.59, POB,eff.: 3.45 MPa, N: 128), and finally running the LB simulation (see Fig. 5). After implementing the desired modifications in the model, the thermal conductivity value of each voxel was assigned according to its VC and the ETC of the cubic domain was obtained by applying the 3D space renormalisation technique. Constant thermal conductivity values of 6.35 and 0.51 W m−1 K−1 were considered for the voxels with VC values of 0 (grain) and 3 (hydrates), respectively. The temperature-dependent thermal conductivity data available in our in-house software were also used for the voxels with VC values of 1 (water), 2 (ice), and 4 (gas). Eventually, the ETC of the unit cell was calculated from that of the cubic domain by applying the weighted averaging method.26
 |
| | Fig. 5 (a) 3D view of the discretised cubic domain and (b) water distribution under equilibrium conditions in the cubic domain at an initial volumetric saturation of 59%. | |
4.2.1. Sensitivity to the saturation and pore-scale habit of hydrates.
As mentioned earlier, A and σ in eqn (4) are the tuning parameters for controlling the saturation and distribution pattern of hydrates in the pore-space; hence, they could be adjusted to incorporate hydrates into the model with a specific pore-scale habit. In order to understand the sensitivity of the ETC model to the saturation and pore-scale habit of hydrates, ETC was predicted at different hydrate saturations and distribution patterns by changing A and σ. The obtained values were divided by ETC in the hydrate-free case and are plotted in Fig. 6(a) and (b) against the hydrate saturation under both unfrozen and frozen conditions, respectively. As can be seen, as the hydrate saturation increases in the system, the ETC decreases under both unfrozen and frozen conditions. This is because the content of a number of voxels previously filled with water/ice (in the gas–water/ice interface) is replaced by hydrates, a constituent with a lower intrinsic thermal conductivity and a higher thermal resistance. This decreasing behaviour highly depends on the thermal state as well as the distribution pattern of hydrates. As can be seen, the impact is more under the frozen conditions, where the voxels previously filled by ice are replaced by hydrates with a significantly lower intrinsic thermal conductivity.
 |
| | Fig. 6 Sensitivity of the ETC model to the saturation and pore-scale habit of hydrates: ETC ratio versus the hydrate saturation under (a) unfrozen conditions (T: 3 °C, PPore: 3.45 MPa, Sg: 0.40, ETCHydrate-free: 2.319 W m−1 K−1) and (b) frozen conditions (T: −3 °C, PPore: 2.28 MPa, Sg: 0.33, Suw: 0.10, ETCHydrate-free: 3.571 W m−1 K−1), together with the typical pore-scale distribution of the co-existing phases in the cubic domain under frozen conditions with (c) A = N/8 and σ = 20, and (d) A = N/4 and σ = 20. | |
The hydrate distribution at lower A values should be described by the pore-filling habit (see Fig. 6(c)), where the voxels containing hydrates are mainly distributed in the gas–water interface and the content of a limited number of voxels changes to hydrates as a result of increasing σ. In contrast, at higher A values, the hydrate distribution could be described by the load-bearing or even cementing habit (see Fig. 6(d)), where increasing σ allows the content of a higher number of voxels to change to hydrates. These voxels may even come in contact with the grains and have a greater contribution to the heat conduction. Therefore, the decrease in the ETC ratio is more drastic for the cases with a higher A value.
4.2.2. Sensitivity to unfrozen water saturation under frozen conditions.
To understand the sensitivity of the ETC model to unfrozen water saturation, ETC was predicted at different unfrozen water and hydrate saturations and the results are provided in Fig. 7. We also plotted the corresponding elastic wave velocities using the rock-physics model (EMT-C), assuming hydrates and ice envelop the grains, which is reasonable given the considered unfrozen water saturations are all less than 10%.
 |
| | Fig. 7 Sensitivity of the ETC model to the unfrozen water saturation at different hydrate distribution patterns: (a) ETC versus the hydrate saturation (T: −3 °C, PPore: 2.28 MPa, Sg: 0.33) and (b) predicted P- and S-wave velocities determined by the rock-physics model (EMT-C), showing no sensitivity to the hydrate saturation. | |
According to Fig. 7(a), the value of ETC in both hydrate-free and hydrate-bearing cases depends upon the saturation and pore-scale distribution of unfrozen water. The wettability characteristics of the grain surface necessitate water to be distributed on the grain surface, particularly in the vicinity of the grain contact regions, where the capillary pressure is higher. Similar to our discussion in Section 4.2.1, the saturation and pore-scale habit of hydrates are both significant factors here: the replacement of ice with hydrates results in a lower ETC and the pore-filling habit (lower A values) does not influence the ETC as substantially as the load-bearing and cementing habits (higher A values). In Fig. 7(b), it can be seen that both P- and S-wave velocities are sensitive to the unfrozen water content; however, they are unable to capture the presence of hydrates given that almost identical elastic moduli are assumed for hydrates and ice.
4.2.3. Sensitivity to the hydrate/ice-forced heave.
We investigated the sensitivity of the ETC model to the hydrate/ice-forced heave by placing a heave disk in the model, adjusting its thickness and width, and eventually predicting ETC under unfrozen and frozen conditions. The obtained values were then normalised by the predicted ETC without the heave and are plotted in Fig. 8versus the penetration depth. As observed in Fig. 8, the impact of the heave on the efficiency of the heat transfer under both unfrozen and frozen conditions mainly depends on its penetration length and its influence on the thermal resistance in regions in the vicinity of the grain contact area. It can be seen that the heave with different thickness values does not affect ETC at lower penetration depths, in contrast to the higher depths where the ETC is substantially influenced. This is because further penetration of the heave is associated with alteration of the voxel contents from hydrates and/or ice to gas, the constituent with the lowest intrinsic thermal conductivity, in regions close to the grain contact area.
 |
| | Fig. 8 Sensitivity of the ETC model to the hydrate/ice-forced heave: ETC ratio versus the heave penetration depth under (a) unfrozen conditions (T: 3 °C, PPore: 3.45 MPa, Sg: 0.40, Sw: 0.00, Sh: 0.60, ETCNo heave: 1.903 W m−1 K−1) and (b) frozen conditions (T: −3 °C, PPore: 2.28 MPa, Sg: 0.40, Suw: 0.08, Sh + Si: 0.52, ETCNo heave: 3.546 W m−1 K−1). LL stands for the lattice length. | |
4.3. Performance of the coupled scheme
We utilised the experimental results discussed in Section 4.1 together with the experimental data provided in our recently published article to validate the applicability of the coupled scheme. The published study was conducted for characterisation of the geophysical and geothermal responses of gas hydrate-bearing permafrost sediments, reporting the elastic wave velocities and ETC of simulated gas hydrate-bearing sediment samples in a wide range of hydrate saturations and at a constant POB,eff. of 3.45 MPa.25 The measured properties for the published study together with the measurement errors are available at https://doi.org/10.17632/xj4bhkw9sz.1.
The experimentally determined elastic wave velocities and ETC were imported to the coupled scheme to predict the saturation of the co-existing phases, as demonstrated in Section 3.3. The predicted saturations were then compared with those obtained experimentally, enabling us to test the performance of the coupled scheme. The values of the elastic moduli provided by Waite et al.46 and the intrinsic thermal conductivity values presented in Section 4.2 were used in the geophysical and geothermal parts, respectively. POB,eff. consistent with its experimental value (3.45, 6.89, or 10.34 MPa) was also considered when constructing the standard unit cell of the ETC model. It should be noted that we endeavoured to have a similar saturation for a given constituent when conducting the geophysical and geothermal experiments. However, the experimentally determined saturations were somewhat different, and hence their average values were compared with the saturations predicted by the coupled scheme. In addition, under frozen conditions, the predicted unfrozen water saturation was added to the ice saturation to be compared with the experimental values because the unfrozen water content was not measured in the experiments. We chose to employ EMT-B to interpret the elastic wave velocities under unfrozen conditions because our experimental results show the evolution of the S-wave velocity even at low hydrate saturations, which cannot be accounted for by EMT-A. We also assumed that ice and hydrates coat the grains under frozen conditions and hence used EMT-C to interpret the elastic wave velocities.
The experimental and predicted saturations of the co-existing phases together with the PT conditions are tabulated in Table 2. The experimental and predicted values of the elastic wave velocities and ETC are also available in the ESI.1 The relative deviation of each saturation was calculated using eqn (9):
| |  | (9) |
Table 2 Experimental and predicted saturations of the co-existing phases together with the PT conditions used for testing the performance of the coupled geophysical–geothermal scheme. The relative deviations have been calculated using eqn (9)
| No. |
PT conditions |
Saturations |
| Experimental |
Predicted |
Relative deviation (%) |
|
P
OB,eff (MPa) |
P
Pore (MPa) |
T (°C) |
S
h (−) |
S
w (−) |
S
g (−) |
S
h (−) |
S
w (−) |
S
i (−) |
S
g (−) |
S
h (%) |
S
w (%) |
S
i (%) |
S
g (%) |
| 1 |
3.45 |
3.57 |
3.1 |
0.00 |
0.58 |
0.42 |
0.00 |
0.54 |
— |
0.46 |
— |
6.9 |
— |
9.5 |
| 2 |
3.45 |
3.10 |
0.4 |
0.00 |
0.58 |
0.42 |
0.00 |
0.54 |
— |
0.46 |
— |
6.9 |
— |
9.5 |
| 3 |
3.45 |
2.98 |
−0.6 |
0.00 |
0.63 |
0.37 |
0.00 |
0.43 |
0.19 |
0.38 |
— |
1.6 |
2.7 |
| 4 |
3.45 |
2.33 |
−3.1 |
0.00 |
0.63 |
0.37 |
0.00 |
0.20 |
0.42 |
0.38 |
— |
1.6 |
2.7 |
| 5 |
3.45 |
3.40 |
2.8 |
0.20 |
0.44 |
0.37 |
0.22 |
0.42 |
— |
0.36 |
10.0 |
4.5 |
— |
2.7 |
| 6 |
3.45 |
2.70 |
0.5 |
0.20 |
0.44 |
0.37 |
0.22 |
0.42 |
— |
0.36 |
10.0 |
4.5 |
— |
2.7 |
| 7 |
3.45 |
2.44 |
−0.5 |
0.20 |
0.46 |
0.35 |
0.21 |
0.32 |
0.11 |
0.36 |
5.0 |
6.5 |
2.9 |
| 8 |
3.45 |
2.28 |
−2.9 |
0.20 |
0.47 |
0.33 |
0.21 |
0.11 |
0.34 |
0.34 |
5.0 |
4.3 |
3.0 |
| 9 |
3.45 |
3.46 |
2.9 |
0.30 |
0.36 |
0.35 |
0.33 |
0.32 |
— |
0.35 |
10.0 |
11.1 |
— |
0.0 |
| 10 |
3.45 |
2.71 |
0.5 |
0.30 |
0.36 |
0.35 |
0.33 |
0.32 |
— |
0.35 |
10.0 |
11.1 |
— |
0.0 |
| 11 |
3.45 |
2.45 |
−0.6 |
0.30 |
0.39 |
0.31 |
0.32 |
0.26 |
0.08 |
0.34 |
6.7 |
12.8 |
9.7 |
| 12 |
3.45 |
2.26 |
−3.0 |
0.30 |
0.39 |
0.31 |
0.32 |
0.07 |
0.27 |
0.34 |
6.7 |
12.8 |
9.7 |
| 13 |
3.45 |
3.55 |
3.0 |
0.42 |
0.27 |
0.33 |
0.40 |
0.27 |
— |
0.33 |
4.8 |
0.0 |
— |
0.0 |
| 14 |
3.45 |
2.75 |
0.6 |
0.42 |
0.27 |
0.33 |
0.40 |
0.27 |
— |
0.33 |
4.8 |
0.0 |
— |
0.0 |
| 15 |
3.45 |
2.49 |
−0.5 |
0.42 |
0.29 |
0.30 |
0.40 |
0.24 |
0.05 |
0.31 |
4.8 |
0.0 |
3.3 |
| 16 |
3.45 |
2.31 |
−2.9 |
0.42 |
0.29 |
0.30 |
0.41 |
0.05 |
0.24 |
0.30 |
2.4 |
0.0 |
0.0 |
| 17 |
3.45 |
3.47 |
2.9 |
0.55 |
0.17 |
0.29 |
0.56 |
0.20 |
— |
0.24 |
1.8 |
17.6 |
— |
17.2 |
| 18 |
3.45 |
2.75 |
0.6 |
0.55 |
0.17 |
0.29 |
0.56 |
0.20 |
— |
0.24 |
1.8 |
17.6 |
— |
17.2 |
| 19 |
3.45 |
2.50 |
−0.5 |
0.55 |
0.18 |
0.28 |
0.55 |
0.18 |
0.03 |
0.24 |
0.0 |
16.7 |
14.3 |
| 20 |
3.45 |
2.25 |
−3.0 |
0.55 |
0.18 |
0.28 |
0.55 |
0.05 |
0.17 |
0.23 |
0.0 |
22.2 |
17.9 |
| 21 |
6.89 |
3.40 |
3.1 |
0.32 |
0.37 |
0.32 |
0.34 |
0.31 |
— |
0.35 |
6.3 |
16.2 |
— |
9.4 |
| 22 |
6.89 |
2.70 |
0.5 |
0.32 |
0.37 |
0.32 |
0.34 |
0.31 |
— |
0.35 |
6.3 |
16.2 |
— |
9.4 |
| 23 |
6.89 |
2.45 |
−0.5 |
0.33 |
0.40 |
0.28 |
0.35 |
0.26 |
0.07 |
0.32 |
6.1 |
17.5 |
14.3 |
| 24 |
6.89 |
2.30 |
−3.0 |
0.33 |
0.40 |
0.28 |
0.35 |
0.07 |
0.26 |
0.32 |
6.1 |
17.5 |
14.3 |
| 25 |
10.34 |
3.45 |
3.0 |
0.31 |
0.39 |
0.30 |
0.34 |
0.31 |
— |
0.35 |
9.7 |
20.5 |
— |
16.7 |
| 26 |
10.34 |
2.75 |
0.5 |
0.31 |
0.39 |
0.30 |
0.34 |
0.31 |
— |
0.35 |
9.7 |
20.5 |
— |
16.7 |
| 27 |
10.34 |
2.45 |
−0.5 |
0.33 |
0.42 |
0.26 |
0.36 |
0.24 |
0.08 |
0.32 |
9.1 |
23.8 |
23.1 |
| 28 |
10.34 |
2.30 |
−3.1 |
0.33 |
0.42 |
0.26 |
0.36 |
0.07 |
0.25 |
0.32 |
9.1 |
23.8 |
23.1 |
Comparing the predicted saturations with the experimentally determined values in Table 2 evidently shows the reliability and applicability of the proposed coupled scheme for the prediction of the hydrate saturation in permafrost sediments. It can be seen that the relative deviations of the predicted saturations from their experimental values are generally less than 15% for all constituents at lower hydrate saturations. Relative deviations higher than 15% are also observed at higher hydrate saturations or elevated POB,eff.. The accuracy of the saturation predictions highly depends on the accuracy of the input parameters (the elastic wave velocities and ETC) and the reliability of the elastic wave velocity and ETC models employed in the coupled scheme. Hence, the high relative deviations could be due to the fact that the experimentally determined saturations from the geophysical and geothermal experiments were averaged and then compared with the predicted saturations. In other words, the averaged saturations would be expected to be correlated with the measured elastic wave velocities and ETC with a lower accuracy. However, some other factors may also contribute to these deviations, which are discussed below.
At a constant POB,eff. of 3.45 MPa, it is observed that the relative deviations for all constituents are lower under frozen conditions compared with those obtained under unfrozen conditions. This interesting behaviour is expected as the travel time (hence the velocity) of the elastic waves is clearer to pick under frozen conditions (where the transformation of pore water to ice markedly stiffens the host sediment), leading to a lower uncertainty of the measurement. Similarly, when the hydrate saturation increases under both unfrozen and frozen conditions, it is expected that the travel time of the elastic waves is identified more precisely, and the predicted saturations become more accurate. However, such a behaviour is not observed for the relative deviations of the water saturation. The main reason for this is the fact that when the experimentally determined saturation for a given constituent is low, a small absolute deviation may lead to a high relative deviation (see eqn (9)). This behaviour could also be related to the modification we proposed to incorporate the hydrate/ice-forced heave into the ETC model. We discussed that the presence of the hydrate/ice-forced heave may significantly impact the thermal properties of the permafrost sediments; however, there is still a lack of fundamental understanding of this phenomenon. For example, it is still unclear (i) where the heave is mostly possible to occur, (ii) how it extends, and (iii) which constituent (water or gas) it is filled with. We fitted a hollow heave disk filled with gas to the ETC model and showed that this configuration can capture the effect of the heave on ETC in Section 4.2.3. However, as discussed in Section 3.2, adding the heave disk necessitates revisiting the segmentation conducted to adjust the gas saturation, which may cause deviation of the predicted gas and water saturations from the experimental values. For example, the performance of the coupled scheme is excellent at a hydrate saturation of ∼40% under both unfrozen and frozen conditions. This means that the effect of the heave disk on ETC has been captured successfully. However, the relative deviations for the water saturation are more than 15% high at a hydrate saturation of ∼50%, probably due to further extension of the heave toward the grain contact area, which is not accounted for in the current ETC model. We believe that further experimental studies with a focus on the heave characteristics may help with its more realistic incorporation into the ETC model.
At a constant hydrate saturation of ∼30%, it is observed that the relative deviations for the water and gas saturation increase when POB,eff increases. Interestingly, it can be seen that the gas saturation is overestimated, while the water saturation is underestimated under both unfrozen and frozen conditions. The main reason underlying this behaviour could be the fact that the presence of the hydrate/ice forced-heave results in a lower ETC, which is accounted for by adding a heave disk to the ETC model. As discussed in Section 3.2, the heave disk is essentially filled with the gas phase, resulting in an increase for the predicted gas saturation and a decrease for the water saturation. Another potential reason for the deviation of the predicted saturations from their experimental values is that the grain–grain heat transfer through the contact area is incorporated into the ETC model by employing the Hertz contact equation. Even though the effect of the overburden pressure is included in this equation, it cannot account for the cases in which the number of sediment grains in contact with a given grain increases due to higher POB,eff. values.
5. Conclusion
In this study, a coupled geophysical–geothermal scheme was developed for the quantification of hydrates in gas hydrate-bearing permafrost sediments. The scheme comprised two main parts: a rock-physics model, interpreting the geophysical response (the elastic wave velocities), and a new ETC model, which interprets the geothermal response (ETC). Due to its importance, the effect of POB,eff. on the geophysical and geothermal responses of gas hydrate-bearing permafrost sediments was experimentally investigated first by measuring the elastic wave velocities and ETC of methane hydrate-bearing permafrost sediment samples at different POB,eff.. The results showed that increasing POB,eff. leads to higher elastic wave velocities and ETC due to the dependence of the sediment stiffness and TCR on the overburden pressure. Next, we analysed the sensitivity of the new ETC model to the hydrate presence and pore-scale habit, unfrozen water saturation (under frozen conditions), and the hydrate/ice-forced heave, and ensured that the modifications are all incorporated into the model in a physically meaningful manner. The performance of the coupled scheme was eventually tested by using the experimental data together with the available results of our recent experimental study conducted for the characterisation of the geophysical and geothermal responses of gas hydrate-bearing permafrost sediments. It was indicated that the coupled scheme is able to predict the saturation of the co-existing phases in gas hydrate-bearing permafrost sediment samples with a good accuracy in a wide range of hydrate saturations and at different overburden pressures. The scheme was also shown to be able to predict the unfrozen water content as well as distinguish hydrates from ice under frozen conditions. The outcome of this study could be used for the development of large-scale permafrost monitoring systems and accurate quantification of natural gas hydrates in cold regions.
Conflicts of interest
The authors declare no financial conflicts of interest.
Appendix A
The detailed formulation of Ecker's models is as follows:
Gas hydrate-free sediments
The bulk and shear moduli of the dry frame of a given gas hydrate-free sediment (Kdry and Gdry, respectively) are obtained using eqn (A.1):| |  | (A.1) |
where| |  | (A.2) |
and| |  | (A.3) |
In these equations, ϕ is the porosity, ϕc is the critical porosity (∼40%), n is the average number of contacts per grain in a bulk unit (∼8.5), P is the effective pressure, and ν is the Poisson's ratio of the sediment grains. K and G are the bulk and shear moduli of the sediment grains, respectively, calculated from the moduli of the constituents (Ki and Gi) and their volumetric fraction (fi) using Hill's average:
| |  | (A.4) |
Gassmann's equation can be used to obtain the saturated bulk and shear moduli (Ksat and Gsat, respectively):
| |  | (A.5) |
where
Kf is the bulk modulus of the pore fluid (pore water and gas):
| |  | (A.6) |
where
Sw is the water saturation, and
Kw and
Kg are the bulk moduli of water and gas, respectively.
Gas hydrate-bearing sediments
Model A: pore-filling habit
In this case, Kf is modified only to incorporate the presence of hydrates (with the bulk moduli of Kh and Gh, and saturation of Sh):| |  | (A.7) |
Model B: load-bearing habit
In this case, gas hydrates reduce the porosity and alter the saturated bulk and shear moduli. The reduced porosity (ϕr) can be calculated using eqn (A.8):
The elastic moduli of the sediment can be calculated using Hill's average:
| |  | (A.9) |
where
| |  | (A.10) |
and
Ks and
Gs are the elastic moduli of the original sediment grains.
Model C: cementing habit
In this case, the porosity decreases and the saturated bulk and shear moduli are altered. Eqn (A.8) can be used to obtain the reduced porosity; however, changes in the elastic moduli should be incorporated based on the cementation theory of Dvorkin and Nur.49| |  | (A.11) |
where| |  | (A.12) |
and| |  | (A.13) |
Gh and υh are the shear modulus and Poisson's ratio of pure hydrates, respectively, and α is the ratio of the radii of cemented particles and sediment grains:| |  | (A.14) |
Finally, the P- and S-wave velocities can be calculated using eqn (A.15):
| |  | (A.15) |
where
ρb stands for the bulk density of the sediment expressed by
| |  | (A.16) |
in which
ρs,
ρw,
ρh, and
ρg are the grain, pore water, hydrate, and gas densities, respectively.
Acknowledgements
The authors would gratefully acknowledge Heriot-Watt University for providing the PhD funding for Mehrdad Vasheghani Farahani through James Watt Scholarship.
References
- W. Dobinski, Permafrost, Earth-Sci. Rev., 2011, 108(3–4), 158–169, DOI:10.1016/j.earscirev.2011.06.007.
-
C. R. Burn, Permafrost, and periglacial features|Permafrost, Encyclopedia of Quaternary Science, 2nd edn, 2013, pp. 464–471 DOI:10.1016/B978-0-444-53643-3.00099-6.
- C. Tamocai, J. G. Canadell, E. A. G. Schuur, P. Kuhry, G. Mazhitova and S. Zimov, Soil Organic Carbon Pools in the Northern Circumpolar Permafrost Region, Global Biogeochem. Cycles, 2009, 23(2) DOI:10.1029/2008GB003327.
- D. Riseborough, N. Shiklomanov, B. Etzelmüller, S. Gruber and S. Marchenko, Recent Advances in Permafrost Modelling, Permafr. Periglac. Process., 2008, 19(2), 137–156, DOI:10.1002/ppp.615.
-
IPCC, H.-O. Pörtner, Roberts, C. Debra, V. Masson-Delmotte, P. Zhai, M. Tignor, E. Poloczanska, K. Mintenbeck, A. Andrés, M. Nicolai, A. Okem, J. Petzold, B. Rama and N. M. Weyer, IPCC Special Report on the Ocean and Cryosphere in a Changing Climate, Eds 2019.
- O. Aygün, C. Kinnard and S. Campeau, Impacts of Climate Change on the Hydrology of Northern Midlatitude Cold Regions, Prog. Phys. Geogr. Earth Environ., 2019, 44(3), 338–375, DOI:10.1177/0309133319878123.
-
D. Streletskiy, O. Anisimov and A. Vasiliev, Permafrost Degradation, Snow and Ice-Related Hazards, Risks, and Disasters, Academic Press,Boston, 2015, pp. 303–344 DOI:10.1016/B978-0-12-394849-6.00010-X.
- M. A. Walvoord, C. I. Voss and T. P. Wellman, Influence of Permafrost Distribution on Groundwater Flow in the Context of Climate-Driven Permafrost Thaw: Example from Yukon Flats Basin, Alaska, United States, Water Resour. Res., 2012, 48, W07524, DOI:10.1029/2011WR011595.
- S. L. Painter, E. T. Coon, A. L. Atchley, M. Berndt, R. Garimella, J. D. Moulton, D. Svyatskiy and C. J. Wilson, Integrated Surface/Subsurface Permafrost Thermal Hydrology: Model Formulation and Proof-of-Concept Simulations, Water Resour. Res., 2016, 52(8), 6062–6077, DOI:10.1002/2015WR018427.
-
H. Park; Y. Dibike; F. Su and J. X. Shi, Cold Region Hydrologic Models and Applications, Arctic Hydrology, Permafrost and Ecosystems, Springer, 2021, pp. 763–794, DOI:10.1007/978-3-030-50930-9_26.
- J. Yang, A. Hassanpouryouzband, B. Tohidi, E. Chuvilin, B. Bukhanov, V. Istomin and A. Cheremisin, Gas Hydrates in Permafrost: Distinctive Effect of Gas Hydrates and Ice on the Geomechanical Properties of Simulated Hydrate-Bearing Permafrost Sediments, J. Geophys. Res.: Solid Earth, 2019, 124(3), 2551–2563, DOI:10.1029/2018JB016536.
- A. Hassanpouryouzband, E. Joonaki, M. Vasheghani Farahani, S. Takeya, C. Ruppel, J. Yang, N. J. English, J. M. Schicks, K. Edlmann, H. Mehrabian, Z. M. Aman and B. Tohidi, Gas Hydrates in Sustainable Chemistry, Chem. Soc. Rev., 2020, 49(15), 5225–5309, 10.1039/c8cs00989a.
- Y. Zhang and P. Taboada-Serrano, Model for Gas-Hydrate Equilibrium in Porous Media That Incorporates Pore-Wall Properties, Phys. Chem. Chem. Phys., 2020, 22(19), 10900–10910, 10.1039/d0cp01263g.
- C. Hauck, M. Böttcher and H. Maurer, A New Model for Estimating Subsurface Ice Content Based on Combined Electrical and Seismic Data Sets, Cryosphere, 2011, 5(2), 453–468, DOI:10.5194/tc-5-453-2011.
- J. Zhao, L. Yang, Y. Liu and Y. Song, Microstructural Characteristics of Natural Gas Hydrates Hosted in Various Sand Sediments, Phys. Chem. Chem. Phys., 2015, 17(35), 22632–22641, 10.1039/c5cp03698d.
-
C. Hauck and C. Kneisel, Applied Geophysics in Periglacial Environments, Cambridge University Press, Cambridge, 2008, DOI:10.1017/CBO9780511535628.
- E. G. Hivon and D. C. Sego, Strength of Frozen Saline Soils, Can. Geotech. J., 1995, 32(2), 336–354, DOI:10.1139/t95-034.
- T. E. Osterkamp, Sub-Sea Permafrost, Encycl. Ocean Sci., 2001, 5, 2902–2912 Search PubMed.
- S. Dou and J. B. Ajo-Franklin, Full-Wavefield Inversion of Surface Waves for Mapping Embedded Low-Velocity Zones in Permafrost, Geophysics, 2014, 79(6), EN107–EN124, DOI:10.1190/geo2013-0427.1.
- B. Dafflon, S. Hubbard, C. Ulrich, J. Peterson, Y. Wu, H. Wainwright and T. J. Kneafsey, Geophysical Estimation of Shallow Permafrost Distribution and Properties in an Ice-Wedge Polygon-Dominated Arctic Tundra Region, Geophysics, 2016, 81(1), WA247–WA263, DOI:10.1190/geo2015-0175.1.
- M. S. King, R. W. Zimmerman and R. F. Corwin, Seismic and Electrical Properties of Unconsolidated Permafrost, Geophys. Prospect., 1988, 36(4), 349–364, DOI:10.1111/j.1365-2478.1988.tb02168.x.
- P. J. Kurfurst, Ultrasonic Wave Measurements on Frozen Soils At Permafrost Temperatures, Can. J. Earth Sci., 1976, 13(11), 1571–1576, DOI:10.1139/e76-163.
- S. Dou, S. Nakagawa, D. Dreger and J. Ajo-Franklin, A Rock-Physics Investigation of Unconsolidated Saline Permafrost: P-Wave Properties from Laboratory Ultrasonic Measurements, Geophysics, 2016, 81(1), WA233–WA245, DOI:10.1190/GEO2015-0176.1.
- S. Dou, S. Nakagawa, D. Dreger and J. Ajo-Franklin, An Effective-Medium Model for P-Wave Velocities of Saturated, Unconsolidated Saline Permafrost, Geophysics, 2017, 82(3), EN33–EN50, DOI:10.1190/geo2016-0474.1.
- M. Vasheghani Farahani, A. Hassanpouryouzband, J. Yang and B. Tohidi, Insights into the Climate-Driven Evolution of Gas Hydrate-Bearing Permafrost Sediments: Implications for Prediction of Environmental Impacts and Security of Energy in Cold Regions, RSC Adv., 2021, 11(24), 14334–14346, 10.1039/d1ra01518d.
- M. Vasheghani Farahani, A. Hassanpouryouzband, J. Yang and B. Tohidi, Heat Transfer in Unfrozen and Frozen Porous Media: Experimental Measurement and Pore-Scale Modeling, Water Resour. Res., 2020, 56, e2020WR027885, DOI:10.1029/2020WR027885.
- A. Hassanpouryouzband, J. Yang, B. Tohidi, E. Chuvilin, V. Istomin and B. Bukhanov, Geological CO2 Capture and Storage with Flue Gas Hydrate Formation in Frozen and Unfrozen Sediments: Method Development, Real Time-Scale Kinetic Characteristics, Efficiency, and Clathrate Structural Transition, ACS Sustainable Chem. Eng., 2019, 7(5), 5338–5345, DOI:10.1021/acssuschemeng.8b06374.
- J. Yang, A. Okwananke, B. Tohidi, E. Chuvilin, K. Maerle, V. Istomin, B. Bukhanov and A. Cheremisin, Flue Gas Injection into Gas Hydrate Reservoirs for Methane Recovery and Carbon Dioxide Sequestration, Energy Convers. Manag., 2017, 136, 431–438, DOI:10.1016/j.enconman.2017.01.043.
- A. Hassanpouryouzband, J. Yang, A. Okwananke, R. Burgass, B. Tohidi, E. Chuvilin, V. Istomin and B. Bukhanov, An Experimental Investigation on the Kinetics of Integrated Methane Recovery and CO2 Sequestration by Injection of Flue Gas into Permafrost Methane Hydrate Reservoirs, Sci. Rep., 2019, 9(1), 1–9, DOI:10.1038/s41598-019-52745-x.
-
C. Ecker, Seismic Characterization of Methane Hydrate Structures, Stanford University,CA, USA, 2001 Search PubMed.
-
J. Dvorkin; M. B. Helgerud; W. F. Waite; S. H. Kirby and A. Nur, Introduction to Physical Properties and Elasticity Models, Natural Gas Hydrate, Springer, 2000, pp. 245–260 Search PubMed.
- C. Ecker, J. Dvorkin and A. Nur, Sediments with Gas Hydrates: Internal Structure from Seismic AVO, Geophysics, 1998, 63(5), 1659–1669, DOI:10.1190/1.1444462.
- C. Ecker, J. Dvorkin and A. M. Nur, Estimating the Amount of Gas Hydrate and Free Gas from Marine Seismic Data, Geophysics, 2000, 65(2), 565–573, DOI:10.1190/1.1444752.
- M. W. Lee and T. S. Collett, Elastic Properties of Gas Hydrate-Bearing Sediments, Geophysics, 2001, 66(3), 763–771, DOI:10.1190/1.1444966.
- S. Chand, T. A. Minshull, D. Gei and J. M. Carcione, Elastic Velocity Models for Gas-Hydrate-Bearing Sediments – A Comparison, Geophys. J. Int., 2004, 159(2), 573–590, DOI:10.1111/j.1365-246X.2004.02387.x.
- J. Qian, X. Wang, T. S. Collett, D. Dong, Y. Guo, P. Su and J. Liang, Gas Hydrate Accumulation and Saturations Estimated from Effective Medium Theory in the Eastern Pearl River Mouth Basin, South China Sea, Interpretation, 2017, 5(3), SM33–SM48, DOI:10.1190/INT-2016-0217.1.
- Q. T. Bu, G. W. Hu, Y. G. Ye, C. L. Liu, C. F. Li, A. I. Best and J. S. Wang, The Elastic Wave Velocity Response of Methane Gas Hydrate Formation in Vertical Gas Migration Systems, J. Geophys. Eng., 2017, 14(3), 555–569, DOI:10.1088/1742-2140/aa6493.
- M. J. Krause, A. Kummerländer, S. J. Avis, H. Kusumaatmaja, D. Dapelo, F. Klemens, M. Gaedtke, N. Hafen, A. Mink, R. Trunk, J. E. Marquardt, M. L. Maier, M. Haussmann and S. Simonis, OpenLB—Open Source Lattice Boltzmann Code, Comput. Math. Appl., 2021, 81, 258–288, DOI:10.1016/j.camwa.2020.04.033.
- C. Semprebon, T. Krüger and H. Kusumaatmaja, Ternary Free-Energy Lattice Boltzmann Model with Tunable Surface Tensions and Contact Angles, Phys. Rev. E, 2016, 93(3) DOI:10.1103/PhysRevE.93.033305.
- M. Hohmann, Soil Freezing—the Concept of Soil Water Potential. State of the Art, Cold Reg. Sci. Technol., 1997, 25(2), 101–110, DOI:10.1016/S0165-232X(96)00019-5.
- D. D. Cortes, A. I. Martin, T. S. Yun, F. M. Francisca, J. C. Santamarina and C. Ruppel, Thermal Conductivity of Hydrate-Bearing Sediments, J. Geophys. Res.: Solid Earth, 2009, 114, B11103, DOI:10.1029/2008JB006235.
- V. Istomin, E. Chuvilin, B. Bukhanov and T. Uchida, Pore Water Content in Equilibrium with Ice or Gas Hydrate in Sediments, Cold Reg. Sci. Technol., 2017, 137, 60–67, DOI:10.1016/j.coldregions.2017.02.005.
-
L. Barden; A. O. Madedor and G. R. Sides, The Flow of Air and Water in Partly Saturated Clay Soil, Fundamentals of Transport Phenomena in Porous Media, Elsevier, 1972, vol. 2, pp. 299–311 DOI:10.1016/S0166-2481(08)70548-8.
- A. E. Cook, D. Goldberg and R. L. Kleinberg, Fracture-Controlled Gas Hydrate Systems in the Northern Gulf of Mexico, Mar. Pet. Geol., 2008, 25(9), 932–941, DOI:10.1016/j.marpetgeo.2008.01.013.
- A. Okwananke, A. Hassanpouryouzband, M. Vasheghani Farahani, J. Yang, B. Tohidi, E. Chuvilin, V. Istomin and B. Bukhanov, Methane Recovery from Gas Hydrate-Bearing Sediments: An Experimental Study on the Gas Permeation Characteristics under Varying Pressure, J. Pet. Sci. Eng., 2019, 180, 435–444, DOI:10.1016/j.petrol.2019.05.060.
- W. F. Waite, J. C. Santamarina, D. D. Cortes, B. Dugan, D. N. Espinoza, J. Germaine, J. Jang, J. W. Jung, T. J. Kneafsey, H. Shin, K. Soga, W. J. Winters and T. S. Yun, Physical Properties of Hydrate-Bearing Sediments, Rev. Geophys., 2009, 47(4) DOI:10.1029/2008RG000279.
- R. D. Mindlin, Compliance of Elastic Bodies in Contact, J. Appl. Mech., 1949, 16(3), 259–268, DOI:10.1115/1.4009973.
- Y. Dong, J. S. McCartney and N. Lu, Critical Review of Thermal Conductivity Models for Unsaturated Soils, Geotech. Geol. Eng., 2015, 33(2), 207–221, DOI:10.1007/s10706-015-9843-2.
- J. Dvorkin and A. Nur, Rock Physics for Characterization of Gas Hydrates, US Geol. Surv. Prof. Pap., 1993, 1570, 293–298, DOI:10.1016/0148-9062(95)90078-j.
Footnote |
| † Electronic supplementary information (ESI) available: The following data are available at Mendeley Data, https://doi.org/10.17632/2zf6dsxkfw.1: (1) Detailed experimental conditions and measured elastic wave velocities and ETC values at different effective overburden pressures (Section 4.1). (2) Detailed predicted and experimental saturations of the co-existing phases, predicted and experimental values of the elastic wave velocities and ETC, and the PT conditions used for testing the performance of the coupled geophysical–geothermal scheme (Section 4.3). The following data are provided in the Electronic Supplementary Information: (1) ETC and ETC ratio under unfrozen and frozen conditions, predicted to investigate the sensitivity of the ETC model to the saturation and pore-scale habit of hydrates. (2) ETC and elastic wave velocities determined by the rock-physics model (EMT-C) under frozen conditions, predicted to investigate the sensitivity of the ETC model to the unfrozen water saturation under different hydrate distribution patterns. (3) ETC and ETC ratio under unfrozen and frozen conditions, predicted to investigate the sensitivity of the ETC model to the hydrate/ice-forced heave. See DOI: 10.1039/d1cp03086h |
|
| This journal is © the Owner Societies 2021 |
Click here to see how this site uses Cookies. View our privacy policy here. 
 Open Access Article
 This Open Access Article is licensed under a Creative Commons Attribution-Non Commercial 3.0 Unported Licence
 *a,
Aliakbar
Hassanpouryouzband
*a,
Aliakbar
Hassanpouryouzband