
Ultrafast vibrational wave packet dynamics of the aqueous tyrosyl radical anion induced by photodetachment†
Muhammad Shafiq
Bin Mohd Yusof
,
Yong Liang
Lim
and
Zhi-Heng
Loh
 *
*
Division of Chemistry and Biological Chemistry, School of Physical and Mathematical Sciences, Nanyang Technological University, 21 Nanyang Link, Singapore 637371, Singapore. E-mail: zhiheng@ntu.edu.sg
First published on 16th August 2021
Abstract
The ultrafast dynamics triggered by the photodetachment of the tyrosinate dianion in aqueous environment shed light on the elementary processes that accompany the interaction of ionizing radiation with biological matter. Photodetachment of the tryosinate dianion yields the tyrosyl radical anion, an important intermediate in biological redox reactions, although the study of its ultrafast dynamics is limited. Here, we utilize femtosecond optical pump–probe spectroscopy to investigate the ultrafast structural reorganization dynamics that follow the photodetachment of the tyrosinate dianion in aqueous solution. Photodetachment of the tyrosinate dianion leads to vibrational wave packet motion along seven vibrational modes that are coupled to the photodetachment process. The vibrational modes are assigned with the aid of density functional theory (DFT) calculations. Our results offer a glimpse of the elementary dynamics of ionized biomolecules and suggest the possibility of extending this approach to investigate the ionization-induced structural rearrangement of other aromatic amino acids and larger biomolecules.
Introduction
The photoionization of biomolecules in aqueous system involves the interaction of high-energy radiation with biological matter to yield the corresponding radical species and the hydrated electron. The formation of these reactive species in turn triggers a plethora of chemical reactions that form the basis of radiation chemistry and radiation biology.1–3 The investigation of radiation damage involving redox-active amino acids, such as tyrosine, tryptophan, and phenylalanine, is particularly pertinent due to their facile oxidation, which is in turn afforded by their relatively low ionization potentials. In the gas phase, the vertical ionization energies of redox-active amino acids are ∼1–2 eV lower than those with aliphatic side chains.4,5 In aqueous solution, the lowest vertical ionization energies of tyrosine, tryptophan, and phenylalanine have been measured to be 7.8 eV, 7.3 eV, and 8.8 eV, respectively.6 These vertical ionization energies are downshifted by ∼0.6–0.7 eV relative to the gas-phase values due to the stabilization of the radical cation final state by the polar solvent environment.In this study, we focus on tyrosine (Tyr), an amino acid with a phenolic side chain. Tyrosine participates in biological activities such as protein phosphorylation,7–10 DNA repair,11–14 and photoreception.15 A key intermediate in many of these processes is the tyrosyl radical (Tyr˙), whose involvement in proton-coupled electron transfer (PCET) has been the subject of extensive experimental and theoretical studies.11,13–19 Early microsecond flash photolysis and nanosecond laser experiments have elucidated the formation of the tyrosyl radical via the triplet state of tyrosine and its subsequent bimolecular reactions.20–22 Ultraviolet resonance Raman23,24 and FTIR spectroscopies25 have identified the characteristic vibrational frequencies of the tyrosyl radical, both in aqueous solution and in a peptide matrix.26–28
While numerous studies have unraveled the dynamics of the hydrated electron produced by the photoionization of aqueous solutes,29–35 investigations of the ultrafast dynamics of the accompanying radical species are relatively limited. Here, building upon our earlier work on the photodetachment of aqueous phenoxide,36 we aim to elucidate the ultrafast vibrational wave packet dynamics of the tyrosyl radical anion (Tyr˙−) triggered by the photodetachment of the tyrosinate dianion (Tyr2−; Fig. 1) in aqueous solution. When driven by an ultrashort laser pulse, photodetachment triggers ultrafast vibrational wave packet dynamics involving vibrational modes along which the equilibrium geometries before and after electron ejection are displaced.36 Vibrational modes that appear in the wave packet dynamics therefore encode structural reorganization. In our experiment, vibrational coherences will be detected by near-ultraviolet transient absorption spectroscopy, performed with ∼10 fs time resolution. This time-domain approach complements energy-resolved measurements of the Franck–Condon progression by photoelectron spectroscopy. For amino acids in aqueous solution, however, their Franck–Condon progression is obfuscated by the ∼1 eV-wide, inhomogeneously broadened valence photoelectron bands.6
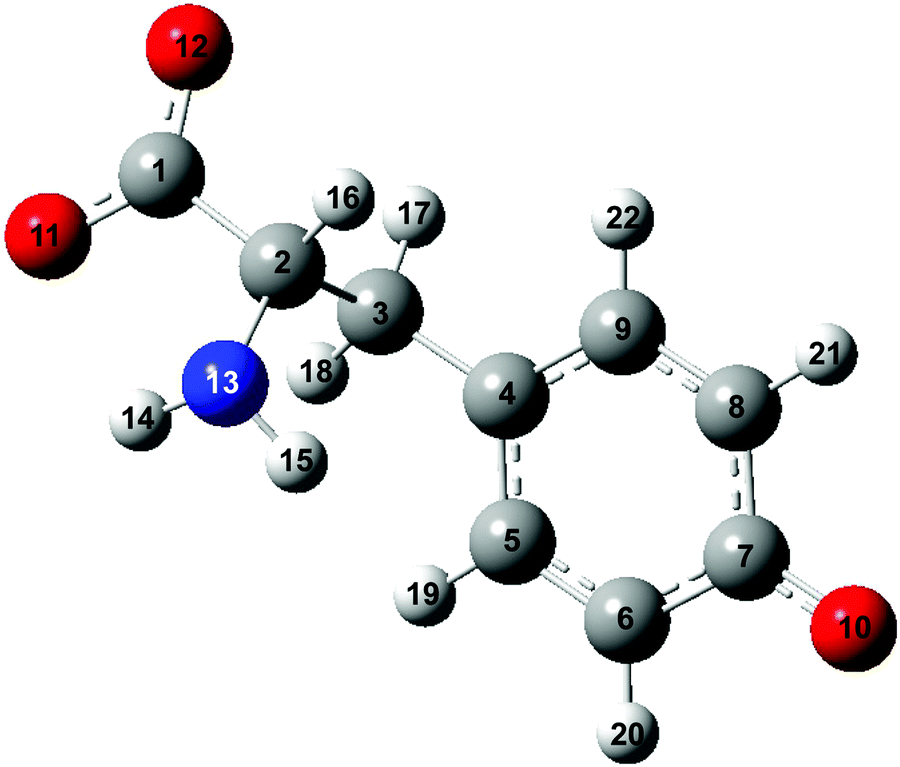 | ||
| Fig. 1 Structure of the tyrosinate dianion (Tyr2−). The carbon, hydrogen, oxygen and nitrogen atoms are in gray, white, red and blue, respectively. | ||
Aside from its relevance to radiation chemistry and biological redox reactions, the choice of the tyrosine for the present study is also motivated by several practical considerations. First, the estimated vertical ionization energy of the tyrosinate dianion (∼7.1 eV)6,37 is lower compared to those of liquid water (11.2 eV)38–41 and aqueous hydroxide (9.2 eV).42 When driving photodetachment in the strong-field limit, the lower vertical ionization energy of the tyrosinate dianion favors its photodetachment and minimizes contributions from the photodetachment of aqueous hydroxide and the solvent to the transient absorption signal. Second, the dianion form is more water-soluble (60.0 mM at pH 13) than the neutral form (2.7 mM at isoelectronic point),43 hence further increasing the contribution from the photodetachment of tyrosinate to the transient absorption signal. Third, the absorption signature of the tyrosyl radical at ∼400 nm22,44,45 is located away from the strong absorption peak of the hydrated electron byproduct at ∼720 nm,46 thus enabling a clear view of the tyrosyl radical absorption spectrum evolving in time due to vibrational wave packet motion.
Here, we present the ultrafast vibrational wave packet dynamics induced by the photodetachment of the tyrosinate dianion in aqueous solution. We identify the vibrational modes of the tyrosyl radical anion along which structural reorganization occurs upon photodetachment. Our experimental results are complemented by DFT calculations of vibrational frequencies of the aqueous tyrosyl radical anion. This study provides further insights into the ultrafast structural dynamics that accompany the interaction ionization radiation with biological matter.
Methods
Experimental
The experimental procedure has been described previously.36 A chirped-pulse-amplified Ti:sapphire laser system (Coherent, Legend Elite Duo-USX) is used to perform the photodetachment of tyrosinate anion. The laser system produces 4.5 mJ, 30 fs pulses at 1 kHz repetition rate and 800 nm center wavelength. The pulses undergo self-phase modulation in a helium-filled hollow-core fiber before they are temporally compressed by chirped mirrors (Ultrafast Innovations GmbH, PC1332). The compressed pulses are incident on a beam splitter (Layertec, 131191), with 80% of the transmitted beam (∼0.6 mJ) being directed to a 4f visible-NIR pulse shaper equipped with a 128-element spatial light modulator (SLM) (Biophotonics Solutions, FemtoJock-P). The pulse shaper performs adaptive pulse compression of the visible-NIR beam to correct for any higher-order dispersion introduced by the various optical components in the laser beams path to ensure that clean, transform-limited pulses are produced for the experiment. The fundamental spectrum of the visible-NIR beam is truncated to a wavelength range of 520 nm to 750 nm, with a central wavelength of 630 nm (1.97 eV photon energy; Fig. S1, ESI†). Transform-limited laser pulses with full-width half-maximum (FWHM) duration of 5.2 fs are obtained by using multiphoton intrapulse interference phase scan (MIIPS) to measure the spectral phase at the sample, followed by using the SLM to introduce an oppositely signed phase to the laser pulse, thus compressing it to the transform-limited duration.47 Subsequently, an interferometric autocorrelation trace is recorded by multiple independent comb shaping (MICS) (Fig. S2, ESI†).48The transform-limited pulses, which function as the strong-field ionizing pump, are directed to the sample. The ionizing pump pulses are focused onto the sample by a 50 cm focal length concave mirror. The beam waist (1/e2 radius) of the pump at the sample target is 120 μm. A maximum pulse energy of 25 μJ is directed to the tyrosine solution, yielding a peak intensity of 2.0 × 10¹³ W cm−2. An optical delay stage line, driven by a piezo translation stage (Physik Instrumente, N-664.3A), is positioned in the ionizing pump beam path to provide a variable time delay between pump and probe pulses in 5 fs steps.
The remaining output from the chirped mirror compressor passes through a pair of wedges (Femtolasers, OA124), follow by a 50 μm-thick Type 1 beta-barium borate (BBO) crystal (Casix, θ = 29.0°) to generate the UV probe via second harmonic generation. The broadband UV probe spans 360 nm to 460 nm (Fig. S1(b), ESI†). A pair of dichroic beamsplitters (Layertec, 109433) placed after the BBO crystal removes the residual fundamental beam. The UV beam is then split off by a reflective neutral density filter (Newport, FRQ-ND05) to produce the probe and reference pulses. The reflected UV probe is focused onto the sample by a 15 cm focal-length off-axis parabolic reflector (Thorlabs). The focused UV probe at the sample target has a beam waist (1/e2 radius) of 42 μm and a pulse energy of 17 nJ. The peak intensity of the UV probe is 5.2 × 10¹⁰ W cm−2.
A slit nozzle (Metaheuristics, Type L) is used in conjunction with a peristaltic pump (Cole-Parmer, 07528-10) and a pulse dampener to produce a microjet of the tyrosinate dianion solution for experiments. The volume flow rate of 92 mL min−1 translates to a vertical flow rate of approximately 8.5 mm ms−1, sufficiently high to ensure that a fresh volume of the tyrosinate dianion solution is exposed to each ionizing pump pulse. A liquid jet of 7 μm thickness is produced, which yields a sizeable differential absorption signal (ΔA ∼ 0.1), while minimizing the temporal broadening of the pulses in the liquid jet due to dispersion. In addition, a thin liquid jet limits the group-velocity mismatch between the pump and probe to <1 fs, making its effect on the time resolution negligible.
A synchronized optical chopper is placed in the ionizing pump beam path before the sample to modulate the repetition rate of the ionizing pump at 0.5 kHz. The probe beam that is transmitted through the microjet is focused into a 300 mm spectrograph (Princeton Instruments, Acton SP2300). The spectrograph is equipped with a 600 grooves per mm grating blazed at 500 nm and a 1024-pixel silicon (Si) photodiode array detector (Stresing, S8381-1024Q) with a read-out rate of 1 kHz, which allows simultaneous acquisition of probe spectra obtained with and without the ionizing pump pulse. The reference UV pulses are focused into an identical spectrograph, which is equipped with a similar grating and photodiode array operating at 1 kHz repetition rate. Referenced detection reduces noise caused by shot-to-shot fluctuations of the probe beam. The Si photodiode array detectors are interfaced to desktop computers for automated data acquisition.
L-Tyrosine (Sigma-Aldrich, ≥98% HPLC) and sodium hydroxide (VWR Chemicals, 98.9% pellets) are used as received. Since L-tyrosine has relatively low solubility in water (2.7 mM at its isoelectronic point),43L-tyrosine is dissolved and sonicated in sodium hydroxide solution to produce a 150 mM solution at pH 14. Given the phenol side chain pKa of 10.07,49 we expect >99.9% deprotonation of the phenolic OH at pH 14. That is, tyrosine exists in our experiments in the dianionic form (Tyr2−).
Theoretical calculations
The calculated equilibrium geometries and vibrational frequencies of tyrosinate dianion and tyrosyl radical anion are obtained with the GAUSSIAN 16 program.50 The DFT calculations use the hybrid exchange functional of Becke (B3)51 and the correlation functional of Lee, Yang and Parr (LYP),52 and the 6-311G++(d,p) split-valence triple-zeta basis set. This basis set is augmented with d-orbital and diffuse functions on the heavy atoms (carbon, nitrogen and oxygen) and p-orbital and diffuse functions on the hydrogen atoms. Two models of the tyrosinate dianion and the tyrosyl radical anion are constructed. The first model is the isolated tyrosinate dianion and tyrosyl radical anion, while the second model is the microhydrated species. The microhydrated species includes three water molecules directly hydrogen-bonded to the oxygen atom of the phenolic sidechain. Furthermore, for both the isolated and microhydrated species, a polarizable continuum is included to mimic the interaction of the microhydrated species with the surrounding solvent.53 The water molecules present in the microhydrated species are fully relaxed during geometry optimization. Each geometry optimization is followed by a vibrational frequency calculation to verify that the optimized geometry corresponds to a local minimum.Results and discussion
Transient absorption of the aqueous tyrosyl radical anion
The differential absorption (ΔA) spectrum recorded as a function of pump–probe time delay, following the photodetachment of the aqueous tyrosinate dianion, is shown in Fig. 2. Strong-field-induced multiphoton photodetachment of tyrosinate dianion yields the tyrosyl radical anion (Tyr˙−) and the hydrated electron. Tyr˙− has an absorption band peaking at 413 nm and a vibronic transition at 400 nm, consistent with previous studies of the tyrosyl radical in aqueous solution.22,44,45 In addition, the increase in the ΔA signal at longer wavelengths beyond 430 nm is due to the absorption of the ground-state hydrated electron, which spans 300–1000 nm.46 | ||
| Fig. 2 Time-resolved differential absorption spectrum of the photodetached aqueous tyrosinate dianion as a function of pump–probe time delay. | ||
Previous studies have shown that 4.68 eV (265 nm) photoexcitation of tyrosine to the S1 (ππ*) state yields the tyrosyl radical via a two-photon process involving the lowest-energy triplet state of tyrosine as an intermediate.22 In the present study, however, we discount the possibility that the tyrosyl radical anion is formed via the electronically excited states of the tyrosinate dianion. This is evident from the pump-power dependence measurements, which show the photodetachment occurs directly via a three-photon process (Fig. 3 and Section S1, ESI†). While the vertical ionization energy of the tyrosinate dianion is unknown, we note that tyrosine and phenol have identical vertical ionization energies of 7.8 eV.6 As such, we expect the vertical ionization energies of the tyrosinate dianion and phenoxide to be similar; the latter is reported to be 7.1 eV,37 with the photoelectron band extending to <6 eV binding energy. Considering that the bottom of the conduction band of liquid water resides ∼1 eV below the vacuum level,54 the total energy input of 5.9 eV that is associated with a three-photon photodetachment process is sufficient to remove an electron from the tyrosinate dianion and inject it into the conduction band of liquid water.
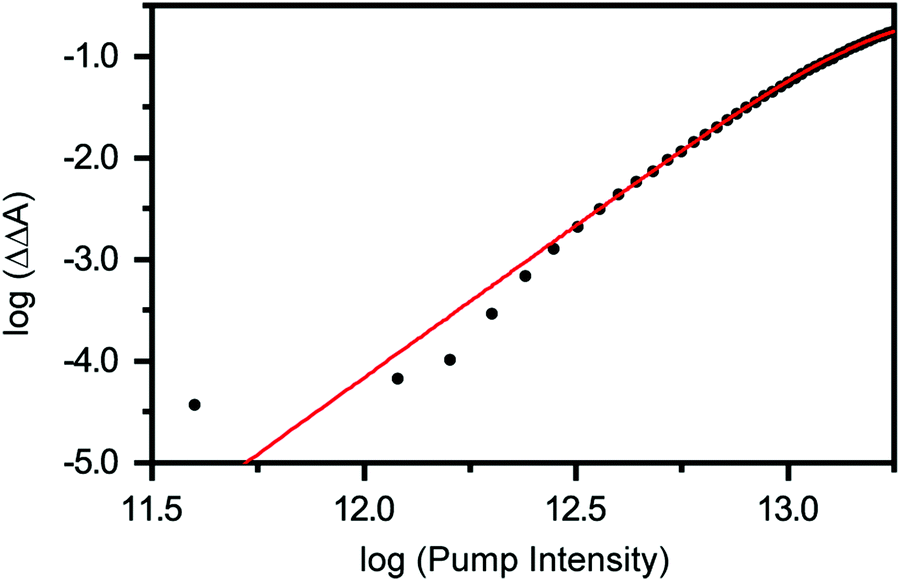 | ||
| Fig. 3 Photon-order measurement for the strong-field photodetachment of the tyrosinate dianion. Log–log plot of ΔΔA vs. pump intensity after subtraction of the response from aqueous sodium hydroxide. The solid line is a fit to a three-photon photodetachment process. | ||
Global fitting of the time-resolved ΔA spectra over the 370–455 nm probe wavelength range and 120 fs after time-zero to the function:
| ΔA(λ,t) = ΔA0(λ) + ΔA1(λ)(e−t/τd1 − e−t/τr1) + ΔA2(λ)(e−t/τd2) −1, | (1) |
The formation and subsequent decay of the hydrated electron is modeled by sequential first-order kinetics (see the second term in eqn (1)). Hydrated electron formation involves the trapping of the electron that is initially injected into the conduction band by photodetachment55 followed by vibrational cooling; this entire process can be modeled by first-order kinetics.29–35 Since the hydrated electron depopulation occurs via geminate recombination, a process that exhibits nonexponential decay behavior,29,56 the exponential decay constant that is extracted from our analysis should be regarded as merely an approximation to the decay of the hydrated electron population by geminate recombination and observed within a very narrow (<4 ps) time-delay window. Moreover, in view of an earlier finding that electron–ion recombination dynamics involving solutes in aqueous solution is considerably slower than the diffusion limit,57 which suggests negligible recombination between tyrosyl radical anions and hydrated electrons on the few-picosecond timescale in our experiments, we employ the same time constants as those obtained from aqueous NaOH in our analysis. While a detailed analysis of the geminate recombination dynamics lies beyond the scope of the present work, a future study that varies the concentration of the Tyr2− dianion solute and extends the pump–probe measurements to >0.1 ns time delays would allow one to disentangle the relative contributions of the geminate recombination channels that involve the hydroxyl radicals and the tyrosyl radical anions.
Extrapolating the ΔA(λ,t) time traces (Fig. 4(a)) collected for the photodetached tyrosinate dianion to time zero reveals an offset ΔA0(λ), which indicates the formation of the tyrosyl radical anion immediately upon strong-field photodetachment (Fig. 4(b), in red). This offset is noticeably smaller for the time traces for photodetached aqueous sodium hydroxide obtained under similar experimental conditions (Fig. 4(b), in blue), consistent with the fact that the hydroxyl radical, produced by the photodetachment of aqueous hydroxide, does not exhibit any appreciable absorption in the >400 nm region (εOH = 30 M−1 cm−1 at 400 nm).58 The wavelength-dependent offset ΔA0(λ) that is obtained for the tyrosinate dianion corresponds to the absorption spectrum of the tyrosyl radical anion at the Franck–Condon region, generated immediately upon photodetachment, prior to vibrational cooling. Compared to the differential absorption spectra for the tyrosyl radical reported in the literature,22,44,45 the additional broadening of ΔA0(λ) towards the long-wavelength side is suggestive of a vibrationally excited tyrosyl radical anion that is produced immediately upon photodetachment. On the other hand, ΔA0(λ) of the sodium hydroxide sample shows a gradual increase with decreasing probe wavelength, following the absorption spectral signature of the hydroxyl radical.58
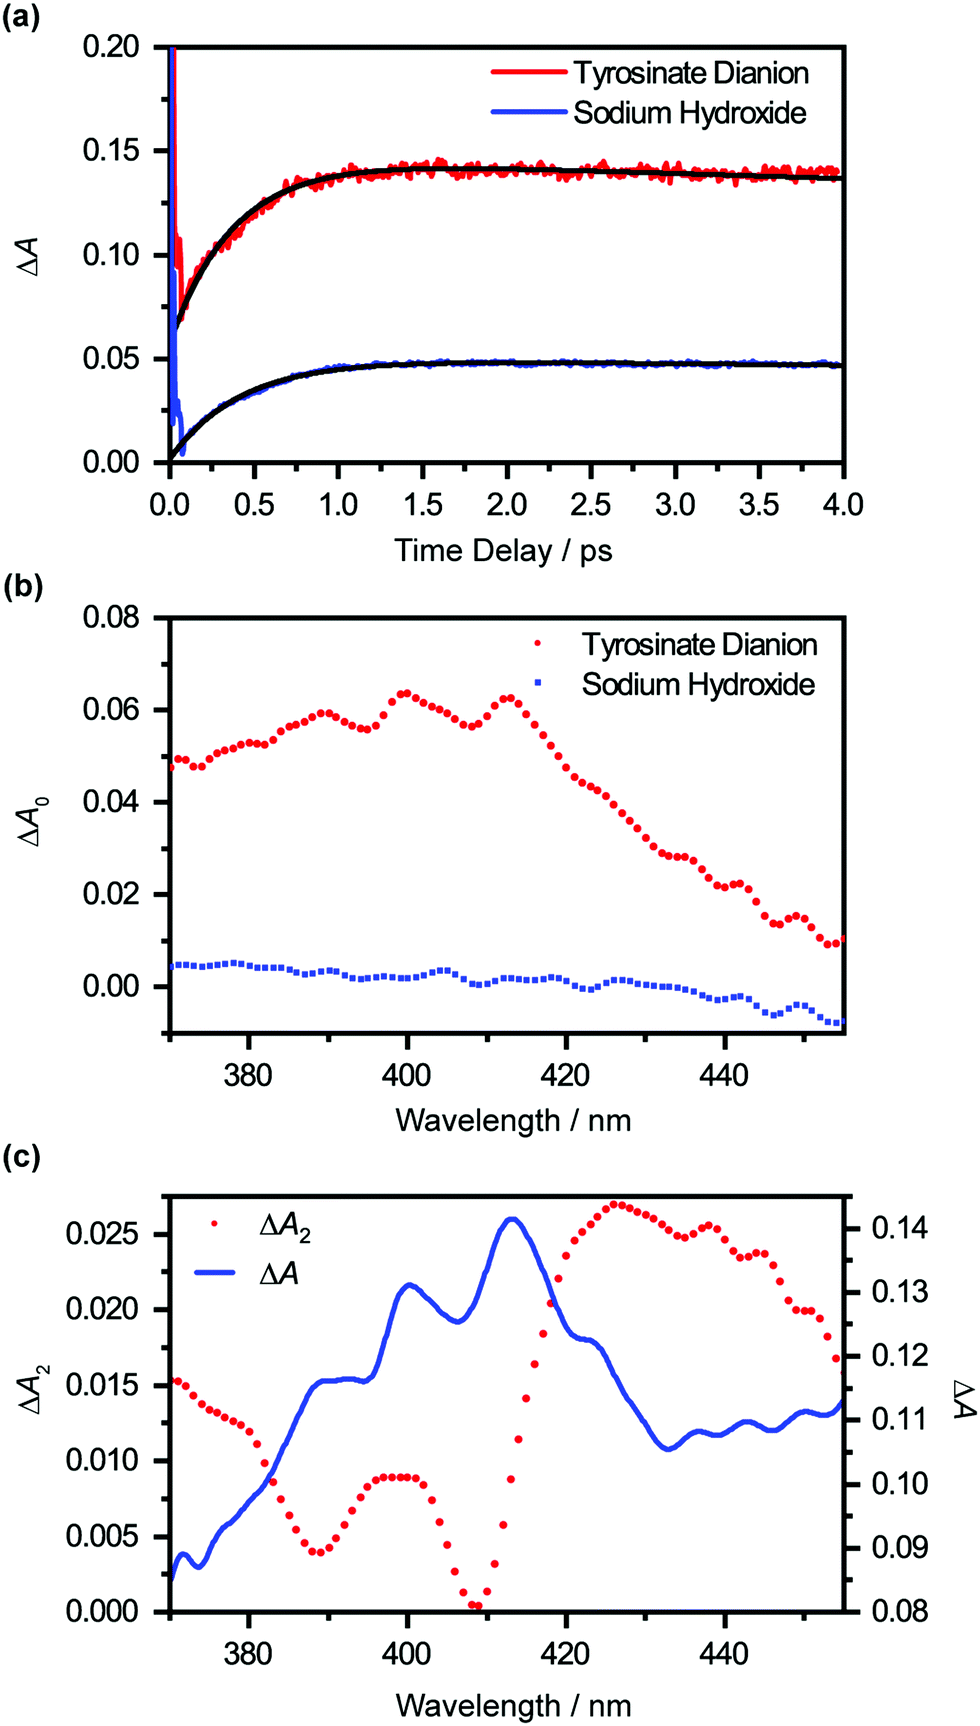 | ||
| Fig. 4 (a) Time-traces at 413 nm of the photodetached aqueous tyrosinate dianion (red) and photodetached aqueous sodium hydroxide (blue). Note the offset that is present in the photodetached aqueous tyrosinate dianion time trace, which indicates the immediate formation of tyrosyl radical upon photodetachment. In addition, global fit analysis on both time-traces from 120 fs is performed, where the best-fit line is shown in black. (b) The wavelength-dependent offset values, ΔA0, obtained from the global fitting of photodetached aqueous sodium hydroxide (blue) and photodetached aqueous tyrosinate dianion (red) time traces. The fitting errors are comparable to the size of the symbol. (c) The ΔA2(λ) spectrum obtained from global fitting (red) and the ΔA spectrum of photodetached aqueous tyrosinate dianion at 2 ps time delay (blue). | ||
Global analysis using eqn (1) gives τd2 = 0.93 ± 0.02 ps. Based on previous experimental results that reveal the stability of tyrosyl radical with respect to dissociation,59 we exclude the possibility that the decay of the ΔA signal arises from photofragmentation. The appearance of the decay associated spectrum ΔA2(λ) is suggestive of the decay of the ΔA signal in the long-wavelength region (λ > 420 nm) and the sharpening of the 400 nm and 413 nm absorption maxima of the Tyr˙− radical spectrum. As such, we ascribe τd2 to vibrational relaxation. A similar analysis performed on photodetached phenoxide anions in aqueous solution yields a vibrational relaxation timescale of 1.02 ± 0.03 ps,36 suggesting that the amino acid backbone induces a small but noticeable increase in the vibrational relaxation. Due to the limited range of time delays (∼4 ps) sampled in our experiments, however, we cannot rule out the possible existence of slower vibrational relaxation pathways.
Since ΔA1(λ) tracks the formation of the hydrated electron and its subsequent decay by geminate recombination, it should follow the absorption spectrum of the hydrated electron. Using the relation:
| ΔA1(λ) = εe(λ)ceL, | (2) |
| ΔA0(λ) = [εTyr(λ)cTyr + εOH(λ)cOH]L, | (3) |
Vibrational wave packet dynamics
The time-resolved ΔA spectra (Fig. 2) reveal amplitude modulations as a function of time delay, suggesting the presence of vibrational wave packet dynamics. We exclude contributions from impulsive stimulated Raman scattering (ISRS) of the tyrosinate dianion to the observed wave packet dynamics because the absorption spectrum of the aqueous tyrosinate dianion (Fig. S4, ESI†) does not lie within the range of the probe spectrum. Moreover, the ΔA signal vanishes when the pump power is attenuated to suppress strong-field photodetachment.To analyze the vibrational wave packet dynamics quantitatively, we compute the spectral first-moment 〈E(t)〉 time trace, given as
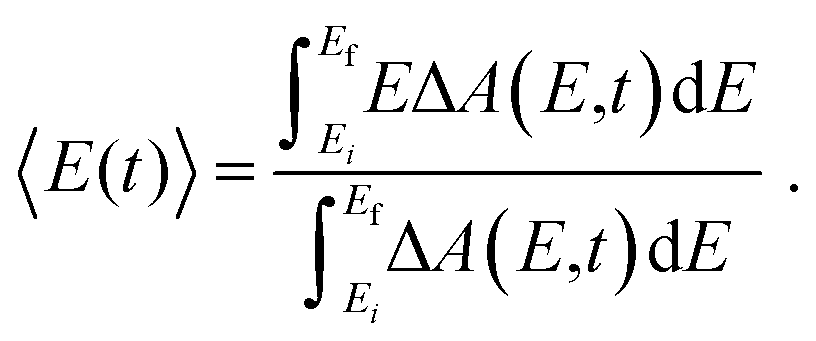 | (4) |
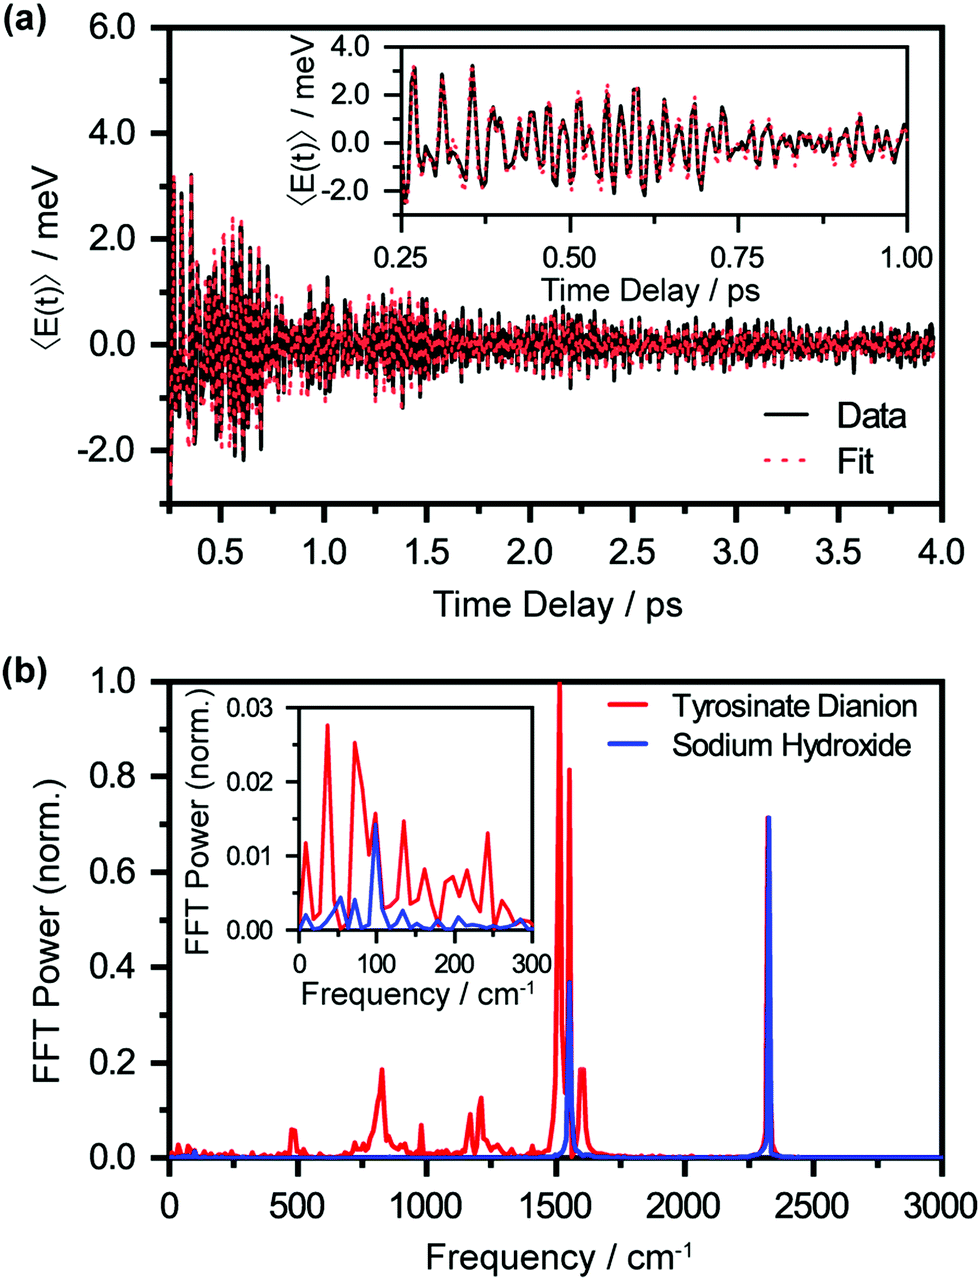 | ||
| Fig. 5 (a) First-moment time-trace 〈E(t)〉 of photodetached aqueous tyrosinate dianion with fit function. The inset shows the enlarged first-moment time-trace 〈E(t)〉 from 0.25 ps to 1 ps. (b) FFT power spectra of the first-moment time trace of photodetached aqueous tyrosinate anion (in red) and photodetached aqueous sodium hydroxide (in blue). The peaks observed are vibrational frequencies associated with the tyrosyl radical anion. Note that the oxygen and nitrogen vibrational frequencies are also observed at 1554 cm−1 and 2328 cm−1, respectively. The inset shows the enlarged FFT power spectrum from 0 to 300 cm−1. | ||
The oscillatory nature of the spectral first-moment time trace arises from vibrational wave packet motion of the tyrosyl radical anion. Wave packet motion along the vibrational mode Qi requires photodetachment to project the vibrational probability density of Tyr2− vertically onto the potential energy curve of Tyr˙−, and for the potential energy surfaces of Tyr2− and Tyr˙− to be displaced along Qi. From the Franck–Condon region of the Tyr˙− potential, temporal evolution of the coherent superposition of vibrational eigenstates leads to vibrational wave packet motion. This wave packet motion in turn modulates the probe transition energy of the Tyr˙− anion radical, giving rise to the observed oscillations in the first-moment time trace. It is important to note that vibrational wave packet motion can be initiated by such a displacive mechanism only when the equilibrium geometries of Tyr2− and Tyr˙− are displaced along a given vibrational mode Qi. The vibrational modes can be identified by their characteristic frequencies, in turn obtained from the fast-Fourier transform (FFT) power spectrum of the first-moment time trace (Fig. 5(b), in red). These frequencies and their relative FFT powers are summarized in Table 1.
| Experimental | Calculated frequency (cm−1) | Assignment | |||||
|---|---|---|---|---|---|---|---|
| FFT Analysis | Time-domain analysis | ||||||
| Frequency (cm−1) | Power (norm.) | Frequency (cm−1) | Amplitude (meV) | Dephasing Time (ps) | Phase (π rad) | ||
| 476 | 6.0 × 10⁻² | 483 ± 1 | 0.45 ± 0.06 | 0.90 ± 0.14 | 1.06 ± 0.04 | 482 | 6a |
| 825 | 1.9 × 10⁻¹ | 816 ± 2 | 7.29 ± 0.84 | 0.19 ± 0.01 | 0.77 ± 0.04 | 832 | 1 |
| 978 | 6.8 × 10⁻² | 1000 ± 3 | 2.19 ± 0.46 | 0.25 ± 0.03 | 0.74 ± 0.07 | 994 | 19a |
| 1166 | 9.1 × 10⁻² | 1172 ± 1 | 0.41 ± 0.06 | 1.30 ± 0.37 | 0.54 ± 0.06 | 1185 | 8a |
| 1211 | 1.3 × 10⁻¹ | 1210 ± 1 | 1.03 ± 0.13 | 0.65 ± 0.10 | 0.30 ± 0.05 | 1240 | 13 |
| 1516 | 1 | 1515 ± 1 | 2.01 ± 0.09 | 0.77 ± 0.06 | 1.69 ± 0.02 | 1520 | 20a |
| 1606 | 1.9 × 10⁻¹ | 1601 ± 1 | 1.11 ± 0.09 | 0.73 ± 0.10 | 0.60 ± 0.03 | 1626 | 9a |
| 1552 | 8.1 × 10⁻¹ | 1554 ± 1 | 0.40 ± 0.03 | 3.67 ± 0.55 | 0.45 ± 0.01 | O2 | |
| 2324 | 7.1 × 10⁻¹ | 2328 ± 1 | 0.47 ± 0.03 | 4.01 ± 0.45 | 0.56 ± 0.01 | N2 | |
A control experiment performed with aqueous NaOH (pH 14) under similar photodetachment conditions confirms that the oscillatory features observed in the first-moment time trace originate from photodetached tyrosinate dianion. The FFT power spectrum of photodetached aqueous NaOH is shown in Fig. 5(b), in blue. Here, the only observed frequencies are 1554 cm−1 and 2328 cm−1, which correspond to the stretching frequencies of oxygen (O2) and nitrogen (N2), respectively.61,62 These frequencies, also present in the FFT power spectrum of the photodetached tyrosinate dianion, are due to ISRS of N2 and O2, which in turn arise from the experiments being performed in air. The estimated vibrational frequency of the OH˙ radical, produced by photodetachment of OH−, is ∼3880 cm−1,63 beyond the high-frequency cut-off of our experiment. Based on the results of the control experiment, we conclude that the remaining seven vibrational frequencies reported in Table 1 are associated with the tyrosyl radical anion.64,65
Aside from FFT, the first-moment time-trace can also be analyzed in the time domain by fitting it to a sum of exponentially damped cosine functions,
 | (5) |
It is interesting to compare the photodetachment-induced vibrational wave packet dynamics of the tyrosyl radical anion and the phenoxyl radical. The vibrational wave packet dynamics triggered by the photodetachment of aqueous phenoxide is characterized by an FFT power spectrum that is strongly peaked at 527 cm−1. This vibrational frequency, assigned to the benzene CCC bend, also dominates the Franck–Condon progression observed in the gas-phase photodetachment spectrum of phenoxide.68 On the other hand, the largest FFT power observed in the photodetachment-induced vibrational coherence of the tyrosyl radical anion is associated with the C–O stretch at 1515 cm−1 (Fig. 5(b), in red); in comparison, the FFT power of the corresponding CCC bending mode in the tyrosyl radical anion, downshifted to 483 cm−1, is >10× weaker. Aside from changes in the relative FFT power, the vibrational modes at 816 and 1000 cm−1 of the tyrosyl radical anion also exhibit dephasing times that are ∼3× shorter than those of the corresponding modes of the phenoxyl radical. This faster dephasing is suggestive of anharmonic coupling of these benzene ring modes to the amino acid backbone of tyrosine, a subject for future investigations.
Theoretical calculations
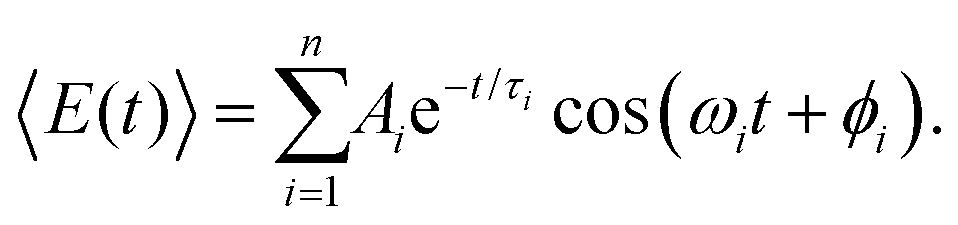
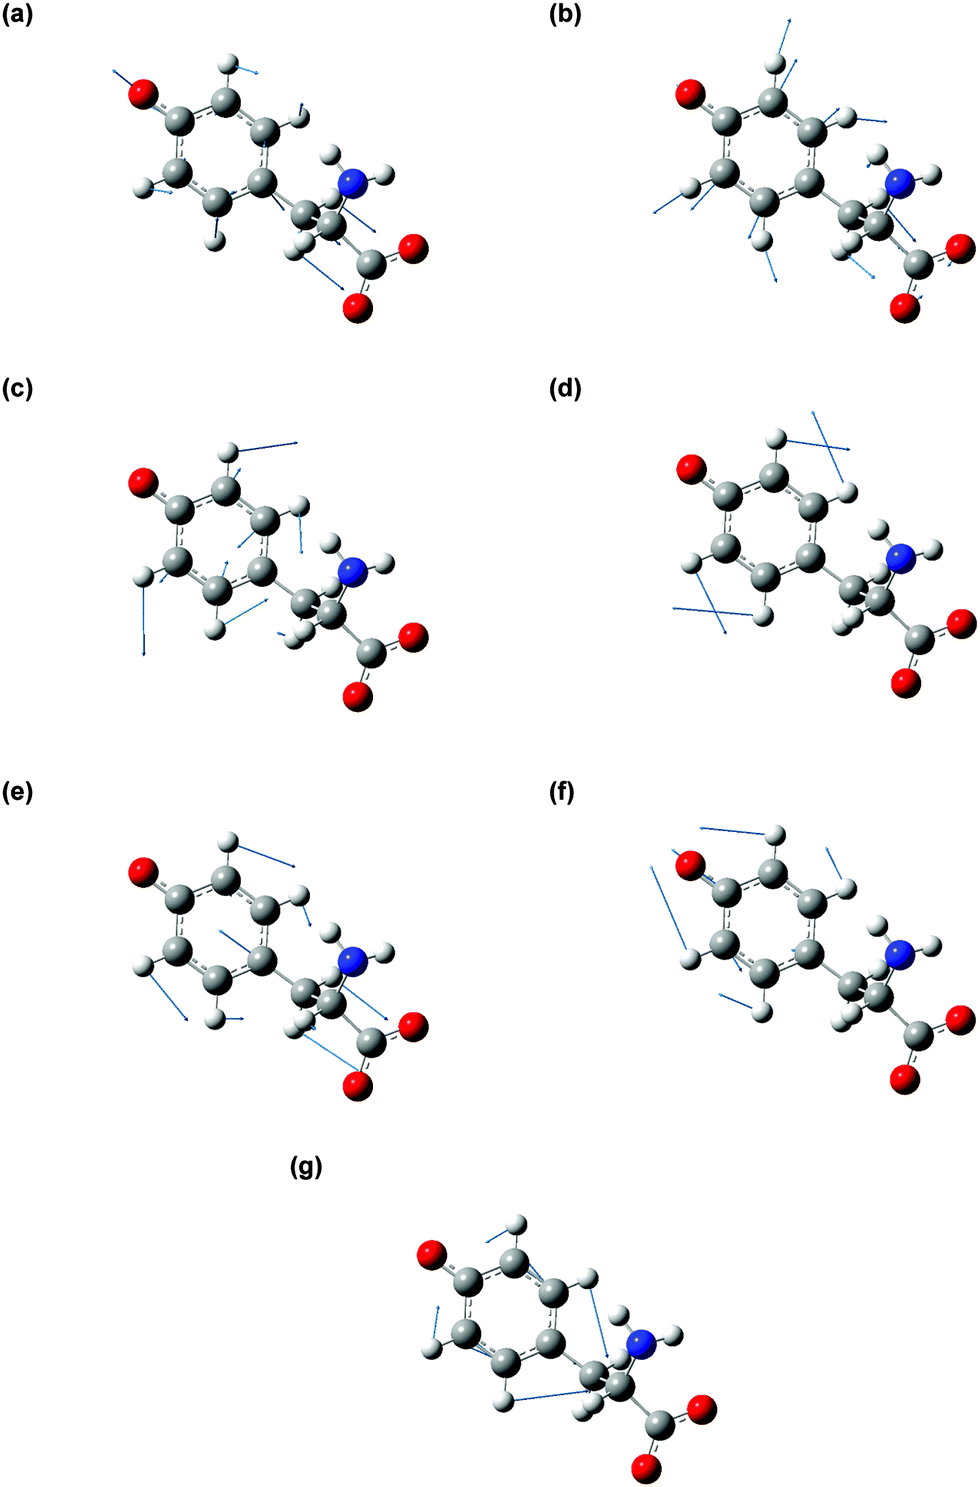
The vibrational modes that contribute to the vibrational wave packet signal are assigned with the aid of ab initio vibrational frequency calculations. The calculated vibrational frequencies reported in Table 1 are those of the microhydrated model; the assignments should be considered tentative due to the presence of multiple calculated vibrational frequencies in the vicinity of each of the experimentally observed frequency. Although including explicit water molecules of solvation does not shift the vibrational frequencies that are higher than 200 cm−1 appreciably (∼1% or less), their presence is necessary to model the intermolecular vibrational modes involved in the solvation of the tyrosyl radical anion. The complete list of vibrational frequencies of the tyrosyl radical anion, along with their assignments, are tabulated in the Supplementary Information (Table S1, ESI†).The displacement vectors of the vibrational modes that contribute to the first-moment time trace are largely localized on the phenoxide moiety (Fig. 6). This result can be rationalized by considering the electronic character of the orbital from which the electron is ejected. Strong-field processes preferentially eject the most weakly bound electrons from molecules. Within a molecular orbital picture, this implies that the electron that lies in the highest occupied molecular orbital (HOMO) of the tyrosinate dianion has the highest probability of being removed by strong-field photodetachment. The calculated HOMO is primarily localized on the phenoxide sidechain (Fig. 7). Removal of an electron from the HOMO therefore leads to vibrational wave packet motion encoding primarily the structural rearrangement of the phenoxide sidechain, as seen from the few-picometer changes in the calculated C–O and C–C bond lengths of microhydrated Tyr2− and Tyr˙− (Table 2). In addition to the phenoxide moiety, the HOMO also bears a significant albeit minor contribution from the α and β carbon atoms, which explains the calculated changes in the C–C bond distances involving the amino acid backbone; the C–C stretching character is present in the vibrational modes with frequencies 832, 1240, and 1626 cm−1. While the change in the C–O bond length is comparable to that calculated at the same level of theory for the photodetachment of phenoxide,36 and changes in the C–C bond lengths differ from those calculated for phenoxide, suggesting that the amino acid backbone influences the relative contributions of the various vibrational modes to the structural reorganization. This result in turn provides a possible explanation for the qualitatively different appearance of the FFT power spectra associated with vibrational wave packet motion of the phenoxyl radical36 and the tyrosyl radical anion (Fig. 5(b)).
 | ||
| Fig. 6 Vibrational modes of tyrosyl radical anion coupled to the photodetachment, corresponding to the calculated frequencies (a) 482 cm−1 (b) 832 cm−1 (c) 994 cm−1 (d) 1185 cm−1 (e) 1240 cm−1 (f) 1520 cm−1 (g) 1626 cm−1. The blue arrows indicate the direction and magnitude of the displacement of the atoms. | ||
 | ||
| Fig. 7 Highest occupied molecular orbital (HOMO) of the microhydrated tyrosinate dianion. | ||
| Bond | Bond length/pm | Difference/pm | Bond length/pm | Difference/pm | ||
|---|---|---|---|---|---|---|
| Tyrosinate dianion | Tyrosyl radical anion | Phenoxide anion | Phenoxyl radical | |||
| C1–C2 | 155.2 | 156.3 | 1.1 | |||
| C2–C3 | 155.7 | 158.8 | 3.1 | |||
| C3–C4 | 151.2 | 148.5 | −2.7 | |||
| C4–C5 | 140.1 | 141.9 | 1.8 | 141.7 | 144.8 | 3.1 |
| C5–C6 | 139.5 | 137.1 | −2.4 | 139.3 | 137.2 | −2.1 |
| C6–C7 | 141.3 | 144.4 | 3.1 | 139.8 | 141.1 | 1.3 |
| C7–C8 | 141.7 | 144.5 | 2.8 | 139.8 | 141.1 | 1.3 |
| C8–C9 | 139.1 | 136.8 | −2.3 | 139.3 | 137.2 | −2.1 |
| C9–C4 | 140.3 | 142.3 | 2.0 | 141.7 | 144.8 | 3.1 |
| C7–O10 | 132.9 | 127.3 | −5.6 | 132.6 | 126.8 | −5.8 |
| O10–O23 | 269.8 | 289.0 | 19.2 | |||
| O10–O24 | 269.7 | 289.0 | 19.3 | |||
| O10–O25 | 268.9 | 283.8 | 14.9 | |||
Structural changes that are induced by photodetachment are not confined to the covalent framework of the amino acid itself. According to the DFT calculations, the intermolecular O⋯O distance increases from 2.69–2.70 Å in the microhydrated tyrosinate dianion to 2.84–2.89 Å in the microhydrated tyrosyl radical anion. These O⋯O distances lie within the range of 2.7–3.0 Å that is characteristic of hydrogen bonding.69,70 The increase in the intermolecular O⋯O distances can be attributed to the weakening of the hydrogen bond caused by the removal of electron density on the phenoxide oxygen. The large changes in the intermolecular distance upon photodetachment should trigger coherent hindered translational motion, typically overdamped in liquid water.71,72 Our DFT calculations predict that these intermolecular motions are characterized by vibrational frequencies of ∼130–160 cm−1 (Table S2, ESI†), coinciding with a band observed in the low-frequency region of the FFT power spectrum (Fig. 5(b), inset). Future investigations will aim to elucidate the ultrafast solvation dynamics that accompany the photodetachment process.
Conclusions
In conclusion, femtosecond strong-field photodetachment of the tyrosinate dianion in aqueous solution results in vibrational wave packet dynamics of the tyrosyl radical anion product. The wave packet motion is resolved into seven different vibrational modes and assigned with the aid of DFT calculations. These vibrational modes are observed because they participate in ultrafast structural reorganization upon photodetachment, consistent with their displacement vectors being largely localized on the phenoxide side chain, from which the electron is photodetached. Compared to previous experimental results for the aqueous phenoxyl radical, prepared by the strong-field photodetachment of aqueous phenoxide, we find that the presence of the amino acid backbone in the tyrosine radical anion changes the relative FFT intensities and decreases the dephasing times of certain vibrational modes. Moreover, the DFT calculations of the microhydrated tyrosinate dianion and the tyrosine radical anion suggests that photodetachment is accompanied by the elongation of the hydrogen-bonded O⋯O distances by ∼0.2 Å. Solvation dynamics driven by photoionization or photodetachment will be a subject of future investigations. The observation of these photodetachment-induced vibrational coherences of the tyrosyl radical anion in aqueous solution offers a glimpse into the elementary structural dynamics that accompany the interaction of ionizing radiation with biological molecules. These results suggest that our experimental approach can be extended to other redox-active amino acids such as tryptophan and phenylalanine as well as to larger biomolecules.Conflicts of interest
There are no conflicts of interest to declare.Acknowledgements
We acknowledge financial support from the Ministry of Education, Singapore (RG1/20, RG105/17, and MOE2014-T2-2-052). M. S. B. M. Y. is supported by the Nanyang President's Graduate Scholarship.References
- E. J. Hart, Annu. Rev. Nucl. Sci., 1965, 15, 125–150 CrossRef CAS.
- B. C. Garrett, D. A. Dixon, D. M. Camaioni, D. M. Chipman, M. A. Johnson, C. D. Jonah, G. A. Kimmel, J. H. Miller, T. N. Rescigno, P. J. Rossky, S. S. Xantheas, S. D. Colson, A. H. Laufer, D. Ray, P. F. Barbara, D. M. Bartels, K. H. Becker, K. H. Bowen, S. E. Bradforth, I. Carmichael, J. V. Coe, L. R. Corrales, J. P. Cowin, M. Dupuis, K. B. Eisenthal, J. A. Franz, M. S. Gutowski, K. D. Jordan, B. D. Kay, J. A. LaVerne, S. V. Lymar, T. E. Madey, C. W. McCurdy, D. Meisel, S. Mukamel, A. R. Nilsson, T. M. Orlando, N. G. Petrik, S. M. Pimblott, J. R. Rustad, G. K. Schenter, S. J. Singer, A. Tokmakoff, L.-S. Wang and T. S. Zwier, Chem. Rev., 2005, 105, 355–390 CrossRef CAS PubMed.
- P. Wardman, Br. J. Radiol., 2009, 82, 89–104 CrossRef CAS PubMed.
- P. H. Cannington and N. S. Ham, J. Electron Spectrosc. Relat. Phenom., 1983, 32, 139–151 CrossRef CAS.
- D. M. Close, J. Phys. Chem. A, 2011, 115, 2900–2912 CrossRef CAS PubMed.
- A. Roy, R. Seidel, G. Kumar and S. E. Bradforth, J. Phys. Chem. B, 2018, 122, 3723–3733 CrossRef CAS PubMed.
- B. M. K. Gmeiner and C. C. C. Seelos, Free Radical Biol. Med., 1996, 21, 349–351 CrossRef CAS.
- C. Grangeasse, A. J. Cozzone, J. Deutscher and I. Mijakovic, Trends Biochem. Sci., 2007, 32, 86–94 CrossRef CAS PubMed.
- T. Hunter, Curr. Opin. Cell Biol., 2009, 21, 140–146 CrossRef CAS.
- L. J. Getz, C. S. Runte, J. K. Rainey and N. A. Thomas, J. Bacteriol., 2019, 201, e00205–00219 CrossRef CAS.
- O. B. Morozova, A. S. Kiryutin, R. Z. Sagdeev and A. V. Yurkovskaya, J. Phys. Chem. B, 2007, 111, 7439–7448 CrossRef CAS PubMed.
- J. J. Warren, J. R. Winkler and H. B. Gray, FEBS Lett., 2012, 586, 596–602 CrossRef CAS PubMed.
- D. R. Weinberg, C. J. Gagliardi, J. F. Hull, C. F. Murphy, C. A. Kent, B. C. Westlake, A. Paul, D. H. Ess, D. G. McCafferty and T. J. Meyer, Chem. Rev., 2012, 112, 4016–4093 CrossRef CAS PubMed.
- T. G. McCaslin, C. V. Pagba, H. Hwang, J. C. Gumbart, S.-H. Chi, J. W. Perry and B. A. Barry, Chem. Commun., 2019, 55, 9399–9402 RSC.
- F. Lacombat, A. Espagne, N. Dozova, P. Plaza, P. Müller, K. Brettel, S. Franz-Badur and L.-O. Essen, J. Am. Chem. Soc., 2019, 141, 13394–13409 CrossRef CAS PubMed.
- J. Stubbe, D. G. Nocera, C. S. Yee and M. C. Y. Chang, Chem. Rev., 2003, 103, 2167–2202 CrossRef CAS PubMed.
- S. Hammes-Schiffer, Energy Environ. Sci., 2012, 5, 7696–7703 RSC.
- A. Migliore, N. F. Polizzi, M. J. Therien and D. N. Beratan, Chem. Rev., 2014, 114, 3381–3465 CrossRef CAS PubMed.
- S. Hammes-Schiffer, J. Am. Chem. Soc., 2015, 137, 8860–8871 CrossRef CAS PubMed.
- J. Feitelson and E. Hayon, J. Phys. Chem., 1973, 77, 10–15 CrossRef CAS.
- J. Feitelson, E. Hayon and A. Treinin, J. Am. Chem. Soc., 1973, 95, 1025–1029 CrossRef CAS.
- D. V. Bent and E. Hayon, J. Am. Chem. Soc., 1975, 97, 2599–2606 CrossRef CAS PubMed.
- C. R. Johnson, M. Ludwig and S. A. Asher, J. Am. Chem. Soc., 1986, 108, 905–912 CrossRef CAS.
- I. Ayala, K. Range, D. York and B. A. Barry, J. Am. Chem. Soc., 2002, 124, 5496–5505 CrossRef CAS PubMed.
- H. F. Hameka and J. O. Jensen, Comput. Theor. Chem., 1993, 288, 9–16 Search PubMed.
- B. A. Barry, J. Chen, J. Keough, D. Jenson, A. Offenbacher and C. Pagba, J. Phys. Chem. Lett., 2012, 3, 543–554 CrossRef CAS.
- C. V. Pagba, T. G. McCaslin, G. Veglia, F. Porcelli, J. Yohannan, Z. Guo, M. McDaniel and B. A. Barry, Nat. Commun., 2015, 6, 10010 CrossRef CAS PubMed.
- K. Pirisi, L. Nag, Z. Fekete, J. N. Iuliano, J. Tolentino Collado, I. P. Clark, I. Pécsi, P. Sournia, U. Liebl, G. M. Greetham, P. J. Tonge, S. R. Meech, M. H. Vos and A. Lukacs, Photochem. Photobiol. Sci., 2021, 20, 369–378 CrossRef PubMed.
- R. A. Crowell and D. M. Bartels, J. Phys. Chem., 1996, 100, 17940–17949 CrossRef CAS.
- C. Pépin, T. Goulet, D. Houde and J. P. Jay-Gerin, J. Phys. Chem. A, 1997, 101, 4351–4360 CrossRef.
- C. Silva, P. K. Walhout, K. Yokoyama and P. F. Barbara, Phys. Rev. Lett., 1998, 80, 1086–1089 CrossRef CAS.
- V. H. Vilchiz, J. A. Kloepfer, A. C. Germaine, V. A. Lenchenkov and S. E. Bradforth, J. Phys. Chem. A, 2001, 105, 1711–1723 CrossRef CAS.
- M. S. Pshenichnikov, A. Baltuška and D. A. Wiersma, Chem. Phys. Lett., 2004, 389, 171–175 CrossRef CAS.
- M. Mostafavi and I. Lampre, Recent Trends in Radiation Chemistry, 2010, pp. 21–58 DOI:10.1142/9789814282093_0002.
- M. H. Elkins, H. L. Williams, A. T. Shreve and D. M. Neumark, Science, 2013, 342, 1496–1499 CrossRef CAS PubMed.
- T. Debnath, M. S. B. Mohd Yusof, P. J. Low and Z.-H. Loh, Nat. Commun., 2019, 10, 2944 CrossRef PubMed.
- D. Ghosh, A. Roy, R. Seidel, B. Winter, S. Bradforth and A. I. Krylov, J. Phys. Chem. B, 2012, 116, 7269–7280 CrossRef CAS PubMed.
- B. Winter, R. Weber, W. Widdra, M. Dittmar, M. Faubel and I. V. Hertel, J. Phys. Chem. A, 2004, 108, 2625–2632 CrossRef CAS.
- K. Nishizawa, N. Kurahashi, K. Sekiguchi, T. Mizuno, Y. Ogi, T. Horio, M. Oura, N. Kosugi and T. Suzuki, Phys. Chem. Chem. Phys., 2011, 13, 413–417 RSC.
- N. Kurahashi, S. Karashima, Y. Tang, T. Horio, B. Abulimiti, Y.-I. Suzuki, Y. Ogi, M. Oura and T. Suzuki, J. Chem. Phys., 2014, 140, 174506 CrossRef PubMed.
- C. F. Perry, P. Zhang, F. B. Nunes, I. Jordan, A. von Conta and H. J. Wörner, J. Phys. Chem. Lett., 2020, 11, 1789–1794 CrossRef CAS PubMed.
- B. Winter, M. Faubel, R. Vácha and P. Jungwirth, Chem. Phys. Lett., 2009, 474, 241–247 CrossRef CAS.
- R. Carta and G. Tola, J. Chem. Eng. Data, 1996, 41, 414–417 CrossRef CAS.
- A. Gräslund, M. Sahlin and B. M. Sjöberg, Environ. Health Perspect., 1985, 64, 139–149 Search PubMed.
- S. Oldemeyer, S. Franz, S. Wenzel, L.-O. Essen, M. Mittag and T. Kottke, J. Biol. Chem., 2016, 291, 14062–14071 CrossRef CAS PubMed.
- P. M. Hare, E. A. Price and D. M. Bartels, J. Phys. Chem. A, 2008, 112, 6800–6802 CrossRef CAS PubMed.
- M. Dantus, V. Lozovoy and I. Pastirk, Laser Focus World, 2007, 43, 101–104 Search PubMed.
- D. Pestov, V. V. Lozovoy and M. Dantus, Opt. Express, 2009, 17, 14351–14361 CrossRef PubMed.
- D. L. Nelson, M. M. Cox and A. L. Lehninger, Principles of Biochemistry, W.H. Freeman, New York, 7th edn, 2017 Search PubMed.
- M. J. Frisch, G. W. Trucks, H. B. Schlegel, G. E. Scuseria, M. A. Robb, J. R. Cheeseman, G. Scalmani, V. Barone, G. A. Petersson, H. Nakatsuji, X. Li, M. Caricato, A. V. Marenich, J. Bloino, B. G. Janesko, R. Gomperts, B. Mennucci, H. P. Hratchian, J. V. Ortiz, A. F. Izmaylov, J. L. Sonnenberg, D. Williams-Young, F. Ding, F. Lipparini, F. Egidi, J. Goings, B. Peng, A. Petrone, T. Henderson, D. Ranasinghe, V. G. Zakrzewski, J. Gao, N. Rega, G. Zheng, W. Liang, M. Hada, M. Ehara, K. Toyota, R. Fukuda, J. Hasegawa, M. Ishida, T. Nakajima, Y. Honda, O. Kitao, H. Nakai, T. Vreven, K. Throssell, J. A. Montgomery Jr., J. E. Peralta, F. Ogliaro, M. J. Bearpark, J. J. Heyd, E. N. Brothers, K. N. Kudin, V. N. Staroverov, T. A. Keith, R. Kobayashi, J. Normand, K. Raghavachari, A. P. Rendell, J. C. Burant, S. S. Iyengar, J. Tomasi, M. Cossi, J. M. Millam, M. Klene, C. Adamo, R. Cammi, J. W. Ochterski, R. L. Martin, K. Morokuma, O. Farkas, J. B. Foresman and D. J. Fox, Gaussian 16 Rev. C.01, Gaussian Inc, Wallingford, CT, 2016 Search PubMed.
- A. D. Becke, Phys. Rev. A: At., Mol., Opt. Phys., 1988, 38, 3098–3100 CrossRef CAS PubMed.
- C. Lee, W. Yang and R. G. Parr, Phys. Rev. B: Condens. Matter Mater. Phys., 1988, 37, 785–789 CrossRef CAS PubMed.
- J. Tomasi, B. Mennucci and R. Cammi, Chem. Rev., 2005, 105, 2999–3094 CrossRef CAS PubMed.
- F. Ambrosio, Z. Guo and A. Pasquarello, J. Phys. Chem. Lett., 2018, 9, 3212–3216 CrossRef CAS PubMed.
- F. Ambrosio, G. Miceli and A. Pasquarello, J. Phys. Chem. Lett., 2017, 8, 2055–2059 CrossRef CAS PubMed.
- J. A. Kloepfer, V. H. Vilchiz, V. A. Lenchenkov, A. C. Germaine and S. E. Bradforth, J. Chem. Phys., 2000, 113, 6288–6307 CrossRef CAS.
- J. Peon, G. C. Hess, J.-M. L. Pecourt, T. Yuzawa and B. Kohler, J. Phys. Chem. A, 1999, 103, 2460–2466 CrossRef CAS.
- G. Czapski and B. H. J. Bielski, Radiat. Phys. Chem., 1993, 41, 503–505 CrossRef CAS.
- J. A. Noble, J. P. Aranguren-Abate, C. Dedonder, C. Jouvet and G. A. Pino, Phys. Chem. Chem. Phys., 2019, 21, 23346–23354 RSC.
- L. Petersson, A. Gräslund, A. Ehrenberg, B. M. Sjöberg and P. Reichard, J. Biol. Chem., 1980, 255, 6706–6712 CrossRef CAS.
- J. H. Odhner, D. A. Romanov and R. J. Levis, Phys. Rev. Lett., 2009, 103, 075005 CrossRef CAS PubMed.
- R. Salter, J. Chu and M. Hippler, Analyst, 2012, 137, 4669–4676 RSC.
- Z.-H. Loh, G. Doumy, C. Arnold, L. Kjellsson, S. H. Southworth, A. Al Haddad, Y. Kumagai, M.-F. Tu, P. J. Ho, A. M. March, R. D. Schaller, M. S. Bin Mohd Yusof, T. Debnath, M. Simon, R. Welsch, L. Inhester, K. Khalili, K. Nanda, A. I. Krylov, S. Moeller, G. Coslovich, J. Koralek, M. P. Minitti, W. F. Schlotter, J.-E. Rubensson, R. Santra and L. Young, Science, 2020, 367, 179–182 CrossRef CAS PubMed.
- E. B. Wilson, Phys. Rev., 1934, 45, 706–714 CrossRef CAS.
- L. I. Grace, R. Cohen, T. M. Dunn, D. M. Lubman and M. S. de Vries, J. Mol. Spectrosc., 2002, 215, 204–219 CrossRef CAS.
- J. C. Dean, S. Rafiq, D. G. Oblinsky, E. Cassette, C. C. Jumper and G. D. Scholes, J. Phys. Chem. A, 2015, 119, 9098–9108 CrossRef CAS PubMed.
- S. Rafiq and G. D. Scholes, J. Phys. Chem. A, 2016, 120, 6792–6799 CrossRef CAS PubMed.
- J. B. Kim, T. I. Yacovitch, C. Hock and D. M. Neumark, Phys. Chem. Chem. Phys., 2011, 13, 17378–17383 RSC.
- G. A. Jeffrey, An Introduction to Hydrogen Bonding, Oxford University Press, New York, 1997 Search PubMed.
- P. Gilli, L. Pretto, V. Bertolasi and G. Gilli, Acc. Chem. Res., 2009, 42, 33–44 CrossRef CAS PubMed.
- S. Palese, L. Schilling, R. J. D. Miller, P. R. Staver and W. T. Lotshaw, J. Phys. Chem., 1994, 98, 6308–6316 CrossRef CAS.
- C. J. Fecko, J. D. Eaves and A. Tokmakoff, J. Chem. Phys., 2002, 117, 1139–1154 CrossRef CAS.
Footnote |
| † Electronic supplementary information (ESI) available. See DOI: 10.1039/d1cp02975d |
| This journal is © the Owner Societies 2021 |