 Open Access Article
Creative Commons Attribution 3.0 Unported Licence
Isomeric effects in structure formation and dielectric dynamics of different octanols
Jennifer
Bolle
*a,
S. Peter
Bierwirth
 b,
Martina
Požar
 c,
Aurélien
Perera
 d,
Michael
Paulus
a,
Philipp
Münzner
 b,
Christian
Albers
a,
Susanne
Dogan
a,
Mirko
Elbers
 a,
Robin
Sakrowski
 a,
Göran
Surmeier
a,
Roland
Böhmer
a,
Göran
Surmeier
a,
Roland
Böhmer
 b,
Metin
Tolan
a and
Christian
Sternemann
 *a
*a
aFakultät Physik/DELTA, Technische Universität Dortmund, 44227 Dortmund, Germany. E-mail: jennifer.bolle@tu-dortmund.de; christian.sternemann@tu-dortmund.de
bFakultät Physik, Technische Universität Dortmund, 44227 Dortmund, Germany
cUniversity of Split, Faculty of Science, Ruera Boškovića 33, 21000, Split, Croatia
dSorbonne Université, Laboratoire de Physique Théorique de la Matiére Condensée (UMR CNRS 7600), 4 Place Jussieu, F75252, Paris cedex 05, France
First published on 6th October 2021
Abstract
The understanding of the microstructure of associated liquids promoted by hydrogen-bonding and constrained by steric hindrance is highly relevant in chemistry, physics, biology and for many aspects of daily life. In this study we use a combination of X-ray diffraction, dielectric spectroscopy and molecular dynamics simulations to reveal temperature induced changes in the microstructure of different octanol isomers, i.e., linear 1-octanol and branched 2-, 3- and 4-octanol. In all octanols, the hydroxyl groups form the basis of chain-, cyclic- or loop-like bonded structures that are separated by outwardly directed alkyl chains. This clustering is analyzed through the scattering pre-peaks observed from X-ray scattering and simulations. The charge ordering which pilots OH aggregation can be linked to the strength of the Debye process observed in dielectric spectroscopy. Interestingly, all methods used here converge to the same interpretation: as one moves from 1-octanol to the branched octanols, the cluster structure evolves from loose large aggregates to a larger number of smaller, tighter aggregates. All alcohols exhibit a peculiar temperature dependence of both the pre-peak and Debye process, which can be understood as a change in microstructure promoted by chain association with increased chain length possibly assisted by ring-opening effects. All these results tend to support the intuitive picture of the entropic constraint provided by branching through the alkyl tails and highlight its capital entropic role in supramolecular assembly.
1 Introduction
Hydrogen bonds are essential to understand the microscopic structure of water and aqueous solutions. They stabilize the structure of peptides,1 proteins2 and are the driving force for association in molecular liquids.3 Within this class of liquids, monohydroxy alcohols seem to be relatively simple as they consist of an alkyl tail and one hydrophobic head group. Though, they can build complex hydrogen-bonded networks resulting in a heterogeneous structure on the microscale that is determined by the interplay between self-association and steric hindrance. This microstructure is controlled by the length4,5 and the branching6 of the carbon tail and the position of the hydroxyl group7 and can be classified by cyclic, linear or more complex associates like lassos and branched chains or loops. Interestingly, the appearance and dominant type of structural arrangements are supposed to dependent on temperature8–10 and pressure11–13 as inferred from dielectric spectroscopy,14–19 rheology,20–22 calorimetry,23,24 vibrational spectroscopy,25,26 molecular dynamics simulations27–30 and a combination of experimental and theoretical methods.31–34 An overview can be found in Böhmer et al.3 In order to systematically study the effects of molecular architecture and thermodynamic conditions on structure formation, octyl alcohol isomers serve as perfect candidates since the position of the hydroxyl group resulting in branching can be varied. Interpretation of the results from dielectric spectroscopy of Smyth,35 Dannhauser,7 and Johari,36 Shinomiya17 suggests that the supramolecular structure of some isomeric octyl alcohols changes from predominant chain to ring arrangements with decreasing temperature.17 Recent dielectric studies of nM3H (n-methyl-3-heptanol) with n = 3,4,5,6 support this assumption.14 Although evidence of different types of molecular association and their interchange with pressure and temperature was found by spectroscopy and molecular dynamics simulations, many efforts have been made to trace the evolution of these supramolecular arrangements using direct structural probes such as X-ray and neutron diffraction, often in combination with molecular dynamics simulations.37–39 However, interpreting the results obtained by these experimental approaches need to be critically discussed particularly when compared with calculated diffraction intensities. Typically the diffraction intensities of monohydroxy alcohols exhibit two prominent features, (i) a main peak reflecting the average particle–particle distance, which is dictated by the size of the methylene group for larger alcohols and (ii) a characteristic pre-peak at lower momentum transfer that is assigned to clusters of hydroxyl groups surrounded by their alkyl tails.40,41 In a previous study of monohydroxy alcohols,39 we showed that the intensity of the pre-peak is not directly related to the local cluster microstructure, while its position is correlated to the mean size of the formed meta-objects. Strictly speaking, this structure is reflected in the various atom-atom correlation functions and structure factors, but these are not directly experimentally observed and can only be obtained through computer simulations. The charge ordering process underlying the clustering of the hydroxyl head groups leads to the existence of pre-peaks and anti-peaks in the structure factors of the atoms involved. The pre-peak is quite often the result of severely cancelling contributions between the pre-peaks and anti-peaks of the underlying structure factors. Hence, the interpretation of the pre-peaks intensity should be done with caution. 1-Octanol has already been investigated in several studies,6,42,43 as it is often used as a membrane mimetic among others. Like for other primary alcohols, chain formation tends to dominate. However, studies show that 1-octanol forms also more complex structures.43 When the hydroxyl group is located further towards the center of the molecule, small ring-like arrangements rather than extended networks dominate as is the case with 2-, 3- and 4-octanol.44In this work we combine dielectric spectroscopy, X-ray diffraction (XRD) and molecular dynamics (MD) simulations to systematically investigate the change in the microscopic structure of different octanol isomers (n-octanol with n = 1,2,3,4) induced by temperature. As the charge ordering enforces the formation of meta-objects their resulting dipole moment significantly effects the dielectric response of the liquid. Based on the present results we are able to constrain how the hydroxyl group influences the interplay between steric hindrance and hydrogen-bonding on molecular association. The observed changes are discussed in terms of the reorganization of characteristic structural units and monomer/dimer formation.
2 Experiment and theory
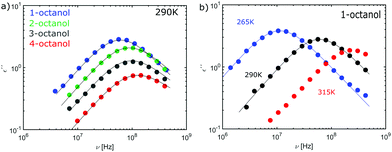
We studied the monohydroxy alcohols (MAs) 1-octanol (≥99.7%), 2-octanol (≥99.5%), 3-octanol (≥99.5%), and 4-octanol (≥97%) which were provided from Sigma Aldrich and have been used without further treatment. The XRD experiments were performed at beamline BL9 of the DELTA synchrotron radiation source.45 We used the setup for wide angle X-ray scattering at photon energies of 13 keV, 20 keV and 27 keV. The scattered photons were detected by a MAR345 image plate detector and lanthanum hexaboride was measured as a calibration standard. The MAs were filled into borosilicate capillaries with diameters of 2 or 3.5 mm and the sample temperature was varied utilizing an Oxford cryostream cooler series 700 between 381 and 244 K with a 3.5 K increment. The specified temperature was corrected by reference to a calibrated thermocouple. The lowest temperatures achieved in the measurements were selected to be above the crystallization temperature, i.e. 258.35 K, 241.55 K, 228.15 K and 232.45 K46 for 1-, 2-, 3- and 4-octanol, respectively. The two dimensional diffraction images were integrated and converted to momentum transfer q-scale exploiting the fit2D program package.47 Finally, the diffraction patterns were corrected for absorption, the scattering contributions of the capillary and air and were normalized to the integral in the q-range from 2 to 23 nm−1. For a detailed analysis, the intensity, FWHM (Full Width at Half Maximum) and position of both the pre-peak and the main peak were determined by a fit with a Pearson VII function and a linear slope in the corresponding peak area (see ref. 39 for details). The corresponding error bars were determined by changing the fit ranges.The dielectric measurements were performed with an Alpha analyzer from Novocontrol augmented by a Quatro temperature unit. Here, the temperature is controlled via a cold nitrogen stream. This temperature regulation unit allows for an accuracy of up to 0.1 K. An E4991A analyzer was employed to determine dielectric spectra in the range from 1 to several 100 MHz. The radio-frequency measuring cell48 improves the accuracy of the absolute values determined using this cell; they were matched with reference measurement obtained for the same alcohols at frequencies below 1 MHz. The matched high-frequency data of the real and imaginary part of the dielectric constant for n-octanol (n = 1,2,3,4) are shown in Fig. 12 in comparison with the low-frequency data.
From the experimental data we calculated the Kirkwood factor gK.49 This correlation factor contains important information regarding the liquid's microstructure6 by quantifying the angle between different dipole vectors of molecules in liquids.3 It is defined via
 | (1) |
![[thin space (1/6-em)]](https://www.rsc.org/images/entities/char_2009.gif) 6). The Kirkwood factor is a measure for those short-range intermolecular interactions that lead to specific dipole–dipole orientations. So the Kirkwood factor can be used to differentiate between linear and cyclic structures. Thus, gK allows one to track transitions from gK > 1 (parallel orientation) to gK < 1 (anti-parallel orientation) with changing temperature.14
6). The Kirkwood factor is a measure for those short-range intermolecular interactions that lead to specific dipole–dipole orientations. So the Kirkwood factor can be used to differentiate between linear and cyclic structures. Thus, gK allows one to track transitions from gK > 1 (parallel orientation) to gK < 1 (anti-parallel orientation) with changing temperature.14
All MD simulations were performed with the program package GROMACS.50 A box size of 7.9532 nm was selected. One box contains 2048–2060 molecules. The systems were simulated in the isobaric-isothermal ensemble, at the temperature of T = 300 K and pressure p = 1 bar in order to represent the laboratory conditions as closely as possible (see ref. 39 for more details). To maintain constant temperature, we used the v-rescale thermostat,51 while the Parrinello–Rahman barostat52,53 was used to keep the pressure constant. The temperature algorithm had a time constant of 0.2 ps, while the pressure algorithm was set at 5 ps. The initial configurations were generated using the PACKMOL54 software. The systems were first energy minimized and then equilibrated in the NPT ensemble for a total of 2 ns. Production runs were performed after the equilibration, also lasting 2 ns. The time step for equations of motions was 2 fs and the integration algorithm of choice was the leap-frog.55 The short-range interactions were calculated within the 1.5 nm cut-off radius. The long range electrostatic calculations were handled with the particle mesh Ewald (PME) method,56 with the FFT grid spacing of 0.12 nm and the interpolation order of 4.
The pre- and main peak analysis was performed as described for the experiment. For evaluation of the cluster snapshots, geometric constraints were applied to determine hydrogen-bonded molecules to classify the occurrence of specific cluster types in the OPLS simulations as indicated in Fig. 1. We used the definition of a hydrogen bond given by Gómez-Álvarez et al.,57i.e. the distance between the oxygen sites dOO and between the oxygen and bonded hydrogen dOH should be smaller than 3.5 Å and 2.5 Å, respectively, while the angle α as defined in Fig. 1 should be smaller than 30°.
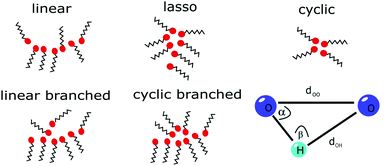 | ||
| Fig. 1 Schematic representation of the OH groups (red circles) forming hydrogen-bonded structures (meta-objects). A schematic of the distances and angle parameters for cluster analysis is also shown. | ||
If we consider the number of bonding partners of each molecule (in fact of each OH group), cyclic structures contain only molecules with two bonds while linear ones comprise at least two molecules with only one bond. If more complex structures are present, they consist of at least one molecule having three bonds. Here, further differentiation can be made by considering the molecules with only one bond in the cluster. This way we are able to classify the molecular associations as linear, cyclic, cyclic branched, linear branched and lasso type.
3 Results and discussion
At first, we discuss the structural characteristics of the octanol isomers at ambient conditions using measured and calculated diffraction intensities in combination with a cluster analysis of the MD simulations. Then we analyze the temperature dependence of the diffraction intensities and compare them with results from dielectric spectroscopy.3.1 Structural characteristics at ambient conditions
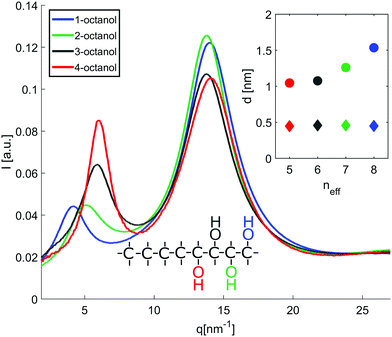
The diffraction patterns I(q) of the different n-octanols measured at room temperature are compared in Fig. 2. For each I(q) a dominant main peak around qmp ≈ 14 nm−1 as well as a pre-peak qpp between 4 to 7 nm−1 can be observed. While the main peak hardly varies for the different isomers, the pre-peak shifts to higher q values and increases in intensity for those molecules for which the hydroxyl group is located close to the center of the alkyl chain, i.e. molecules with decreasing effective length neff of the alkyl tail and increasing branching. neff indicates the number of carbon atoms of the longest chain, as seen from the hydroxyl group.In dense liquids, each peak position can be indifferently interpreted in real space through d ≈ 2π/q, either as a particle–particle distance or a particle size. The fact that all the main peaks are at nearly the same position qmp simply reflects the dominant contribution of the carbons atoms (methylene groups), i.e. qmp ≈ 2π/1.4 Å ≈ 4 Å. The position of the pre-peak qpp can be related to the average size of the meta-objects surrounded by the alkyl tails that constitute the microstructure of the liquid (see inset of Fig. 2) and suggests a pronounced dependence on the molecules structure. If the pre-peak positions are attributed to the aggregated meta-entities, then 1-octanol and to a lesser extent 2-octanol aggregates are larger than those expected for 3- and 4-octanols. This finding appears quite intuitive: The charge order clusters can be seen as embedded into an alkyl bath which acts as constraining media on the clusters. Since higher branching produces more tail entropic constraints, i.e. the restriction of the alkyl tails' mobility due to branching, we expect 3- and 4-octanols to form smaller aggregates. Because the number of OH groups in the liquids is exactly the same across all octanols, this implies that there must be less and looser aggregates in 1-octanols, as opposed to a denser packing of smaller aggregates in the 2-, 3- and 4-octanols.
In line with this finding, the strong variation of the pre-peak intensity indicates pronounced changes in the hydroxyl-hydroxyl and hydroxyl-chain correlations for the studied isomers.39
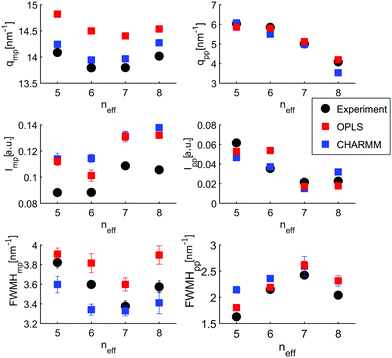
In an attempt to understand these observations more deeply as a trace of the liquids microstructure, we confront the experimental diffraction intensities with calculated ones. The latter are based on MD simulations using different force fields, the unified atom version of OPLS58,59 and the all atom model CHARMM.60–62 The calculated diffraction intensities are presented in Fig. 3 and reproduce the changes observed in the experiment for the different isomers.
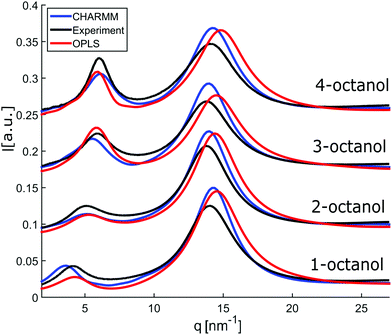 | ||
| Fig. 3 Calculated diffraction patterns (OPLS (red) and CHARMM (blue)) compared to measured data (black). | ||
To enable a detailed comparison between theory and experiment, both the measured and calculated diffraction intensities are analyzed regarding their peak position (qmp, qpp), peak intensity (Imp, Ipp) and FWHM as discussed before. The results are compared in Fig. 4. In general, there is a remarkable agreement between the theory and experiment specifically concerning the trends for the different isomers. The main peak variation is reproduced very well by both models while the absolute values are better represented by CHARMM which can be traced back to the more realistic density achieved in the all atom simulation compared to unified atom model. The intensities show some deviation compared to the experiment, with a good overall agreement regarding the trends observed for the FWHM. Thus, both models provide a reasonable description of the short-range correlations in these systems. Let us now consider the results for the pre-peak which is related to the long-range atom-atom correlations. We observe, that the pre-peak shifts to higher q values as the branching increases. This indicates that the position of the hydroxyl group in the molecule plays a crucial role here. It can be observed that the overall trends for the pre-peak are well reproduced by both models. Despite the intensity calculated for 2-octanol, OPLS works extremely well, especially in reproducing the pre-peak position for all octanols. While most octanols seem to follow a consistent trend with increasing branching, i.e. decreasing position and intensity and increasing FWHM of the pre-peak, 1-octanol behaves differently and thus seems to exhibit peculiar long-range correlations.
In order to probe the underlying microstructure, we discuss the cluster analysis of the OPLS MD simulations in the following, because the pre-peak position is the most solid quality to characterize the microstructure of the system. OPLS was found to work particularly well to resemble its dependence for linear monohydroxy alcohols with increasing chain length.39 A comparative cluster analysis of the CHARMM model is shown in Fig. 10.
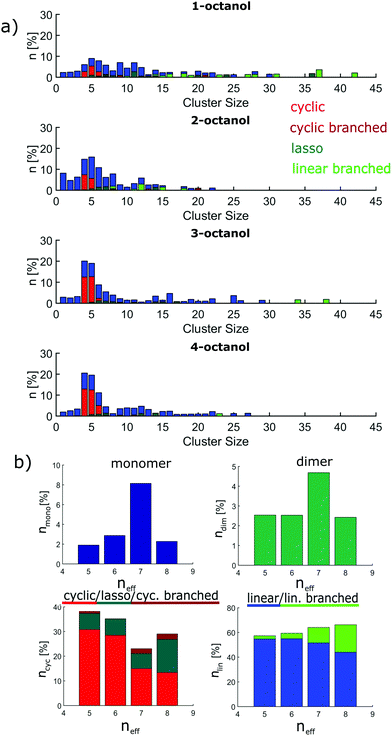
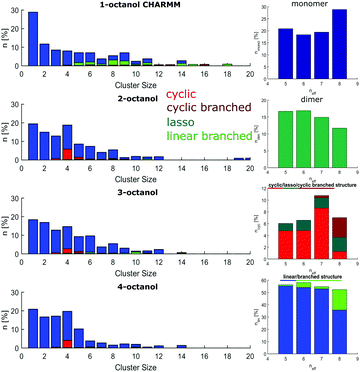
The size distributions are presented as the number of molecules in a supramolecular arrangement of a given size in percentage of the total number of molecules identified for the four isomers are presented in Fig. 5(a). The clusters are differentiated by their typical shape as linear, branched, cyclic, lasso, and cyclic branched clusters. In contrast to the branched octanols, 1-octanol consists of relatively complex arrangements and large branched clusters. 64% of the molecules can be found in clusters made of more than 7 hydrogen-bonded molecules, i.e. for cluster which show no more purely cyclic structures. For the branched alcohols, their contribution is significantly smaller, i.e. 33%, 38%, and 36% for 2-, 3-, and 4-octanol, respectively. Interestingly, with higher branching, a dominant contribution of clusters consisting of 4–5 molecules is observed. Obviously the cluster size distribution for the linear octanol is significantly broadened.
This is also reflected in the average cluster size, which changes from 7 molecules per cluster for 1-octanol to 4.0, 5.3, 5.4 molecules per cluster for 2-, 3-, and 4-octanol, respectively. This behavior can be assigned to the high flexibility of the alkyl chain in the linear octanol compared to the increasing steric hindrance caused by branching of the carbon chains of the other isomers. It is also evident from this analysis that formation of cyclic structures increases with increasing neff. The sharper distribution of supramolecular assembly of 3- and 4-octanol is in agreement with the strong change of intensity in the pre-peak caused by a change of correlations and cross correlations between the charge head groups and the alkyl tails triggered by the underlying microstructure. The shift of the pre-peak can be traced back to the average size of the meta-objects which scales with the effective chain length.
The implications on microstructure for the interpretation of dielectric spectroscopy measurements requires a closer look at the occurrence of characteristic supramolecular arrangements that exhibit different resulting dipole moment. Here, we distinguish monomers, dimers, linear/linear-branched and all types of cyclic structural units. While in dielectric spectroscopy the fingerprint of monomers is the so-called (high-frequency) alpha process, supramolecular dipole moments as evident for e.g. chain-like structural units are assumed to be responsible for the so-called Debye process observed at lower frequencies. In contrast, dimers and cyclic structures show no significant effect on the Debye peak because they do not constitute a large supramolecular dipole moment.63 The occurrence of monomers (≈2–8%) and dimers (≈2–4%) is relatively small and does not differ significantly among the n-octanols. However, as the amount of monomers increases systematically with increasing effective length of the alkyl tail from 4- to 2-octanol, 1-octanol does not sustain this trend. As the major contribution we find linear clusters in all octanols. The number of these clusters increases with decreasing molecular branching from 57% to 66% accompanied by a tendency to form linear-branched structural motives. The latter is due to favored branching in larger clusters and is pronounced in 1-octanol. The probability to find cyclic arrangements increases in the opposite direction but with the exception of 1-octanol, which shows more complex structural units with small but persisting dipole moment. The contribution of cyclic structures is 23–29% for 1- and 2-octanol and increases up to 38% for 4-octanol.
The cluster analysis of the CHARMM simulations confirms the trend observed for OPLS to a certain extent, particularly regarding the structural specifics of 1-octanol. But it exhibits much stronger contributions for monomers and dimers and less pronounced sharpening of cluster distribution for clusters with 4 to 5 molecules accompanied with smaller amount of cyclic structures, which are mainly observed for the branched octanols (see Fig. 10).
To conclude, 3- and 4-octanol show a relatively sharp cluster distribution with dominating cluster size of 4–5 molecules with a prevalent appearance of cyclic clusters. 1-Octanol exhibits the largest variety of structural units and major contributions of structural arrangements with sizeable effective dipole moments. The microstructure of 2-octanol may be a crossover case which shows structural similarity to the other branched isomers. We find strong structural differences between the family of branched octanols and the linear one. These results are consistent with existing studies by Stephenson et al.43 As branching increases, it is assumed that due to steric hindrance ring-like structures form more frequently.43,44 Consequently, a different dielectric response of these isomers is expected which was already discussed in the literature.6 It will be further emphasized below in view of our dielectric measurements and observation of the occurrence of relatively large chain-like associates in 1-octanol by simulation. In order to further constrain the structural peculiarities with branching and to relate the static information from XRD to the probe of the liquids dynamics via dielectric spectroscopy, in the following we study how this microstructure is affected by variation of the temperature.
4 Variation of microstructure with temperature
4.1 X-ray diffraction
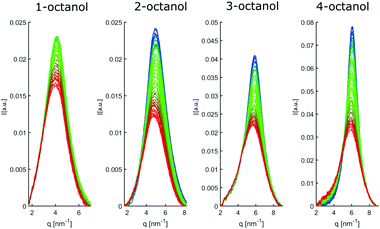
The diffraction patterns of all octanols measured in the indicated temperature range are shown in Fig. 6. The patterns are shifted on the ordinate scale for clarity. With decreasing temperature, we expect the liquid to become locally more tightly packed and ordered. This should also be the case for the meta-objects. This is indeed the case as far as all the main peaks are concerned. Conversely, the pre-peaks do not follow this trend. The main peak position moves systematically to larger q with decreasing temperature and is getting sharper while its intensity increases, a behavior that is consistent with an increasing density of the liquids and better defined contact-pair correlations.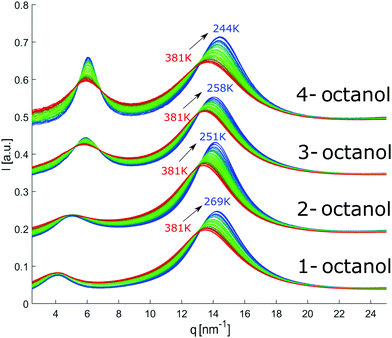 | ||
| Fig. 6 Temperature dependent diffraction patterns of n-octanol (n = 1,2,3,4). For visual clarity, the data for the different isomers were shifted vertically. | ||
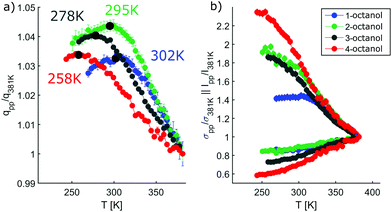
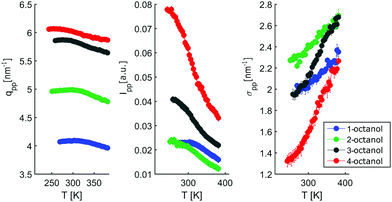
In contrast, the pre-peak position starts to move to larger q with decreasing temperature, then settles its position and finally shifts to smaller q at the lowest temperatures. Also the pre-peak intensity and FWHM deviate from the behavior observed for the main peak. We performed the same pre-peak analysis as before in order to reveal the temperature dependence of the peak in more detail. The corresponding results of this analysis are presented in Fig. 7. For a better comparability of the relative changes, all parameters were normalized to their values determined at 381 K, which are 3.96, 4.78, 5.64, 5.87 nm−1 for qpp, 0.0295, 0.024, 0.048, 0.071 for Ipp and 2.35, 2.65, 2.68, 2.27 nm−1 for σpp in case of 1-, 2-, 3-, 4-octanol, respectively. For a comparison on an absolute scale, we refer to Fig. 13 and 14. An intriguing dependence of the pre-peak is evident from the low temperature variation of the peak position. It is also reflected in the changes in slope for the intensity and FWHM for temperatures below 320 K (see Fig. 14).
As the position of the pre-peak is correlated with the size of the meta-objects formed in the liquids, it provides a direct probe of the fact that the microstructure changes with temperature. It exhibits a clear structural cross over at 302 ± 5 K, 295 ± 5 K, 278 ± 8 K, and 258 ± 10 K for 1-, 2-, 3-, and 4-octanol, respectively, which shifts systematically with increasing branching to lower temperature. We note that the relative variation in the pre-peak position is largest for 2-octanol and then decreases with branching for the other isomers. Conversely, 1-octanol deviates from this trend, a finding which we assign to the very different microstructure observed even at room temperature from the analysis of the MD simulations. Within the high-temperature regime, all octanols behave similarly which might be assigned to monomer formation arising as a consequence of the increased mobility of the molecules. For the low temperature range, the crossover in the pre-peak position indicates preferred formation of meta-objects with larger effective size, a feature that can e.g. be triggered by reduced interpenetration and mobility of alkyl tails. In order to constrain possible scenarios further we have studied these octanols using dielectric spectroscopy as function of temperature. This approach provides an indirect probe of the molecular associations that possess different supramolecular dipole moments.
4.2 Dielectric spectroscopy
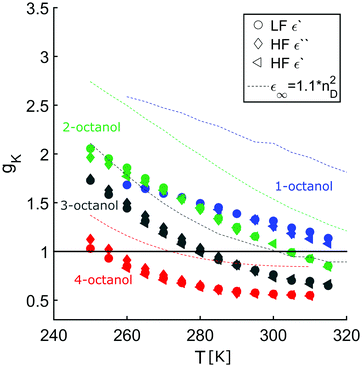
The complex dielectric constant ε*(ν) = ε′(ν) − iε′′(ν) was measured as a function of frequency ν. The real part ε′(ν) is proportional to the reversibly stored energy and the imaginary part ε′′(ν) is proportional to the dissipated energy. Let us first consider the measurements performed at ambient temperature (290 K) as shown in Fig. 8. The dielectric loss spectrum of all octanols shows a dominant loss peak assigned to the Debye process. The intensity of the loss peak is largest for 1-octanol and decreases with increasing branching. This indicates that 1-octanol forms a larger amount of transient structures featuring a significantly larger resulting dipole moment. The dielectric results are thus consistent with those of the cluster analysis and of the diffraction measurements. Let us now consider the low temperature range in which we observe strong changes in the pre-peak position of the octanol isomers.In order to enable a detailed analysis, the relaxation strength Δε = |εs − εinf| is determined for small temperatures, using the Cole-Davidson function64 which can describe the asymmetric shape of the dielectric loss peaks. Fig. 8 shows the fits using the Cole-Davidson function (solid lines) to analyze the measured loss spectra. For high temperatures Δε was determined from the real part of the permittivity by the step height in the storage spectra, because the high frequency tail of the peak of ε′′ could not be tracked within the accessible frequency window. An overview of low- and high-frequency data is given in Fig. 11. The high-frequency dielectric constant εinf was determined from the storage spectra at a temperature of 265 K. The relaxation strength and εinf were used to calculate the static permittivity. For all isomers the loss peak shifts to lower frequencies and the corresponding relaxation strength increases with decreasing temperature. In the entire temperature range the relaxation strength of 2-, 3- and 4-octanol is about one order of magnitude below that of 1-octanol. Based on eqn (1) the Kirkwood factors were determined. The required densities for 1-, 2-, 3-, and 4-octanol were measured as 0.825, 0.819, 0.823, 0.820 g cm−3 at 293 K with a density oscillator. The results for gK are shown in Fig. 9.‡ Interestingly, the Kirkwood factor changes from gK < 1 to gK > 1 at temperatures of 305 K, 280 K and 252 K ± 5 K for the 2-, 3-, 4-octanols, i.e. it decreases systematically with increasing branching. This can be interpreted by a change in microstructure induced by temperature. The Kirkwood factor can be related to the molecular orientation correlation functions through the well-know relation from exact statistical theory of liquids66
 | (2) |
![[thin space (1/6-em)]](https://www.rsc.org/images/entities/char_2009.gif) 〉 refers to a statistical ensemble average. The integral above can have positive values when the dipoles are parallel and negative when anti-parallel. From Fig. 9 we see that at room temperature gK < 1 for all branched octanols, which indicates that the molecular dipoles are arranged mostly in an anti-parallel fashion. This is fully compatible with small and tight charge order, which counteracts parallel dipole alignment. However, as T is decreased, it is seen that gK becomes eventually >1, suggesting that parallel dipole ordering increases as temperature decreases. Dielectric spectroscopy provides information about how the charge ordered OH clusters evolve with temperature: in order for the dipole to align, the clusters must evolve from tight closed shapes, such as rings or dimers, to open chain shapes, where dipole ordering becomes possible.
〉 refers to a statistical ensemble average. The integral above can have positive values when the dipoles are parallel and negative when anti-parallel. From Fig. 9 we see that at room temperature gK < 1 for all branched octanols, which indicates that the molecular dipoles are arranged mostly in an anti-parallel fashion. This is fully compatible with small and tight charge order, which counteracts parallel dipole alignment. However, as T is decreased, it is seen that gK becomes eventually >1, suggesting that parallel dipole ordering increases as temperature decreases. Dielectric spectroscopy provides information about how the charge ordered OH clusters evolve with temperature: in order for the dipole to align, the clusters must evolve from tight closed shapes, such as rings or dimers, to open chain shapes, where dipole ordering becomes possible.
4.3 Structure formation
We observed that the microstructure of the octanols can change over a wide temperature range, with the particularity that the size of meta-objects first decreases with temperature. This behavior is similar to that for the macroscopic density of the liquids while at a certain temperature this trend is reversed and the size of the meta-objects slowly increases consequently resulting in crystallization. This intriguing behavior suggests a mechanism at lower temperatures for all isomers that favors larger meta-objects with the constraint that these objects enhance the overall dielectric response, i.e. exhibit larger supramolecular dipole moments. While at room temperature 1-octanol starts from a very different microstructure than the other isomers (with 2-octanol as an intermediate structure), this mechanism promote larger chain-like or branched chain-like arrangements with decreasing temperature. Moreover, all octanols exhibit a significant portion of cyclic structures. Breaking up these cyclic structure at low temperature would also increase the dielectric strength as inferred from the general behavior of the Kirkwood factor. Such ring opening effects can be inferred based on the OPLS results via breaking up tight clusters of about 4–5 molecules while CHARMM would support this to smaller extent and suggests breaking up of dipoles together with formation of larger entities. Consequently, both models indicate a significant portion of smaller clusters at room temperature for all alcohols that can undergo transition to associates with larger dipole ordering. Thus, linear chain association possibly supported by ring opening effects can be assumed to induce a relevant change of microstructure with decreasing temperature and may be seen as precursor of crystallization, thus favoring linear and linear branched meta-objects. The specific dielectric response of 1-octanol is consistent with the particularities of large cluster distribution with pronounced occurrence of linear and more complex structures. These observations suggest that supramolecular dipole moments may form via transient molecular associations assuming an attaching-detaching mechanism63 which toward low temperatures promotes larger structures with increasing end-to-end dipole moments. Furthermore, it was reported that ring-chain transformations take place on the timescale of the Debye relaxation, an observation interpreted to correspond to fluctuations of the Kirkwood factor.67 These notions were recently corroborated and extended to include not only the temperature but also the pressure dependence of the Debye relaxation68 or to emphasize that despite a lacking calorimetric signature, the Debye process, like the Rouse modes in polymers, is entropic in nature.24 It should be emphasized that the observation of Debye relaxations is by no means restricted to monohydroxy alcohols but well-known also for water and other dielectric liquids featuring large relaxation strengths Δε.69 Consequently, other models for the occurrence of the Debye relaxation in these and other (even non-associating) liquids.3 A few recent or revisited approaches are summarized in ref. 70 to include interpretations involving, e.g. defects in H-bonded networks71,72 or dipole–dipole interactions.69,735 Conclusion
A combination of XRD, dielectric spectroscopy and MD simulations reveals the important role of steric hindrance for charge ordering in 1-octanol and its branched isomers 2-, 3- and 4-octanol at room-temperature. While the microstructure of the branched octanols is dominated by small and tight clusters, 1-octanol exhibits loose diverse and large entities that are the reason for its strong dielectric response. With decreasing temperature we observe an intriguing change in the spacing of the meta-objects that is driven by charge ordering, as well as an increase in the supramolecular dipole moment. Both features indicate a structural change of all octanols with decreasing temperature. A mechanism that promotes linear chain association in combination with breakup of ring structures favors the formation of large linear and linear-branched clusters. Such structural changes are directly connected to both the increase in dipole order seen in the behavior of the Kirkwood factor and an increase in the spacing of the clusters, which is clearly seen in the pre-peak. These findings confirm that the entropic constraints of branched octanols engage a capital role in supramolecular association driven by charge order.6 Further information
This Further information contains results of the cluster analysis of the MD simulations using the CHARMM force field, calibration data of low and high-frequency dielectric spectra in the overlapping frequency range, dielectric loss spectra and real part of the permittivity for all octanols in the entire temperature range, the extracted pre-peaks from diffraction data as well as the results of their analysis on absolute scale.CHARMM-cluster analysis
The cluster analysis of CHARMM shows increased numbers of monomers (18–29%) and dimers (12–17%) for all octanols whereas the number of monomers and dimers in the OPLS model is about 2–8% and 2–5%, respectively. Again, 1-octanol forms complex and large clusters that form a larger dipole moment. The number of pure ring structures is lowest for 1-octanol. In general, the number of cyclic structures increases compared to those of the linear alcohol. Particularly 2-octanol stands out, since it has by far the highest number of pure ring structures. In addition, in branched alcohols there is a preference for the formation of small clusters.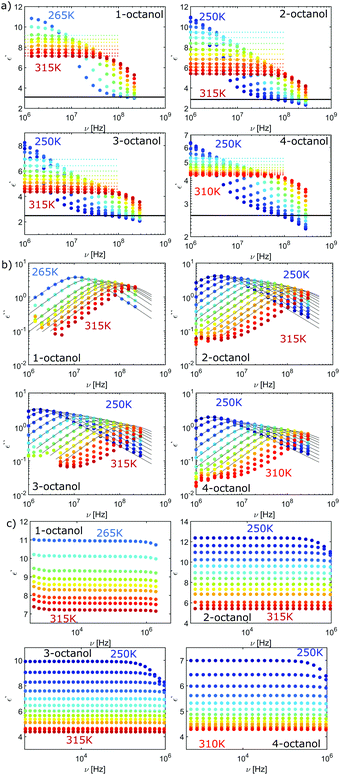 | ||
| Fig. 11 (a) Loss spectrum and (b) real part of permittivity for n-octanol (n = 1,2,3,4), both high frequency data. (c) Low-frequency dielectric constant data. | ||
Dielectric spectra
Temperature dependent plot of the real part ε′(ν) (low and high-frequency data) and the imaginary part ε′′(ν) (high-frequency data) of the dielectric constant of 1-octanol and its branched isomers. The loss spectra additionally include the appropriate Cole-Davidson fits of the Debye peak and the real part of the dielectric constant shows the values used for εinf.Plot of the high-frequency data of the real part ε′(ν) and the imaginary part ε′′(ν) of the dielectric constant of 1-, 2-, 3- and 4-octanol matched to the low-frequency data.
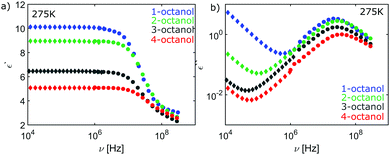 | ||
| Fig. 12 High-frequency (circles) and low-frequency (diamonds) data of the (a) real part of the dielectric constant and (b) of the loss spectrum for n-octanol (n = 1,2,3,4). | ||
XRD pre-peak
Presentation of the pre-peak after separation from the main peak (explained in section 2) and the results of the peak analysis, presented on absolute ordinate scales.Author contributions
J. B., M. T. and C. S. designed research; J. B., C. S., M. Pa., P. M., C. A., S. D., M. E., R. S., G. S. and P. B. performed research; J. B. analyzed data with contributions from C. S., M. E., P. B. and P. M.; M. Po. and A. P. performed calculations; J. B., C. S., A. P. and R. B. wrote the paper with contributions from all co-authors.Conflicts of interest
There are no conflicts of interest to declare.Acknowledgements
We thank the DELTA machine group for providing synchrotron radiation and technical support and Markus Möhlenkamp and Alexander Faulstich for their help with temperature calibration. Göran Surmeier, Christian Albers and Robin Sakrowski thank the Deutsche Forschungsgemeinschaft for financial support via FOR1979 and FOR2125 CarboPaT (STE 1079/4-1, STE 1079/2-1), respectively, and Martina Požar gratefully acknowledges the support of the Croatian Science Foundation under the project no. UIP-2017-05-1863 Dynamics in Micro-segregated Systems. This work was supported by the BMBF via DAAD (PROCOPE 2021-2023, Project-ID: 57560563) within the German-French collaboration PROCOPE (46644XK) Supra-molecular order in complex liquids: experiment and theory.References
- R. Ludwig, O. Reis, R. Winter, F. Weinhold and T. Farrar, J. Phys. Chem. B, 1998, 102, 9312–9318 CrossRef CAS.
- G. A. Jeffrey and W. Saenger, Hydrogen bonding in biological structures, Springer Science & Business Media, 2012 Search PubMed.
- R. Böhmer, C. Gainaru and R. Richert, Phys. Rep., 2014, 545, 125–195 CrossRef.
- M. Tomšič, A. Jamnik, G. Fritz-Popovski, O. Glatter and L. Vlček, J. Phys. Chem. B, 2007, 111, 1738–1751 CrossRef PubMed.
- K. S. Vahvaselkä, R. Serimaa and M. Torkkeli, J. Appl. Crystallogr., 1995, 28, 189–195 CrossRef.
- W. Dannhauser, J. Chem. Phys., 1968, 48, 1911–1917 CrossRef CAS.
- W. Dannhauser, L. Bahe, R. Lin and A. Flueckinger, J. Chem. Phys., 1965, 43, 257–266 CrossRef CAS.
- P. Sillrén, J. Swenson, J. Mattsson, D. Bowron and A. Matic, J. Chem. Phys., 2013, 138, 214501 CrossRef PubMed.
- T. Sato, A. Chiba and R. Nozaki, J. Chem. Phys., 2000, 113, 9748–9758 CrossRef CAS.
- L. Saiz, J. Padro and E. Guardia, J. Phys. Chem. B, 1997, 101, 78–86 CrossRef CAS.
- A. Mariani, P. Ballirano, F. Angiolari, R. Caminiti and L. Gontrani, ChemPhysChem, 2016, 17, 3023–3029 CrossRef CAS PubMed.
- M. Wikarek, S. Pawlus, S. N. Tripathy, A. Szulc and M. Paluch, J. Phys. Chem. B, 2016, 120, 5744–5752 CrossRef CAS PubMed.
- S. Pawlus, A. Grzybowski, S. Kołodziej, M. Wikarek, M. Dzida, P. Góralski, S. Bair and M. Paluch, Sci. Rep., 2020, 10, 1–8 CrossRef.
- L. P. Singh, C. Alba-Simionesco and R. Richert, J. Chem. Phys., 2013, 139, 144503 CrossRef PubMed.
- S. Bierwirth, T. Büning, C. Gainaru, C. Sternemann, M. Tolan and R. Böhmer, Phys. Rev. E: Stat., Nonlinear, Soft Matter Phys., 2014, 90, 052807 CrossRef CAS PubMed.
- S. Bauer, H. Wittkamp, S. Schildmann, M. Frey, W. Hiller, T. Hecksher, N. Olsen, C. Gainaru and R. Böhmer, J. Chem. Phys., 2013, 139, 134503 CrossRef CAS PubMed.
- T. Shinomiya, Bull. Chem. Soc. Jpn., 1989, 62, 3643–3647 CrossRef CAS.
- G. Johari, O. Kalinovskaya and J. Vij, J. Chem. Phys., 2001, 114, 4634–4642 CrossRef CAS.
- R. Dalbert, J. Chim. Phys., 1953, 50, 329–343 CrossRef CAS.
- C. Gainaru, M. Wikarek, S. Pawlus, M. Paluch, R. Figuli, M. Wilhelm, T. Hecksher, B. Jakobsen, J. Dyre and R. Böhmer, Colloid Polym. Sci., 2014, 292, 1913–1921 CrossRef CAS.
- T. Hecksher and B. Jakobsen, J. Chem. Phys., 2014, 141, 101104 CrossRef PubMed.
- S. P. Bierwirth, G. Honorio, C. Gainaru and R. Böhmer, J. Chem. Phys., 2019, 150, 104501 CrossRef PubMed.
- H. Huth, L.-M. Wang, C. Schick and R. Richert, J. Chem. Phys., 2007, 126, 104503 CrossRef PubMed.
- D. Xu, S. Feng, J.-Q. Wang, L.-M. Wang and R. Richert, J. Phys. Chem. Lett., 2020, 11, 5792–5797 CrossRef CAS PubMed.
- S. Bauer, J. Stern, F. Böhm, C. Gainaru, M. Havenith, T. Loerting and R. Böhmer, Vib. Spectrosc., 2015, 79, 59–66 CrossRef CAS.
- M. Paolantoni, P. Sassi, A. Morresi and R. S. Cataliotti, Chem. Phys., 2005, 310, 169–178 CrossRef CAS.
- S. A. Best, K. M. Merz Jr and C. H. Reynolds, J. Phys. Chem. B, 1999, 103, 714–726 CrossRef CAS.
- C. A. F. de Oliveira, C. R. W. Guimarães and R. B. de Alencastro, Int. J. Quantum Chem., 2000, 80, 999–1006 CrossRef CAS.
- Y. Zhong, G. L. Warren and S. Patel, J. Comput. Chem., 2008, 29, 1142–1152 CrossRef CAS PubMed.
- J. Lehtola, M. Hakala and K. Hamalainen, J. Phys. Chem. B, 2010, 114, 6426–6436 CrossRef CAS PubMed.
- L. Hennous, A. R. A. Hamid, R. Lefort, D. Morineau, P. Malfreyt and A. Ghoufi, J. Chem. Phys., 2014, 141, 204503 CrossRef PubMed.
- A. Vrhovšek, O. Gereben, S. Pothoczki, M. Tomšič, A. Jamnik, S. Kohara and L. Pusztai, J. Phys.: Condens. Matter, 2010, 22, 404214 CrossRef PubMed.
- M. Matsugami, R. Yamamoto, T. Kumai, M. Tanaka, T. Umecky and T. Takamuku, J. Mol. Liq., 2016, 217, 3–11 CrossRef CAS.
- J. Cerar, A. Lajovic, A. Jamnik and M. Tomšič, J. Mol. Liq., 2017, 229, 346–357 CrossRef CAS.
- C. Smyth and W. Stoops, J. Am. Chem. Soc., 1929, 51, 3312–3329 CrossRef CAS.
- G. P. Johari and W. Dannhauser, J. Phys. Chem., 1968, 72, 3273–3276 CrossRef CAS.
- C. J. Benmore and Y. L. Loh, J. Chem. Phys., 2000, 112, 5877–5883 CrossRef CAS.
- A. Vrhovsek, O. Gereben, A. Jamnik and L. Pusztai, J. Phys. Chem. B, 2011, 115, 13473–13488 CrossRef CAS PubMed.
- M. Pozar, J. Bolle, C. Sternemann and A. Perera, J. Phys. Chem. B, 2020, 124, 8358–8371 CrossRef CAS PubMed.
- W. Pierce and D. MacMillan, J. Am. Chem. Soc., 1938, 60, 779–783 CrossRef CAS.
- B. Warren, Phys. Rev., 1933, 44, 969 CrossRef CAS.
- J. L. MacCallum and D. P. Tieleman, J. Am. Chem. Soc., 2002, 124, 15085–15093 CrossRef CAS PubMed.
- S. Stephenson, R. Offeman, G. Robertson and W. Orts, Chem. Eng. Sci., 2006, 61, 5834–5840 CrossRef CAS.
- F. Palombo, P. Sassi, M. Paolantoni, A. Morresi and R. S. Cataliotti, J. Phys. Chem. B, 2006, 110, 18017–18025 CrossRef CAS PubMed.
- C. Krywka, C. Sternemann, M. Paulus, N. Javid, R. Winter, A. Al-Sawalmih, S. Yi, D. Raabe and M. Tolan, J. Synchrotron Radiat., 2007, 14, 244–251 CrossRef CAS PubMed.
- D. R. Lide, CRC Handbook of Chemistry and Physics, CRC Press, 2004, vol. 85 Search PubMed.
- A. Hammersley, S. Svensson, M. Hanfland, A. Fitch and D. Hausermann, Int. J. High Pressure Res., 1996, 14, 235–248 CrossRef.
- R. Böhmer, M. Maglione, P. Lunkenheimer and A. Loidl, J. Appl. Phys., 1989, 65, 901–904 CrossRef.
- J. G. Kirkwood, J. Chem. Phys., 1939, 7, 911–919 CrossRef CAS.
- S. Pronk, S. Páll, R. Schulz, P. Larsson, P. Bjelkmar, R. Apostolov, M. R. Shirts, J. C. Smith, P. M. Kasson and D. van der Spoel, et al. , Bioinformatics, 2013, 29, 845–854 CrossRef CAS PubMed.
- G. Bussi, D. Donadio and M. Parrinello, J. Chem. Phys., 2007, 126, 014101 CrossRef PubMed.
- M. Parrinello and A. Rahman, Phys. Rev. Lett., 1980, 45, 1196 CrossRef CAS.
- M. Parrinello and A. Rahman, J. Appl. Phys., 1981, 52, 7182–7190 CrossRef CAS.
- J. M. Martínez and L. Martínez, J. Comput. Chem., 2003, 24, 819–825 CrossRef PubMed.
- R. W. Hockney, Methods Comput. Phys., 1970, 9, 135–221 Search PubMed.
- T. Darden, D. York and L. Pedersen, J. Chem. Phys., 1993, 98, 10089–10092 CrossRef CAS.
- P. Gómez-Álvarez, L. Romaní and D. González-Salgado, J. Chem. Phys., 2013, 138, 044509 CrossRef PubMed.
- W. L. Jorgensen, J. Phys. Chem., 1986, 90, 1276–1284 CrossRef CAS.
- W. L. Jorgensen, D. S. Maxwell and J. Tirado-Rives, J. Am. Chem. Soc., 1996, 118, 11225–11236 CrossRef CAS.
- K. Vanommeslaeghe, E. Hatcher, C. Acharya, S. Kundu, S. Zhong, J. Shim, E. Darian, O. Guvench, P. Lopes and I. Vorobyov, et al. , J. Comput. Chem., 2010, 31, 671–690 CAS.
- K. Vanommeslaeghe and A. D. MacKerell Jr, J. Chem. Inf. Model., 2012, 52, 3144–3154 CrossRef CAS PubMed.
- K. Vanommeslaeghe, E. P. Raman and A. D. MacKerell Jr, J. Chem. Inf. Model., 2012, 52, 3155–3168 CrossRef CAS PubMed.
- C. Gainaru, R. Meier, S. Schildmann, C. Lederle, W. Hiller, E. Rössler and R. Böhmer, Phys. Rev. Lett., 2010, 105, 258303 CrossRef CAS PubMed.
- D. Davidson and R. H. Cole, J. Chem. Phys., 1950, 18, 1417 CrossRef CAS.
- M. Al-Hayan and A.-H. M. Abdul-Latif, J. Chem. Thermodyn., 2006, 38, 68–74 CrossRef CAS.
- P. H. Fries and G. Patey, J. Chem. Phys., 1985, 82, 429–440 CrossRef CAS.
- L. P. Singh and R. Richert, Phys. Rev. Lett., 2012, 109, 167802 CrossRef PubMed.
- K. Ngai, S. Pawlus and M. Paluch, Chem. Phys., 2020, 530, 110617 CrossRef.
- M. Paluch, J. Knapik, Z. Wojnarowska, A. Grzybowski and K. Ngai, Phys. Rev. Lett., 2016, 116, 025702 CrossRef CAS PubMed.
- K. Jurkiewicz, S. Kolodziej, B. Hachula, K. Grzybowska, M. Musial, J. Grelska, R. Bielas, A. Talik, S. Pawlus and K. Kaminski, et al. , J. Mol. Liq., 2020, 319, 114084 CrossRef CAS.
- D. C. Elton, Phys. Chem. Chem. Phys., 2017, 19, 18739–18749 RSC.
- I. Popov, P. B. Ishai, A. Khamzin and Y. Feldman, Phys. Chem. Chem. Phys., 2016, 18, 13941–13953 RSC.
- P.-M. Déjardin, S. V. Titov and Y. Cornaton, Phys. Rev. B: Condens. Matter Mater. Phys., 2019, 99, 024304 CrossRef.
Footnotes |
| † We used μ = 1.68 D for all octyl isomers neglecting the second-order effects on the dipole moment of the alkyl chains. |
| ‡ For the calculation of the Kirkwood factor we used εinf = 3.1, 2.8, 2.6, 2.7 for 1-, 2-, 3- and 4-octanol as determined from the high-frequency data via ε′. For comparison with literature data we calculated gK also via ε∞ = 1.1nD2 taken from ref. 6 and 65. |
| This journal is © the Owner Societies 2021 |

