
 Open Access Article
 This Open Access Article is licensed under a
 Creative Commons Attribution 3.0 Unported Licence
Excited-state symmetry breaking in 9,10-dicyanoanthracene-based quadrupolar molecules: the effect of donor–acceptor branch length†
Zoltán
Szakács
a,
Florian
Glöcklhofer
 b,
Felix
Plasser
c and
Eric
Vauthey
*a
b,
Felix
Plasser
c and
Eric
Vauthey
*a
aDepartment of Physical Chemistry, University of Geneva, 30 Quai Ernest Ansermet, Geneva, Switzerland. E-mail: eric.vauthey@unige.ch
bDepartment of Chemistry and Centre for Processable Electronics, Imperial College London, Molecular Sciences Research Hub, 80 Wood Lane, London, W12 0BZ, UK
cDepartment of Chemistry, Loughborough University, Loughborough, LE11 3TU, UK
First published on 2nd July 2021
Abstract
Excited-state symmetry breaking is investigated in a series of symmetric 9,10-dicyanoanthracenes linked to electron-donating groups on the 2 and 6 positions via different spacers, allowing for a tuning of the length of the donor–acceptor branches. The excited-state properties of these compounds are compared with their dipolar single-branch analogues. The changes in electronic structure upon their optical excitation are monitored by transient electronic spectroscopy in the visible and near-infrared regions as well as by transient vibrational spectroscopy in the mid-infrared. Our results reveal that, with the shortest branches, electronic excitation remains distributed almost symmetrically over the molecule even in polar environments. Upon increasing the donor–acceptor distance, excitation becomes unevenly distributed and, with the longest one, it fully localises on one branch in polar solvents. The influence of the branch length on the propensity of quadrupolar dyes to undergo excited-state symmetry breaking is rationalised in terms of the balance between interbranch coupling and solvation energy.
1 Introduction
The interest for symmetric multi-branched electron donor–acceptor (DA) dyes has considerably increased over the past few years. These compounds are usually characterised by a large two-photon absorption cross-section resulting from a significant change in quadrupole moment upon photoexcitation.1,2 Such property is highly desirable for a broad range of applications, including e.g. two-photon fluorescence imaging,3–6 and two-photon initiated photopolymerisation.7–9 Donor–acceptor–donor systems have also been introduced as promising chromophores for thermally activated delayed fluorescence providing low singlet–triplet gaps along with suitable emission strengths.10,11 Additionally, these multi-branched dyes can be viewed as simple models of organic conjugated polymers and are particularly useful for understanding the electronic excited-state properties of these materials. Directly after optical excitation, the Franck–Condon excited state of these multi-branched dyes has a symmetric electronic structure with the excitation delocalized over the whole molecule. However, in many cases, excited-state symmetry breaking (ES-SB) occurs and leads to an uneven distribution of the excitation in the different branches and, in some cases, to a full localisation on a single branch. Over the last few years, the dynamics of ES-SB as well as the factors that influence this process have been intensively studied both experimentally,12–32 and theoretically.33–38 Theoretical investigations by Terenziani and Painelli suggested that ES-SB is triggered by solvent and structural fluctuations.13,33,34 Experimental studies revealed that the dynamics of ES-SB matches that of solvent motion.16–20 Inertial solvent motion is sufficient to break the symmetry on a sub-picosecond timescale. Further asymmetry is then achieved on a slower timescale via diffusive solvent motion (Fig. 1). Structural disorder or photochemical transformation were shown to be insufficient for ES-SB to take place in non-polar environments.39,40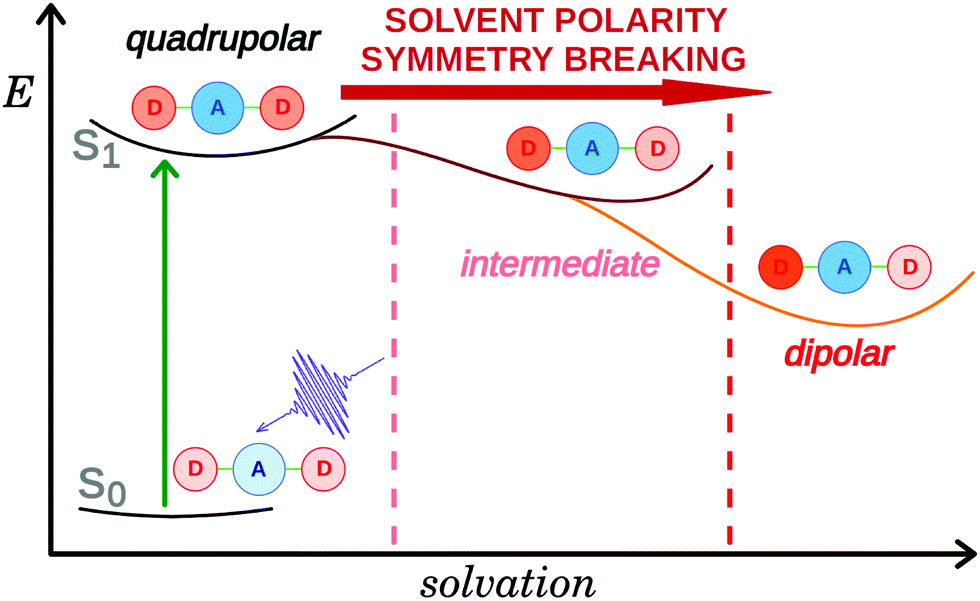 | ||
| Fig. 1 Schematic representation of excited-state symmetry breaking in a D–A–D molecule. | ||
Control on the extent of ES-SB can be achieved by tuning the properties of the local environment of the molecule with solvents of different polarity and H-bonding ability,16–20,25,41 as well as the strength of D and A subunits.30 The latter property is directly linked to the change of quadrupole moment upon excitation, which is also an important tuning parameter for ES-SB. Finally, the electronic coupling between the D–A branches is also a crucial factor for the extent of asymmetry.35 In strongly coupled systems, full localisation of the excitation on one branch is not possible even in the most polar environments.18 From a material point of view, ES-SB can be viewed as the decoherence of a delocalised multipolar exciton and its trapping in a smaller area. Consequently, the knowledge acquired upon investigating of ES-SB in multipolar molecules is also relevant to the understanding of the excited-state properties of conjugated materials.
Here, we investigate the effect of the D–A branch length on ES-SB in a series of quadrupolar D–A–D dyes (Fig. 2). They consist of a 9,10-dicyanoanthracene (DCA) acceptor core substituted in 2 and 6 positions with two Ds that vary from methoxy (Q1) to 4-methoxyphenyl (Q2) and (4-methoxyphenyl)ethynyl (Q3) groups. The excited-state properties of these molecules are investigated by time-resolved vibrational spectroscopy in the mid-IR and electronic transient absorption in the Vis-NIR region and compared with those of the single-branch D–A analogues (D1–3) as well as those of the DCA core, which is itself a quadrupolar molecule. Time-resolved IR (TRIR) detection of ES-SB is usually done by probing vibrational modes localised on the D–A branches. This approach is only possible here with Q3 and the –C≡![[triple bond, length as m-dash]](https://www.rsc.org/images/entities/char_e002.gif) C– stretching mode. However, ES-SB can also be detected by monitoring the appearance of Laporte-forbidden transitions in the transient absorption electronic spectrum.42 TRIR is also used here to probe the –C≡N stretching modes of the DCA sub-units and to understand how the symmetry of the core itself is affected by the presence of one or two D substituents. Our results reveal that the electronic distribution of the DCA core is very sensitive to the environment and to the donor. Moreover, a strong dependence of the extent of ES-SB on the branch length is observed and is discussed in terms of inter-branch coupling and solvation energy.
C– stretching mode. However, ES-SB can also be detected by monitoring the appearance of Laporte-forbidden transitions in the transient absorption electronic spectrum.42 TRIR is also used here to probe the –C≡N stretching modes of the DCA sub-units and to understand how the symmetry of the core itself is affected by the presence of one or two D substituents. Our results reveal that the electronic distribution of the DCA core is very sensitive to the environment and to the donor. Moreover, a strong dependence of the extent of ES-SB on the branch length is observed and is discussed in terms of inter-branch coupling and solvation energy.
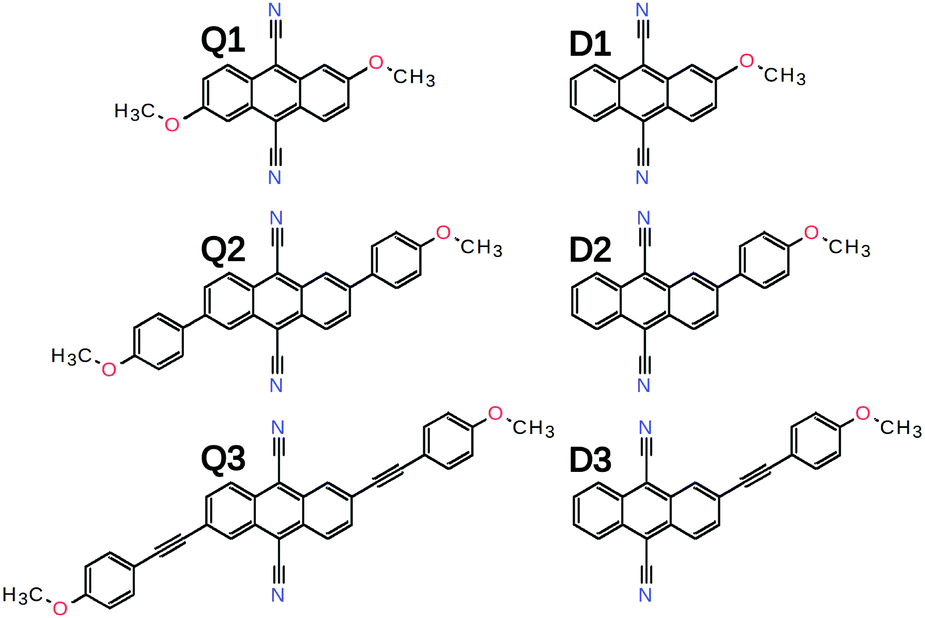 | ||
| Fig. 2 Chemical structure of the quadupolar D–A–D dyes and of their dipolar D–A analogues. | ||
2 Results
The synthesis and basic photophysics of Q1–3 and D1–3 were discussed earlier.43 In brief, the absorption spectra of both Q and D series show no or minor solvatochromism, as expected for centro-symmetric molecules (Q1–3) and for molecules with a negligible permanent dipole moment in the ground state (D1–3). In contrast, their emission spectra exhibit a positive solvatochromism that increases with the length of donor–acceptor branch. For the D–A dyes, this can be simply explained by an excited-state dipole moment that increases with the branch length. For the D–A–D dyes, this points to a dipolar nature of the emissive state in polar solvents, hence to the occurrence of ES-SB. This interpretation is supported by the non-linear polarity dependence of the emission solvatochromism of Q2 and Q3, that points to an excited-state dipole moment that increases with the solvent polarity.It should be noted that DCA itself shows a weak but distinct fluorescence solvatochromism.43 Its origin is not totally clear. It can be explained without invoking ES-SB by a change of dipole–quadrupole interaction upon S1 → S0 transition. However, as discussed in ref. 40, this contribution to the solvatochromism is quantitatively not well described with the point quadrupole approximation. It should rather be viewed as a change of dipole–dipole interaction energy between the solvent and each of the two local dipoles of DCA.
Whereas TRIR measurements proved to be the workhorse for monitoring ES-SB dynamics,16–19,25,30,40,41 electronic transient absorption (TA) spectroscopy was less successful. However, we recently demonstrated that ES-SB can be visualised by monitoring the appearance of excited-state absorption (ESA) bands that are Laporte forbidden in the symmetric quadrupolar state.42 Therefore, the excited-state dynamics of all 6 dyes and DCA were investigated using both TRIR and TA spectroscopies in solvents of varying polarity. The transient data (TRIR-TA) collected in the same solvent were merged, and analysed globally assuming a series of successive exponential steps. The resulting evolution-associated difference spectra (EADS) are presented in Fig. 3, 5 and 6 and S8, S16, S30 (ESI†), whereas the original transient spectra are shown in Fig. S1–S7, S9–S15 and S23–S29 (ESI†).
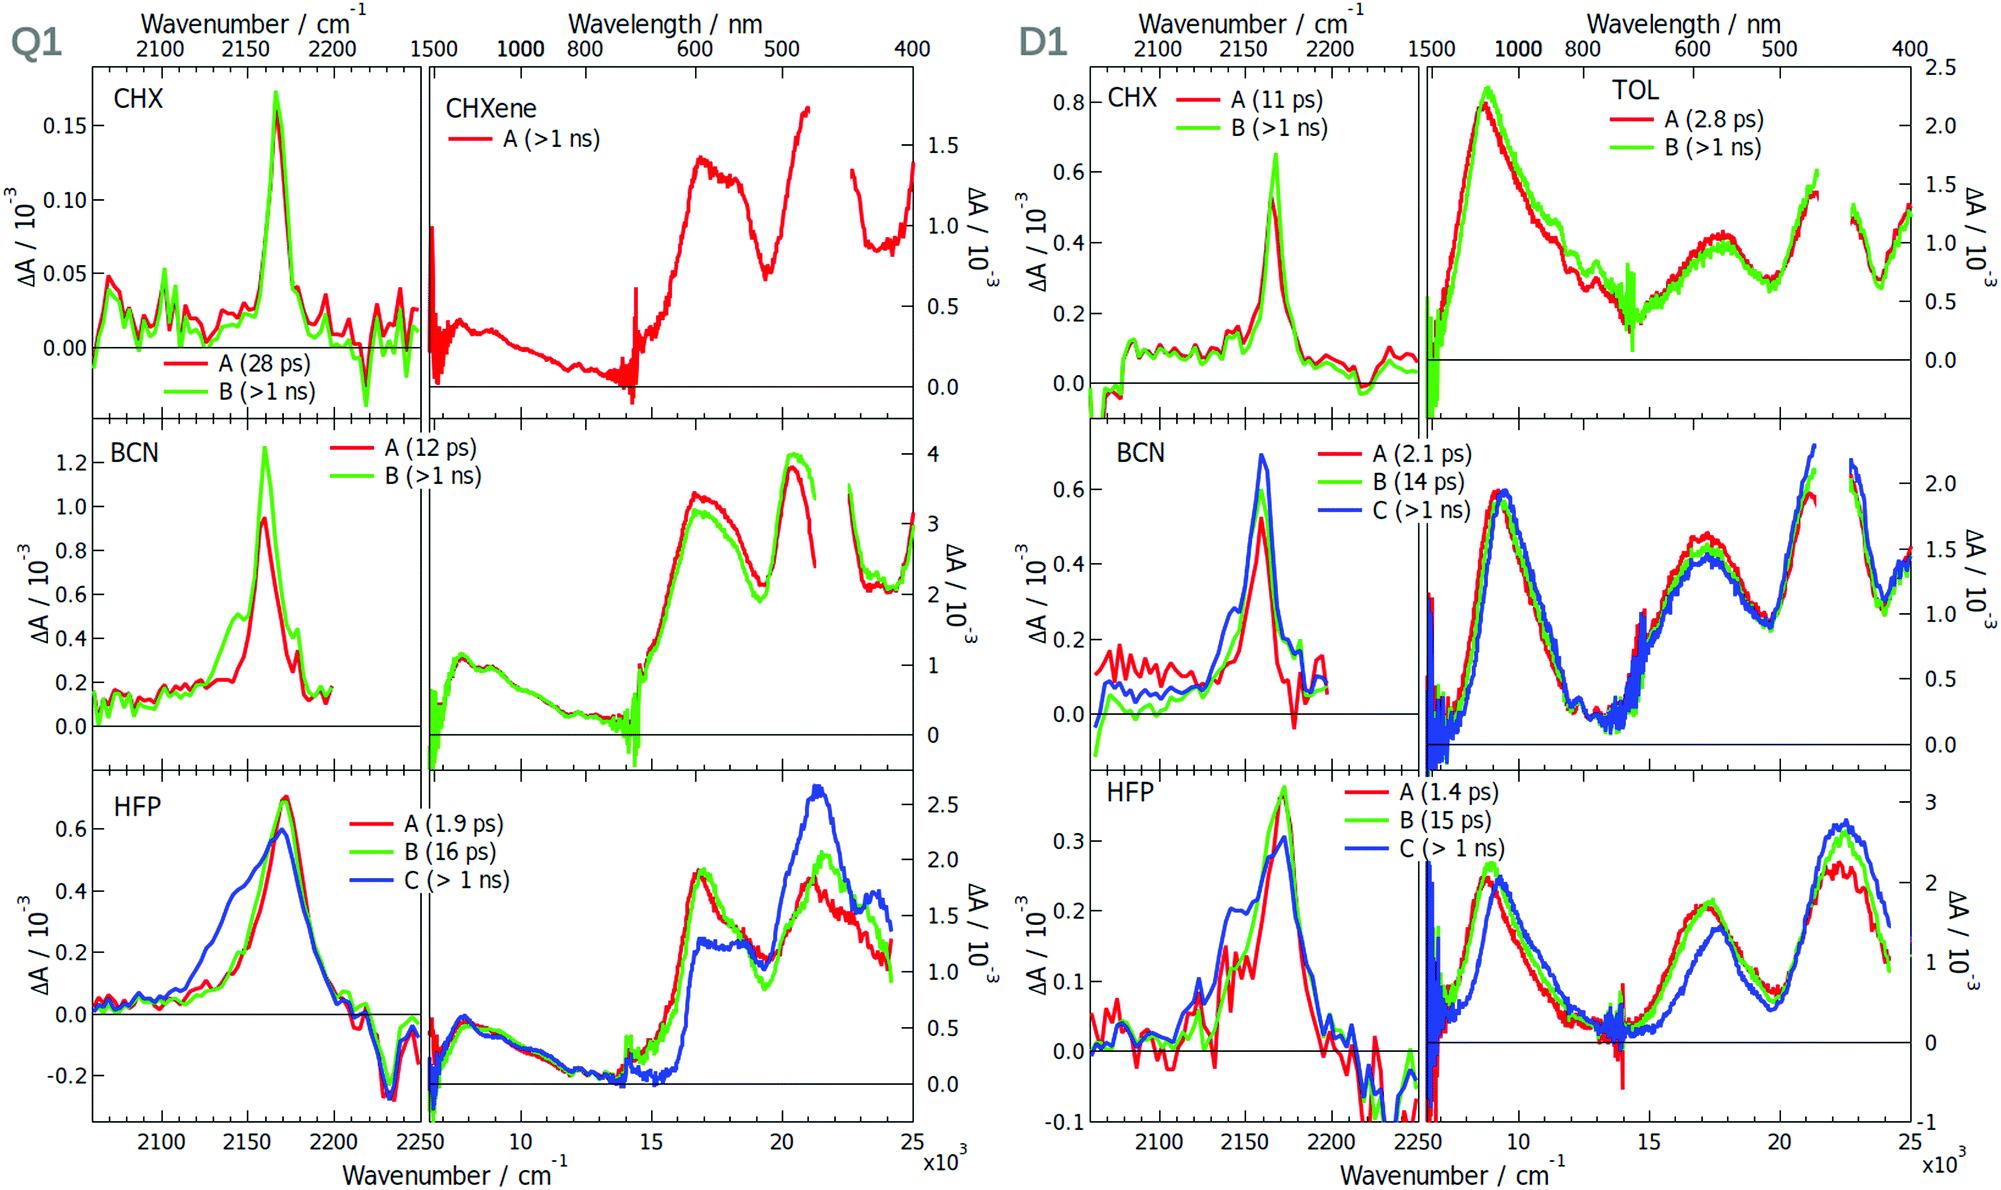 | ||
| Fig. 3 Evolution-associated difference spectra and time constants obtained from a global analysis of the TRIR and electronic TA spectra measured with Q1 (left) and D1 (right) in various solvents assuming a series of successive exponential steps. For BCN and HFP, the analysis was performed on the merged TRIR and electronic TA spectra. (CHX: cyclohexane; CHXene: cyclohexene; TOL: toluene; BCN: benzonitrile; HFP: hexafluoro-2-propanol). | ||
The TRIR spectra measured in the triple bond stretching region with Q1 in the apolar cyclohexane (CHX) exhibit a single ESA band at ∼2165 cm−1, which can be attributed to the antisymmetric –C≡N stretching mode (Fig. 3). As the electronic structure of Q1 is expected to be centrosymmetric in non-polar solvents, the symmetric stretching mode is not IR active. Apart from a small increase that can be attributed to the equilibration of the S1 state, the ESA band decays on the nanosecond time scale, in agreement with the excited-state lifetime. This behaviour is very similar to that found with DCA in CHX (Fig. S8, ESI†). Although D1 is not centrosymmetric, its TRIR spectra in CHX show a single ESA band at ∼2165 cm−1 as well. However, time-dependent density functional theory (TD-DFT) calculations of D1 in the S1 state predict a 7 cm−1 frequency difference between the symmetric and the antisymmetric –C≡N stretching modes and an oscillator strength smaller by a factor 6.3 for the former. The ESA band due to the symmetric –C≡N vibration could, thus, possibly be hidden by the more intense band of the antisymmetric mode. Because of the limited solubility of Q1 in CHX, the electronic TA measurements were performed in cyclohexene (CHXene), which can also be considered as a non-polar solvent. The TA spectra exhibit two intense ESA bands above 15![[thin space (1/6-em)]](https://www.rsc.org/images/entities/char_2009.gif) 000 cm−1 and a weaker one around 7500 cm−1. No significant dynamics can be observed apart that associated with the decay of the S1 state on the ns time scale. These spectra resemble those measured with DCA in CHX (Fig. S8, ESI†). The TA spectra measured with D1 in the low-polar toluene are very similar as well, except for the low-energy ESA, which is at 9000 cm−1 and is the most intense band. Weak spectral dynamics, that is probably due to solvent relaxation,44 can also be observed at early time.
000 cm−1 and a weaker one around 7500 cm−1. No significant dynamics can be observed apart that associated with the decay of the S1 state on the ns time scale. These spectra resemble those measured with DCA in CHX (Fig. S8, ESI†). The TA spectra measured with D1 in the low-polar toluene are very similar as well, except for the low-energy ESA, which is at 9000 cm−1 and is the most intense band. Weak spectral dynamics, that is probably due to solvent relaxation,44 can also be observed at early time.
The strong difference in the intensity of the lowest-energy ESA band between Q1 and D1 is consistent with the lower symmetry of D1. Indeed, the Laporte rule for absorption holds for centrosymmetric molecules like Q1, but is no longer valid for molecules lacking a centre of inversion like D1.45 Based on this, we propose that the intense 9000 cm−1 band of D1 is due to a transition that is forbidden for the centrosymmetric Q1. The band at 7500 cm−1 is either due to this forbidden transition, hence its weaker intensity, or to another transition, that is also present in the spectrum of D1 but hidden under the intense 9000 cm−1 band.
The TRIR spectra measured at early time with Q1 in the polar benzonitrile (BCN) and hexafluoro-2-propanol (HFP) are identical to those in CHX. However, a second ESA band, appearing as a shoulder, rises within a few ps at ∼2140 cm−1. It shifts to lower frequencies and becomes more intense upon going from BCN to the strongly protic HFP. This band can be assigned to the symmetric –CN stretching mode and its appearance points to a loss of symmetry of the two –CN groups. Such a behaviour is also present with DCA, but only in HFP, and is less pronounced (Fig. S30, ESI†). Only a single ESA band is observed in the polar but aprotic acetonitrile (Fig. S16, ESI†).
Surprisingly, the TRIR spectra measured with D1 exhibit a very similar solvent dependence as those of Q1, although this molecule is intrinsically asymmetric. This behaviour could be explained by a charge-transfer character of the S1 state of D1 and a difference of electronic density on the two cyano groups that both increase by going from CHX to BCN and HFP. Although HFP is less polar than BCN, it is highly protic,46 and can form H-bonds with the –CN nitrogen, significantly stabilising a larger charge-transfer character of the excited state.17 The second ESA band rises on a similar time scale as that of solvent relaxation, in agreement with this hypothesis.
The fact that Q1 and D1 exhibit the same TRIR spectra points to a similar asymmetry in the electronic density on the cyano groups. Interestingly, such asymmetry is also present with DCA, but only in HFP, where it is enabled by the H-bond interactions. However, these TRIR results do not tell whether the electronic density on the two donors is symmetric or not.
The electronic TA spectra measured with Q1 and D1 in BCN and HFP are essentially the same as those in CHX. The only difference is some early spectral dynamics, more visible in HFP, that can be associated with solvent relaxation (Tables S2–S8, ESI†).17,30,44 The decay of the ESA band of Q1 at ∼17000 cm−1 and the rise of that at ∼22000 cm−1 can be accounted for by the dynamic Stokes shift of the stimulated emission (Fig. S17, ESI†). As in CHX, the intensity of the lowest-energy electronic ESA band in polar solvents is significantly smaller for Q1 than D1 and does not exhibit any significant dynamics. According to the above hypothesis based on the Laporte rule, this points to a similar electronic density on the two D groups of Q1 even in polar solvents. Solute–solvent interactions are sufficient to slightly break the symmetry of –CN groups but too weak to make the electronic structure of the S1 state of Q1 similar to that of D1. Our results show that the presence of one (D1) or two D groups (Q1) facilitates the loss of symmetry of the two –CN groups, most probably by increasing the electronic density on the DCA core.
The –CN stretching frequency is known to be highly sensitive to electronic density.47–49 The 20–30 cm−1 splitting of the –CN bands found here in HFP is very modest compared the 130 cm−1 band splitting observed with another A–D–A type quadupolar molecule in the same solvent.17,18
These results reveal that the TRIR and electronic TA spectra report on the symmetry of the electronic distribution relatively to different molecular planes of the dye. The –CN stretching band intensities in the TRIR spectra are sensitive to the symmetry with respect to the longitudinal plane (Fig. 4). As the S1 ← S0 transition of these dyes is significantly affected by the donor substituents, the Laporte rule in the electronic TA spectra reflects mainly the symmetry of the electronic distribution along the long D–A–D molecular axis, i.e. with respect to the transversal plane. The electronic TA spectra suggest that Q1 still preserves a symmetry relatively to this transversal plane.
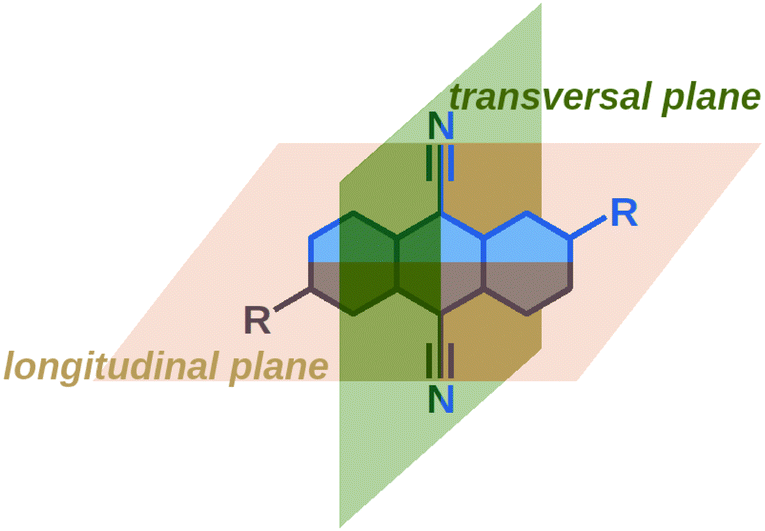 | ||
| Fig. 4 Designation of the longitudinal and transversal planes of 9,10-dicyanoanthracenes. | ||
The EADS obtained after global analysis of the TRIR and electronic TA data obtained with Q2 and D2 are presented in Fig. 5. The TRIR spectra of Q2 in TOL exhibit a single ESA band, which decays on the ns time scale. This contrasts with the spectrum measured with D2 in CHXene, which exhibit two ESA bands split by only 10 cm−1. This points to a symmetry in the electronic density on the –CN groups with Q2 but not with D2. The electronic TA spectra measured with Q2 present a single ESA band around 17000 cm−1 whereas those measured with D2 show additionally an ESA band at 8000 cm−1. The absence of this band with Q2 can be explained by a Laporte-forbidden transition. The TRIR spectra measured with Q2 and D2 in the polar BCN exhibit a single ESA band at ∼2165 cm−1 (Fig. 5). In HFP, a second band rises at 2140 cm−1 with a 12–14 ps time constant. The absence of a second band in BCN is surprising but can be explained by frequency down-shift of the symmetric –CN band by going from TOL to BCN and HFP (see Section S2.3, ESI† for a discussion on the solvent dependence of the band splitting). Consequently, this band shifts from the high-frequency side of the antisymmetric –CN band in low-polar solvents to the other side in the highly protic HFP, and overlaps with it in BCN. The larger width of the ESA band of Q2 in BCN compared to TOL agrees with the presence of two weakly split bands and, thus, suggests asymmetry of the two –CN groups. Such different sensitivities of the symmetric and antisymmetric –CN stretching frequencies to the electronic density was reported previously.49
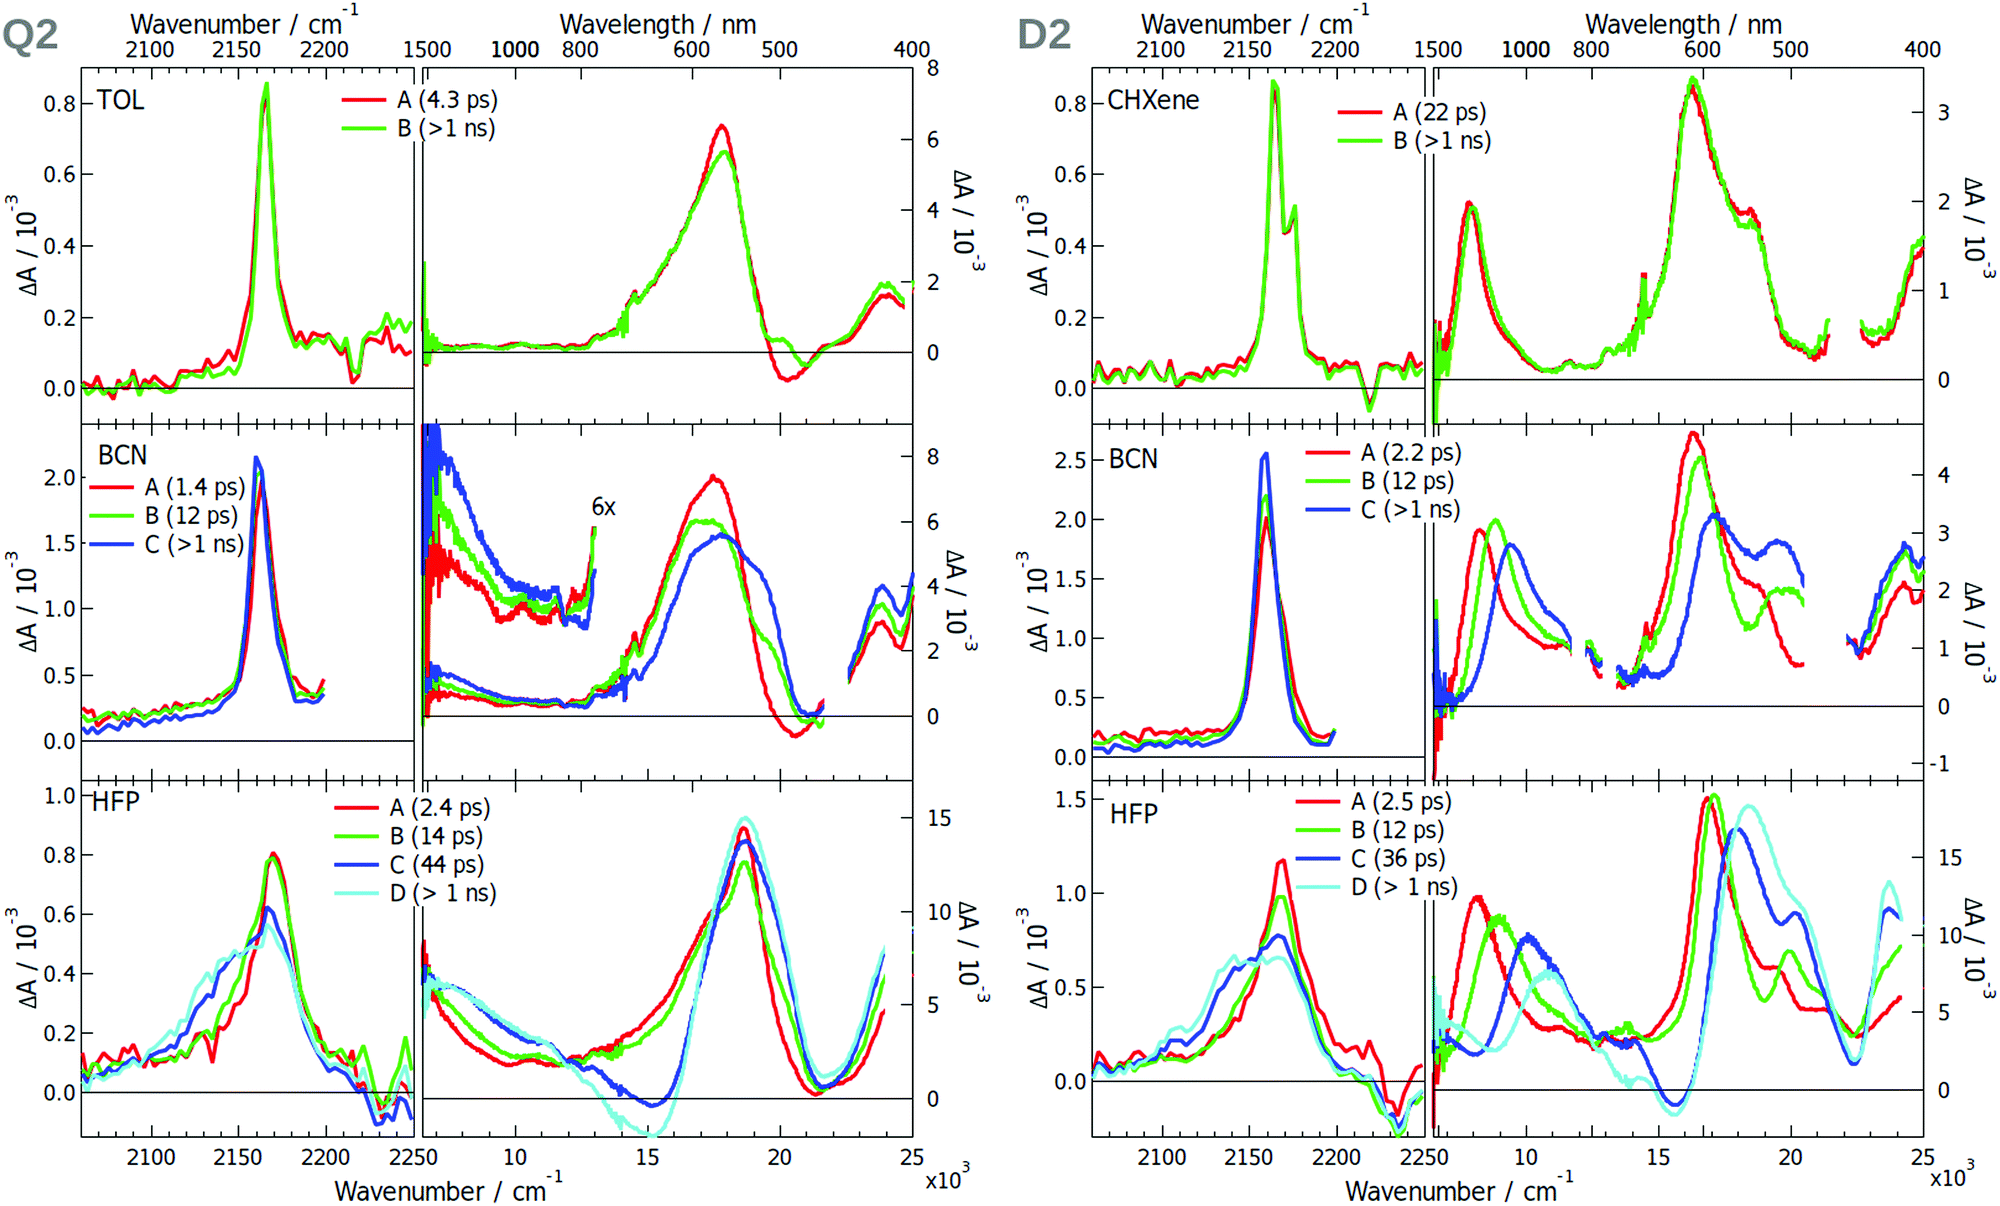 | ||
| Fig. 5 Evolution-associated difference spectra and time constants obtained from a global analysis of the merged TRIR and electronic TA spectra measured with Q2 (left) and D2 (right) in various solvents assuming a series of successive exponential steps.(CHXene: cyclohexene; TOL: toluene; BCN: benzonitrile; HFP: hexafluoro-2-propanol). | ||
The electronic TA data evidence ES-SB in two D–A branches of Q2 in polar solvents. At early time, the spectrum measured in BCN is similar to that in toluene with a single ESA band. However, a second band rises around 7500 cm−1 on a similar time scale as that of solvent motion. Such a rise is also occurring in HFP, although the band is already visible in the early spectra. The appearance of this band, present in the spectrum of D2, is a clear indication of ES-SB and originates from the loss of the centre of inversion of the excited state wavefunction.42 The presence of this band in the early spectra in HFP can be explained by ES-SB occurring through inertial solvent motion already.
The spectral dynamics around 17000 cm−1 visible for both Q2 and D2 can be attributed to the shift of the stimulated emission band due to solvent relaxation (Fig. S19–S20, ESI†). The associated time constants agree with the typical relaxation times of these solvents.17,44
The excited-state dynamics of Q3 and D3 was already partially discussed.42 The EADS obtained from the global analysis of the TRIR and electronic data measured with these dyes in various solvents are presented in Fig. 6. In brief, the TRIR spectra of both compounds are dominated by a single ESA band (ESA1) in CHX that was assigned to the –C≡C– stretching mode. The ESA band due the antisymmetric –CN mode, ESA2, is much weaker and hardly visible with Q3. Only the antisymmetric –C≡C– stretching mode is active with Q3, pointing to a symmetric and quadrupolar S1 state. The intensity in the –CN region is too weak to draw conclusions on the DCA core. The electronic TA spectra measured with Q3 exhibit a relatively weak band at ∼9000 cm−1 with a vibronic structure. Based on quantum chemical calculations, this band was assigned to the symmetry-allowed S3 ← S1 transition.42 These calculations also predicted Laporte-forbidden S2 ← S1 and S4 ← S1 transitions at 6170 and 10900 cm−1, respectively. Comparatively, the TA spectra measured with D3 show an intense ESA band around 7000 cm−1, that most probably corresponds to the S2 ← S1 transition.
Significant spectral dynamics is observed in the TRIR and TA spectra measured with Q3 and D3 in polar solvents. The most important ones visible in the TRIR spectra of Q3 are (i) the splitting of ESA2, pointing to a loss of symmetry relatively to the longitudinal plane, and (ii) the decrease of –C≡C– ESA1 and the concurrent increase of a new band, ESA3, around 2145 cm−1, that was assigned, on the basis of anisotropy measurements, to a –C≡C– stretching vibration. Very similar TRIR spectra are observed with D3, the main difference being the smaller relative intensity of ESA1, in agreement with the presence of a single –C≡C– bond. The decay of ESA1 and the rise of ESA3 in D3 was attributed to the equilibration of the Franck–Condon S1 state, which involves an increase of the charge-transfer character as solvent relaxation takes place, in agreement with the non-linear fluorescence solvatochromism observed with D3. The comparable spectral dynamics found with Q3 also point to an increase of the charge-transfer character of the S1 state. The identical position of ESA3 for Q3 and D3 indicates a –CC– bond with very similar electronic density, hence a dipolar excited state for both molecules. One can thus conclude that ES-SB is taking place with Q3.
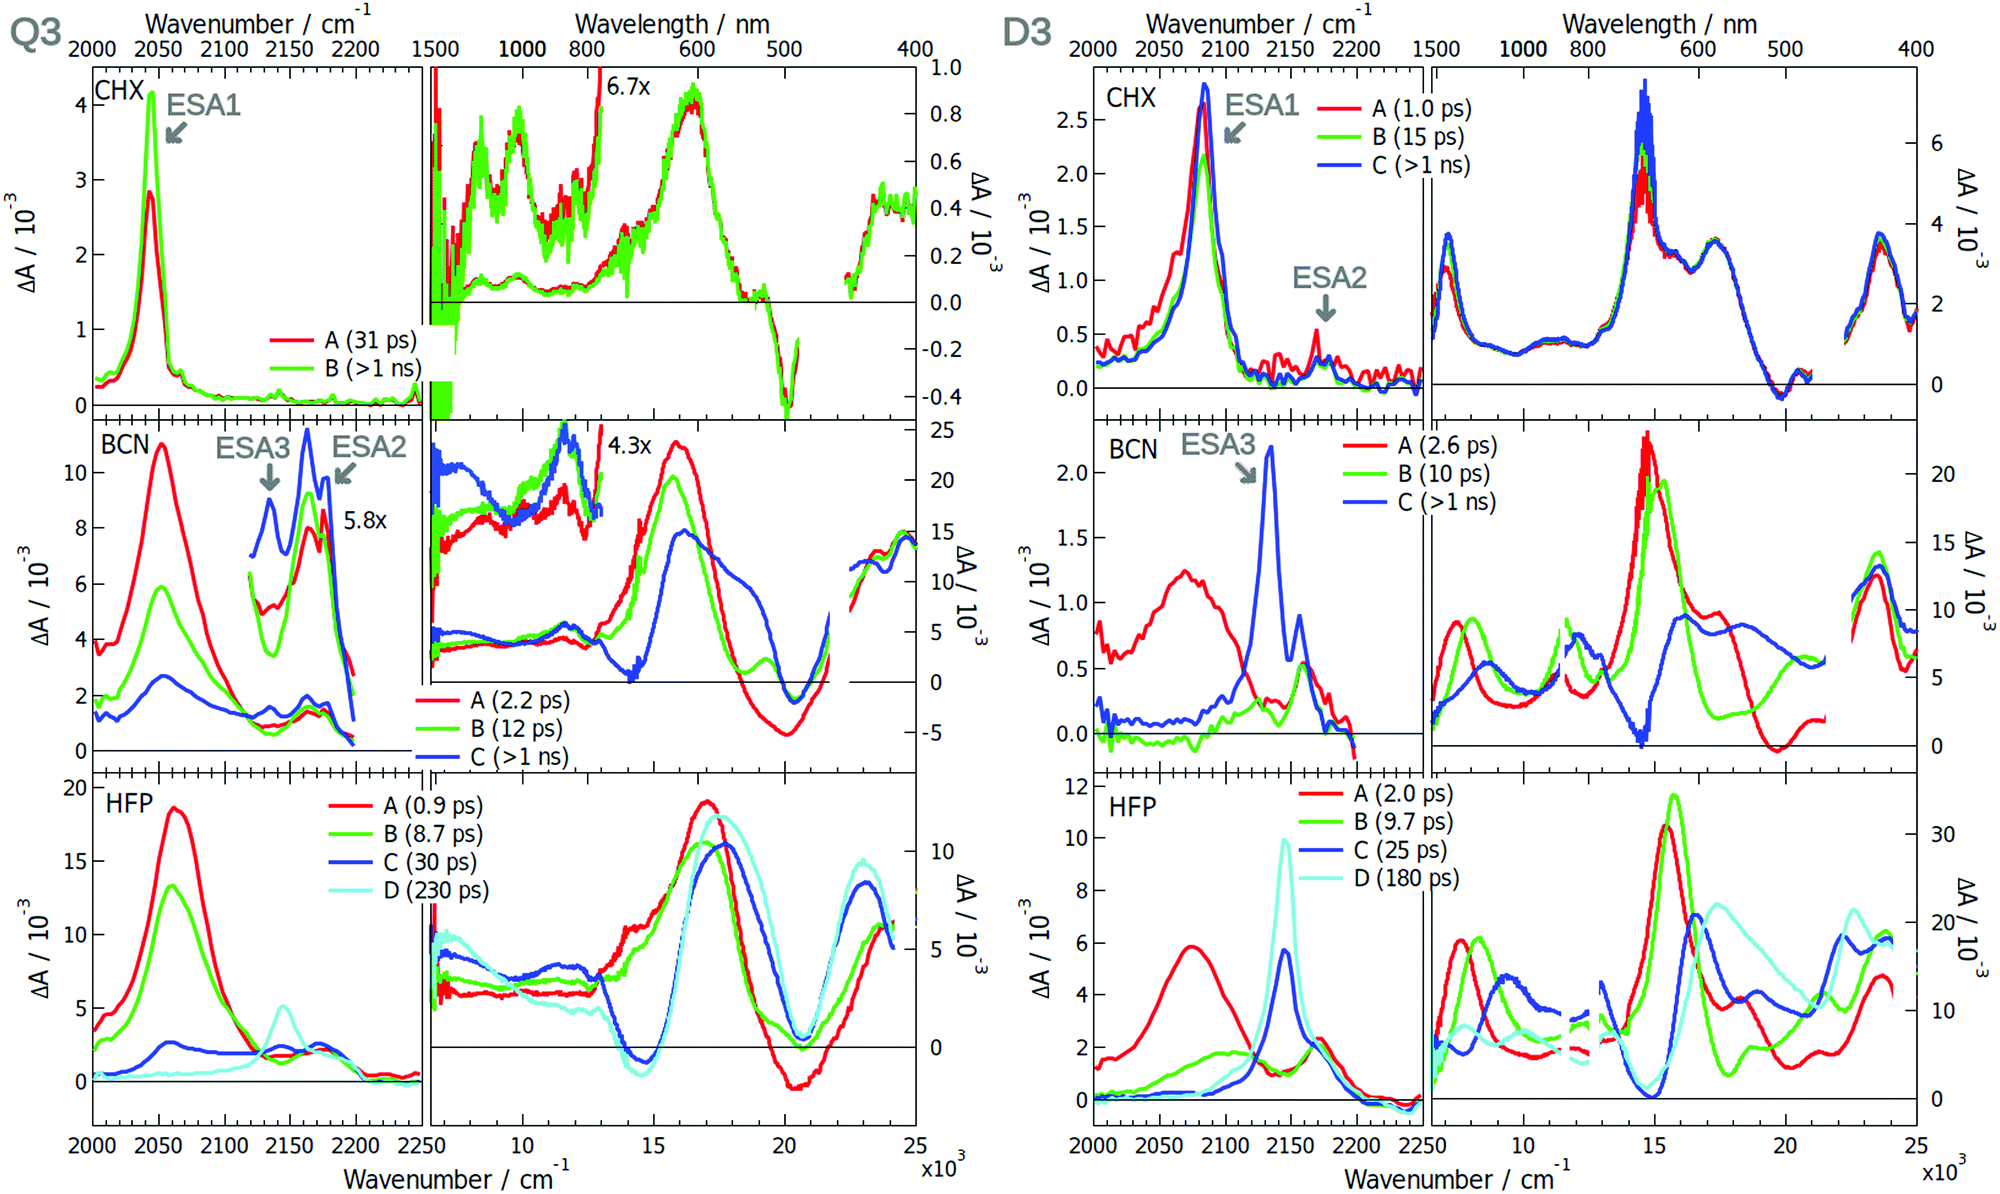 | ||
| Fig. 6 Evolution-associated difference spectra and time constants obtained from a global analysis of the merged TRIR and electronic TA spectra measured with Q3 (left) and D3 (right) in various solvents assuming a series of successive exponential steps.(CHX: cyclohexane; BCN: benzonitrile; HFP: hexafluoro-2-propanol). | ||
Unambiguous evidence of ES-SB in Q3 is given by the TA spectra. Whereas they are similar to those in CHX at early time, two bands rise around 7000 and 11500 cm−1 within a few tens of ps. According to quantum-chemical calculations, they can be assigned to the above-mentioned Laporte-forbidden S2 ← S1 and S4 ← S1 transitions, that become allowed upon ES-SB.42 By contrast, no new rising bands are observed with D3, the only dynamics being associated with spectral shifts on the time scale of solvent relaxation (Fig. S21 and S22, ESI†). The time constants obtained from global analysis suggest solvent-controlled excited-state dynamics for both dyes: relaxation to a state with enhanced charge-transfer character with D3 and ES-SB with Q3.
3 Discussion
The spectroscopic results can be summarised as follows: the electronic structure of all three excited D–A–D dyes remains symmetric in non-polar and weakly polar solvents. In polar solvents, the data reveal a correlation between propensity of the initially quadrupolar excited state to undergo symmetry breaking and the D–A branch length. In Q1, the electron donor is directly linked to the DCA core, resulting in the shortest branch length of all dyes. The strong similarity of the transient spectra of Q1 and DCA points to a modest effect of the methoxy donors on the symmetry of the electronic structure. Apart from a relatively small asymmetry of the cyano groups, that is also present in DCA but to a smaller extent, the excited state of Q1 remains mostly symmetric even in highly polar solvents. The donor branches (4-methoxyphenyl groups) of Q2 are longer and the electronic distribution of its S1 state exhibit a higher sensitivity to the polarity of the environment. In BCN, the initially symmetry-forbidden S2 ← S1 transition becomes allowed as solvation energy favours an uneven distribution of the excitation on the two D–A branches, a so-called 'intermediate' state (Fig. 1). In the highly protic HFP, the intensity of the S2 ← S1 band is similar to that observed with D2, pointing to a more dipolar character of the excited state. Q3 is characterised by the longest D–A branches as well as by the highest sensitivity of its excited state to the polarity of the environment. In BCN, the Laporte-forbidden transitions become visible in the electronic TA spectra upon solvent relaxation, indicating an electronic structure practically identical to that observed with D3 in polar solvents.This influence of the D–A branch length on the tendency to undergo ES-SB can be understood by considering a simple model where the D and A groups are identical and only their separation differs. This D–A distance, dDA, affects both the interbranch coupling energy, Vib, and the dipolar solvation energy, Es. The former favours a symmetric distribution of the excitation over both branches, whereas the latter stabilises a dipolar state with the excitation localised on a single D–A branch. Therefore, the energy difference between the dipolar symmetry-broken state, and the symmetric quadrupolar excited state, ΔESB, can be approximated to (Fig. 7):
| ΔESB = ED − EQ ≈ Es,D − Es,Q − Vib = ΔEs − Vib, | (1) |
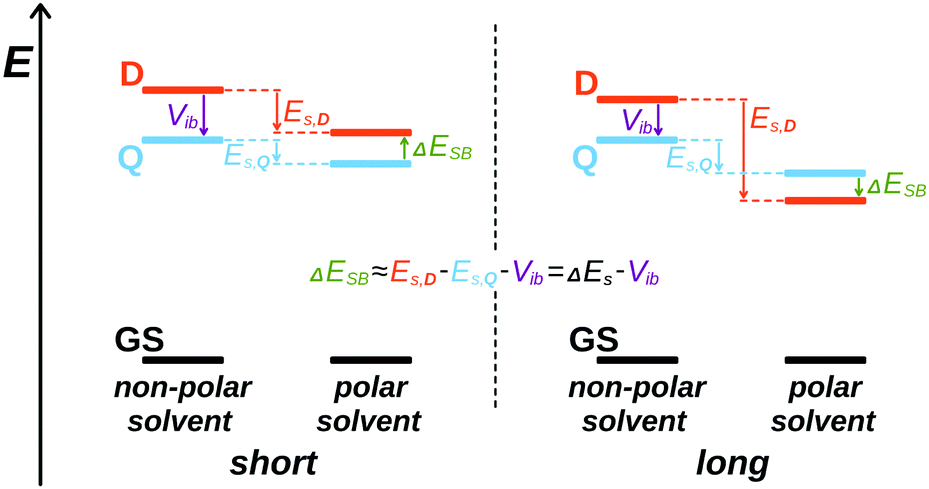 | ||
| Fig. 7 Schematic illustration of the influence of branch length on the relative magnitude of the excitonic interaction and solvation energy and on the relative energies of the symmetric (Q) and symmetry-broken (D) excited states. | ||
The inter-branch coupling, Vib, can be estimated from the Kasha's excitonic model,50 assuming that each D–A branch is an individual chromophore with a transition dipole of magnitude MDA:
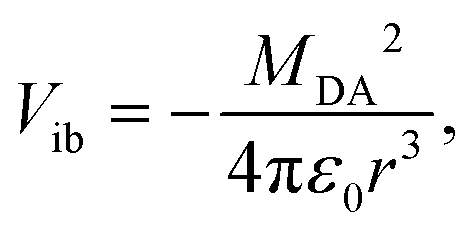 | (2) |
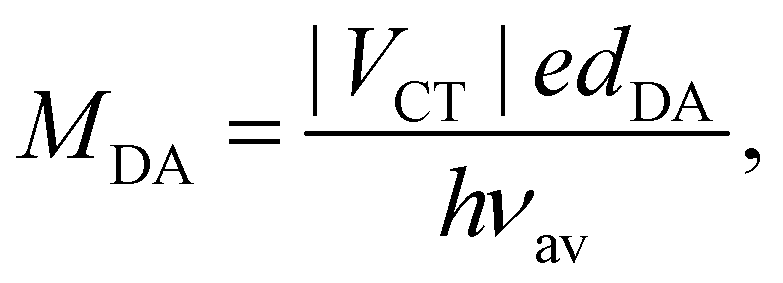 | (3) |
 | (4) |
The coupling VCT is closely related to the electronic coupling between the A and D subunits and is generally assumed to decay exponentially with the D–A distance.54,55 Consequently, increasing the branch length when going from Q1 to Q3 is predicted to be accompanied by a significant diminution of Vib.
For centrosymmetric molecules like Q1–3, |Vib| corresponds to half the energy difference between the first two-photon allowed transition and the first one-photon allowed transition from the ground state.12 In the Kasha's model, this energy difference corresponds to the Davidov excitonic splitting.50 The |Vib| values estimated from the one- and two-photon absorption spectra reported in ref. 43 are listed in Table 1. They confirm a decrease of the inter-branch coupling by going from Q1 to Q3. According to quantum-chemical calculations, the first one- and two- photon absorption bands correspond to the S1 ← S0 and S3 ← S0 transitions, respectively.42,43Table 1 reveals that, although the Vib values deduced from these calculated excitation energies are larger than those determined from the measured spectra, they also decrease with increasing the D–A branch length.
![[small nu, Greek, tilde]](https://www.rsc.org/images/entities/i_char_e0e1.gif) TPA: wavenumber of the first two-photon allowed absorption band; OPA: wavenumber of the first one-photon allowed absorption band; ES1 and ES3: energies of the first and third excited states taken from ref. 43
TPA: wavenumber of the first two-photon allowed absorption band; OPA: wavenumber of the first one-photon allowed absorption band; ES1 and ES3: energies of the first and third excited states taken from ref. 43
| Q1 | Q2 | Q3 | |
|---|---|---|---|
| |Vib| ≈ (TPA − OPA)/2 |
3600 | 3000 | 2200 |
| |Vib| ≈ (ES3 − ES1)/2 | 4700 | 3000 | 2700 |
| −Es,D(BCN) | 775 | 2260 | 3275 |
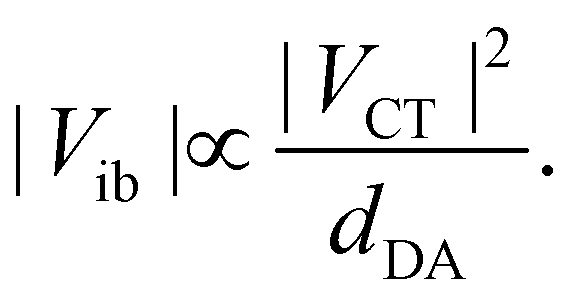
On the other hand, the increase of solvation energy upon ES-SB can be estimated within the dielectric continuum model and the point dipole approximation (Section S3, ESI†):56
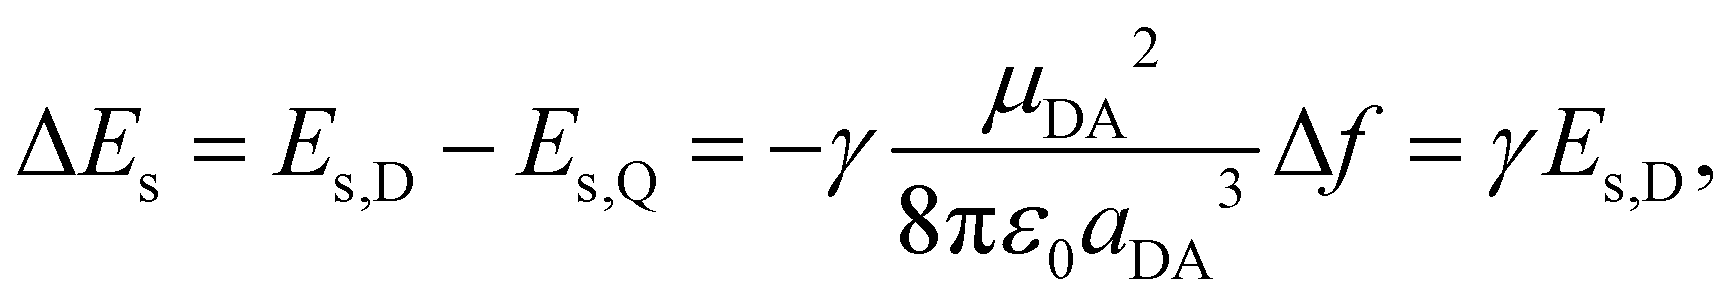 | (5) |
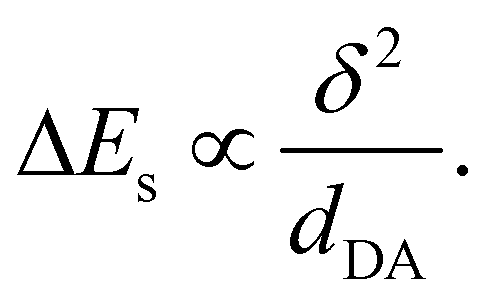
As μDA = δedDA, where δ is the amount of charge transfer in the excited state, and aDA = dDA/2, the gain of solvation energy upon ES-SB is predicted to vary with the branch length as:
 | (6) |
The amount of charge transfer, δ, can be related the electronic coupling, VCT:53
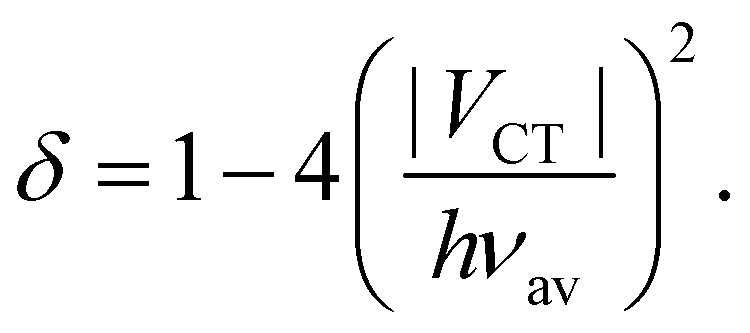 | (7) |
Indeed, full charge transfer, δ = 1, requires the D and A subunits to be totally decoupled.
Comparison of eqn (4) and (6) indicates that both Vib and ΔEs scale with dDA−1. However, their dependence on VCT are opposite: Vib increases with VCT, whereas ΔEs decreases. As VCT decays exponentially with dDA, a lengthening the D–A branches should result in a diminution of Vib, as observed (Table 1), and in an augmentation of ΔEs.
The estimated solvation energies of the dipolar excited state of Q1–3 in BCN, Es,D(BCN), are listed in Table 1. They were calculated using the results of the solvatochromism study reported in ref.43 by taking half of the shift of the fluorescence band of D1–3 upon changing the dielectric constant from the CHX to the BCN value. This table points to a substantial increase of the gain of solvation energy upon ES-SB when going from Q1 to Q3. This is in good agreement with the predictions based on eqn (5)–(7).
The estimated inter-branch coupling and solvation energies listed in Table 1 agree well with the experimental results. For Q1, the gain of solvation energy in polar solvents upon ES-SB is clearly too small to compensate for the loss of excitonic stabilisation. Therefore, the excited state of Q1 is predicted to be symmetric even in the polar BCN, as observed (Fig. 7, left). For Q2, Vib and ΔEs in BCN are of similar order of magnitude. This is also consistent with the results that point to a partial localisation of the excitation in BCN (intermediate state). Finally, for Q3, the gain of solvation energy in BCN can compete with the inter-branch coupling, pointing to a symmetry-broken electronic structure in this solvent, as found experimentally (Fig. 7, right).
These results reveal a clear correlation between the propensity of quadrupolar D–A–D molecules to undergo ES-SB and the length of the D–A branches. According to the above simple model, this dependence can be traced to the electronic coupling, VCT, which decreases exponentially with the D–A branch length. A decrease in VCT results on the one hand in a decrease of the transition dipole moment, MDA, hence of the inter-branch coupling, and, on the other hand, in an increase of excited-state dipole moment of a single branch, μDA, and thus of the solvation energy.
4 Conclusions
Excited-state symmetry breaking was investigated in quadrupolar D–A–D dyes with a 9,10-dicyanoanthracene acceptor core and methoxy donors, allowing for an investigation of the influence of the D–A branch length on the propensity to undergo ES-SB. The latter was monitored using both time-resolved infrared spectroscopy in the triple bond stretching region and electronic transient absorption spectroscopy in the Vis-NIR region. ES-SB in these dyes was only found in polar solvents with the medium and longest D–A branches. With the shortest branches, the excited state was found to remain symmetric even in highly polar solvents. These results were rationalised using a simple model where, for ES-SB to be operative, the loss of excitonic interaction, or inter-branch coupling, must be compensated by a gain in solvation energy. Excitonic interaction and solvation energy show an opposite dependence on the D–A branch length, the former decreasing with increasing length and the latter increasing. These dependences can be attributed to the electronic coupling between the D and A subunits, which decays exponentially with distance.The branch length dependence found here should be quite general for multipolar dyes. Additionally to the branch length, further tuning can also be achieved by variation of the D and A strength. For a given branch length, a stronger donor should result in a smaller electronic coupling between D and A, and, thus, in a smaller inter-branch coupling. As a consequence, ES-SB in polar solvents could occur already with short D–A branches. These results should facilitate the design of new dyes where ES-SB is desired or not, depending on the foreseen application.
Conflicts of interest
There are no conflicts to declare.Acknowledgements
The authors thank the Swiss National Science Foundation (grant 200020-184607) and the University of Geneva for financial support.Notes and references
- M. Albota, D. Beljonne, J.-L. Brédas, J. E. Ehrlich, J.-Y. Fu, A. A. Heikal, S. E. Hess, T. Kogej, M. D. Levin, S. R. Marder, D. McCord-Maughon, J. W. Perry, H. Röckel, M. Rumi, G. Subramaniam, W. W. Webb, X.-L. Wu and C. Xu, Science, 1998, 281, 1653–1656 CrossRef CAS PubMed
.
- M. Pawlicki, H. Collins, R. Denning and H. Anderson, Angew. Chem., Int. Ed., 2009, 48, 3244–3266 CrossRef CAS
- W. Denk, J. Strickler and W. Webb, Science, 1990, 248, 73–76 CrossRef CAS PubMed
- P. Mahou, J. Vermot, E. Beaurepaire and W. Supatto, Nat. Methods, 2014, 11, 600–601 CrossRef CAS PubMed
- W. Zong, R. Wu, M. Li, Y. Hu, Y. Li, J. Li, H. Rong, H. Wu, Y. Xu, Y. Lu, H. Jia, M. Fan, Z. Zhou, Y. Zhang, A. Wang, L. Chen and H. Cheng, Nat. Methods, 2017, 14, 713–719 CrossRef CAS
- O. Varnavski and T. Goodson, J. Am. Chem. Soc., 2020, 142, 12966–12975 CrossRef CAS PubMed
- Q. Geng, D. Wang, P. Chen and S.-C. Chen, Nat. Commun., 2019, 10, 2179 CrossRef PubMed
- C. L. Lay, C. S. L. Koh, Y. H. Lee, G. C. Phan-Quang, H. Y. F. Sim, S. X. Leong, X. Han, I. Y. Phang and X. Y. Ling, ACS Appl. Mater. Interfaces, 2020, 12, 10061–10079 CrossRef PubMed
- D.-L. Versace, G. Moran, M. Belqat, A. Spangenberg, R. Méallet-Renault, S. Abbad-Andaloussi, V. Brezová and J.-P. Malval, ACS Appl. Mater. Interfaces, 2020, 12, 5050–5057 CrossRef CAS PubMed
- Q. Zhang, H. Kuwabara, W. J. Potscavage, S. Huang, Y. Hatae, T. Shibata and C. Adachi, J. Am. Chem. Soc., 2014, 136, 18070–18081 CrossRef CAS PubMed
- S. Montanaro, A. J. Gillett, S. Feldmann, E. W. Evans, F. Plasser, R. H. Friend and I. A. Wright, Phys. Chem. Chem. Phys., 2019, 21, 10580–10586 RSC
- C. Katan, F. Terenziani, O. Mongin, M. H. V. Werts, L. Porrès, T. Pons, J. Mertz, S. Tretiak and M. Blanchard-Desce, J. Phys. Chem. A, 2005, 109, 3024–3037 CrossRef CAS PubMed
- F. Terenziani, O. V. Przhonska, S. Webster, L. A. Padilha, Y. L. Slominsky, I. G. Davydenko, A. O. Gerasov, Y. P. Kovtun, M. P. Shandura, A. D. Kachkovski, D. J. Hagan, E. W. Van Stryland and A. Painelli, J. Phys. Chem. Lett., 2010, 1, 1800–1804 CrossRef CAS
- B. Carlotti, E. Benassi, A. Spalletti, C. G. Fortuna, F. Elisei and V. Barone, Phys. Chem. Chem. Phys., 2014, 16, 13984–13994 RSC
- B. Carlotti, E. Benassi, C. G. Fortuna, V. Barone, A. Spalletti and F. Elisei, ChemPhysChem, 2016, 17, 136–146 CrossRef CAS PubMed
- B. Dereka, A. Rosspeintner, Z. Li, R. Liska and E. Vauthey, J. Am. Chem. Soc., 2016, 138, 4643–4649 CrossRef CAS PubMed
- B. Dereka, A. Rosspeintner, M. Krzeszewski, D. T. Gryko and E. Vauthey, Angew. Chem., Int. Ed., 2016, 55, 15624–15628 CrossRef CAS PubMed
- B. Dereka and E. Vauthey, J. Phys. Chem. Lett., 2017, 8, 3927–3932 CrossRef CAS PubMed
- B. Dereka, A. Rosspeintner, R. Stezycki, C. Ruckebusch, D. T. Gryko and E. Vauthey, J. Phys. Chem. Lett., 2017, 8, 6029–6034 CrossRef CAS PubMed
- J. S. Beckwith, A. Rosspeintner, G. Licari, M. Lunzer, B. Holzer, J. Fröhlich and E. Vauthey, J. Phys. Chem. Lett., 2017, 8, 5878–5883 CrossRef CAS PubMed
- M. Caselli, D. Vanossi, M. Buffagni, M. Imperato, L. Pigani, A. Mucci and F. Parenti, ChemPlusChem, 2019, 84, 1314–1323 CrossRef CAS PubMed
- T. M. Cooper, J. E. Haley, D. M. Krein, A. R. Burke, J. E. Slagle, A. Mikhailov and A. Rebane, J. Phys. Chem. A, 2017, 121, 5442–5449 CrossRef CAS PubMed
- N. Dozova, L. Ventelon, G. Clermont, M. Blanchard-Desce and P. Plaza, Chem. Phys. Lett., 2016, 664, 56–62 CrossRef CAS
- L. G. Lukasiewicz, H. G. Ryu, A. Mikhaylov, C. Azarias, M. Banasiewicz, B. Kozankiewicz, K. H. Ahn, D. Jacquemin, A. Rebane and D. T. Gryko, Chem. – Asian J., 2017, 12, 1736–1748 CrossRef CAS PubMed
-
B. Dereka, PhD thesis, University of Geneva, 2018
- W. Kim, J. Sung, M. Grzybowski, D. T. Gryko and D. Kim, J. Phys. Chem. Lett., 2016, 7, 3060–3066 CrossRef CAS PubMed
- T. Kim, J. Kim, H. Mori, S. Park, M. Lim, A. Osuka and D. Kim, Phys. Chem. Chem. Phys., 2017, 19, 13970–13977 RSC
- T. Kim, W. Kim, H. Mori, A. Osuka and D. Kim, J. Phys. Chem. C, 2018, 122, 19409–19415 CrossRef CAS
- M. Mitsui, Y. Takakura, Y. Niihori, M. Nakamoto, Y. Fujiwara and K. Kobayashi, J. Phys. Chem. C, 2019, 123, 14564–14572 CrossRef CAS
- Z. Szakács, M. Tasior, D. T. Gryko and E. Vauthey, ChemPhysChem, 2020, 21, 1718–1730 CrossRef PubMed
- L. G. Lukasiewicz, M. Rammo, C. Stark, M. Krzeszewski, D. Jacquemin, A. Rebane and D. T. Gryko, ChemPhotoChem, 2020, 4, 508–519 CrossRef CAS
- Y. Rout, A. Cesaretti, E. Ferraguzzi, B. Carlotti and R. Misra, J. Phys. Chem. C, 2020, 124, 24631–24643 CrossRef CAS
- F. Terenziani, A. Painelli, C. Katan, M. Charlot and M. Blanchard-Desce, J. Am. Chem. Soc., 2006, 128, 15742–15755 CrossRef CAS PubMed
- F. Terenziani, C. Sissa and A. Painelli, J. Phys. Chem. B, 2008, 112, 5079–5087 CrossRef CAS PubMed
- A. I. Ivanov, B. Dereka and E. Vauthey, J. Chem. Phys., 2017, 146, 164306 CrossRef PubMed
- A. I. Ivanov, J. Phys. Chem. C, 2018, 122, 29165–29172 CrossRef CAS
- A. I. Ivanov and V. G. Tkachev, J. Chem. Phys., 2019, 151, 124309 CrossRef PubMed
- A. E. Nazarov, A. I. Ivanov and E. Vauthey, J. Phys. Chem. C, 2020, 124, 2357–2369 CrossRef CAS
- M. Söderberg, B. Dereka, A. Marrocchi, B. Carlotti and E. Vauthey, J. Phys. Chem. Lett., 2019, 10, 2944–2948 CrossRef
- B. Dereka, D. Svechkarev, A. Rosspeintner, A. Aster, M. Lunzer, R. Liska, A. M. Mohs and E. Vauthey, Nat. Commun., 2020, 11, 1925 CrossRef CAS
- B. Dereka, J. Helbing and E. Vauthey, Angew. Chem., Int. Ed., 2018, 57, 17014–17018 CrossRef CAS PubMed
- Z. Szakács and E. Vauthey, J. Phys. Chem. Lett., 2021, 12, 4067–4071 CrossRef PubMed
- F. Glöcklhofer, A. Rosspeintner, P. Pasitsuparoad, S. Eder, J. Fröhlich, G. Angulo, E. Vauthey and F. Plasser, Mol. Syst. Des. Eng., 2019, 4, 951–961 RSC
- M. L. Horng, J. A. Gardecki, A. Papazyan and M. Maroncelli, J. Phys. Chem., 1995, 99, 17311–17337 CrossRef CAS
- O. Laporte and W. F. Meggers, J. Opt. Soc. Am., 1925, 11, 459 CrossRef CAS
- Y. Marcus, Chem. Soc. Rev., 1993, 22, 409–416 RSC
- M. G. Maienschein-Cline and C. H. Londergan, J. Phys. Chem. A, 2007, 111, 10020–10025 CrossRef CAS
- S. G. Boxer, J. Phys. Chem. B, 2009, 113, 2972–2983 CrossRef CAS PubMed
- M. Koch, G. Licari and E. Vauthey, J. Phys. Chem. B, 2015, 119, 11846–11857 CrossRef CAS PubMed
-
M. Kasha, Spectroscopy of the Excited State, Springer, US, 1976, pp. 337–363 Search PubMed
- N. S. Hush, Electrochim. Acta, 1968, 13, 1005–1023 CrossRef CAS
- I. R. Gould, R. H. Young, L. J. Mueller and S. Farid, J. Am. Chem. Soc., 1994, 116, 8176–8187 CrossRef CAS
- B. S. Brunschwig, C. Creutz and N. Sutin, Chem. Soc. Rev., 2002, 31, 168–184 RSC
- R. A. Marcus and N. Sutin, Biochim. Biophys. Acta, 1985, 811, 265–322 CrossRef CAS
- B. Albinsson and J. Martensson, J. Photochem. Photobiol., C, 2008, 9, 138–155 CrossRef CAS
-
P. Suppan and N. Ghoneim, Solvatochromism, The Royal Society of Chemistry, Cambridge, 1997 Search PubMed
Footnote |
| † Electronic supplementary information (ESI) available: Experimental details, global analysis, additional TRIR and TA spectra, estimation of the dipolar solvation energy. All data can be downloaded from https://doi.org/10.26037/yareta:wwbjreriijev5hqfjgp6s7fxba. See DOI: 10.1039/d1cp02376d |
| This journal is © the Owner Societies 2021 |