
 Open Access Article
 This Open Access Article is licensed under a Creative Commons Attribution-Non Commercial 3.0 Unported Licence
Role of low-energy electrons in the solubility switch of Zn-based oxocluster photoresist for extreme ultraviolet lithography†
Markus
Rohdenburg
 ab,
Neha
Thakur
c,
René
Cartaya
a,
Sonia
Castellanos
c and
Petra
Swiderek
*a
ab,
Neha
Thakur
c,
René
Cartaya
a,
Sonia
Castellanos
c and
Petra
Swiderek
*a
aInstitute for Applied and Physical Chemistry (IAPC), Fachbereich 2 (Chemie/Biologie), University of Bremen, Leobener Str. 5 (NW2), 28359 Bremen, Germany. E-mail: swiderek@uni-bremen.de
bWilhelm-Ostwald-Institute for Physical and Theoretical Chemistry (WOI), Leipzig University, Linnéstr. 2, 04103 Leipzig, Germany
cAdvanced Research Center for Nanolithography, Science Park 106, Amsterdam 1098 XG, The Netherlands
First published on 29th July 2021
Abstract
The electron-induced chemistry of a resist material for extreme ultraviolet lithography (EUVL) consisting of Zn oxoclusters with methacrylate (MA) and trifluoroacetate (TFA) ligands (Zn(MA)(TFA)) has been studied. Electron energies of 80 eV and 20 eV mimic the effect of photoelectrons released by the absorption of EUV photons and low-energy secondary electrons (LESEs) produced by those photoelectrons. The chemical conversion of the resist is studied by mass spectrometry to monitor the volatile species that desorb during electron irradiation, combined with reflection absorption infrared spectra (RAIRS) measured before and after irradiation. The observed reactions are closely related to those initiated upon EUV absorption. Also, the conversion of the Zn(MA)(TFA) resist layer that is required in EUVL is achieved by a similar energy input upon electron irradiation. The dominant component of the desorbing gas is CO2, but CO detection also suggests Zn oxide formation during electron irradiation. In contrast, species deriving from the ligand side chains predominantly remain within the resist layer. RAIRS gives direct evidence that, during electron irradiation, C![[double bond, length as m-dash]](https://www.rsc.org/images/entities/char_e001.gif) C bonds of the MA ligands are more rapidly consumed than the carboxylate groups. This supports that chain reactions occur and contribute to the solubility switch in the resist in EUVL. Remarkably, 20 eV electrons still evolve roughly 50% of the amount of the gas that is observed at 80 eV for the same electron dose. The present results thus provide complementary and new insight to the EUV-induced chemistry in the Zn(MA)(TFA) resist and point towards the important contribution of low-energy electrons therein.
C bonds of the MA ligands are more rapidly consumed than the carboxylate groups. This supports that chain reactions occur and contribute to the solubility switch in the resist in EUVL. Remarkably, 20 eV electrons still evolve roughly 50% of the amount of the gas that is observed at 80 eV for the same electron dose. The present results thus provide complementary and new insight to the EUV-induced chemistry in the Zn(MA)(TFA) resist and point towards the important contribution of low-energy electrons therein.
1. Introduction
Extreme ultraviolet lithography (EUVL, 13.5 nm) is the state-of-the-art tool for the fabrication of nanoscale devices and the successor of deep ultraviolet (DUV, 193 nm) lithography in the semiconductor industry.1,2 EUVL aims at pushing the limit of the achievable nanostructure sizes down to the sub-10 nm regime owing to its smaller wavelength.3 However, to advance EUVL applications, tailored novel materials are currently required.4,5 This is crucial because the well-known polymer-based photoresists for conventional DUV lithography have low absorption cross sections for EUV photons6 and the size of the polymer molecules exceeds the targeted structure sizes. Hence, the incorporation of elements (usually metals) into the resist material that can provide higher EUV absorption and a decrease in the size of the resist components is desired. Therefore, in recent years, metal oxoclusters as a class of inorganic–organic hybrid materials have emerged as potential novel photoresists for EUVL applications.6–8 In addition to their enhanced EUV absorption, their small and well-defined size is expected to help in the reduction of variations in the nanopattern features typically measured as line-width or line-edge roughness.4,6A detailed understanding of the chemistry that occurs upon EUV irradiation and leads to the solubility switch of the EUV resist material is needed to design efficient novel EUVL resists.8–10 Compared to conventional DUV (193 nm) lithography, the chemical processes underlying EUVL are more complex.1 At 193 nm (6.4 eV), the absorption of a DUV photon by the resist only leads to a neutral valence excited state that can then decay in a photochemical reaction to produce a desired solubility switch. In contrast, the initial absorption of an EUV photon (92 eV) primarily leads to emission of a photoelectron leaving behind an ionized cationic site in the resist. Similar to an electronically excited state, this site of the resist is a reactive species and can decay by further chemical conversion. In addition, however, the released photoelectron can trigger a cascade of additional secondary processes. The kinetic energy of the photoelectron depends on the binding energy of the orbital from which it has been removed.11 As a rough estimate based on typical molecular ionization thresholds, this energy can be as high as 80 eV when the electrons are ejected from the valence band.12,13 This allows for the production of additional low-energy secondary electrons (LESEs) with typical energies in the 0–20 eV range when the initial photoelectron is slowed down in the resist.14–16 Both the initial photoelectron and the LESEs can induce additional chemical reactions.15,17 However, information on the role of such reactive electron-molecule interactions in the processing of the resist in EUVL is sparse.
A few studies have addressed the electron-driven chemistry that is fundamental to the conversion of chemically amplified resists (CARs) during EUV exposure.18–22 In these studies, direct insight in the chemical reactions was obtained by mass spectrometry (MS) that monitored volatile fragments desorbing from the resist layers during electron exposure. More recently, MS was also applied to investigate the electron-induced chemistry of Sn oxoclusters as an example of metal-containing molecular resist.9,23 In these studies, electron-stimulated desorption (ESD) experiments revealed that 80 eV electrons can induce fragmentation of ligands from the clusters and showed how the structure of the cluster affects the efficiency for removal of particular ligands upon electron impact.23
As a novel example of metal-oxoclusters, Zn-tetranuclear oxoclusters surrounded by trifluoroacetate (TFA) and methacrylate (MA) ligands (Zn(MA)(TFA)) (Fig. 1) have been brought forward recently.24,25 In this type of resist, the solubility switch observed upon EUV irradiation has been explained as an effect of crosslinking of the MA ligands and a low degree of decarboxylation. While the role of electron-induced chemistry has not yet been explored in Zn(TFA)(MA) oxoclusters, a previous study on several Cu carboxylate complexes has revealed that the degradation of the latter materials under electron irradiation is in fact dominated by expulsion of CO2.26 This effect was not considered in the previous work on Sn oxoclusters with carboxylate species27 but might occur as an extra reaction path in metal-oxoclusters resists that contain carboxylate moieties and thus benefit or interfere with the solubility switch.
 | ||
| Fig. 1 Structural representation of Zn(MA)(TFA) and Zn(TFA) metal-oxoclusters. | ||
The present study aims at unraveling the chemistry induced in the Zn(MA)(TFA) resist by photoelectrons released upon absorption of EUV radiation and by LESEs to elucidate their role in EUVL. The degradation of the resist when exposed to electron irradiation at relevant electron energies was studied by reflection absorption infrared spectroscopy (RAIRS) and by mass spectrometry (MS) experiments that monitor the electron-stimulated desorption (ESD) of neutral volatile species. For reference, some experiments were also performed on a related Zn-oxocluster Zn(TFA) (Fig. 1). The electron-induced reactions observed thereby are in line with the mechanisms deduced recently from spectroscopic studies on the effect of EUV irradiation on Zn(MA)(TFA) resist layers. Furthermore, both ESD and RAIRS results obtained here yield new insights that further support these mechanisms. Overall, we show that not only the absorption of the EUV photon but also the photoelectron released upon absorption as well as LESEs produced by inelastic scattering of the photoelectron induce the characteristic chemical changes in the investigated Zn oxocluster EUVL resist.
2. Experiments
2.1 Preparation of resist layers
Resist layers of Zn(MA)(TFA) and ZnTFA were spin-coated (using Delta 80RC (BM, –T– Model) from SUSS MicroTec) on a silicon substrate (500 μm thick) covered with 5 nm Cr and 40 nm Au layers using a sputter coater (Leica ACE600). The thickness of the spin-coated thin films was determined by scratching the layer and measuring AFM on the silicon substrate (without sputter coated Cr/Au layer) and was presumed to be same as on silicon substrate sputter coated with Cr/Au. All the AFM measurements were done using a Bruker Dimensions Icon in ScanAsyst-air mode.ZnTFA (oxo[hexa(trifluoroacetato)] tetrazinc trifluoracetic acid adduct, CAS 12994899-47-6) was purchased from STREM chemicals and used without further purification. The resist solution of Zn(TFA) (2 w/v%) was prepared in acetonitrile followed by sonication (2 min) and filtration by 0.22 μm PTFE filter. The resist was spin-coated onto the substrate at a speed of 2000 rpm and an acceleration of 3000 rpm s−1 for 30 s. Further a post-apply bake processing of thin films was done at 90 °C for 30 s. The thickness of the spin coated thin films was ∼14 nm.
Zn(MA)(TFA) was synthesized by following the ligand exchange protocol as described previously.24 A resist solution of (2 w/v%) was prepared in chloroform and propylene glycol methyl ether acetate (PGMEA), 9![[thin space (1/6-em)]](https://www.rsc.org/images/entities/char_2009.gif) :1 v/v solvent mixture followed by sonication for 4 min and filtration by 0.22 μm PTFE filter. The resist layers of Zn(MA)(TFA) were spin coated onto the substrate at speed of 2100 rpm and an acceleration of 3000 rpm s−1 for 30 s. Post-apply bake of the thin films was done at 90 °C for 30 s. The thickness of Zn(MA)(TFA) thin films for ESD experiments was 12–15 nm.
:1 v/v solvent mixture followed by sonication for 4 min and filtration by 0.22 μm PTFE filter. The resist layers of Zn(MA)(TFA) were spin coated onto the substrate at speed of 2100 rpm and an acceleration of 3000 rpm s−1 for 30 s. Post-apply bake of the thin films was done at 90 °C for 30 s. The thickness of Zn(MA)(TFA) thin films for ESD experiments was 12–15 nm.
2.2 Reflection absorption infrared spectroscopy
RAIR spectra were acquired with an evacuated FTIR spectrometer (IFS 66v/S, Bruker Optics GmbH) equipped with a grazing incidence reflection unit and a liquid nitrogen-cooled MCT detector (sensitivity limit down to 750 cm−1). The spectra were collected with a resolution of 4 cm−1 and an aperture of 1.5 mm by averaging 400 scans. The sample chamber was evacuated to 5–8 mbar during measurements while the overall system was purged with N2. A fully deuterated hexadecanethiol (HDT) SAM grown on an Au surface was used as background sample.2.3 Electron irradiation and monitoring of evolving volatile species
Electron irradiation and electron-stimulated desorption (ESD) experiments were conducted in a home-built UHV analysis chamber equipped with a quadrupole mass spectrometer (QMS, SRS RGA 300, mass range m/z 1–300) and a flood gun (Specs FG15/40) for electron exposure.26,28 Samples were introduced via a preparation chamber which can be separately evacuated and vented for loading of samples. The resist samples were mounted on Cu sample holders and inserted into the preparation chamber. After the pressure in the preparation chamber had dropped to 1 × 10⁻⁸ mbar, the samples were transferred to the analysis chamber which was continuously kept below p = 5 × 10⁻⁹ mbar and covered with a clean Cu mask to reduce ESD from the Cu sample holder. The mask, which is electrically insulated from the sample and held at chamber ground potential, exposes approximately 2 cm2 of the sample surface to the electron beam.Electron exposure experiments were conducted at room temperature by either collecting full mass spectra or monitoring selected m/z ratios with an improved time-resolution. The flood gun delivers a defocused electron beam of tunable energy E0 in the range of 1–500 eV at current densities in the order of 10–30 μA cm−2. ESD experiments were conducted at 20 eV which falls within the energy range of LESEs and at 80 eV which is representative of the initial photoelectron released upon EUV absorption. To allow for accurate sample current measurements and thus exposure calculations at 80 eV, the flood gun energy was set to 70 eV and a bias of +10 V was applied to the sample to prevent LESEs produced upon irradiation from escaping. Mass spectra (MS) acquired during electron irradiation have been corrected for contributions of the chamber background vapours by subtracting a MS measured immediately before starting the irradiation. ESD data as function of time were recorded for the most intense signals and are shown without such a correction because the respective signal levels in the background were small. We note that desorption cross sections for neutrals are typically higher than for ions.29 Therefore, the ESD MS included in here refer to neutral species that have desorbed from the surface. The observed positive ions have been produced in the RGA's ionizer after desorption and fragment after this ionization step.
3. Results
3.1 Electron-stimulated desorption from Zn(MA)(TFA) and Zn(TFA) resist layers
The electron-stimulated desorption (ESD) of volatile species from Zn(MA)(TFA) and Zn(TFA) resist layers was first studied with an electron energy of 80 eV (Fig. 2). This energy is characteristic of the most energetic photoelectrons that are typically released by absorption of EUV radiation.11,16 The data are normalized to the dominant signal ascribed to CO2+ (m/z 44). Desorption of CO2 was observed earlier in ESD from copper carboxylates and explained by ionization, i.e., removal of an electron from the carboxylate group which leads to expulsion of neutral CO2.26,30 Beside m/z 44, ESD is dominated by peaks at m/z 28 (CO+), m/z 16 (O+), and m/z 12 (C+). These latter signals are significantly more intense than expected from the fragmentation pattern of CO2 measured previously.30 This indicates that the carboxylate group is not exclusively lost as CO2 under electron exposure as observed in the case of copper carboxylates26,30 but fragments further, probably driven by the formation of Zn oxide25 that was also observed upon electron irradiation in other Zn carboxylates.31 | ||
| Fig. 2 Mass spectra (MS) revealing electron-stimulated desorption (ESD) of volatile species that desorb during electron irradiation with an energy of 80 eV from (a) Zn(TFA) (thickness 12 nm) and (b) Zn(MA)(TFA) (thickness 14 nm) resist layers. The spectra were acquired within 15 s at the beginning of an electron irradiation experiment and are normalized to the intensity of the dominant m/z 44 peak (CO2) to facilitate the comparison of the relative intensities of different products. The incident currents were 30 μA cm−2 for Zn(TFA) and 34.2 μA cm−2 for Zn(MA)(TFA). The spectra represent data from which the background mass spectrum of the UHV chamber as measured immediately before starting the irradiation was subtracted. | ||
Another pronounced signal is m/z 18 (H2O+), pointing to desorption of H2O. ESD of H2O is present with similar intensity for both the nominally hydrogen-free Zn(TFA) resist (Fig. 2(a)) and Zn(MA)(TFA) (Fig. 2(b)). It therefore evidences uptake of water upon handling of the samples under ambient conditions. The relative amount of desorbing H2O as compared to CO2 can be roughly estimated based on the ESD intensities (Fig. 2). The underlying procedure is described in the Supporting Information. Based on this procedure and considering that the QMS used in the experiments discriminates high against small m/z ratios (see Fig. S1, ESI†), the relative amounts of H2O and CO2 that desorb during electron exposure from Zn(TFA) results as roughly 1:30. Note, however, that this underestimates the H2O content in the samples because H2O desorbs more slowly (see further on). It can further fragment under electron irradiation and react with components of the resist instead of desorbing. Therefore, H2O can play a role in the formation of products under electron irradiation.
Fig. 2 also shows that the intensity of signals ascribed to desorption of ligand fragments other than CO2 is generally small. In the case of Zn(TFA) (Fig. 2(a)), signals at m/z 69 (CF3+), 50 (CF2˙+), 31 (CF+), and 19 (F+) relate to loss of the CF3 group that is expected upon expulsion of CO2 from the carboxylate. Although desorption of CF3 itself cannot be ruled out, such radical species are highly reactive and can be converted to stable products before desorption occurs. In fact, relatively strong signals, as compared to m/z 50, are also observed at m/z 51 (HCF2+) and m/z 33 (H2CF+). These latter signals cannot stem from desorbing CF3 radicals but reveal that the CF3 group or fragments thereof react with H2O or the MA ligands to pick up hydrogen prior to desorption. Note that C–F bond dissociation is required for formation of a volatile product that fragments to H2CF+ when entering the QMS. C–F bond cleavage was also observed when Zn(MA)(TFA) was exposed to EUV radiation,25 supporting the present interpretation. Products such as CHF3 and CH2F2 are conceivable as origin of the signals at m/z 51 and m/z 33. The ESD spectrum shown in Fig. 2(a) thus represents contributions from different F-containing species. However, the MS signals of CHF3 and CH2F232 overlap with those of CF3.33 Considering also that the QMS used in the present experiments discriminates higher masses in favor of lower ones (see Fig. S1, ESI†), reference MS of the anticipated volatile products measured with the same instrument would be required to estimate the relative amounts of the different desorbing F-containing species. As this is not possible for CF3, such a quantitative analysis is beyond the scope of this work.
In the case of Zn(MA)(TFA), ESD shows the same signals of fluorinated fragments (Fig. 2(b)). However, the ESD rate of CF3 and of other fluorinated products from the mixed cluster is about five times lower than from Zn (TFA) (Fig. 2(a)). This reflects roughly the increase in the number of TFA ligands from one in the mixed cluster to six in Zn(TFA). ESD from Zn(MA)(TFA) further produces signals which can be tentatively assigned by comparison with literature MS.32 The pattern in the range m/z 37 to 42 with prominent peaks at m/z 39 and 41 agrees closely with the MS of propene (CH3CHCH2) which derives from the 2-propenyl radical released by loss of CO2 from the MA ligand. Smaller signals in the m/z 52–58 range point to small amounts of larger products. Here, the most pronounced signals at m/z 55 and m/z 56 are characteristic of compounds with a double bond. The dimerization of two 2-propenyl radicals is a likely explanation although larger fragments of such C6Hx species are difficult to detect due to the discrimination of higher masses within the QMS (see Fig. S1, ESI†). A further small signal at m/z 58 cannot stem from an unsaturated hydrocarbon but may point to an alcohol resulting from reaction of a 2-propenyl radical with H2O.
The time evolution of the ESD signals for characteristic m/z ratios gives more insight into the electron-induced chemistry of the Zn oxocluster resist. Fig. 3 shows such data for a sufficiently long electron irradiation of a Zn(MA)(TFA) resist layer to observe the decay of the ESD signals to baseline levels. The m/z 44 signal represents the desorption of CO2 while m/z 39 and 41 monitor desorption of a product deriving from the MA ligand, assigned to propene above, and m/z 50, 51, and 69 reveal the desorption of products relating to cleavage of the TFA ligand. Most importantly, all signals relating to the TFA and MA ligands decay with the same rate as CO2. The relative ESD yields of products emerging from the ligands of the Zn oxoclusters are therefore constant throughout the entire electron irradiation. This indicates that a common process initiates the observed ESD. We propose that this common process is the electron-induced ionization of the resist that results in the decarboxylation of some of the ligands and consequent ejection of CO2 while leaving behind the rest of the ligand as reactive 2-propenyl and CF3 radicals. As shown below, most of these radicals remain within the resist layer where they presumably bind to components of the Zn(MA)(TFA) clusters to induce, for instance, crosslinking reactions. A small fraction, however, can desorb as such (see CF3) or following reactions in the resist that converts them to stable volatile products (see CHF3 and propene). Note here that the inset of Fig. 3 reveals a slower decay of ESD of H2O as compared to ESD of fragments resulting from cleavage of the ligands. This shows that H2O is a persistent species that can act, for instance, as source of hydrogen in the conversion of the 2-propenyl and CF3 radicals to stable products. In fact, previous studies on the photofragmentation of Zn(MA)(TFA) show that this oxocluster has a quite hygroscopic character since coordinated H2O molecules were observed when the clusters is brought to the gas phase.34
 | ||
| Fig. 3 ESD curves of prominent m/z ratios acquired during electron irradiation of a Zn(MA)(TFA) (thickness 15 nm) resist layer at an electron energy of 80 eV. The signals represent desorption of CO2 (m/z 44), of the presumed product propene resulting from dissociation of the MA ligand (m/z 39, 41), and of CF3 and related products resulting from cleavage of the TFA ligand (m/z 50, 51, and 69). The total electron exposure was 15 mC cm−2. The end of irradiation is obvious from the small intensity drop at 510 s, clearly visible in the curve of m/z 44. The inset shows all curves scaled to their maximal intensity and reveals that the desorption of all dominant fragments from Zn(MA)(TFA) decays on the same time scale. | ||
The relative ESD yields of volatile species deriving from the 2-propenyl and CF3 radicals as compared to CO2 were estimated to support that the majority of the radicals released upon loss of CO2 remains in the resist layer. Again, the details of this calculation are presented in the Supporting Information. Note that a precise quantification is not possible because the assignment of the m/z ratios to specific products is not unique. For instance, contributions of CF3 radicals overlap with products deriving from them such as CHF3 and CH2F2 deduced above. However, an order of magnitude for this yield can be obtained by assuming as limiting cases that only CF3 or only CHF3 desorbs. Under these assumptions, we arrive for Zn(TFA) (Fig. 2(a)) at relative yields of 1:5 (CF3:CO2) and 1:10 (CHF3:CO2) as an upper and lower limit for the desorption of fluorinated products as compared to CO2. This indicates that the majority of the reactive CF3 radicals becomes incorporated in the resist. A similar estimate of the total amount of desorbing hydrocarbon species from Zn(MA)(TFA) was obtained based on the assumption that propene is the dominant product producing the MS pattern seen in the m/z 36 to 42 range. Based on ionization cross sections we arrive at a relative yield of desorbing propene as compared to CO2 of 1:50 (propene:CO2). This indicates that, even more than the CF3 radical, the 2-propenyl radical is predominantly retained in the resist. In conclusion, irradiation of the resist layers with 80 eV electrons leads to dominant desorption of CO2 and, to a minor extent, of fragments thereof as a result of ligand decarboxylation. However, the majority of the ligand terminal groups released after the ejection of CO2 remains in the resist layer and most likely contributes to crosslinking between the Zn oxoclusters. This is in line with a mechanism proposed recently according to which the radical species initiate crosslinking reactions.25
The results so far represent the effect of 80 eV photoelectrons as emitted in the resist layer upon absorption of EUV photons. Such photoelectrons can promote further ionization events and thus generate LESEs that might also contribute to the reactions occurring in the resist. We have studied the effect of such LESEs on the resist using an energy of 20 eV. This lies within the typical energy distribution of LESEs14,15 and, at the same time, warrants a sufficiently high ESD rate. Fig. 4 compares the ESD data acquired from Zn(MA)(TFA) resist layers during irradiation at 80 eV (see also Fig. 2 and 3) with an experiment performed at 20 eV. Note that the electron current delivered by the electron gun at 20 eV was an order of magnitude smaller than at 80 eV. To achieve a quantitative comparison, the MS shown in Fig. 4(a) and (b) have been accumulated over the same electron exposure range at the beginning of irradiation and are plotted on the same scale. This exposure range is marked in red in the time evolution of the dominant m/z 44 ESD signal (Fig. 4(c) and (d)). Despite the much lower energy, the CO2 ESD yield at 20 eV still amounts to nearly half of the yield at 80 eV. The same applies to the hydrocarbon fragments from the MA ligands. This remarkably similar ESD rate was also confirmed by a second set of experiments where the integrated m/z 44 signal for a total exposure of 2.5 mC cm−2 has been evaluated (see Fig. S2, ESI†).
 | ||
| Fig. 4 Mass spectra (MS) revealing electron-stimulated desorption (ESD) of volatile species from 15 nm Zn(MA)(TFA) resist layers during irradiation with (a) an incident current of 3.9 μA cm−2 at 20 eV and (b) an incident current of 34 μA cm−2 at 80 eV. The decay of the ESD signal at m/z 44 with irradiation time is shown in (c) for 20 eV and in (d) for 80 eV. The mass spectra were accumulated during injection of an electron dose of 527 μC cm−2 at both energies (marked by red). | ||
In contrast, the intensity of F-containing fragments in ESD is strongly reduced at 20 eV (Fig. 4(a)). We note that the thickness of the resist layers used in the experiments (12–15 nm) is significantly larger than the typical electron mean free path which is of the order of 1–2 nm at the energies studied here.16 Slight variations in thickness should thus not have an effect on the ESD results described here. We can conclude from the comparison in Fig. 4 that the efficiency of 20 eV LESEs in initiating ligand fragmentation is lower but still within the same order of magnitude as in the case of the initial 80 eV photoelectrons. LESEs therefore make a noticeable contribution to the conversion of the Zn oxocluster resists investigated here and very likely also for similar types of metal oxocluster resists.
3.2 RAIRS of Zn(MA)(TFA) and Zn(TFA) resist layers
The ESD results are complemented by RAIRS that monitors the material which remains in the resist layers after electron irradiation. As reference for the irradiation experiments, Fig. 5 compares the RAIR spectra of pristine resist samples of Zn(MA)(TFA) and Zn(TFA). Based on a close agreement with the spectrum of sodium trifluoroacetate,35 the bands in the spectrum of the Zn(TFA) sample are assigned as νas(TFA, CO2) (1683 cm−1), νs(TFA, CO2) (1456 cm−1), νs(CF3) (1223 cm−1), νas(CF3) (1168 cm−1), ν(TFA,CC) (853 cm−1), δ(CO2) (799 cm−1), and δumbrella(CF3) (735 cm−1). These bands are also present in the spectrum of the Zn(MA)(TFA) resist layer (see Table S3, ESI†). Additional bands marked by * in Fig. 5 relate to the MA ligands and are assigned as ν(CC) (1646 cm−1), νas(MA, CO2) (1595 cm−1 and 1569 cm−1), νs(MA, CO2) coupled with δ(CH2) and δ(CH3) (1427 cm−1 and 1375 cm−1), ν(C–C) + ρ(=CH2) (1244 cm−1), ω(CH3) (1009 cm−1), and ω(CH2) (944 cm−1) based on a close agreement with the spectrum of Zr4O2(MA)12 clusters36 and a previous analysis24 and to a further CH2 bending mode (835 cm−1).37 Note that the colored bands in Fig. 5 represent the ranges over which the integration of the spectral intensities has been performed in spectra obtained after varying electron exposures as discussed below.
 | ||
| Fig. 5 RAIR spectra of pristine resist samples of Zn(MA)(TFA) and of the related cluster Zn(TFA). Bands relating to MA ligands are marked by*. Refer to text for detailed assignments. Spectral ranges marked in red are contained in the integrated TFA band intensities for νas(TFA, CO2) and ν(CF3) and spectral ranges marked in blue are contained in the integrated MA band intensities for νas(MA, CO2) and ν(C–C) + ρ(CH2) as used to monitor the evolution of the band intensities after varying electron exposures (see below). | ||
3.3 Electron-induced conversion of Zn(TFA)(MA) resist layers monitored by RAIRS
The effect of electron irradiation at 80 eV and 20 eV was monitored on a series of Zn(MA)(TFA) resist samples by recording RAIRS before and after electron exposure. For reference, some experiments were also performed with Zn(TFA) samples. Representative data are shown in Fig. 6 while all spectra are presented in the ESI,† Fig. S3 and S4. The electron exposures of 0.2 mC cm−2 at 80 eV and 1.0 mC cm−2 at 20 eV (upper part of Fig. 6) correspond to an energy input of 16 mJ cm−2 and 20 mJ cm−2, respectively (see also Section 4.1). These values are close to the doses that are required in EUVL to achieve the solubility switch in the Zn(MA)(TFA) resist.25 Despite the different electron energy but in line with the similar energy input, the intensity reduction in the RAIR spectra is comparable for these two electron exposures, indicative of a remarkable contribution of LESEs in the resist conversion.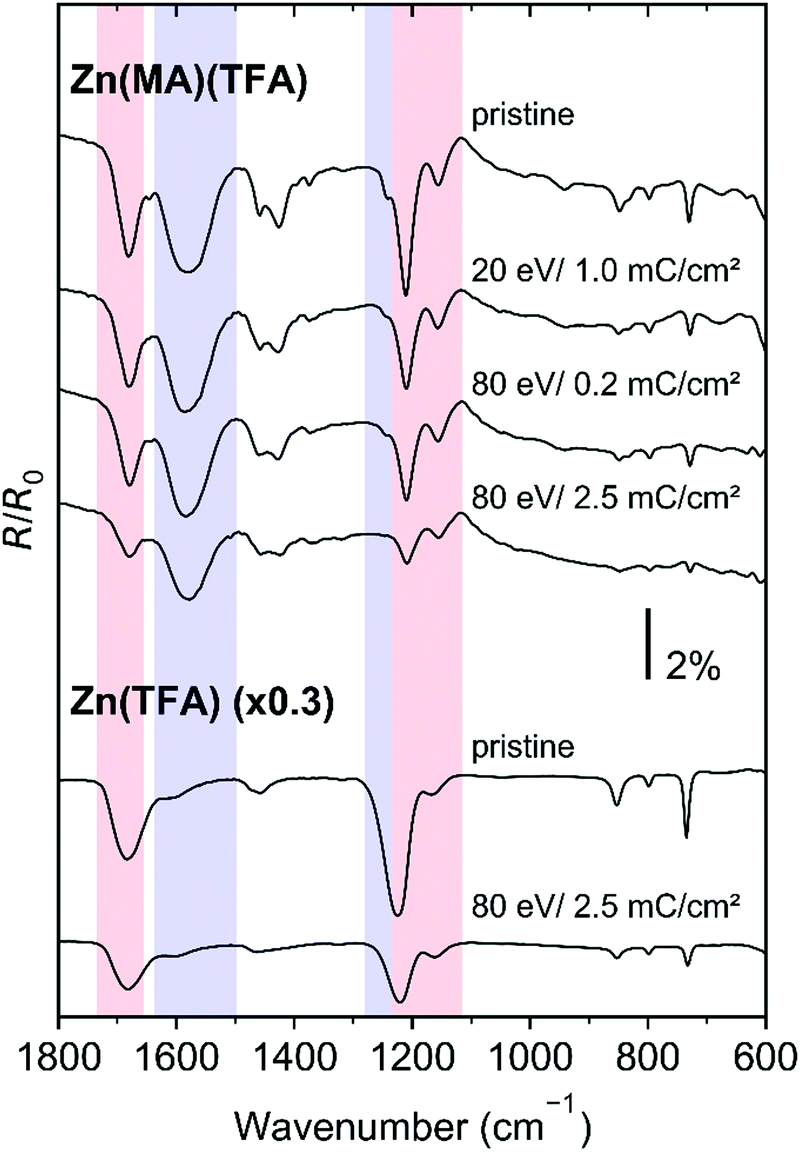 | ||
| Fig. 6 RAIRS of 12 nm Zn(MA)TFA 14 nm Zn(TFA) resist layers recorded before (pristine) and after the stated electron exposures at 80 eV and 20 eV. | ||
Notably, a strong decay of the ν(C–C)+ ρ(=CH2) vibration at 1244 cm−1 is observed at both energies, indicative of the rapid consumption of CC double bonds. This band was not resolved previously,25 so that the present results provide new direct support of the proposed reaction mechanisms regarding the crosslinking reactions that underlie the solubility switch of the Zn(MA)(TFA) resist (see Section 4.2). In addition and as shown in Fig. 6 by data for 2.5 mC cm−2 at 80 eV, the conversion of both Zn(MA)(TFA) and Zn(TFA) resist layers under electron irradiation clearly continues beyond the exposures that correspond to typical EUVL doses. This is again in contrast to RAIRS results obtained previously from the EUV irradiated resist.25 We note, however, that the spectra do not provide evidence for specific new products despite the fact that the majority of the ligand side groups remain in the resist layer according to the ESD results (Section 3.1). This points to the formation of a rather unspecific material with differing vibrational signatures that spread over a wide range of wavenumbers or to new functional groups with bands that lie outside of the range of wavenumbers accessible with RAIRS. For instance, the loss of CF3 stretching bands (νs(CF3) at 1223 cm−1 and νas(CF3) at 1168 cm−1) points to C–F bond dissociation. Such dissociation is in line with the appearance of fragments (H2CF+) in ESD (see Section 3.1) and has also been confirmed by previous XPS results on EUV-irradiated Zn(MA)(TFA) that revealed the formation of Zn–F bonds.25 Also, the pattern of the C–H stretching bands changes after prolonged electron irradiation (see Fig. S5, ESI†) indicating that the structure of the MA hydrocarbon group is modified.
To evaluate the decay of the vibrational signatures after electron irradiation quantitatively, the integrated intensity of characteristic bands relating to the MA ligands (marked in blue in Fig. 5) and to the TFA ligands (marked in red in Fig. 5) is plotted as function of electron exposure in Fig. 7. In fact, the characteristic MA band ν(C–C) + (CH2) decays most rapidly in line with a rapid crosslinking. In contrast, νas(MA, CO2) decays at a lower rate which implies that a single loss of CO2 from the MA ligands is accompanied by loss of more than one double bond. The double bond of the MA ligands is thus not merely lost by release of a 2-propenyl radical but also through additional reactions. Such a difference is not seen for the TFA ligand. Instead, νas(TFA, CO2) and ν(CF3) decay at a similar rate in both resists and at both electron energies indicating that the loss of the CF3 groups is related to the expulsion of CO2 alone. The underlying reaction mechanisms are discussed in detail in Section 4.2.
 | ||
| Fig. 7 Evolution of characteristic MA and TFA RAIRS bands as marked in Fig. 5 with electron exposure at (a) 80 eV and (b) 20 eV for Zn(TFA) (top) and Zn(MA)(TFA) (bottom). The RAIRS intensities were obtained by integration of Gaussians fitted to the individual peaks as exemplified in Supporting Information, Fig. S6 (ESI†). The ESD intensities were obtained by normalizing the m/z 44 signal to the value obtained at the start of the irradiation (see also Fig. 4 for Zn(MA)(TFA)). To enhance readability, the number of ESD data points displayed was reduced to 20% (Zn(TFA), 80 eV and Zn(MA)(TFA), 20 eV) and 3% (Zn(TFA), 20 eV), respectively. | ||
We note that the RAIRS signals do not decay towards baseline levels within the investigated range of exposure of up to 7.5 mC cm−2 while ESD of CO2 (included as crosses in Fig. 7) nearly does so. This reflects the limited penetration depth of the electrons resulting from the very small mean free path that is typically below 1 nm at the investigated electron energies.16 ESD is a surface process and thus reflects the material that is lost from the topmost part of the resist while RAIRS probes the entire layer and thus also material that is less efficiently reached by the electron beam accounting for the remaining intensity after 7.5 mC cm−2 (Fig. 7). The somewhat slower decay of νas(TFA, CO2) and ν(CF3) from Zn(TFA) (see also Fig. S3 and S4, ESI†) as compared to Zn(MA)(TFA) most likely reflects the slightly larger thickness of Zn(TFA) but may also be an effect of different electron scattering probabilities in the two materials that can, however, not be quantified here.
4. Discussion
4.1 Comparison with EUV results
The present results complement the recent EUV irradiation study of Zn(MA)(TFA) resist samples25 by revealing that a typical photoelectron released upon absorption of an EUV photon, represented here by electron irradiation at an energy of 80 eV, induces similar chemical changes in the sample as the actual photoabsorption and consequent ionization. The effect at 20 eV, i.e., for electrons with an energy in the upper part of the range characteristic of LESEs, is somewhat weaker but still remarkable. The ESD data and the changes in RAIRS following electron irradiation thus give compelling evidence that not only the initial 80 eV photoelectron but also lower energy LESEs contribute to the processing of Zn oxocluster resists.As also seen for the previous EUV irradiation study of Zn(MA)(TFA) resist layers25 (see also Fig. S7, ESI†), carboxylate bands and vibrations relating to the CF3 groups in RAIRS lose intensity upon electron irradiation (see Fig. 7). Based on this decay, we can compare in a semiquantitative manner the effect of EUV absorption and electron irradiation. Following an incident EUV dose of 85 mJ cm−2, the carboxylate bands were observed to decay by roughly 20%.25 Based on the linear EUV absorption coefficient of 12.4 μm−1 of the Zn(MA)(TFA) resist24 and considering that the thickness of the samples used in EUV irradiation amounted to 25–30 nm, this dose corresponds to an EUV transmission through the resist of roughly 70% and consequently an estimated absorbed energy of 26 mJ cm−2. The energy input to the sample during an electron exposure of 0.2 mC cm−2 at 80 eV is even smaller (16 mJ cm−2) but leads to a 25–30% decay of the carboxylate bands (Fig. 7(a)). Similarly, an intensity loss around 20% was also observed after an electron exposure of 1 mC cm−2 at 20 eV (20 mJ cm−2). Considering further that not even the entire resist layer is processed under electron irradiation due to the limited penetration depth of the low-energy electron beam (see Section 3.3), this underlines that the contribution of photoelectrons and LESEs to the conversion of the Zn(MA)(TFA) resist is substantial.
As observed above and most clearly visible upon electron irradiation at 80 eV, the intensities of most RAIRS bands of the Zn(MA)(TFA) resist continue to decay beyond the typical energy input required for solubility switching in the EUVL process (Fig. 7(a)). This gives evidence of continued cleavage of carboxylate groups. In contrast, the intensities remained constant when EUV irradiation was extended beyond an incident dose of 85 mJ cm−2.25 We speculate that this different response to EUV and electron irradiation may be an effect of a different charge state of the sample. While EUV absorption can lead to accumulation of positively charged ions in the resist layer which decreases the efficiency of further ionization, an impinging electron beam can compensate for such a charging effect38 and thus enable continued conversion of the sample.
4.2 Reaction mechanisms
The chemical changes that occur in Zn(MA)(TFA) resists upon absorption of EUV radiation were recently studied by FTIR, UV-vis spectroscopy, as well as XPS. Based on these results, a reaction scheme for the conversion of the resist was conceived.25 Briefly, it was proposed that absorption of an EUV photon leads to emission of a photoelectron and formation of a radical cation of the Zn oxocluster which then decays by expulsion of CO2 releasing an organic radical (2-propenyl or CF3). The latter can initiate crosslinking between the clusters by adding to the CC double bond of an intact MA ligand. Furthermore, based on the formation of Zn–F bonds seen in XPS, is was proposed that LESEs with near-thermal energy can attach to the Zn oxocluster to initiate C–F bond cleavage by dissociative electron attachment (DEA).39 This releases F− ions which then bind to vacant Zn sites. The present results reveal that electron irradiation induces a closely related chemistry in the Zn(MA)(TFA) resist. In addition, the ESD and RAIRS results provide new details about the reactions in the resist. This is summarized in the extended reaction sequence shown in Scheme 1 and discussed in detail further on.
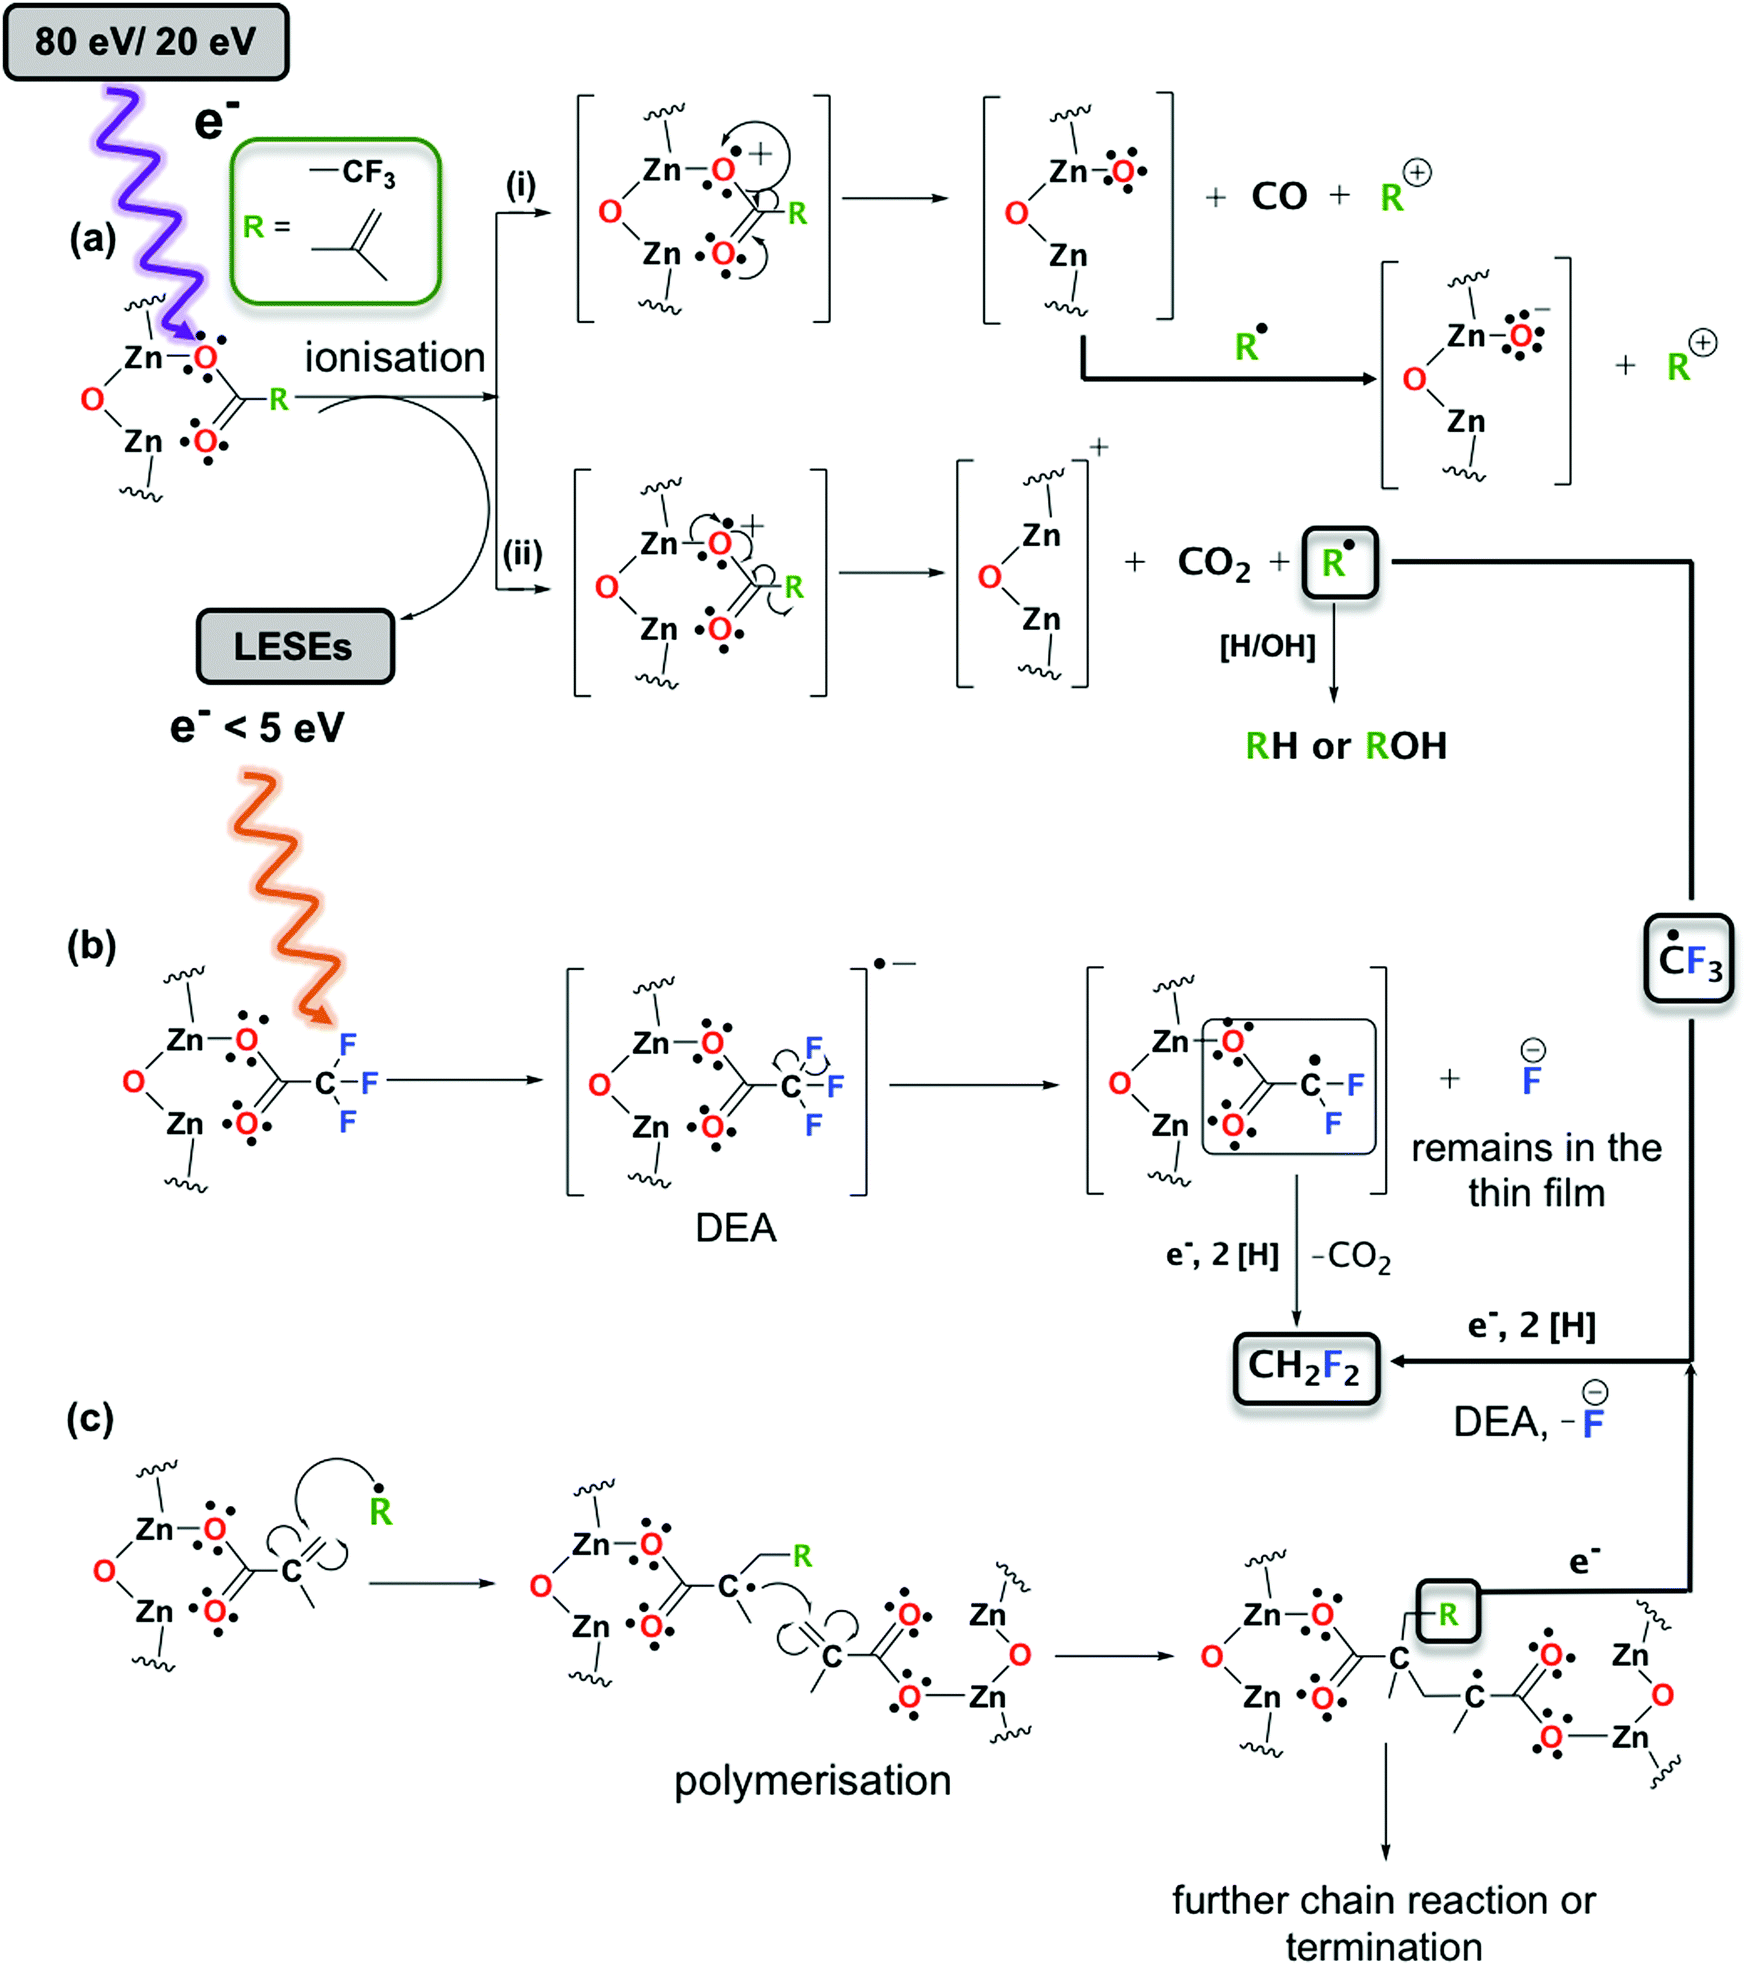 | ||
| Scheme 1 Proposed reaction mechanism for Zn oxoclusters exposed to 80 eV and 20 eV electrons: (a) Ionization of the Zn oxocluster followed by fragmentation of a ligand leading to (i) loss of CO and a cation, (ii) loss of CO2 and a radical. Ionization leads to generation of LESEs. (b) Interaction of LESEs (<5 eV) with surrounding Zn oxoclusters leading to fragmentation via DEA. (c) Radical-initiated chain reaction polymerization in the resist layer. For simplicity, only the part of the Zn oxocluster where the ligand dissociation occurs is shown and the carboxylate ligand is represented as monodentate ligand. Note that this represents a particular mesomeric structure and radical sites and the positive charge present after ionization can be delocalized over the entire cluster. | ||
The present ESD data reveal, in line with earlier studies on different carboxylate compounds,26,32 that CO2 is in fact the dominant outgassing species. This is also the first time that the release of CO2 from Zn(MA)(TFA) is directly observed. 80 eV is within the energy range were electron impact ionization (EI) is most efficient.15 It is thus plausible that impact of a photoelectron released upon EUV absorption will induce the same sequence of reactions as the actual EUV absorption. Therefore, the present results are also relevant to the EUVL process itself. As expected from the general energy dependence of EI, the yield of CO2 is lower at 20 eV but still significant. At both energies, we observe, however, that CO desorbs as a byproduct. As shown in Scheme 1, we propose that this is accompanied by formation of Zn–O bonds. This decarboxylation channel was not previously considered for Zn(MA)(TFA) but has been reported to lead to formation of Zn oxide upon electron irradiation of Zn acetate (Zn4O(CH3COO)6)40 and of a Zn-based metal organic framework.31 The loss of a carboxylate ligand from Zn(MA)(TFA) yields a structure that is related to oxygen vacancies at the surface of ZnO.41 Such oxygen vacancies have been shown to enhance the reduction of CO2 to CO at the surface of ZnO electrocatalysts.41 We propose that a similar reactivity leads to the formation of CO as observed here. In fact, a previous study of photofragmentation pathways of Zn(MA)(TFA) in the gas phase34 revealed that the loss of one ligand due to dissociative ionization led to products with m/z values that would be in agreement with loss of CO and one oxygen atom remaining in the cluster. However, these species overlap with products in which H2O molecules coordinate to the cation resulting after loss of a ligand. We also note that the structure of the Zn oxocluster after release of CO as proposed in Scheme 1 is tentative. Further theoretical studies would be needed to confirm this reaction pathway but are beyond the scope of the present work. However, considering the high electronegativity of oxygen, it is conceivable that the positive charge can also be localized on the ligand side group after fragmentation and that the oxygen can capture a further electron upon encounter with a radical species (see Scheme 1).
ESD also evidences that ligand side groups desorb in fact to a much smaller extent than CO2. This supports that the 2-propenyl and CF3 radicals released upon expulsion of CO2 or CO react in the resist as proposed recently.25 The present RAIRS results also provide direct evidence that the CC double bonds of the MA ligands are more rapidly consumed than the carboxylate groups. The intensity of the ν(MA, C–C) + ρ(= CH2) band was not reported before so that its rapid decay observed here (Fig. 7) is a particularly important result. For instance, an electron exposure of 0.5 mC cm−2 at 80 eV is sufficient to reduce the intensity of this band by roughly 75% while the intensity of the MA carboxylate bands still amounts to roughly 2/3 of their initial intensity. This indicates that more than one CC double bond is lost per cleaved carboxylate and supports the reaction mechanism proposed previously for EUV irradiation25 and extended in Scheme 1.
Based on the close correlation between the analytical results obtained previously for Zn(MA)(TFA) resists following EUV absorption25 and the present results for electron irradiation we can conclude that, regardless of the incident particle, the most important events defining the chemistry are ionization and the generation of secondary electrons. This was also stressed recently with regards to the related Hf oxocluster EUVL resists.37 Note here that 20 eV and 80 eV electrons have energies well above typical ionization thresholds. In all cases, the primary interaction expected between these electrons and the thin film is thus the ionization of the molecules in the film. However, a larger number of LESEs will be produced by an 80 eV electron than at 20 eV which rationalizes the lower reaction rate at 20 eV.
A difference between the reactions induced by 80 eV and 20 eV electrons is that desorption of F-containing species is more strongly reduced at 20 eV than the outgassing of other products (see Fig. 4). This may relate to differences in the ionization energy and energy-dependent cross sections of fluorinated and non-fluorinated ligands. For instance, the ionization energies of methacrylic acid and trifluoroacetic acid are reported as 10.15 eV and 11.5 eV, respectively.42 This brings the fluorinated compound closer to threshold than the non-fluorinated compound leading to a smaller ionization cross section. This is more clearly revealed by comparing the available total electron impact ionization cross sections for propene and the CF3 radical as model for the MA and TFA ligands. While the cross section for propene drops by roughly a factor of three from 8.819 Å2 to 3.069 Å2 when the electron energy is decreased from 80 eV to 20 eV, it decreases by nearly a factor of ten from 4.782 Å2 to 0.502 Å2 in the case of CF3.43 Note also that a lower electron energy will release less LESEs. In particular, near-thermal LESEs can induce cleavage of C–F bonds by DEA.39 C–F bond dissociation is evidenced here by the m/z 51 (HCF2+) and m/z 33 (H2CF+) signals in ESD and also in line with formation of Zn–F seen in XPS.25 The strong suppression of the m/z 51 and m/z 33 ESD signals at 20 eV can thus also relate to a lower yield of LESEs. The present results do not allow us to distinguish between C–F bond dissociation in the TFA ligand prior to loss of CO2 and dissociation of the CF3 radical after loss of CO2. In fact, DEA has also been reported for the CF3 radical.44 Therefore, both reaction pathways are tentatively included in Scheme 1.
5. Conclusions
The electron-induced chemistry of the novel Zn oxocluster, Zn(MA)(TFA), as EUVL resist has been studied under irradiation with electron energies of 80 eV and 20 eV. The former energy is representative of photoelectrons ejected from the cluster upon absorption of an EUV photon, while 20 eV falls within the range of energies that is characteristic of low-energy secondary electrons produced by interaction of the initial photoelectron with the clusters. The results reveal that the chemistry induced by electrons is closely related to the effect of EUV photon absorption. In fact, for an energy input that is comparable to typical doses in the range of the EUVL process (dose to size, 20 mJ cm−2), a similar conversion of the resist was achieved under electron irradiation.Both electron energies promote ionization of the resist leading to desorption of volatile decomposition products. The dominant component of the desorbing gas is CO2. Remarkably, even 20 eV electrons are fairly efficient and still evolve near 50% of the amount of gas that is observed for the same electron dose at 80 eV. Notably, CO is also produced pointing to formation of Zn oxide in the thin films. In contrast, only small amounts of species deriving from the ligand side chains desorb, indicating that they predominantly remain within the resist layer. However, species such as m/z 51 (HCF2+) and m/z 33 (H2CF˙+) seen in MS support that C–F bond cleavage occurs under electron irradiation. As an important finding, the present infrared spectroscopic results provide the first direct evidence that CC bonds are more rapidly consumed than the carboxylate groups following ionization and consequent expulsion of CO2. This supports that chain reactions occur. These reactions are held responsible for crosslinking of the clusters and thus for the solubility switch of the resist in EUVL.
Because of the close correlation between EUV- and electron-induced reactions, the present results provide complementary and new insight into the chemistry that occurs in the investigated resist. Overall, we have demonstrated that the contribution of photoelectrons and LESEs to the conversion of the Zn(MA)(TFA) resist and similar resist materials cannot be neglected.
Author contributions
MR supervised the electron irradiation experiments, performed the data analysis, and prepared most of the figures. NT synthesized the resist, prepared the thin film samples and chemical drawings as well as Fig. S7 (ESI†), wrote part of the experimental section, and managed the references. RC performed the electron irradiation experiments. SC initiated the study and guided the selection of electron exposures. PS wrote the manuscript. MR, NT, and SC reviewed, discussed, and edited the manuscript.Conflicts of interest
There are no conflicts to declare.Acknowledgements
This project that has received funding from the European Union's Horizon 2020 research and innovation programme under the Marie Skłodowska-Curie grant agreement No. 722149. Part of this work has been carried out within the Advanced Research Center for Nanolithography (ARCNL), a public–private partnership between University of Amsterdam (UvA), the Vrije Universiteit Amsterdam (VU), the Netherlands Organisation for Scientific Research (NWO), and the semiconductor equipment manufacturer ASML.References
- R. A. Lawson and A. P. G. Robinson, Frontiers of Nanoscience, Elsevier Ltd, 2016, vol. 11, pp. 1–90 Search PubMed.
- O. R. Wood and H. Kinoshita, in EUV Lithography, ed. V. Bakshi, SPIE, Washington, 2nd edn, 2018, pp. 1–56 Search PubMed.
- C. Wagner and N. Harned, EUV lithography: Lithography gets extreme, Nat. Photonics, 2010, 4, 24 CrossRef CAS.
- L. Li, X. Liu, S. Pal, S. Wang, C. K. Ober and E. P. Giannelis, Extreme ultraviolet resist materials for sub-7 nm patterning, Chem. Soc. Rev., 2017, 46, 4855–4866 RSC.
- M. Neisser, K. Cho and K. Petrillo, The Physics of EUV Photoresist and How It Drives Strategies for Improvement, J. Photopolym. Sci. Technol., 2012, 25, 87–94 CrossRef CAS.
- B. Cardineau, Frontiers of Nanoscience, Elsevier Ltd, 2016, vol. 11, pp. 377–420 Search PubMed.
- C. Luo, C. Xu, L. Lv, H. Li, X. Huang and W. Liu, Review of recent advances in inorganic photoresists, RSC Adv., 2020, 10, 8385–8395 RSC.
- L. Wu, M. Baljozovic, G. Portale, D. Kazazis, M. Vockenhuber, T. Jung, Y. Ekinci and S. Castellanos, Mechanistic insights in Zr- and Hf-based molecular hybrid EUV photoresists, J. Micro/Nanolithogr., MEMS, MOEMS, 2019, 18, 1 Search PubMed.
- I. Bespalov, Y. Zhang, J. Haitjema, R. M. Tromp, S. J. Van Der Molen, A. M. Brouwer, J. Jobst and S. Castellanos, Key Role of Very Low Energy Electrons in Tin-Based Molecular Resists for Extreme Ultraviolet Nanolithography, ACS Appl. Mater. Interfaces, 2020, 12, 9881–9889 CrossRef CAS PubMed.
- A. Narasimhan, L. Wisehart, S. Grzeskowiak, L. E. Ocola, G. Denbeaux and R. L. Brainard, What We Don’t Know About EUV Exposure Mechanisms, J. Photopolym. Sci. Technol., 2017, 30, 113–120 CrossRef CAS.
- J. M. Sturm, F. Liu, E. Darlatt, M. Kolbe, A. A. I. Aarnink, C. J. Lee and F. Bijkerk, Extreme UV secondary electron yield measurements of Ru, Sn, and Hf oxide thin films, J. Micro/Nanolithogr., MEMS, MOEMS, 2019, 18, 1 Search PubMed.
- D. F. Ogletree, Frontiers of Nanoscience, Elsevier Ltd, 2016, vol. 11, pp. 91–113 Search PubMed.
- O. Kostko, B. Xu, M. Ahmed, D. S. Slaughter, D. Frank Ogletree, K. D. Closser, D. G. Prendergast, P. Naulleau, D. L. Olynick, P. D. Ashby, Y. Liu, W. D. Hinsberg and G. M. Wallraff, Fundamental understanding of chemical processes in extreme ultraviolet resist materials, J. Chem. Phys., 2018, 149, 154305 CrossRef PubMed.
- J. Torok, R. Del Re, H. Herbol, S. Das, I. Bocharova, A. Paolucci, L. E. Ocola, C. Ventrice Jr., E. Lifshin, G. Denbeaux and R. L. Brainard, Secondary electrons in EUV lithography, J. Photopolym. Sci. Technol., 2013, 26, 625–634 CrossRef CAS.
- R. M. Thorman, R. Kumar, D. H. Fairbrother and O. Ingólfsson, The role of low-energy electrons in focused electron beam induced deposition: four case studies of representative precursors, Beilstein J. Nanotechnol., 2015, 6, 1904–1926 CrossRef CAS PubMed.
- J. H. Ma, P. Naulleau, M. Ahmed and O. Kostko, Determination of effective attenuation length of slow electrons in polymer films, J. Appl. Phys., 2020, 127, 245301 CrossRef.
- E. Böhler, J. Warneke and P. Swiderek, Control of chemical reactions and synthesis by low-energy electrons, Chem. Soc. Rev., 2013, 42, 9219–9231 RSC.
- I. Pollentier, Y. Vesters, J. Jiang, P. Vanelderen and D. De Simone, SPIE Photomask Technology and EUV Lithography, SPIE, 2017, vol. 10450, p. 104500H Search PubMed.
- A. Thete, D. Geelen, S. Wuister, S. J. van der Molen and R. M. Tromp, Extreme Ultraviolet (EUV) Lithography VI, SPIE, 2015, vol. 9422, p. 94220A Search PubMed.
- J. Kaminsky, S. Grzeskowiak, S. Gibbons, J. Chandonait, U. Welling, S. Gibbons, L. S. Melvin, Y. Kandel, R. L. Brainard and G. H. Denbeaux, Advances in Patterning Materials and Processes XXXV, SPIE, 2018, vol. 10586, p. 105861N Search PubMed.
- S. Grzeskowiak, J. Kaminsky, S. Gibbons, A. Narasimhan, R. L. Brainard and G. Denbeaux, Electron trapping: a mechanism for acid production in extreme ultraviolet photoresists, J. Micro/Nanolithogr., MEMS, MOEMS, 2018, 17, 1 Search PubMed.
- S. Grzeskowiak, K. Jake, S. Gibbons, M. Murphy, J. Chandonait, R. L. Brainard and G. H. Denbeaux, Advances in Patterning Materials and Processes XXXV, SPIE, 2018, vol. 10586, p. 105860D Search PubMed.
- R. T. Frederick, J. T. Diulus, D. C. Hutchison, M. Nyman and G. S. Herman, Effect of Oxygen on Thermal and Radiation-Induced Chemistries in a Model Organotin Photoresist, ACS Appl. Mater. Interfaces, 2019, 11, 4514–4522 CrossRef CAS.
- N. Thakur, L.-T. Tseng, M. Vockenhuber, Y. Ekinci and S. Castellanos, Stability studies on a sensitive EUV photoresist based on zinc metal oxoclusters, J. Micro/Nanolithogr., MEMS, MOEMS, 2019, 18, 43504 CAS.
- N. Thakur, R. Bliem, I. Mochi, M. Vockenhuber, Y. Ekinci and S. Castellanos, Mixed-ligand zinc-oxoclusters: efficient chemistry for high resolution nanolithography, J. Mater. Chem. C, 2020, 8, 14499–14506 RSC.
- K. Ahlenhoff, S. Koch, D. Emmrich, R. Dalpke, A. Gölzhäuser and P. Swiderek, Electron-induced chemistry of surface-grown coordination polymers with different linker anions, Phys. Chem. Chem. Phys., 2019, 21, 2351–2364 RSC.
- M. C. Sharps, R. T. Frederick, M. L. Javitz, G. S. Herman, D. W. Johnson and J. E. Hutchison, Organotin Carboxylate Reagents for Nanopatterning: Chemical Transformations during Direct-Write Electron Beam Processes, Chem. Mater., 2019, 31, 4840–4850 CrossRef CAS.
- M. Rohdenburg, P. Martinović, K. Ahlenhoff, S. Koch, D. Emmrich, A. Gölzhäuser and P. Swiderek, Cisplatin as a Potential Platinum Focused Electron Beam Induced Deposition Precursor: NH3 Ligands Enhance the Electron-Induced Removal of Chlorine, J. Phys. Chem. C, 2019, 123, 21774–21787 CrossRef CAS.
- T. E. Madey, Electron- and photon-stimulated desorption: Probes of structure and bonding at surfaces, Science, 1986, 234, 316–322 CrossRef CAS PubMed.
- K. Ahlenhoff, C. Preischl, P. Swiderek and H. Marbach, Electron Beam-Induced Surface Activation of Metal-Organic Framework HKUST-1: Unraveling the Underlying Chemistry, J. Phys. Chem. C, 2018, 122, 26658–26670 CrossRef CAS.
- B. W. Jacobs, R. J. T. Houk, B. M. Wong, A. A. Talin and M. D. Allendorf, Electron beam synthesis of metal and semiconductor nanoparticles using metal-organic frameworks as ordered precursors, Nanotechnology, 2011, 22, 375601 CrossRef.
- W. E. Wallace, ‘Mass Spectra’ in NIST Chemistry WebBook, NIST Standard Reference Database Number 69, https://webbook.nist.gov/cgi/cbook.cgi?Contrib=MSDC, (accessed 1 October 2020).
- V. Tarnovsky, P. Kurunczi, D. Rogozhnikov and K. Becker, Absolute cross sections for the dissociative electron impact ionization of the CFx (x = 1-3) free radicals, Int. J. Mass Spectrom. Ion Processes, 1993, 128, 181–194 CrossRef CAS.
- N. Thakur, A. Giuliani, L. Nahon and S. Castellanos, Photon-induced Fragmentation of Zinc-based Oxoclusters for EUV Lithography Applications, J. Photopolym. Sci. Technol., 2020, 33, 153–158 CrossRef CAS.
- K. O. Christe and D. Naumann, Vibrational spectra of trifluoroacetates, Spectrochim. Acta, Part A, 1973, 29, 2017–2024 CrossRef.
- J. Kreutzer, M. Puchberger, C. Artner and U. Schubert, Retention of the cluster core structure during ligand exchange reactions of carboxylato-substituted metal oxo clusters, Eur. J. Inorg. Chem., 2015, 2145–2151 CrossRef CAS PubMed.
- E. C. Mattson, Y. Cabrera, S. M. Rupich, Y. Wang, K. A. Oyekan, T. J. Mustard, M. D. Halls, H. A. Bechtel, M. C. Martin and Y. J. Chabal, Chemical Modification Mechanisms in Hybrid Hafnium Oxo-methacrylate Nanocluster Photoresists for Extreme Ultraviolet Patterning, Chem. Mater., 2018, 30, 6192–6206 CrossRef CAS.
- J. Matthew, Surface analysis by Auger and X-ray photoelectron spectroscopy, Wiley, 2004, vol. 36 Search PubMed.
- J. Langer, M. Stano, S. Gohlke, V. Foltin, S. Matejcik and E. Illenberger, Reactions in trifluoroacetic acid (CF3COOH) induced by low energy electron attachment, Chem. Phys. Lett., 2006, 419, 228–232 CrossRef CAS.
- A. Chaker, H. R. Alty, P. Tian, A. Kotsovinos, G. A. Timco, C. A. Muryn, S. M. Lewis and R. E. P. Winpenny, Nanoscale Patterning of Zinc Oxide from Zinc Acetate Using Electron Beam Lithography for the Preparation of Hard Lithographic Masks, ACS Appl. Nano Mater., 2021, 4, 406–413 CrossRef CAS.
- Z. Geng, X. Kong, W. Chen, H. Su, Y. Liu, F. Cai, G. Wang and J. Zeng, Oxygen Vacancies in ZnO Nanosheets Enhance CO2 Electrochemical Reduction to CO, Angew. Chem., Int. Ed., 2018, 57, 6054–6059 CrossRef CAS PubMed.
- S. G. Lias, R. D. Levin and S. A. Kafafi, ‘Ion Energetics Data’ in NIST Chemistry WebBook, NIST Standard Reference Database Number 69, https://webbook.nist.gov/chemistry/guide/#ie-search, (accessed 15 April 2021) Search PubMed.
- Y. K. Kim, K. K. Irikura, M. E. Rudd, M. A. Ali, P. M. Stone, J. Chang, J. S. Coursey, R. A. Dragoset, A. R. Kishore, K. J. Olsen, A. M. Sansonetti, G. G. Wiersma, D. S. Zucker and M. A. Zukker, Electron-Impact Cross Sections for Ionization and Excitation Database, NIST Standard Reference Database 107, https://www.nist.gov/pml/electron-impact-cross-sections-ionization-and-excitation-database, (accessed 19 March 2021).
- N. S. Shuman, T. M. Miller, J. F. Friedman, A. A. Viggiano, A. I. Maergoiz and J. Troe, Pressure and temperature dependence of dissociative and non-dissociative electron attachment to CF3: Experiments and kinetic modeling, J. Chem. Phys., 2011, 135, 054306 CrossRef PubMed.
Footnote |
| † Electronic supplementary information (ESI) available: (1) A detailed description of the procedure followed to estimate the relative product yields in ESD. (2) A comparison of ESD decay curves for CO2 at 80 eV and 20 eV. (3) A complete list of vibrational band positions for Zn(TFA) and Zn(MA)(TFA). (4) RAIR spectra of Zn(TFA) and Zn(MA)(TFA) thin films before and after electron irradiation including details of the fitting procedure to obtain integral band intensities. (5) The evolution of infrared band intensities of Zn(MA)(TFA) with increasing EUV irradiation dose. See DOI: 10.1039/d1cp02334a |
| This journal is © the Owner Societies 2021 |