
 Open Access Article
 This Open Access Article is licensed under a Creative Commons Attribution-Non Commercial 3.0 Unported Licence
An experimental and master-equation modeling study of the kinetics of the reaction between resonance-stabilized (CH3)2CCHCH2 radical and molecular oxygen†
Satya P.
Joshi
,
Timo T.
Pekkanen
,
Prasenjit
Seal
 ,
Raimo S.
Timonen
and
Arkke J.
Eskola
*
,
Raimo S.
Timonen
and
Arkke J.
Eskola
*
Molecular Science, Department of Chemistry, University of Helsinki, P.O. Box 55 (A.I. Virtasen aukio 1), FIN-00014, Helsinki, Finland. E-mail: arkke.eskola@helsinki.fi
First published on 2nd August 2021
Abstract
The kinetics of the reaction between resonance-stabilized (CH3)2CCHCH2 radical (R) and O2 has been investigated using photoionization mass spectrometry, and master equation (ME) simulations were performed to support the experimental results. The kinetic measurements of the (CH3)2CCHCH2 + O2 reaction (1) were carried out at low helium bath-gas pressures (0.2–5.7 Torr) and over a wide temperature range (238–660 K). Under low temperature (238–298 K) conditions, the pressure-dependent bimolecular association reaction R + O2 → ROO determines kinetics, until at an intermediate temperature range (325–373 K) the ROO adduct becomes thermally unstable and increasingly dissociates back to the reactants with increasing temperature. The initial association of O2 with (CH3)2CCHCH2 radical occurs on two distinct sites: terminal 1(t) and non-terminal 1(nt) sites on R, leading to the barrierless formation of ROO(t) and ROO(nt) adducts, respectively. Important for autoignition modelling of olefinic compounds, bimolecular reaction channels appear to open for the R + O2 reaction at high temperatures (T > 500 K) and pressure-independent bimolecular rate coefficients of reaction (1) with a weak positive temperature dependence, (2.8–4.6) × 10−15 cm3 molecule−1 s−1, were measured in the temperature range of 500–660 K. At a temperature of 501 K, a product signal of reaction (1) was observed at m/z = 68, probably originating from isoprene. To explore the reaction mechanism of reaction (1), quantum chemical calculations and ME simulations were performed. According to the ME simulations, without any adjustment to energies, the most important and second most important product channels at the high temperatures are isoprene + HO2 (yield > 91%) and (2R/S)-3-methyl-1,2-epoxybut-3-ene + OH (yield < 8%). After modest adjustments to ROO(t) and ROO(nt) well-depths (∼0.7 kcal mol−1 each) and barrier height for the transition state associated with the kinetically most dominant channel, R + O2 → isoprene + HO2 (∼2.2 kcal mol−1), the ME model was able to reproduce the experimental findings. Modified Arrhenius expressions for the kinetically important reaction channels are enclosed to facilitate the use of current results in combustion models.
Introduction
Olefins are important fuel constituents and combustion intermediates and contribute significantly to the gross global fossil fuel consumption.1,2 Olefins contain one or more C![[double bond, length as m-dash]](https://www.rsc.org/images/entities/char_e001.gif) C double bond in their molecular structure, which results in high thermal stability under combustion conditions. This, combined with high thermal stability of radicals formed from olefins, partly explains the soot-forming propensity of olefins under fuel-rich combustion conditions.3–5 In addition to soot formation affinity, autoignition chemistry and oxidation kinetics of olefins and olefinic radicals differ significantly from those of similar-size alkanes and alkyl radicals.6 Recently, olefin flame chemistry,7–9 pyrolysis,10,11 ignition delay times,12–15 and oxidation in jet-stirred-reactor (JSR)16–18 experiments have received attention. However, little is still known experimentally about the oxidation kinetics of olefinic hydrocarbon radicals larger than allyl19,20 and methyl-vinyl21 (i.e. >C3), which can be expected to play an important role in autoignition and oxidation of real fuels under low-temperature-combustion (LTC) conditions. Real scarcity exists on kinetic oxidation experiments of allyl-type, resonance-stabilized radicals larger than 1- and 2-methylallyl radicals (i.e. >C4).22,23
C double bond in their molecular structure, which results in high thermal stability under combustion conditions. This, combined with high thermal stability of radicals formed from olefins, partly explains the soot-forming propensity of olefins under fuel-rich combustion conditions.3–5 In addition to soot formation affinity, autoignition chemistry and oxidation kinetics of olefins and olefinic radicals differ significantly from those of similar-size alkanes and alkyl radicals.6 Recently, olefin flame chemistry,7–9 pyrolysis,10,11 ignition delay times,12–15 and oxidation in jet-stirred-reactor (JSR)16–18 experiments have received attention. However, little is still known experimentally about the oxidation kinetics of olefinic hydrocarbon radicals larger than allyl19,20 and methyl-vinyl21 (i.e. >C3), which can be expected to play an important role in autoignition and oxidation of real fuels under low-temperature-combustion (LTC) conditions. Real scarcity exists on kinetic oxidation experiments of allyl-type, resonance-stabilized radicals larger than 1- and 2-methylallyl radicals (i.e. >C4).22,23
In this work, we focus on the oxidation kinetics of the allyl-type, resonance-stabilized (CH3)2CCHCH2 (2-methylbut-3-en-2-yl) radical. A potential source of this radical is a H-atom abstraction from 2-methyl-2-butene (2M2B) as well as pyrolysis and decomposition reactions of larger olefinic fuel constituents. 2M2B is a potential surrogate fuel for the combustion modeling of real fuels. As discussed by Westbrook et al.,16 under typical combustion conditions H-atom abstraction reactions of small radical species (e.g. H, O, OH, CH3, CH3OO etc.) from 2M2B is an important, if not crucial, route to initiate 2M2B oxidation. These reactions abstract H-atoms by breaking weak allylic C–H bonds (BDE ∼89 kcal mol−1) much more likely than the stronger vinylic C–H bond (BDE ∼108 kcal mol−1), resulting in production of two distinct allyl-type pentenyl radicals, as shown in Scheme 1.
 | ||
| Scheme 1 Two allyl-type pentenyl radicals, CH2(CH3)CCHCH3 and (CH3)2CCHCH2, produced via H-atom abstraction reactions from 2-methyl-2-butene (2M2B). | ||
Both these allyl-type radicals, CH2(CH3)CCHCH3 and (CH3)2CCHCH2, are resonantly stabilized. Their (and allyl-type radical RA in general) reaction with molecular oxygen (O2) has a characteristically shallow RA + O2 → RAOO barrierless association reaction well-depth (∼20 kcal mol−1![[thin space (1/6-em)]](https://www.rsc.org/images/entities/char_2009.gif) 19,24 compared to ∼40 kcal mol−1 for vinyl-type radicals25,26). This enables thermal decomposition of the RAOO adduct back to the reactants to start to compete with the forward association reaction already at relatively low temperatures, establishing the chemical equilibrium RA + O2 ⇌ RAOO. Upon increasing temperature, this may eventually lead to conditions with almost no net reaction, until a new reaction channel for the RA + O2 reaction, potentially, but not necessarily, becomes accessible at higher temperatures. For example, even at temperatures as high as 700 K, only an upper limit of 2 × 10⁻¹⁶ cm3 molecule−1 s−1 for the bimolecular rate coefficient of the CH3CHCHCH2 + O2 reaction has been measured.22 In their JSR measurements of 2M2B oxidation in the temperature range 600–1100 K and at about 1 atm pressure with residence time 1.5 s, Westbrook et al.16 observed only a little reactivity below 800 K, above which a rapid increase in the fuel consumption was observed. Under LTC conditions (500 < T < 1000 K), one may typically expect a fuel-radical + O2 reaction to constitute the major sink reaction of fuel-radical until unimolecular thermal decomposition reactions become accessible. However, in case of allyl-type radicals this is not necessarily the case (as discussed above for the CH3CHCHCH2 + O2 reaction), and for this reason kinetic oxidation experiments with still larger C5 allyl-type radicals are of great importance.
19,24 compared to ∼40 kcal mol−1 for vinyl-type radicals25,26). This enables thermal decomposition of the RAOO adduct back to the reactants to start to compete with the forward association reaction already at relatively low temperatures, establishing the chemical equilibrium RA + O2 ⇌ RAOO. Upon increasing temperature, this may eventually lead to conditions with almost no net reaction, until a new reaction channel for the RA + O2 reaction, potentially, but not necessarily, becomes accessible at higher temperatures. For example, even at temperatures as high as 700 K, only an upper limit of 2 × 10⁻¹⁶ cm3 molecule−1 s−1 for the bimolecular rate coefficient of the CH3CHCHCH2 + O2 reaction has been measured.22 In their JSR measurements of 2M2B oxidation in the temperature range 600–1100 K and at about 1 atm pressure with residence time 1.5 s, Westbrook et al.16 observed only a little reactivity below 800 K, above which a rapid increase in the fuel consumption was observed. Under LTC conditions (500 < T < 1000 K), one may typically expect a fuel-radical + O2 reaction to constitute the major sink reaction of fuel-radical until unimolecular thermal decomposition reactions become accessible. However, in case of allyl-type radicals this is not necessarily the case (as discussed above for the CH3CHCHCH2 + O2 reaction), and for this reason kinetic oxidation experiments with still larger C5 allyl-type radicals are of great importance.
In this work, we have studied the kinetics of the (CH3)2CCHCH2 (R) + O2 reaction (1) over a wide 238–660 K temperature range and at low pressures (0.2–5.7 Torr), as well as thermochemistry of the (CH3)2CCHCH2 + O2 (CH3)2CCHCH2OO reaction (1a,−1a) in a narrower temperature range using photoionization mass spectrometry.
As shown in Scheme (2), the resonance hybrid structure of the (CH3)2CCHCH2 radical is composed of two resonance structures. The association of O2 with either the terminal (t) or non-terminal (nt) radical site of the (CH3)2CCHCH2 radical generates ROO(t) and ROO(nt) adducts, respectively, conveniently denoted as (CH3)2CCHCH2OO in reaction (1a,−1a).
 | ||
| Scheme 2 Resonance structures contributing to the resonance hybrid structure of the (CH3)2CCHCH2 radical. | ||
The kinetic measurements performed in this work were focused on providing accurate bimolecular rate coefficient and equilibrium constant data of reaction (1). Subsequently, high-level quantum chemistry calculations and master equation (ME) modeling of reaction (1) were performed to complement the measured bimolecular rate coefficient and thermochemistry data.
Experimental
Experiments were performed using a laminar flow-reactor coupled with a photoionization mass spectrometer (PIMS). A thorough description of the employed PIMS apparatus has been presented previously,27 so only the specific details concerning the current measurements are discussed here.Photolysis of 1-bromo-3-methyl-2-butene or 1-chloro-3-methyl-2-butene precursor at 248 nm radiation was performed using MPB ASX-750 or Coherent COMPex 201F excimer laser, respectively, to achieve a homogeneous [(CH3)2CCHCH2] along the flow-reactor axis.
| (CH3)2CCHCH2Br + hν248 nm → (CH3)2CCHCH2 + Br | (P1a) |
| → Other products | (P1b) |
| (CH3)2CCHCH2Cl + hν248 nm → (CH3)2CCHCH2 + Cl | (P2a) |
| → Other products | (P2b) |
The measurements presented in this study were primarily conducted using the bromide precursor, while the chloride precursor, which has a higher BDE(C–Cl) compared to BDE(C–Br), was principally used to show that the kinetic results do not depend on the selected photolytic precursor. Due to the smaller absorption cross-section of (CH3)2CCHCH2Cl at 248 nm in comparison to (CH3)2CCHCH2Br, experiments using the chloride precursor required higher [(CH3)2CCHCH2Cl] and higher laser fluences [∼170 mJ cm−2] than measurements using the bromide precursor, where lower precursor concentrations and laser fluences [∼17–50 mJ cm−2] were used. We estimate that [(CH3)2CCHCH2]t=0 ≤ 3 × 1011 cm−3 in the kinetic measurements using either precursor.
Producing the same (CH3)2CCHCH2 radical by photolysing two different precursors, (CH3)2CCHCH2Br and (CH3)2CCHCH2Cl, with the same 248 nm energy photons enables to some extent testing a potential isomerization of nascent (CH3)2CCHCH2 radicals immediately after photolysis before their thermalization. Fig. 1 presents relative enthalpies (ΔH(298K)) of the various (CH3)2CCHCH2 radical isomers and the transition states (TS) connecting them as well as maximum internal energies of the radicals after 248 nm photolysis of (CH3)2CCHCH2Br and (CH3)2CCHCH2Cl precursors (full horizontal lines), all calculated at the MN15/cc-pVTZ level in this work. In a recent study by this group, Döntgen et al.24 investigated the kinetics of the CH2CHCHCH2CH3 + O2 reaction and utilized 248 nm photolysis of BrCH2CHCHCH2CH3 and ClCH2CHCHCH2CH3 precursors for radical production. They performed time-dependent density functional theory calculations for electronic excitation energies of the bromide and chloride precursors and concluded that the total vibrational excitation of the CH2CHCHCH2CH3 radical after photolysis is about 15.0 and 13.4 kcal mol−1 for the bromide and chloride precursors, respectively. Both these energies were significantly below the ∼37 kcal mol−1 energy required for the lowest-energy CH2CHCHCH2CH3 → CH3CHCHCHCH3 isomerization in the system, showing that in those experiments only one isomer was produced during photolysis. Considering the very close similarity between those and the current experiments, i.e. the same photolysis energy and especially very similar photolytic precursors (e.g. BrCH2CHCHCH2CH3vs. (CH3)2CCHCH2Br and ClCH2CHCHCH2CH3vs. (CH3)2CCHCH2Cl), we estimate that the post-photolysis vibrational excitation of the (CH3)2CCHCH2 radical is also about 15.0 and 13.4 kcal mol−1 for the bromide and chloride precursors, respectively. Both these values, which contain some uncertainty due to the above estimation, are significantly below the calculated energy of the lowest isomerization transition state, TS1 = 38.9 kcal mol−1, see Fig. 1. The experimental conditions and the results of the kinetic measurements using chlorine and bromine precursors are presented in Tables 2–4.
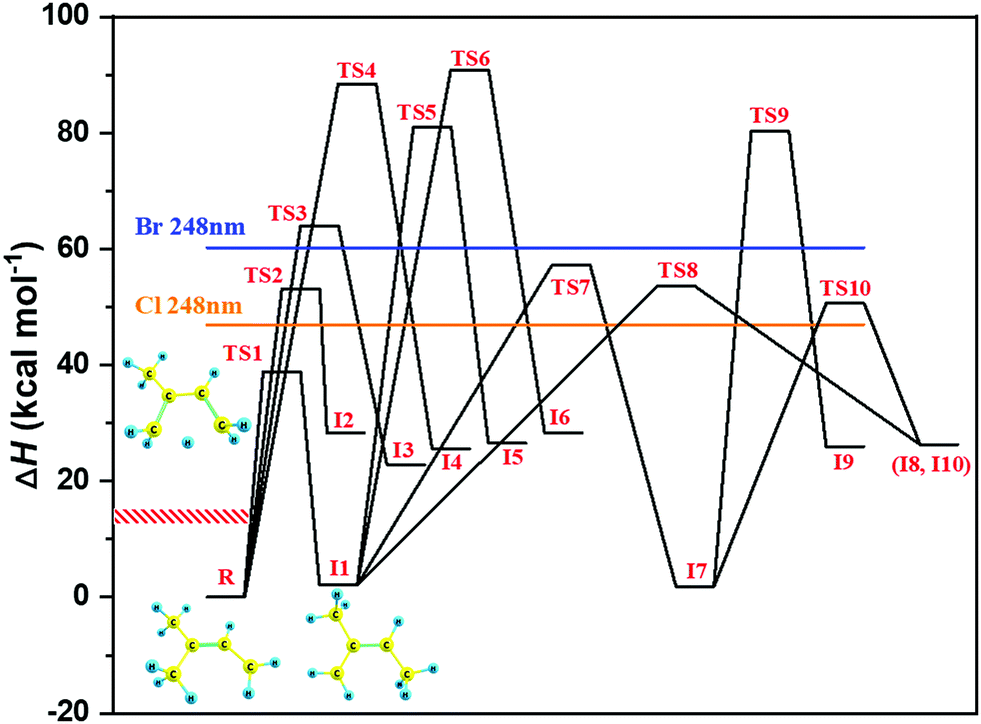 | ||
| Fig. 1 Relative enthalpies (ΔH(298K)) of the various (CH3)2CCHCH2 radical isomers and the connecting transition states (TS) calculated at the MN15/cc-pVTZ level. The colored horizontal lines represent the difference between the 248 nm photon energy and the calculated BDE of Br–C and Cl–C bonds for (CH3)2CCHCH2Br (BDE(MN15/cc-pVTZ) = 55.1 kcal mol−1) and (CH3)2CCHCH2Cl (BDE(MN15/cc-pVTZ) = 68.4 kcal mol−1) precursors, respectively. The red, shaded area shows our best estimate on excitation energy of the (CH3)2CCHCH2 radicals after photolysis of (CH3)2CCHCH2Br and (CH3)2CCHCH2Cl precursors at 248 nm wavelength, respectively. The optimized geometries and ΔH(298K) values of the stationary points are given in the ESI† (see Fig. S1). | ||
The reaction mixture flowing through the temperature-controlled flow-reactor consisted of a mainly inert bath-gas (Helium > 97%) along with radical precursor ((CH3)2CCHCH2Br < 0.02%, (CH3)2CCHCH2Cl < 0.05%) and molecular oxygen ([O2] < 3%). In the high-temperature measurements a significantly higher amount of O2 (<51%) was used. Depending upon the temperature and pressure conditions employed during the measurements, different combinations of reactor tube sizes and coatings were used (see also Tables 2–4 caption): Pyrex-glass reactor (i.d. = 1.65 cm) with polydimethylsiloxane (PDMS) or halocarbon wax (HW) coating, stainless steel reactor (i.d. = 1.7 cm or 0.8 cm) with HW coating, and quartz reactor (i.d. = 0.85 cm) with boric oxide coating. A set temperature of the reaction zone was maintained within a uniformity of ±2 K using a PID controller.
The observed kinetics of the (CH3)2CCHCH2 + O2 reaction (1) at different temperatures can be characterized as follows.
 | (1a) |
 | (1a, −1a) |
 | (1b) |
Here, reaction (1a) represents the association reaction between the (CH3)2CCHCH2 radical and O2 leading to the formation of (CH3)2CCHCH2OO adducts. This reaction is important at low temperatures, 238–298 K. Reactions (1a,−1a) are important in the intermediate temperature range (325–373 K), where adducts become thermally unstable and a kinetic equilibrium is established between the forward bimolecular (CH3)2CCHCH2 + O2 reaction and the unimolecular dissociation of (CH3)2CCHCH2OO adducts back to the reactants. Phenomenological reaction (1b) corresponds to new reaction channels that open for (CH3)2CCHCH2 + O2 reaction at high temperatures (>500 K).
Apart from the reaction with O2, two other reactions that contribute to the (CH3)2CCHCH2 radical decay under experimental conditions are heterogeneous wall losses and second order radical-radical decay processes.
 | (A) |
| R + R → Products | (B) |
The detection of the (CH3)2CCHCH2 radical decay profiles for reaction (1) was performed using the PIMS. The radiation of energy 8.44 eV from a microwave-discharge of 6% xenon in a helium-mixture with a sapphire window to cut-off higher energy photons was used to ionize (CH3)2CCHCH2 radicals present in the reaction mixture. Potential products of reaction (1b) were searched utilizing ionization radiation from a H2-lamp (discharge of H2 gas with an MgF2 window to produce radiation at around 10.2 eV). Ions formed were mass selected by a quadrupole mass spectrometer followed by the detection using an electron multiplier. Radical ion (CH3)2CCHCH2+ was detected at its parent mass at m/z = 69. A temporal ion decay signal was recorded from 10 ms before to 50 ms after each laser pulse, and accumulated for 3000–15000 repetitions before transferring to a PC for further analysis.
A nonlinear least-squares-fitting method was used for fitting the observed (CH3)2CCHCH2 radical decay profiles. For reactions (1a) and (1b) the measured radical decay profiles were fitted using the single-exponential expression:  . Here,
  is directly related to the bimolecular rate coefficients of the reaction (1a; k1a) and (1b; k1b) via relation:
  B is the background signal, and [R0] and [Rt] are proportional to the initial (t = 0) and temporal radical concentration, respectively. Under conditions where kinetic equilibrium is established, a decay profile of a resonantly stabilized radical with two non-similar resonance structures follows, in principle, a tri-exponential behavior. However, following the scheme proposed by Knyazev et al.22 for the kinetics of the CH3CHCHCH2 + O2 reaction, such tri-exponential behavior can be fitted with a bi-exponential expression, [Rt] = B + Ce−λ1t + De−λ2t, which effectively leads to averaging the kinetic behavior of the two radical sites. Subsequently, the obtained fitted parameters (i.e. C, D, λ1, λ2) are used to calculate the forward (k1a) and backward (k−1a) rate coefficients of reaction (1a,−1a) using the following equations.
 | (E1) |
| k−1a = λ1 + λ2 − (k1a[O2]) − k(R)wall − k(ROO)irr. | (E2) |
Here, k(ROO)irr. represents the rate coefficients for irreversible first-order decay processes (including heterogeneous wall losses) related to ROO adducts, and is calculated using expression (E3).
 | (E3) |
The values for equilibrium-constants (Keq) of reaction (1a,−1a) were calculated using expression (E4).
 | (E4) |
Here, the standard pressure term (P°) is introduced to the (E4) for satisfying the definition of equilibrium-constant being a dimensionless quantity. The species involved are assumed to have an ideal gas behavior and their standard states are chosen at 1 bar pressure (i.e. P° = 1 bar), at a specified temperature. R is the gas constant and NA is the Avogadro's constant.
Before use, 1-bromo-3-methyl-2-butene (Sigma-Aldrich, purity >95%) and 1-chloro-3-methyl-2-butene (Sigma-Aldrich, purity >95%) were degassed by several freeze–pump–thaw cycles. Helium (Messer-Griesheim purity of 99.9996%) and O2 (Aga, purity of 99.998%) were used as supplied.
Computational methods and master equation simulations
We used the MN15 functional28 with the Def2TZVP basis set29 to locate the stationary points on the potential energy surface (PES) of reaction (1). The same level of theory was used to determine harmonic frequencies and to perform one-dimensional hindered rotor scans (5 degree increments). The harmonic frequencies were scaled30 by a factor of 0.979 to partially account for anharmonic effects. Single-point energies were calculated for many of the stationary points at the ROHF-CCSD(T) level of theory using the cc-pVDZ, cc-pVTZ, and cc-pVQZ basis sets.31 The Hartree–Fock and correlation energies of the species were extrapolated to the complete basis set limit using relations (E5) and (E6), respectively.32,33| EHF(X) = ECBSHF + BHF e−aHFX | (E5) |
| Ecorr(X) = ECBScorr + BcorrXcorr−a | (E6) |
Here X is 2, 3, and 4 for the basis sets cc-pVDZ, cc-pVTZ, and cc-pVQZ, respectively and the ECBS, B, and a parameters are obtained by solving a system of three equations. The MN15/Def2TZVP and ROHF-CCSD(T)/CBS calculations were performed with Gaussian 16.34
Multireference methods were used to evaluate the energies of some stationary points. We used the CASPT2 method with the cc-pVTZ and cc-pVQZ basis sets. For multireference calculations, we extrapolated the complete basis set (ΔECBStotal) limit energy difference from the following relation.35
| ΔECBStotal = ΔEcc-pVQZ − ((ΔEcc-pVTZ − ΔEcc-pVQZ) × 0.69) | (E7) |
The ORCA software package (program version 4.2.0)36 was employed in these calculations using the default CASSCF/CASPT2 settings. Notably, we did not use IPEA or level shifts. In a recent publication, Zobel et al. questioned the validity of the IPEA shift.37 In their investigation of excitation energies of organic molecules, they found that the ideal value of the IPEA shift correlated both with the size of the molecule and the basis set that was being used. Thus, the idea of there being an average IPEA shift value that improves the results for most systems seems unreasonable. Furthermore, for the benchmark set they were testing, they found that using the standard IPEA shift of 0.25 resulted in poorer agreement with experiment than not using an IPEA shift. Level shifts are typically used to avoid problems with intruder states. In our calculations, reference weights were between 0.7–0.8, so intruder states should not be a problem and, therefore, level shifts are not needed. Details on active space selections are given in the results and discussion section.
In order to complement the measured bimolecular rate coefficients (k1a, k1b), ME simulations were performed on the associated PES. ME simulations were done using MESMER code (version 6.1)38 incorporating 1-D energy-grained ME treatment. Coupling between external and internal rotations can be treated classically, although potential coupling between internal rotors is not explicitly treated.
Since there are no well-defined transition states for the barrierless R + O2 → ROO association reactions,24 we used the inverse-Laplace transform (ILT) method implemented in MESMER to compute the number of states of the variational transition states. The expression MESMER transforms is the modified Arrhenius expression of the canonical (high-pressure) association reaction rate coefficient. The Arrhenius parameters in the expression can be optimized using experimental data.
 | (E8) |
Here, k∞(T) is the rate coefficient at the high pressure limit, T is temperature, and Tref (=300 K) is the reference temperature. A, m and Ea are the pre-exponential factor, modified Arrhenius parameter and activation energy, respectively. Note that since reaction (1a) is considered to be a barrierless reaction, the activation energy in (E8) is approximated to be zero (i.e. Ea = 0). Microcanonical rate coefficients are calculated using RRKM theory.
MESMER utilizes a single-exponential-down model (E9) to account for the energy transfer via collisions between bath gas (i.e. helium in our case) and modelled species.
 | (E9) |
Here, 〈ΔEdown〉 corresponds to an average energy transferred from a higher energy grain to a lower energy grain in a single collision, and is used to calculate the associated collisional energy transfer probabilities. The 〈ΔEdown,ref〉 and n are the independent parameters representing the value of 〈ΔEdown〉 at some reference temperature (Tref = 300 K) and the temperature dependence of the 〈ΔEdown〉, respectively. The Lennard-Jones (L-J) potential model was used for obtaining the collision frequencies governing the energetics of collisions between bath-gas and modelled species. The L-J parameters used for helium bath-gas and the modeled species are shown in Table 1.
| Species | ε (K) | σ (Å) |
|---|---|---|
| Helium | 10.2 | 2.55 |
| C5H9O2 intermediates | 463 | 6.53 |
We used the online resources of Cantherm40 to estimate the L-J parameters of (CH3)2CCHCH2OOH (2-methylbut-3-ene-2-peroxol) and HOO(CH3)2CCHCH2 (3-methylbut-2-ene-1-peroxol) with the Joback method. We averaged these values and assigned them to the C5H9O2 intermediates.
An energy grain size of 75 cm−1 was used in all MESMER simulations. The quantum-mechanical tunneling corrections for elementary steps involving intra-molecular H-atom transfer were modelled using Eckart potential energy barriers.
Subsequently, using the experimental data as input, MESMER optimizes the fitting parameters for the modified Arrhenius eqn (E8) (i.e. parameters A and m) and the collisional energy transfer model (i.e. parameters 〈ΔEdown,ref〉 and n), by minimizing the value of χ2(k1a(exp.) − k1a(calc.))2 using a built-in Levenberg–Marquardt fitting algorithm (non-linear least-squares fitting method). The optimized ME model may then be used to extrapolate the kinetics of reaction (1) to experimentally inaccessible temperature and pressure conditions.
Results and discussion
The results of the kinetics measurements of the (CH3)2CCHCH2 + O2 reaction (1) are categorized into low, intermediate, and high temperature region based on their kinetic behavior in the employed overall temperature range 238–660 K of the current work.Low and intermediate temperature range
As can be seen in Fig. 2, the (CH3)2CCHCH2 radical decay kinetics at 298 K and below in the low temperature range (238–298 K) is single-exponential and is governed by the forward reaction (1a), (CH3)2CCHCH2 + O2 → (CH3)2CCHCH2OO. In the intermediate temperature range (325–373 K), the dissociation of (CH3)2CCHCH2OO adducts back to reactants (reaction (−1a)) becomes increasingly important and results in the bi-exponential behavior of the observed (CH3)2CCHCH2 radical decay signals. | ||
| Fig. 2 A comparative plot for the measured (CH3)2CCHCH2 radical decay signals obtained at three different temperatures at low (238–298 K) and intermediate (325–373 K) temperature ranges, reflecting the increasing importance of (CH3)2CCHCH2OO adduct dissociation back to the reactants (via reaction (−1a)) above 298 K temperature. | ||
A typical bimolecular plot for reaction (1a) in the low temperature range is shown in Fig. 3 and the plot represents the measured pseudo-first-order rate coefficients  as a function of the employed molecular oxygen concentration, [O2].
 | ||
Fig. 3 A bimolecular plot of the (CH3)2CCHCH2 + O2 → (CH3)2CCHCH2OO association reaction (1a) measured at T = 298 K and P = 1.2 Torr. A typical (CH3)2CCHCH2 radical decay profile ( , filled circle) for reaction (1a) is shown on the lower right corner of the plot. Statistical uncertainties shown are 1σ. , filled circle) for reaction (1a) is shown on the lower right corner of the plot. Statistical uncertainties shown are 1σ. | ||
We were not able to observe a (CH3)2CCHCH2OO adduct (m/z = 101) formation signal, because ions of peroxy radicals (apart from CH3OO radical) are generally not stable and may instead dissociatively ionize to produce the parent radical ion (i.e. (CH3)2CCHCH2+ radical ion in the current case) among other products.41 For this reason, in our kinetic experiments we have utilized a low photon energy, 8.44 eV, radiation for ionization of (CH3)2CCHCH2 radical (m/z = 69) and avoided any dissociative ionization of (CH3)2CCHCH2OO adducts to the m/z = 69 of the parent radical. This can be clearly observed from Fig. 2, where the signal at m/z = 69 from the (CH3)2CCHCH2 radical measured at 298 K decays back to the baseline.
For the low temperature range experiments, the measured pressure-dependent bimolecular rate coefficients (k1a) of reaction (1a) are shown in Table 2. Experiments were mainly performed using the (CH3)2CCHCH2Br photolytic precursor. A few measurements using chloride precursor show that the measured k1a values are independent of the precursor used (i.e. (CH3)2CCHCH2Br or (CH3)2CCHCH2Cl).
| T (K) | P He (Torr) | [He]/1016 (cm−3) | [Pr]/1012 (cm−3) | [O2]/1013 (cm−3) |
|
k
(R)wallb (s−1) |
k
(R)wallc (s−1) |
k 1a/10−12 (cm3 molecule−1 s−1) |
|---|---|---|---|---|---|---|---|---|
| a Xe-lamp with a sapphire window was used for detection as well as stainless steel reactor (i.d. = 1.7 cm) with halocarbon wax coating, unless otherwise stated. b Average of the measured wall rates for the (CH3)2CCHCH2 radical. c Wall rates determined from the linear fit y-axis intercepts of the bimolecular plots for reaction (1a). d Stainless steel reactor (i.d. = 0.8 cm) with halocarbon wax coating. e 1-Chloro-3-methyl-2-butene precursor was used for the production of (CH3)2CCHCH2 radical utilizing pyrex-glass reactor (i.d. = 1.65 cm) with halocarbon wax coating. | ||||||||
| 238 | 0.22 | 0.89 | 0.30 | 2.32–6.81 | 47.9–119.2 | 5.5 ± 0.8 | 5.5 ± 1.5 | 1.70 ± 0.09 |
| 238 | 0.40 | 1.62 | 0.27 | 1.45–4.65 | 38.2–94.3 | 5.1 ± 0.9 | 5.5 ± 1.1 | 2.06 ± 0.08 |
| 238 | 0.81 | 3.29 | 0.25 | 0.95–3.01 | 33.2–79.3 | 4.0 ± 0.6 | 4.2 ± 0.7 | 2.56 ± 0.09 |
| 238d | 2.39 | 9.70 | 1.87 | 2.68–5.13 | 109.6–167.8 | 19.7 ± 1.2 | 19.8 ± 0.9 | 2.97 ± 0.13 |
| 238d | 3.66 | 14.85 | 2.99 | 2.31–5.33 | 120.3–202.1 | 21.8 ± 1.2 | 22.4 ± 2.7 | 3.55 ± 0.16 |
| 268 | 0.20 | 0.72 | 0.25 | 4.11–15.06 | 43.6–129.0 | 4.1 ± 0.8 | 4.3 ± 0.8 | 0.85 ± 0.03 |
| 268 | 0.40 | 1.44 | 0.40 | 1.63–6.82 | 19.5–76.1 | 2.2 ± 0.9 | 2.1 ± 0.4 | 1.07 ± 0.02 |
| 268 | 0.81 | 2.92 | 0.39 | 1.11–4.96 | 25.2–79.9 | 3.5 ± 0.7 | 3.5 ± 0.7 | 1.54 ± 0.06 |
| 268e | 1.21 | 4.36 | 19.4 | 4.84–10.46 | 80.3–184.0 | 8.8 ± 2.6 | 8.5 ± 2.1 | 1.62 ± 0.09 |
| 268d | 2.68 | 9.66 | 3.03 | 2.16–8.36 | 69.5–185.7 | 19.8 ± 1.2 | 21.9 ± 3.6 | 1.97 ± 0.11 |
| 268d | 4.12 | 14.85 | 3.06 | 2.55–6.06 | 86.0–160.3 | 24.3 ± 1.3 | 24.2 ± 3.0 | 2.21 ± 0.12 |
| 298 | 0.31 | 1.00 | 0.35 | 4.28–12.52 | 17.1–60.2 | 2.8 ± 0.7 | 2.5 ± 0.8 | 0.45 ± 0.02 |
| 298 | 0.60 | 1.94 | 0.32 | 2.82–12.65 | 24.0–91.7 | 4.4 ± 0.7 | 4.4 ± 0.7 | 0.67 ± 0.02 |
| 298 | 1.20 | 3.89 | 0.32 | 3.11–12.85 | 33.0–132.1 | 2.5 ± 0.6 | 2.4 ± 0.6 | 0.97 ± 0.02 |
| 298e | 1.20 | 3.89 | 16.9 | 4.55–12.28 | 53.4–134.2 | 3.7 ± 1.9 | 3.8 ± 0.7 | 1.02 ± 0.02 |
| 298d | 2.99 | 9.69 | 0.84 | 3.63–25.91 | 74.9–297.6 | 17.4 ± 1.0 | 18.4 ± 2.2 | 1.19 ± 0.08 |
| 298d | 4.57 | 14.81 | 1.68 | 4.25–11.33 | 81.1–164.7 | 15.8 ± 0.7 | 16.4 ± 2.1 | 1.40 ± 0.06 |
For the intermediate temperature range, the observed forward and backward rate coefficients of reactions (1a) and (−1a), along with respective natural logarithm of the equilibrium constants (ln(Keq)) are given in Table 3. The results of the intermediate temperature range measurements are also independent of the precursor ((CH3)2CCHCH2Br or (CH3)2CCHCH2Cl) used. The returned values of the fitting parameters associated with fitting the bi-exponential expression [Rt] = B + Ce−λ1t + De−λ2t to the decay traces are given in the ESI† (see Table S1).
| T (K) | P He (Torr) | [He]/1016 (cm−3) | [O2]/1014 (cm−3) |
k
(R)wallb (s−1) |
k
(ROO)irr.c (s−1) |
k 1a/10−14 (cm3 molecule−1 s−1) | k −1a (s−1) | ln(Keq)d |
|---|---|---|---|---|---|---|---|---|
| a Xe-lamp with a sapphire window was used for detection as well as Pyrex-glass reactor (i.d. = 1.65 cm) with polydimethylsiloxane (PDMS) coating, unless otherwise stated. b Average of the measured wall rates for the (CH3)2CCHCH2 radical. c Rate coefficients for irreversible first-order decay processes of ROO adducts, determined from the bi-exponential fit performed to the observed (CH3)2CCHCH2 radical decay profiles. d Natural logarithmic of the measured Keq values. e 1-Chloro-3-methyl-2-butene precursor was used for the production of the (CH3)2CCHCH2 radical as well as Pyrex-glass reactor (i.d. = 1.65 cm) with halocarbon wax coating. f Stainless steel reactor (i.d. = 0.8 cm) with halocarbon wax coating. | ||||||||
| 325 | 0.86 | 2.56 | 2.99 | 13.8 ± 0.3 | 15.4 ± 1.5 | 48.7 ± 6.4 | 15.0 ± 4.7 | 13.49 ± 0.34 |
| 325 | 0.86 | 2.56 | 4.83 | 14.0 ± 0.3 | 18.1 ± 1.8 | 44.8 ± 5.9 | 15.6 ± 6.4 | 13.37 ± 0.43 |
| 330 | 0.88 | 2.58 | 5.37 | 14.6 ± 0.3 | 18.8 ± 2.2 | 43.0 ± 5.6 | 21.7 ± 10.3 | 12.98 ± 0.49 |
| 335 | 0.90 | 2.59 | 4.36 | 12.3 ± 0.2 | 11.8 ± 1.1 | 35.8 ± 4.5 | 24.4 ± 5.2 | 12.67 ± 0.25 |
| 337 | 0.90 | 2.58 | 4.88 | 13.5 ± 0.3 | 15.7 ± 1.4 | 35.1 ± 4.5 | 33.3 ± 8.2 | 12.33 ± 0.28 |
| 338 | 0.91 | 2.60 | 5.17 | 17.7 ± 0.3 | 17.2 ± 1.5 | 34.1 ± 4.3 | 31.5 ± 7.8 | 12.35 ± 0.28 |
| 344 | 0.92 | 2.58 | 5.01 | 15.5 ± 0.3 | 17.7 ± 1.1 | 31.1 ± 3.9 | 49.6 ± 7.5 | 11.79 ± 0.20 |
| 348 | 0.94 | 2.61 | 5.35 | 15.0 ± 0.5 | 16.5 ± 1.1 | 26.0 ± 3.2 | 56.7 ± 7.8 | 11.47 ± 0.19 |
| 353 | 0.96 | 2.63 | 5.73 | 13.2 ± 0.5 | 20.0 ± 4.4 | 19.5 ± 3.3 | 63.2 ± 25.7 | 11.05 ± 0.44 |
| 356 | 0.96 | 2.60 | 5.22 | 12.9 ± 0.4 | 19.5 ± 1.8 | 21.8 ± 2.8 | 98.5 ± 13.9 | 10.71 ± 0.19 |
| 356e | 1.22 | 3.31 | 7.39 | 9.8 ± 2.1 | 7.4 ± 5.1 | 24.4 ± 11.3 | 100.8 ± 76.9 | 10.80 ± 1.09 |
| 358 | 0.97 | 2.62 | 6.37 | 14.6 ± 0.5 | 15.1 ± 5.9 | 21.7 ± 5.7 | 116.6 ± 66.7 | 10.54 ± 0.63 |
| 361 | 0.48 | 1.28 | 5.58 | 12.6 ± 0.3 | 20.5 ± 2.2 | 15.6 ± 3.9 | 79.5 ± 12.7 | 10.58 ± 0.30 |
| 361 | 0.96 | 2.57 | 7.17 | 13.8 ± 0.3 | 16.1 ± 1.5 | 21.3 ± 2.8 | 124.8 ± 17.8 | 10.44 ± 0.19 |
| 361e | 1.22 | 3.26 | 7.21 | 9.9 ± 2.0 | 7.9 ± 4.8 | 18.2 ± 8.1 | 116.1 ± 85.4 | 10.36 ± 1.02 |
| 361f | 3.61 | 9.66 | 6.57 | 15.9 ± 0.9 | 33.1 ± 14.9 | 13.5 ± 4.1 | 103.4 ± 67.8 | 10.17 ± 0.72 |
| 361f | 5.58 | 14.93 | 4.72 | 17.5 ± 1.1 | 39.6 ± 21.2 | 19.5 ± 7.1 | 128.5 ± 95.0 | 10.32 ± 0.82 |
| 362 | 0.97 | 2.59 | 5.20 | 12.6 ± 0.3 | 21.4 ± 2.8 | 22.3 ± 3.3 | 153.7 ± 25.7 | 10.27 ± 0.22 |
| 367 | 0.71 | 1.87 | 6.45 | 13.3 ± 0.5 | 19.2 ± 4.4 | 17.7 ± 3.9 | 167.7 ± 44.6 | 9.95 ± 0.35 |
| 373 | 0.76 | 1.97 | 4.66 | 14.2 ± 0.4 | 19.2 ± 5.9 | 21.7 ± 5.7 | 264.8 ± 71.0 | 9.67 ± 0.38 |
| 373 | 1.21 | 3.13 | 6.48 | 12.4 ± 0.5 | 20.8 ± 6.0 | 17.5 ± 3.9 | 282.2 ± 75.3 | 9.40 ± 0.35 |
The stated uncertainties of the k1a values in the low temperature range (Table 2) originate from linear fits to the data and are somewhat smaller than the uncertainties of the k1a values in the intermediate temperature range (Table 3), where the bi-exponential expression described above is fitted to the data and the stated uncertainties originate from using an error propagation method and eqn (E1). The stated uncertainties of the k−1a values in the intermediate temperature range (Table 3) are obtained using an error propagation method and eqn (E2). The uncertainties of the k−1a values are larger than those of the k1a values.
The overall uncertainty (accuracy) of the k1a values presented in Table 2 is estimated to be about ±25%. This estimation is composed of several sources of uncertainties. The above discussed fitting uncertainties are the single most important sources, while uncertainties to determine reactant concentrations and uncertainties in measuring temperature and pressure of the reaction zone also play a role. Overall uncertainties of the k1a and k−1a values in the intermediate temperature range are difficult to estimate.
High temperature range
Once the temperature is increased well above the intermediate temperature range, a new, considerably slower reaction channel appears to open for the (CH3)2CCHCH2 + O2 reaction, becoming measurable at about 500 K with the current apparatus. Bimolecular rate coefficients of the (CH3)2CCHCH2 + O2 reaction, k1b, were then measured over a temperature range of 500–660 K. The upper limit of 660 K temperature originates from the thermal stability of the (CH3)2CCHCH2Br radical precursor in the reactor. A bimolecular plot obtained for reaction (1b) is shown in Fig. 4. The measured bimolecular rate coefficients of reaction (1b) in the temperature range 500–660 K are given in Table 4. The values of k1b appear to be independent of total pressure. | ||
Fig. 4 A bimolecular plot for (CH3)2CCHCH2 + O2 → products reaction (1b), measured at T = 550 K and P = 2.92 Torr. The lower right corner of the plot presents the (CH3)2CCHCH2 radical decay profile  under conditions of the filled circle in the plot. The uncertainties shown are 1σ. under conditions of the filled circle in the plot. The uncertainties shown are 1σ. | ||
| T (K) | P He (Torr) | [He]/1016 (cm−3) | [Pr]/1012 (cm−3) | [O2]/1015 (cm−3) |
|
k
(R)wallb (s−1) |
k
(R)wallc (s−1) |
k 1b/10−15 (cm3 molecule−1 s−1) |
|---|---|---|---|---|---|---|---|---|
| a Xe-lamp with a sapphire window was used for detection as well as quartz reactor (i.d. = 0.85 cm) with boric acid coating. b Average of the measured wall rates for the (CH3)2CCHCH2 radical. c Wall rates determined from the linear fit y-axis intercepts of the bimolecular plots for reaction (1b). | ||||||||
| 501 | 2.90 | 5.59 | 1.25 | 7.41–29.17 | 72.8–120.1 | 29.6 ± 2.3 | 33.3 ± 4.1 | 2.82 ± 0.44 |
| 502 | 2.94 | 5.66 | 2.71 | 9.84–47.43 | 82.1–185.5 | 44.6 ± 1.9 | 45.0 ± 1.2 | 3.08 ± 0.14 |
| 550 | 2.92 | 5.13 | 1.31 | 6.66–28.32 | 46.6–141.3 | 19.7 ± 1.7 | 18.7 ± 2.7 | 4.23 ± 0.35 |
| 579 | 1.83 | 3.05 | 2.48 | 3.95–7.52 | 20.6–33.6 | 5.2 ± 0.4 | 5.22 ± 0.1 | 3.75 ± 0.10 |
| 660 | 5.67 | 8.30 | 4.38 | 7.26–23.28 | 56.8–103.3 | 9.1 ± 1.2 | 9.5 ± 1.9 | 4.62 ± 0.43 |
Measuring kinetics as slow as reaction (1b) with k1b ≈ 3–5 × 10⁻¹⁵ cm3 molecule−1 s−1 in this work requires significant amounts of O2 (<51% of the total reaction mixture) to be added to the reaction mixture. This results in high total pressure in the reaction zone (Ptotal < 7.8 Torr) and high oxygen content of the reaction mixture, which altogether causes high pressures in the vacuum chamber containing the quadrupole mass spectrometer (PQMS-chamber). In fact, conditions (i.e. PQMS-chamber) of the kinetic measurements of reaction (1b) were at or even beyond the upper limit of pressure that our PIMS setup can tolerate. In addition, at T > 500 K, presumably heterogeneous wall-effects started to have an influence on the measured  values, causing some additional uncertainty on the respective k1b values. There is some more discussion on this in the ESI† (see Fig. S2). Taking into account the abovementioned additional uncertainty sources at T > 500 K, including the uncertainties in the temperature and pressure measurements in the reaction zone as well as the fitting uncertainties, the overall uncertainty (=accuracy) in the k1b values presented in Table 4 is estimated to be the factor of two (upper = 2 × k1b, lower = 0.5 × k1b).
Measurements were also conducted to detect possible products of reaction (1b). Our quantum chemistry calculations (see next section), suggest isoprene (m/z = 68) + HO2 (m/z = 33) to be the major product channel of reaction (1b). Our PIMS apparatus is unable to detect HO2 radical, mainly due to its high ionization energy IE(HO2) ≈ 11.4 eV.42 Utilizing H2-lamp for ionization radiation, a product formation signal was observed at m/z = 68, see Fig. 5. However, a fast, almost immediate product formation signal at m/z = 68 was observed also in the absence of [O2], originating, almost certainly, from the photolysis of the radical precursor (CH3)2CCHCH2Br. For this reason, two consecutive measurements were performed, the first one in the absence and the second one in the presence of O2, see Fig. 5(a). The signal without O2 was then subtracted from the signal with O2 present, giving a product formation signal at m/z = 68 originating only from reaction (1b), see Fig. 5(b). The product formation signal at m/z = 68 was fitted using the expression  where, It(P+) is the temporal product ion signal and I0(P+) the signal value for the channel yield × [R]0 as t → ∞. The term
  was treated as an independent parameter and the fitting process returned the value
  see the fit in Fig. 5(b). This value agrees well within the stated 1σ-uncertainty with the
  value obtained from fitting the corresponding (CH3)2CCHCH2 radical decay profile shown in Fig. 5(c). This shows that under utilized pseudo-first-order conditions, signal at m/z = 68 originates from reaction (1b). As already mentioned, high values of PQMS-chamber reduces detection sensitivity of the PIMS apparatus, which is evident from the product ion signals presented in the Fig. 5.
 | ||
Fig. 5 The product formation and corresponding radical decay profiles for the (CH3)2CCHCH2 + O2 → products reaction (1b), measured at T = 501 K, P = 2.9 Torr. The top most panel (a) depicts the product ion formation signals observed at m/z = 68. The filled blue and red circles represent the product ion formation signals when [O2] = 0 cm−3 and 2.2 × 1016 cm−3, respectively. The middle panel (b) shows the difference between the product ion formation signals observed at [O2] = 2.2 × 1016 cm−3 and [O2] = 0 cm−3. The corresponding (CH3)2CCHCH2 radical decay profile measured at [O2] = 2.2 × 1016 cm−3 is shown on the bottom panel (c). is shown on the bottom panel (c). | ||
The measured values of k1b exhibit weak, positive temperature dependence. Current results show that in the temperature range of 500–660 K, the k1b values are in the range of (2.82–4.62) × 10−15 cm3 molecule−1 s−1. These values are comparable to the bimolecular rate coefficient k(753 K) = 3.49 × 10⁻¹⁵ cm3 molecule−1 s−1 measured by Baldwin et al.23 for the kinetics of the CH2CHCHCH2CH3 + O2 → CH2 = CHCH = CHCH3 + HO2 reaction channel at 753 K, and about 10 times faster than an upper-limit of bimolecular rate coefficient of the CH3CHCHCH2 + O2 reaction measured at 700 K by Knyazev et al.22 In addition, current results are an order of 103 times faster than the bimolecular rate coefficient measured for allyl-radical + O2 reaction at a temperature of 673 K.20 We are not aware of any previous measurements of bimolecular rate coefficients of the (CH3)2CCHCH2 + O2 reaction.
The Arrhenius plot for the forward bimolecular rate coefficients of the (CH3)2CCHCH2 + O2 reaction, k1a and k1b, measured in this work at the overall temperature range of (238–660) K, is presented in Fig. 6. This plot is both striking and revealing. It shows that in both the low- and intermediate temperature ranges the (CH3)2CCHCH2 + O2 reaction shows negative temperature and positive pressure dependence and is faster than the allyl + O2 reaction19 but comparable to the CH2CHCHCH2CH3 + O2 reaction24 at 298 K. Upon increasing temperature to about 500 K, the rate coefficient of the (CH3)2CCHCH2 + O2 reaction decreases by almost two orders of magnitude. The temperature dependence also changes from negative to positive and the rate coefficient becomes pressure-independent. Next, we use computational methods to better understand the kinetics and mechanism behind the observed behavior of the (CH3)2CCHCH2 + O2 reaction.
 | ||
| Fig. 6 An Arrhenius-type plot for the bimolecular rate coefficients of the (CH3)2CCHCH2 + O2 reaction (1) measured in this work. The presented dataset encompasses the employed temperature range of 238–660 K and bath-gas pressures 0.2–5.7 Torr, respectively. Filled and blank circles indicate the experiments conducted using brominated ((CH3)2CCHCH2Br) and chlorinated ((CH3)2CCHCH2Cl) photolytic precursors, respectively. | ||
Quantum chemistry
The results of our quantum chemical calculations along with the geometries of the stationary points of reaction (1) are provided in the ESI† (Tables S2 and S3). Based on the MN15/Def2TZVP energies, reaction channels that have barriers over 12 kcal mol−1 (relative to the reactants R + O2) were omitted from additional analysis as kinetically unimportant. The remaining channels were further investigated with the ROHF-CCSD(T)/CBS method. It was discovered that the lowest energy reaction channel leads to the formation of 2-methylbut-1,3-diene (isoprene) and hydroperoxyl radical from the non-terminal peroxyl radical (ROO(nt)) by concerted elimination. At slightly higher energy appears the reaction channel that leads to the (2R/S)-3-methyl-1,2-epoxybut-3-ene and hydroxyl radical. However, both of these channels have barriers that are over 6 kcal mol−1 above the energy of the reactants. With barriers this high the experimental high-temperature rate coefficients would be under-predicted by several orders of magnitude. We were quite certain we had managed to locate all the important reaction channels, so we started to question the accuracy of our ROHF-CCSD(T)/CBS calculations. To check whether multi-reference methods would need to be used, we recalculated the energetics of the low-energy reaction channels with the CASPT2/CBS method. Note that the T1 diagnostics were generally acceptable for the kinetically important transition state structures (below 0.03). The details of the CASPT2 calculations are given separately for each reaction channel.ROO(nt) → CH2C(CH3)CHCH2 + HO2 (P1)
This is a single-step reaction where isoprene + HO2 products are formed from ROO(nt) by concerted elimination (see Fig. 8). Similar to the ROHF-CCSD(T)/CBS calculations, CASPT2/CBS calculations predict this channel to have the lowest reaction barrier. ROHF-CCSD(T)/CBS calculations have a barrier of 26.3 kcal mol−1 above the energy of the ROO(nt). CASPT2/CBS calculations with a 13,11 active space reduce the barrier to 22.8 kcal mol−1. The active space consists of the lone electron pairs of the oxygen atoms (4,2), the bonding and anti-bonding C–O and O–O σ orbitals (4,4), the bonding and anti-bonding π orbitals of the CC bond (2,2), the radical orbital on the terminal oxygen atom (1,1), and the bonding and anti-bonding electron orbitals of the C–H bond where the hydrogen is abstracted (2,2). The CASPT2 barrier is 3.5 kcal mol−1 lower in energy than the ROHF-CCSD(T) one and is much more consistent with the experimental observations. However, we cannot rule out that this is fortuitous. Nonetheless, an energy difference this large between the CASPT2 and ROHF-CCSD(T) calculations is interesting, especially since the T1 diagnostic (0.029) would suggest that a single-reference approach should be appropriate. It is possible that there is a concerted elimination channel from the terminal peroxyl radical (ROO(t)) that produces isoprene in its cis-form. We were, however, unable to locate the transition state structure for such a process, but we cannot rule out its existence.
ROO(t) → CH2C(CH3)CH(O)CH2 + HO (P3)
This is a two-step reaction. First ROO(t) internally abstracts a hydrogen from an allylic position (see Fig. 8). Then the oxygen bonded to a carbon atom reacts with the allylic system to form a C–O σ-bond. As this happens, the O–O σ-bond is broken. The final products are (2R/S)-3-methyl-1,2-epoxybut-3-ene and hydroxyl radical (P3). Two possible transition state structures were found for the hydrogen abstraction which are not rotamers. The ROHF-CCSD(T) calculations set these transition state structures 23.9 kcal mol−1 and 24.0 kcal mol−1 above the energy of the peroxyl radical and the T1 diagnostics are acceptable, 0.024 and 0.022. For the latter step, the transition state structure is 19.6 kcal mol−1 above the energy of the peroxyl radical, although the T1 diagnostic is already moderately high, 0.041. The CASPT2 calculations with a 9,9 active space reduce the relative energies to 22.1 and 22.2 kcal mol−1 (hydrogen abstraction transition state structures) and 12.4 kcal mol−1 (ring-forming/OH eliminating transition state structure). The active space consists of the bonding and anti-bonding C–O and O–O σ-orbitals (4,4), the bonding and anti-bonding π-orbitals of the CC bond (2,2), the radical orbital on the terminal oxygen atom (1,1), and the bonding and anti-bonding C–H σ-orbital of the hydrogen that is abstracted (2,2). The lone pair electron orbitals of the oxygens are almost fully occupied and were left out of the active space. The hydrogen abstraction reactions are the kinetic bottleneck and the CASPT2 calculations reduce the barriers by around 2 kcal mol−1. However, the CASPT2 and ROHF-CCSD(T) energies are within the expected uncertainties of these methods. For the latter transition structure, CASPT2 reduces the energy by over 7 kcal mol−1. This is already a significant change, although somewhat expected as the T1 diagnostic is moderately high (0.041).
Five-membered ring channel (products P4 and P6)
This reaction channel proceeds by either the terminal (ROO(t)) or non-terminal (ROO(nt)) peroxy-radical reacting internally with the carbon–carbon double bond to form a five-membered ring (see Fig. 8). The O–O bond then breaks and either propan-2-one and 1,2-epoxyethyl P4 or methanal and 2-methyl-1,2-epoxyprop-1-yl P6 are formed. The ring-forming transition state structures have acceptable T1 diagnostics (<0.03) and ROHF-CCSD(T) calculations predict the barriers 27–31 kcal mol−1 above the energy of ROO(nt). Only preliminary ROHF-CCSD(T) calculations were performed for the ring-breaking transition state structures because the T1 diagnostics are above 0.05. CASPT2 calculations reduce the relative energies of the ring-forming transition structures by 2–3 kcal mol−1. The CASPT2 relative energies for the ring-breaking transition state structures are 27.0 kcal mol−1 P4 and 25.5 kcal mol−1 P6, respectively. An active space of 7,7 was used in these calculations. The orbitals are the bonding and anti-bonding O–O and C–O σ orbitals (4,4), the bonding and anti-bonding π orbitals of the CC bond (2,2), and the radical orbital on the terminal oxygen atom (1,1). Again, we observe that CASPT2 calculations reduce the barrier heights. This reaction channel has barriers that are several kcal mol−1 higher in energy than the (P1) channel and is not expected to be kinetically important.
Four-membered ring channel (products P2, P4, P6, P7)
The peroxyl radicals can react with the double bond also to form four-membered rings, which can subsequently form products by either breaking the O–O or the C–C bond (see Table S2, ESI†). In these reactions multi-reference behavior was more apparent and ROHF-CCSD(T) calculations were not carried out systematically. A 9,9 active space was chosen to explore the energetics of these reactions. The orbitals are the bonding and anti-bonding O–O and C–O orbitals (4,4), the bonding and anti-bonding π orbitals of the CC bond (2,2), the radical orbital on the terminal oxygen atom (1,1), and the bonding and anti-bonding orbitals of the C–C bond that is present in the four-membered ring. As one would expect, the barriers in the four-membered ring channel are noticeably higher in energy than the barriers in the five-membered ring channel and for this reason the four-membered ring channel is not expected to be kinetically important.
We observe that CASPT2 calculations systematically predict lower barriers in comparison to ROHF-CCSD(T) calculations. Significant reductions in barrier heights are observed even in cases where the T1 diagnostic suggest that a single-reference method is suitable. The obvious question is which energies should we trust? The ROHF-CCSD(T) method produces more reliable results when a single-reference approach is suitable, and for the many important transition state structures the T1 diagnostics suggest that such an approach is suitable. However, we are confident in our experimental findings, which strongly suggest that the ROHF-CCSD(T) energies (barriers) are too high and that the CASTP2 energies are more reasonable. If the CASPT2 energies are indeed more correct, it may indicate that the T1 diagnostic alone is a less reliable measure of the multi-reference character present in the studied species. Although we are more inclined to trust the CASPT2 energies, we cannot entirely rule out the possibility that the ROHF-CCSD(T) energies are reliable, in which case we have simply failed to locate low-energy reaction channel(s). For ME simulations, we decided to use ROHF-CCSD(T) energies for the peroxyl radicals (ROO(t), ROO(nt) well-depths) and for the products. CASPT2 energies are used for everything else. To simplify the simulations, we left out all reaction channels with a barrier higher than 8 kcal mol−1 above the energy of the reactants.
ME simulation results
As discussed in the experimental section, under conditions where kinetic equilibrium is established (e.g. reactions (1a) and (−1a)), a decay profile of a resonance-stabilized radical with two non-similar resonance structures follows, in principle, a tri-exponential behavior, but can be fitted with a double-exponential expression. This double-exponential fit yields “average” values for the forward and reverse rate coefficients and can be used to compute an “average” equilibrium constant value. Such results of the double-exponential fits to the measured radical decays at an intermediate temperature range are given in Table 3. However, our quantum chemistry calculations revealed that the ROO(t) well depth is around 2.5 kcal mol−1 more shallow than the ROO(nt) well depth. Simulations further revealed that at 325 K, the lowest temperature of our equilibrium constant measurements, the equilibrium population of the ROO(t) is already below 3% (i.e. [ROO(t)]/([ROO(t)] + [ROO(nt)]) < 0.03). Therefore, the kinetic traces measured in the intermediate temperature range (325–373 K) can be described almost entirely by the kinetic behavior of the R + O2 ⇌ ROO(nt) reaction channel.In our modeling effort, we first used our experimental low- and intermediate-temperature kinetic data to obtain the optimal values for the ROO well-depths as well as for both the exponential-down collision energy transfer (E9) and modified Arrhenius expression (E8) parameters. For the barrierless association reaction channels R + O2 ⇌ ROO(t) and R + O2 ⇌ ROO(nt), MESMER returned the following modified Arrhenius expressions at the high-pressure limit (Ea in (E8) was set = 0):  and
and  , respectively. The optimized 〈ΔEdown〉 parameters are presented by the following expression:
  . See also Table 5 for these values. For helium bath-gas, the obtained 〈ΔEdown〉 parameters (i.e. 〈ΔEdown,ref〉 = 166 cm−1, n = 0.1), lies within their typical limits.38
| 〈ΔEdown,ref〉 (cm−1) | n | A R + O2 ⇌ ROO(t) (cm3 molecule−1 s−1) | A R + O2 ⇌ ROO(nt) (cm3 molecule−1 s−1) | m R + O2 ⇌ ROO(t) | m R + O2 ⇌ ROO(nt) |
|---|---|---|---|---|---|
| 166 | 0.1 | 1.17 × 10⁻¹² | 2.34 × 10⁻¹² | (−1.06) | (−1.04) |
In the fitting process, the energy difference between ROO(nt) and ROO(t) well-depths was constrained to remain equal to the energy difference obtained from ROHF-CCSD(T)/CBS calculations. The fitted ROO well-depths are 0.72 kcal mol−1 shallower than the computed ones, but are within estimated computational uncertainty (∼1 kcal mol−1).
As shown in Fig. 7, the measured values of average ln(Keq) at the intermediate temperature range are plotted alongside the calculated channel-specific ln(Keq) values of reaction channels R + O2 ⇌ ROO(t) and R + O2 ⇌ ROO(nt). For a given temperature range, MESMER uses NASA-polynomials for generating the temperature dependent standard thermodynamic quantities, such as standard enthalpy (H°)T, entropy (S°)T and Gibbs free energy (G°)T, for different reaction species. These standard thermodynamic quantities are then used for calculating the ln(Keq) values for each reaction channel independently. The thermodynamic MESMER output file contains the standard thermodynamic quantities of a particular species in their zero-point energy corrected form e.g. . This enables us to locate the changes in the calculated channel specific ln(Keq) values with respect to the fitted ROO well-depths. Interestingly, the more shallow ROO(nt) and ROO(t) well-depths (by 0.72 kcal mol−1 each) returned by the fitting process, give the ln(Keq) values for reaction channel R + O2 ⇌ ROO(nt) that are equivalent to the measured average ln(Keq) values, see Fig. 7. This strongly suggests that the kinetic traces measured in the intermediate temperature range are almost entirely due to the R + O2 ⇌ ROO(nt) reaction channel.
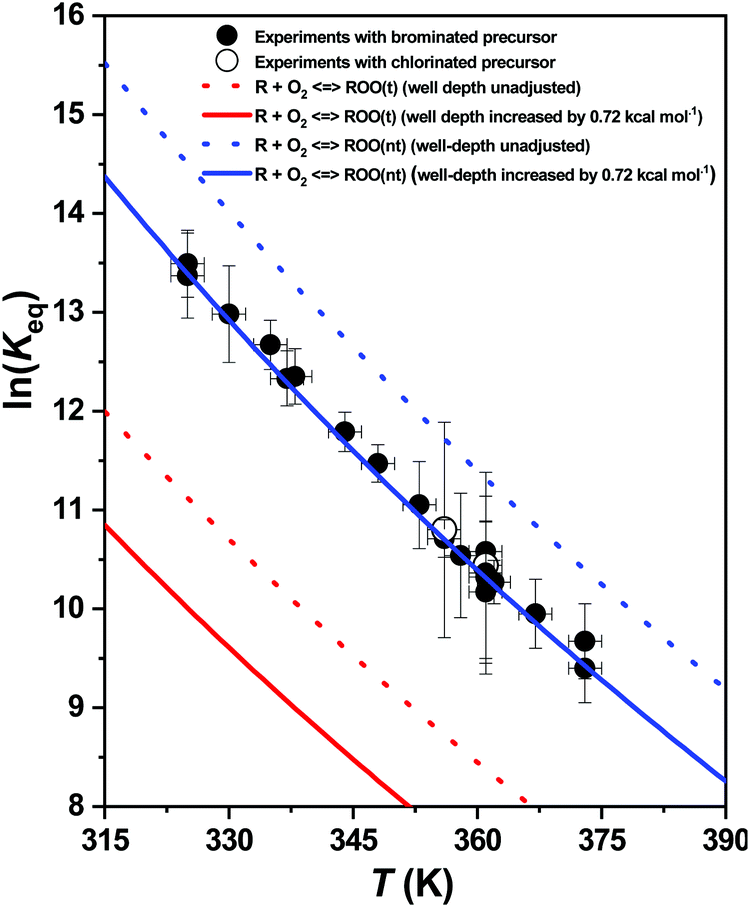 | ||
| Fig. 7 The ln(Keq) values of the R + O2 ⇌ ROO reactions (1a,−1a), R = (CH3)2CCHCH2, plotted as a function of temperature. Experimental results are given as symbols and computational MESMER results as lines. Filled and blank circles indicate the experiments conducted with brominated ((CH3)2CCHCH2Br) and chlorinated ((CH3)2CCHCH2Cl) precursors, respectively. | ||
Incorporating 0.72 kcal mol−1 (shallower) correction to the ROO(nt) and ROO(t) well-depths provides the standard reaction enthalpies  for reaction channels R + O2 ⇌ ROO(t) and R + O2 ⇌ ROO(nt) to be (−17.1) kcal mol−1 and (−20.0) kcal mol−1, respectively.
The potential energy profile utilized in the ME simulations of reaction (1), already including the 0.72 kcal mol−1 correction to the ROO well-depths, is shown in Fig. 8. The product energies are from ROHF-CCSD(T)/CBS calculations and all the other energies, apart from the ROO well-depths, are from CASPT2 calculations.
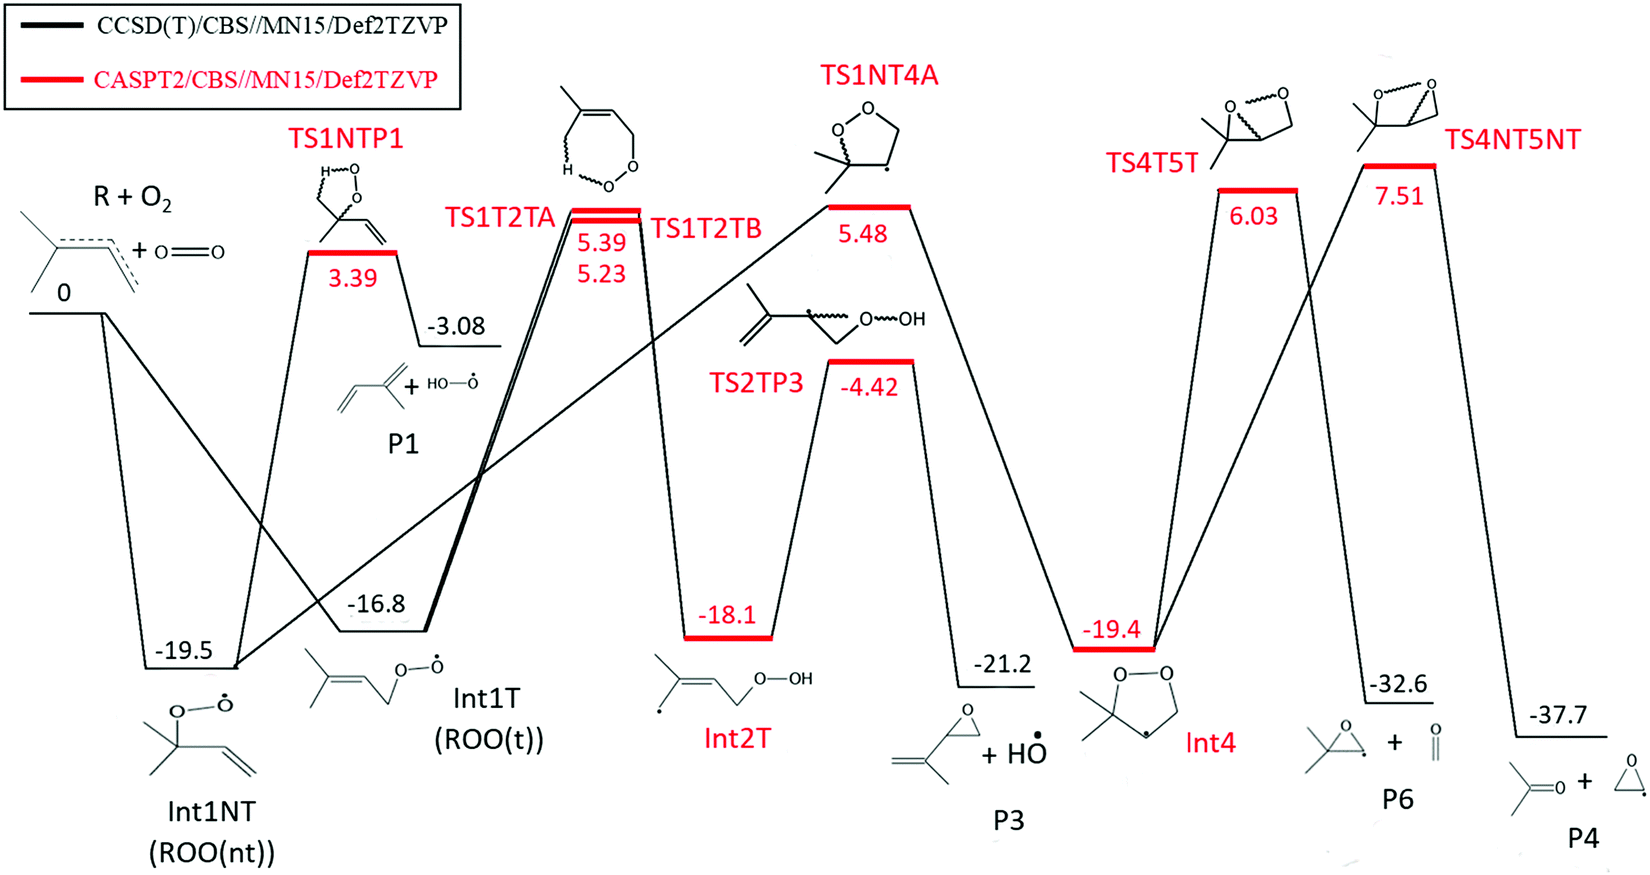 | ||
| Fig. 8 The simplified potential energy profile for the R + O2 ⇌ reaction (R = (CH3)2CCHCH2) used in our ME simulations. Energies are in kcal mol−1. The reported Int1T (ROO(t)) and Int1NT (ROO(nt)) energies include the correction of 0.72 kcal mol−1. The rest of the energies are either from ROHF-CCSD(T)/CBS//MN15/Def2TZVP or CASPT2/CBS//MN15/Def2TZVP calculations. The optimized geometries, T1 diagnostic values and single point energies of the stationary points are given in the ESI† (see Tables S2–S3). | ||
Measured bimolecular rate coefficients of reaction (1a) at three temperatures along with the results of constrained ME simulations performed over a wide pressure range are shown in Fig. 9. As can be seen, a reasonably good agreement with the experimental results is obtained.
 | ||
| Fig. 9 The bimolecular rate coefficients of reaction (1a), R + O2 → ROO(t,nt), R = (CH3)2CCHCH2, plotted as a function of pressure at three temperatures. The symbols depict the experimental results and the lines show the results of ME simulations. The optimized modified Arrhenius equation parameters at the high-pressure limit and 〈ΔEdown〉 parameters are shown on the lower right corner. Filled and blank circles indicate the experiments conducted with brominated ((CH3)2CCHCH2Br) and chlorinated ((CH3)2CCHCH2Cl) precursors, respectively. | ||
While the constrained ME model is able to reproduce the experimental kinetic data in the low-temperature range, the simulated bimolecular rate coefficients in the high-temperature range are a factor of 5–9 times lower than the respective experimental k1b values. To remedy this, we lowered the barrier height of transition state (TS1NTP1) associated with the kinetically most dominant channel R + O2 → isoprene + HO2 by ∼2.2 kcal mol−1. This adjustment is within the expected uncertainty of the CASPTP2/CBS calculations.
During our ME simulations, we discovered that under most pressure conditions there is a one-to-one correspondence between an eigenvalue λ1 and the high-temperature bimolecular rate coefficients k1b at T > 450 K. This correspondence was checked at different temperatures and pressures by manually performing single-exponential fits to simulated decay profiles. Similarly, we also observed that an eigenvalue λ2 corresponds to the bimolecular rate coefficients measured in the low temperature range (T < 300 K). The pressure and temperature dependent behavior of λ1 and λ2 is illustrated in Fig. 10. Interestingly, under extremely low pressure conditions (P ∼ 1 × 10⁻⁷ bar) there is a nearly seamless transition from λ1 to λ2 upon increasing temperature. Above this pressure, there exists a narrow transition region (∼300–450 K) where the kinetic behavior of the system cannot be described by a single eigenvalue. In this region multi-dimensional decays are observed.
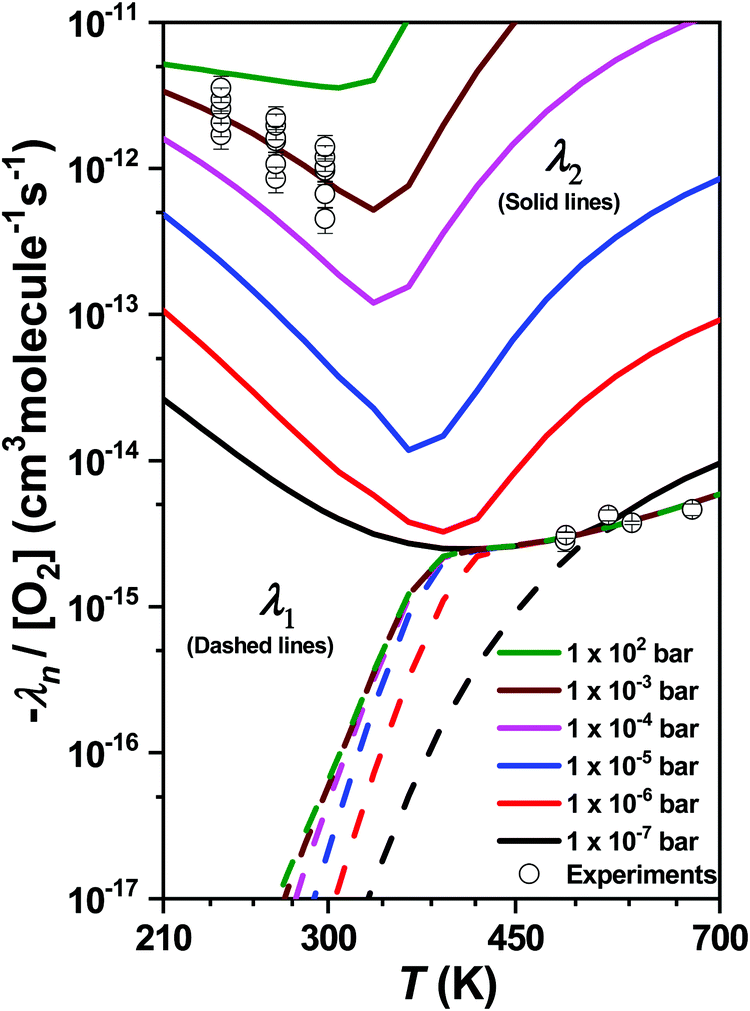 | ||
| Fig. 10 The chemically significant eigenvalues λ1 (dashed lines) and λ2 (solid lines) plotted as a function of temperature and pressure. The symbols depict results of the measurements. ROO(t) and ROO(nt) well-depths were shallowed by ∼0.72 kcal mol−1 each and the barrier height for the transition state (TS1NTP1) associated with channel R + O2 → isoprene + HO2 (P1) was lowered by ∼2.2 kcal mol−1. | ||
We multiply −λ1/[O2] with the calculated branching ratios of different product channels to obtain channel-specific bimolecular rate coefficients at T > 450 K. Arrhenius fits were then performed to obtain the results in a form that is usable in autoignition and combustion models. The channel specific Arrhenius fit parameters are reported in Table 6.
| Reaction channel (T = 450–2000 K) |
|
||
|---|---|---|---|
| A (cm3 molecule−1 s−1) | m | E a (kcal mol−1) | |
| TS1NTP1 lowered by ∼2.2 kcal mol−1 | |||
| R + O2 → P1 | 1.46 × 10⁻¹⁹ | 1.71 | 0.78 |
| Transition states unadjusted | |||
| R + O2 → P1 | 2.87 × 10⁻²⁰ | 1.91 | 2.46 |
| R + O2 → P3 | 2.09 × 10⁻²⁸ | 3.76 | −2.53 |
| R + O2 → P4 | 3.56 × 10⁻¹⁸ | 0.79 | 7.02 |
| R + O2 → P6 | 3.18 × 10⁻¹⁸ | 0.77 | 5.51 |

The Arrhenius expressions of Table 6 fit closely the results of ME simulations of bimolecular reaction channels leading to products P1, P3, P4, and P6, which are shown in Fig. 11(a). Among all the channels studied in this work, (CH3)2CCHCH2 + O2 → isoprene + HO2 (P1) is overwhelmingly the dominating one with a yield >91% or so without any adjustment to the stationary-point energies. This corroborates our assignment of product formation signal observed at m/z = 68 (see Fig. 5) originating from isoprene. The second most important channel is (2R/S)-3-methyl-1,2-epoxybut-3-ene + OH (P3) with yield <8%. In Fig. 11(b), the ME simulated k1b values obtained for different channels are compared to the current experimental k1b values. Clearly, an adjustment to stationary-point energy, here to TS1NTP1, is required to reach agreement with the experimental results. Also shown in Fig. 11(b) are the bimolecular rate coefficients of the (CH3)2CCHCH2 + O2 → isoprene + HO2 (P1) reaction channel used by Westbrook et al.16 in their kinetic modeling study of 2M2B oxidation. Apparently, the current ME simulated k1b values obtained for the respective (CH3)2CCHCH2 + O2 → P1 reaction channel only intersect with the results of Westbrook et al. at around T ∼ 1600 K, and diverge sharply for temperatures above and especially below 1600 K. The MESMER input file ((CH3)2CCHCH2.xml) used for ME modeling is available in the ESI.†
 | ||
| Fig. 11 The graph (a) shows the results of ME simulations of different product channels of reaction k1b (solid lines) as well as their respective Arrhenius fits (dashed lines) given in Table 6. The graph (b) depicts the same results of ME simulations as in (a), compared with our experimental k1b values (symbols). The graph (b) also shows the rate-coefficients of the (CH3)2CCHCH2 + O2 → isoprene + HO2 (P1) bimolecular reaction channel estimated by Westbrook et al.16 in their 2M2B oxidation study. | ||
Probably the main outcome of the current, combined experimental and theoretical study of the allylic C5 radical reaction (CH3)2CCHCH2 + O2 is that larger (>C4) allylic radicals seem to be more reactive with respect to O2 under low-temperature combustion (LTC) conditions (T < 1000 K) than is currently believed. However, more work is certainly needed on oxidation kinetics of allylic radicals under LTC conditions to better understand their effects on autoignition behavior of fuel–air mixtures containing alkenes. Similar to this work, investigating oxidation kinetics of different allylic C5 (and larger) radical isomers experimentally (and theoretically) over a wide temperature range would be valuable. Also, it would be highly useful to have photolysis-initiated product studies of alkene oxidation experiments available that have been performed under LTC conditions.
Conclusion
In this work, we have performed the first direct kinetic measurements of the (CH3)2CCHCH2 + O2 reaction over a wide temperature range (238–660 K) at low pressures (0.2–5.7 Torr) using photoionization mass spectrometry. Under combustion conditions, the (CH3)2CCHCH2 radical (R) may be produced in H-atom abstraction reactions from 2-methyl-2-butene ((CH3)2CCHCH3) or in decomposition reactions of larger olefinic fuel constituents. The resonance-stabilized (CH3)2CCHCH2 radical has terminal and non-terminal radical sites available for association with molecular oxygen (O2), resulting in the formation of ROO(t) and ROO(nt) adducts, respectively. At low temperatures (238–298 K), the kinetics of reaction (1) is governed by the R + O2 → ROO adduct formation, exhibiting a typical negative temperature and positive pressure dependence behavior. At the intermediate temperatures (325–373 K), kinetics of equilibrium R + O2 ⇌ ROO reaction is measured and experimental equilibrium constant ln(Keq) values are determined. Master equation (ME) simulations and concomitant CCSD(T) and CASPT2 potential energy profile calculations of reaction (1) were performed to support experimental observations. After making a modest adjustment to the ROO(t) and ROO(nt) well-depths (∼0.7 kcal mol−1 each), the ME model was able to reproduce the R + O2 kinetics measured at low and intermediate temperatures. Interestingly, simulations reveal that the kinetics of the R + O2 ⇌ ROO equilibrium reaction measured at intermediate temperature ranges is almost entirely dominated by the R + O2 ⇌ ROO(nt) reaction channel. Probably the most important outcome of the current work was the observation and subsequent measurements of significantly faster kinetics of the R + O2 reaction (1) at high temperatures than combustion models currently expect. The measured bimolecular rate coefficients k1b = (2.8–4.6) × 10−15 cm3 molecule−1 s−1 in the range 500–660 K are pressure-independent and exhibit a weak positive temperature dependence. ME simulations were also performed to calculate kinetics at high temperatures. However, without any corrections to the calculated stationary point energies, ME simulations of the R + O2 reaction suggest about a factor of 5–9 times slower kinetics than the measured k1b values. The ME simulations suggest isoprene (2-methylbut-1,3-diene) + HO2 to be the major product channel of the (CH3)2CCHCH2 + O2 reaction (1) at high temperatures. In the kinetic experiments, a product formation signal was observed at m/z = 68, which was assigned to originate from isoprene. After a reasonable correction (∼2.2 kcal mol−1) to the CASPT2 energy of the transition-state pertaining to the channel R + O2 → isoprene + HO2, a good agreement between the respective ME simulated k1b values and the measured k1b values is observed.Conflicts of interest
There are no conflicts to declare.Acknowledgements
S. P. J. and A. J. E. acknowledge support from the Academy of Finland, grant numbers 294042, 319353, 325250, and 288377. P. S. acknowledges support from the BiofCFD project of the INNO INDIGO ERA-Net S&T Energy 2016 bio-based energy program funded by the Academy of Finland, grant number 311967. T. T. P. acknowledges support from the Doctoral Programme in Chemistry and Molecular Sciences of the University of Helsinki. The authors wish to acknowledge the CSC-IT Center for Science, Finland, for computational resources.References
- D. Y. Goswami and F. Kreith, Handbook of Energy Efficiency and Renewable Energy, CRC Press, Boca Raton, 2007 Search PubMed.
- D. M. Alonso, J. Q. Bond, J. C. Serrano-Ruiz and J. A. Dumesic, Green Chem., 2010, 12, 992–999 RSC.
- S. C. Moldoveanu, Pyrolysis of Organic Molecules: Applications to Health and Environmental issues. Elsevier, Amsterdam, 2009 Search PubMed.
- C. K. Law, Combustion Physics, Cambridge University Press, Cambridge, 2010 Search PubMed.
- I. Glassman, R. A. Yetter and N. G. Glumac, Combustion, Academic Press, Cambridge, 5th edn, 2014 Search PubMed.
- C. K. Westbrook, M. Mehl, W. J. Pitz and M. Sjöberg, Combust. Flame, 2017, 175, 2–15 CrossRef CAS.
- L. Ruwe, K. Moshammer, N. Hansen and K. Kohse-Höinghaus, Combust. Flame, 2017, 175, 34–46 CrossRef CAS.
- L. Ruwe, L. Cai, K. Moshammer, N. Hansen, H. Pitsch and K. Kohse–Höinghaus, Combust. Flame, 2019, 206, 411–423 CrossRef CAS.
- K. Moshammer, L. Seidel, Y. Wang, H. Selim, S. M. Sarathy, F. Mauss and N. Hansen, Proc. Combust. Inst., 2017, 36, 947–955 CrossRef CAS.
- S. S. Nagaraja, J. Liang, S. Dong, S. Panigrahy, A. Sahu, G. Kukkadapu, S. W. Wagnon, W. J. Pitz and H. J. Curran, Combust. Flame, 2020, 219, 456–466 CrossRef CAS.
- S. S. Nagaraja, G. Kukkadapu, S. Panigrahy, J. Liang, H. Lu, W. J. Pitz and H. J. Curran, Int, J. Chem. Kinet., 2020, 52, 964–978 CrossRef CAS.
- C.-W. Zhou, Y. Li, U. Burke, C. Banyon, K. P. Somers, S. Ding, S. Khan, J. W. Hargis, T. Sikes, O. Mathieu, E. L. Petersen, M. AlAbbad, A. Farooq, Y. Pan, Y. Zhang, Z. Huang, J. Lopez, Z. Loparo, S. S. Vasu and H. J. Curran, Combust. Flame, 2018, 197, 423–438 CrossRef CAS.
- C.-W. Zhou, Y. Li, E. O'Connor, K. P. Somers, S. Thion, C. Keesee, O. Mathieu, E. L. Petersen, T. A. DeVerter, M. A. Oehlschlaeger, G. Kukkadapu, C.-J. Sung, M. Alrefae, F. Khaled, A. Farooq, P. Dirrenberger, P.-A. Glaude, F. Battin-Leclerc, J. Santner, Y. Ju, T. Held, F. M. Haas, F. L. Dryer and H. J. Curran, Combust. Flame, 2016, 167, 353–379 CrossRef CAS.
- W. K. Metcalfe, W. J. Pitz, H. J. Curran, J. M. Simmie and C. K. Westbrook, Proc. Combust. Inst., 2007, 31, 377–384 CrossRef.
- F. Arafin, A. Laich, E. Ninnemann, R. Greene, R. K. Rahman and S. S. Vasu, Int, J. Chem. Kinet., 2020, 52, 739–751 CrossRef CAS.
- C. K. Westbrook, W. J. Pitz, M. Mehl, P.-A. Glaude, O. Herbinet, S. Bax, F. Battin-Leclerc, O. Mathieu and E. L. Petersen, J. Bugler and H. J. Curran, J. Phys. Chem. A, 2015, 119, 7462–7480 CrossRef CAS PubMed.
- X. Meng, A. Rodriguez, O. Herbinet, T. Wang and F. Battin-Leclerc, Combust. Flame, 2017, 181, 283–299 CrossRef CAS.
- F. Battin-Leclerc, A. Rodriguez, B. Husson, O. Herbinet, P.-A. Glaude, Z. Wang, Z. Cheng and F. Qi, J. Phys. Chem. A, 2014, 118, 673–683 CrossRef CAS PubMed.
- M. P. Rissanen, D. Amedro, A. J. Eskola, T. Kurten and R. S. Timonen, J. Phys. Chem. A, 2012, 116, 3969–3978 CrossRef CAS PubMed.
- Z. H. Lodhi and R. W. Walker, J. Chem. Soc., 1991, 87, 2361–2365 CAS.
- S. P. Joshi, T. T. Pekkanen, R. S. Timonen, G. Lendvay and A. J. Eskola, J. Phys. Chem. A, 2019, 123, 999–1006 CrossRef CAS PubMed.
- V. D. Knyazev and I. R. Slagle, J. Phys. Chem. A, 1998, 102, 8932–8940 CrossRef CAS.
- R. R. Baldwin, J. P. Bennett and R. W. Walker, J. Chem. Soc., 1980, 76, 2396–2412 CAS.
- M. Döntgen, T. T. Pekkanen, S. P. Joshi, R. S. Timonen and A. J. Eskola, J. Phys. Chem. A, 2019, 123, 7897–7910 CrossRef PubMed.
- C. F. Goldsmith, L. B. Harding, Y. Georgievskii, J. A. Miller and S. J. Klippenstein, J. Phys. Chem. A, 2015, 119, 7766–7779 CrossRef CAS PubMed.
- X. Chen and C. F. Goldsmith, J. Phys. Chem. A, 2017, 121, 9173–9184 CrossRef CAS PubMed.
- A. J. Eskola and R. S. Timonen, Phys. Chem. Chem. Phys., 2003, 5, 2557–2561 RSC.
- S. Y. Haoyu, X. He, S. L. Li and D. G. Truhlar, Chem. Sci., 2016, 7, 5032–5051 RSC.
- F. Weigend and R. Ahlrichs, Phys. Chem. Chem. Phys., 2005, 7, 3297–3305 RSC.
- Database of Frequency Scale Factors for Electronic Model Chemistries (Version 3 Beta 2), https://comp.chem.umn.edu/freqscale/version3b2.htm, accessed June 2020.
- T. H. Dunning, Chem. Phys., 1989, 90, 1007–1023 CAS.
- A. Halkier, T. Helgaker, P. Jrgensen, W. Klopper and J. Olsen, Chem. Phys. Lett., 1999, 302, 437–446 CrossRef CAS.
- T. Helgaker, W. Klopper, H. Koch and J. Noga, J. Chem. Phys., 1997, 106, 9639–9646 CrossRef CAS.
- M. J. Frisch, G. W. Trucks, H. B. Schlegel, G. E. Scuseria, M. A. Robb, J. R. Cheeseman, G. Scalmani, V. Barone, G. A. Petersson, H. Nakatsuji, X. Li, M. Caricato, A. V. Marenich, J. Bloino, B. G. Janesko, R. Gomperts, B. Mennucci, H. P. Hratchian, J. V. Ortiz, A. F. Izmaylov, J. L. Sonnenberg, D. Williams-Young, F. Ding, F. Lipparini, F. Egidi, J. Goings, B. Peng, A. Petrone, T. Henderson, D. Ranasinghe, V. G. Zakrzewski, J. Gao, N. Rega, G. Zheng, W. Liang, M. Hada, M. Ehara, K. Toyota, R. Fukuda, J. Hasegawa, M. Ishida, T. Nakajima, Y. Honda, O. Kitao, H. Nakai, T. Vreven, K. Throssell, J. A. Montgomery, Jr., J. E. Peralta, F. Ogliaro, M. J. Bearpark, J. J. Heyd, E. N. Brothers, K. N. Kudin, V. N. Staroverov, T. A. Keith, R. Kobayashi, J. Normand, K. Raghavachari, A. P. Rendell, J. C. Burant, S. S. Iyengar, J. Tomasi, M. Cossi, J. M. Millam, M. Klene, C. Adamo, R. Cammi, J. W. Ochterski, R. L. Martin, K. Morokuma, O. Farkas, J. B. Foresman and D. J. Fox, Gaussian16, Revision A.03, Gaussian, Inc., Wallingford, CT, 2016 Search PubMed.
- A. Halkier, T. Helgaker, P. Jørgensen, W. Klopper, H. Koch, J. Olsen and A. K. Wilson, Chem. Phys. Lett., 1998, 286, 243–252 CrossRef CAS.
- F. J. Neese, Wiley Interdiscip. Rev.: Comput. Mol. Sci., 2012, 2, 73–78 CAS.
- J. P. Zobel, J. J. Nogueira and L. González, Chem. Sci., 2017, 8, 1482–1499 RSC.
- D. R. Glowacki, C.-H. Liang, C. Morley, M. J. Pilling and S. H. Robertson, J. Phys. Chem. A, 2012, 116, 9545–9560 CrossRef CAS PubMed.
- B. E. Poling, J. M. Prausnitz and J. P. O’Connell, The Properties of Gases and Liquids, McGraw-Hill, New York, 5th edn, 2001 Search PubMed.
- C. W. Gao, J. W. Allen, W. H. Green and R. H. West, Comput. Phys. Commun., 2016, 203, 212–225 CrossRef CAS.
- G. Meloni, P. Zou, S. J. Klippenstein, M. Ahmed, S. R. Leone, C. A. Taatjes and D. L. Osborn, J. Am. Chem. Soc., 2006, 128, 13559–13567 CrossRef CAS PubMed.
- L. G. Dodson, L. Shen, J. D. Savee, N. C. Eddingsaas, O. Welz, C. A. Taatjes, D. L. Osborn, S. P. Sander and M. Okumura, J. Phys. Chem. A, 2015, 119, 1279–1291 CrossRef CAS PubMed.
Footnote |
| † Electronic supplementary information (ESI) available: The optimized geometries and ΔH(298K) values of the stationary points associated with the isomerization of (CH3)2CCHCH2 radical, bi-exponential fitting parameters for intermediate temperature range measurements, determination of experimental uncertainty in the high-temperature range measurements, energies of the stationary points associated with reaction (1) along with their T1 diagnostic values and optimized geometries, and the MESMER input file ((CH3)2CCHCH2.xml), are provided in the electronic supplementary information. See DOI: 10.1039/d1cp02210e |
| This journal is © the Owner Societies 2021 |