DOI:
10.1039/D1CP02202D
(Perspective)
Phys. Chem. Chem. Phys., 2021,
23, 19964-19986
Breakdown of the Stokes–Einstein relation in supercooled water: the jump-diffusion perspective†
Received
18th May 2021
, Accepted 6th September 2021
First published on 6th September 2021
Abstract
Although water is the most ubiquitous liquid it shows many thermodynamic and dynamic anomalies. Some of the anomalies further intensify in the supercooled regime. While many experimental and theoretical studies have focused on the thermodynamic anomalies of supercooled water, fewer studies explored the dynamical anomalies very extensively. This is due to the intricacy of the experimental measurement of the dynamical properties of supercooled water. Violation of the Stokes–Einstein relation (SER), an important relation connecting the diffusion of particles with the viscosity of the medium, is one of the major dynamical anomalies. In absence of experimentally measured viscosity, researchers used to check the validity of SER indirectly using average translational relaxation time or α-relaxation time. Very recently, the viscosity of supercooled water was accurately measured at a wide range of temperatures and pressures. This allowed direct verification of the SER at different temperature-pressure thermodynamic state points. An increasing breakdown of the SER was observed with decreasing temperature. Increasing pressure reduces the extent of breakdown. Although some well-known theories explained the above breakdown, a detailed molecular mechanism was still elusive. Recently, a translational jump-diffusion (TJD) approach has been able to quantitatively explain the breakdown of the SER in pure supercooled water and an aqueous solution of methanol. The objective of this article is to present a detailed and state-of-the-art analysis of the past and present works on the breakdown of SER in supercooled water with a specific focus on the new TJD approach for explaining the breakdown of the SER.

Vikas Dubey
| Vikas Dubey completed his MSc in Chemistry from C.S.J.M. University, Kanpur, India. He joined the Department of Chemistry, Indian Institute of Technology Patna, India in 2017 as a Junior Research Fellow under the supervision of Dr Snehasis Daschakraborty. Currently, he is a Senior Research Fellow (SRF). His research interests mainly focused on the role of translational jump-diffusion in supercooled water and other related systems. |

Shivam Dueby
| Shivam Dueby completed his MSc in Chemistry from Aligarh Muslim University, India. He joined the Department of Chemistry, Indian Institute of Technology Patna, India in 2018 as a Junior Research Fellow under the supervision of Dr Snehasis Daschakraborty. Currently, he is a Senior Research Fellow (SRF). His research interest is mainly focused on the dynamics of glass-forming liquids. |

Snehasis Daschakraborty
| Snehasis Daschakraborty is an Assistant Professor in the Department of Chemistry, Indian Institute of Technology Patna, India. He received his PhD from the S. N. Bose National Center for Basic Sciences (Jadavpur University), Kolkata in 2014. His broad area of research is on the molecular dynamics of liquids and biomolecules. He has been working on topics like the breakdown of the Stokes–Einstein relation in supercooled water, adaptation of cell membrane in extremophiles, permeation of nanoparticles across a lipid membrane, hydrophobic interaction in supercooled water, etc. He was a recipient of the INSA Medal for the Young Scientists Award 2020 for his works in the dynamics of supercooled water. He has been elected as a member of The National Academy of Science, India (M. N. A. Sc.) in 2021. Other details about his research group can be found at https://www.sdmdlab-iitp.com/. |
1. Introduction
Water is the most ubiquitous liquid, and is involved in many chemical, biological, and geological processes. Despite being a common liquid, water shows many anomalous behaviors, some of which further intensify on cooling below freezing point and attaining the supercooled regime.1–15 Occurrence of the density maximum at 4 °C and rapid variation of different thermodynamic response functions, such as isothermal compressibility, thermal expansion coefficient, heat capacity, etc. with decreasing temperature are some of the thermodynamic anomalies of supercooled water. Since liquid water remains thermodynamically less stable than ice in the supercooled regime, it is difficult to perform experiments on supercooled water. However, with the advancement of experimental techniques, it has been possible to perform various experiments in supercooled water and provide new insights.
Many researchers investigated the origin of the thermodynamic anomalies in supercooled water over the last few decades.5–7,16–23 Different theories were proposed to explain the anomalies.16,24–33 One of the first approaches was the “stability-limit conjecture” (SLC),34–36 which aimed at explaining the anomalies by presenting a unified thermodynamic understanding. The SLC approach proposed that unlike in simple liquid, where the liquid spinodal (emerging from the liquid–vapor critical point) continues to decrease steadily into the negative pressure region with decreasing temperature in a temperature-pressure (T–P) phase diagram, the liquid spinodal for supercooled water returns to positive pressure after it intersects the “temperature of maximum density” (TMD) line. The divergence of fluctuations at the spinodal can explain the rapid increase of the thermodynamic response functions upon cooling. Another proposed explanation is the liquid–liquid critical point (LLCP) hypothesis, in which the anomalous properties of supercooled water are explained in terms of the first-order liquid–liquid phase transitions.16,17,24,30,31,37–40 Below the LLCP temperature there exists two distinct phases of water: low-density liquid (LDL) and high-density liquid (HDL). Beyond the LLCP these two states become indistinguishable. In another two-state model picture, water was assumed to be a mixture of two inter-convertible states: low-density state (LDS) and high-density state (HDS).41–45 The singularity-free approach (SFA)32 and the critical-point-free (CPF)33,46 approaches were also utilized to explain some anomalies of supercooled water. While the CPF approach is an alternative form of the LLCP hypothesis with the critical point at large negative pressure, the SFA scenario is distinguished by the sharp but nondivergent maxima in the response functions at different temperatures. In the SFA scenario, there is no liquid–liquid transition.47
Unlike the thermodynamic anomalies, the dynamic anomalies were not extensively studied in experiments. This is because of the intricacy of performing experiments revealing the dynamics of supercooled water. However, recent experiments have been probing dynamical anomalies, such as increasing diffusion and decreasing viscosity under compression,48 crossover from fragile-to-strong liquid dynamics,48–53 and earlier decoupling of self-diffusion from viscosity upon cooling.54 Although it is being quite a while since the self-diffusion coefficient, the rotational and translational relaxation times were measured at different T–P state points, quantitative estimation of the viscosity coefficient was done only recently.48 The viscosity of supercooled water was measured down to 239 K temperature and up to 300 MPa pressure. At a given temperature, the viscosity starts decreasing with increasing pressure, reaches a minimum, and then increases. While at ambient temperature the minimum is rather shallow, the depth increases with decreasing temperature. An extension of the two-state model,45 which explained the thermodynamic anomalies, was able to describe the dynamical properties: self-diffusion, viscosity, and rotational correlation time accurately at different T–P state points.48 This also explained the dynamical crossover from fragile-to-strong liquid behavior in a reasonable accuracy.
The presence of accurate measurement of viscosity and self-diffusion coefficients of supercooled water at different T–P state points allows checking the validity of the Stokes–Einstein relation (SER), an important relationship for understanding the nature of molecular diffusion in liquid.48,54 Since the SER was derived from Einstein's theory of Brownian motion, it assumes the applicability of Einstein's model of diffusion. The absence of accurate viscosity coefficients restricted researchers to verify the SER by studying the coupling between the average translational relaxation time and the self-diffusion coefficient of supercooled water.55–61 This is an indirect way of checking the validity of SER. The direct verification has been performed relatively recently with the accurately measured viscosities at different T–P state points.48,54 Several computer simulation studies have also focused on the validity of the SER in supercooled water and provided deep molecular insights into it.62,63 The existing theories for explaining the thermodynamic anomalies of supercooled water were modified and used to explain the dynamic anomalies.48 Although these theories explained the above breakdown, a detailed molecular mechanism was still elusive. Recently, our group has been able to explain quantitatively the breakdown of SER using the translational jump-diffusion (TJD) approach.64–66 In this approach, the translational jump-diffusion coefficient, which emanates from the translational jump (large amplitude displacement) of the molecules and contributes a part of the total diffusion, is calculated using a quantitative fashion. Interestingly, the remaining part of the diffusion stays coupled to the viscosity of the medium reasonably strongly in the supercooled water.
The objective of this article is to present a detailed and state-of-the-art analysis of the breakdown of SER in supercooled water. Since a vast literature is present on the same topic in supercooled liquid in general, this perspective is limited to supercooled water. Following is the organization of the remainder of this article. The origin of SER is detailed in Section 2. Section 3 summarizes the findings of prior studies focusing on the validity of SER in supercooled water. In Section 4 we have presented the TJD approach and its application in some systems to explain the breakdown of SER. The concluding remarks and the future scope are presented in Section 5.
2. The derivation and approximations of the SER
The derivation of SER was presented earlier.67–70 Here, we summarize the key steps and approximations involved. The differential form of Einstein's diffusion equation for the translational motion of a Brownian particle can be written as,| |  | (1) |
The above equation comes from the combination of Fick's law of diffusion and the continuity equation. Here, ρ(r,t) is the position (r) and time (t)-dependent density and D is the self-diffusion coefficient of the Brownian particle. ρ(r,t) is solved to obtain the following expression for the motion in three dimensions,| |  | (2) |
Eqn (2) can be used to calculate the mean square displacement (MSD) 〈r2(t)〉 = 6Dt, where “〈![[thin space (1/6-em)]](https://www.rsc.org/images/entities/char_2009.gif) 〉” symbols represent ensemble average. Eqn (2) shows how the density distribution in space changes with time. The Gaussian nature of ρ(r,t) as a function of position r at a given time t comes from the stochastic approximation. Now, we write the Langevin equation,
〉” symbols represent ensemble average. Eqn (2) shows how the density distribution in space changes with time. The Gaussian nature of ρ(r,t) as a function of position r at a given time t comes from the stochastic approximation. Now, we write the Langevin equation,| |  | (3) |
where m is the mass of the particle, ξ is the frictional coefficient, and F(t) is the random force that originates from the continuous collision of the Brownian particle with neighboring solvent particles. F(t) has the following characteristics: (i) F(t) is independent of velocity and the time-averaged value is zero 〈F(t)〉 = 0, and (ii) F(t) varies faster in comparison to the velocity of the particles. Solving eqn (3) for 〈r2(t)〉 and using the Einstein's equation at long time limit, 〈r2(t)〉 = 6Dt (for diffusion in three dimensions), one obtains,| |  | (4) |
In eqn (4), ξ is assumed to be the friction on a spherical object of radius R with a stick hydrodynamic condition. Stokes law of friction provides the following equation for ξ:In eqn (5), η is the viscosity of the medium. From eqn (4) and (5), we get the following expression of the SER,For the diffusion of a Brownian particle, the above SER is also written as| | | D ∝ T/η or Dη/T = constant | (7) |
The unavailability of accurate viscosity data does not allow using eqn (7). Instead, the average translational relaxation time 〈τT〉 or the α-relaxation time τα is used to indirectly check the validity of SER by checking the constancy of (DτT/T) or (Dτα/T) with respect to temperature. This is based on the assumption that both 〈τT〉 and τα are linearly proportional to η. We will come back to this point in Section 3.2.
We now summarize the key approximations involved in the derivation of SER. A clear idea about the approximations would help in figuring out the cause of the breakdown of SER. (i) Stokes' law of friction is a hydrodynamic law that is applicable for diffusing particles much larger compared to solvent particles. (ii) The medium is structurally and dynamically homogenous to maintain the continuum nature. For example, the local viscosity, experienced by the diffusing particle, should be the same as the overall viscosity of the medium. (iii) In each step, the diffusing particles translate by a small distance. (iv) The trajectories of diffusing particles are uncorrelated and stochastic over long times. These assumptions principally restrict the usage of the SER in real scenarios. However, SER remains valid in many systems where such approximation(s) do not fully hold. There are a large number of systems where the severe breakdown of SER is observed. Supercooled water is one of them. Many experimental and simulation studies observed the breakdown in supercooled water and investigated the possible mechanism. We review these studies in the next section.
3. Verification of the SER in supercooled water and explanations
3.1 Indirect verification of SER
In this section, we will review studies that focused on the verification of SER by checking the constancy of (DτT/T) or (Dτα/T) with respect to temperature in the absence of viscosity data. Chen et al.55 reported the translational self-diffusion coefficient D and the average translational relaxation time τT of water in the temperature range 190–280 K using NMR and quasi-elastic neutron scattering (QENS) experiments, respectively. Note that it has not been possible to keep bulk water liquid below the homogeneous nucleation temperature (TH). (The TH value of water at atmospheric pressure is something in between 230 and 238 K.71–75) Below TH, water inevitably crystallizes to ice.76,77 Therefore, the singular temperature TS (228 K at atmospheric pressure), at which the power-law divergence is seen in thermodynamic properties, is inaccessible. When the glassy form of water is heated above 135 K (the glass transition temperature TG at atmospheric pressure) the glass-to-liquid phase transition occurs to form highly viscous liquid water, which crystallizes again at TC ≈150 K.77–79 Therefore, in between TC and TH, water does not exist in liquid form. This region is called the “no man's land”.17 Chen et al.55 bypassed the above problem by supercooling water confined in one-dimensional hydrophilic silica pores, a suitable approach to study supercooled water below TH.80–84 The Arrhenius plots of D and τT are presented in Fig. 1, where the transition from fragile (non-Arrhenius temperature dependence) to strong (Arrhenius temperature dependence) liquid is observed at ∼225 K. They also checked the validity of the SER for the entire range of temperature. An increasing breakdown of the SER was observed with decreasing temperature, as presented in Fig. 2. This breakdown is different on two sides of the fragile-to-strong dynamical transition point.
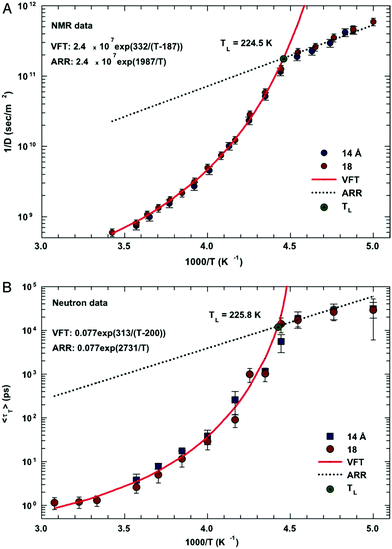 |
| | Fig. 1 The temperature dependence of the inverse of self-diffusion coefficient of water and its average translational relaxation time. (A) For the fully hydrated MCM-41-S samples with diameters of 14 and 18 Å, the inverse of the self-diffusion coefficient of water D was measured by NMR as a function of 1/T in a log-linear scale. The solid line denotes the fit of the data to a VFT relation. The short dotted line denotes the fit to an Arrhenius law with the same prefactor 1/D0. (B) The average translational relaxation time 〈τT〉 obtained from QENS spectra in the same experimental conditions of the NMR experiment as a function of 1/T. The dashed line denotes the VFT law fit, and the dotted line denotes the Arrhenius law fit with the same prefactor τ0. The values of fitting parameters are shown. Reprinted from ref. 55. Copyright (2006) National Academy of Sciences, U.S.A. | |
 |
| | Fig. 2 The quantity D 〈τT〉/T as a function of T. Dots and squares represent its values coming from the experimental data of D and τT in samples with diameters of 14 and 18 Å, respectively. The dotted line represents the same quantity obtained by using the fitting values obtained from the data reported in Fig. 1. Reprinted from ref. 55. Copyright (2006) National Academy of Sciences, U.S.A. | |
The MD simulation of the TIP5P model of water immediately supported the above experimental observation on the breakdown of the SER in supercooled water.58 An increasing breakdown of the SER was observed in the simulation as the diffusion D decouples from the α-relaxation time τα. There is a strong effect of pressure also.58Fig. 3a shows how the extent of the decoupling decreases with increasing pressure. This study proposed that the decoupling is somehow linked to the Widom line,85–89 a hypothetical line emanates from the LLCP16 and extends through TW, the temperature at which the specific heat capacity is maximum. The simulated Dτα/T lines for different pressures merge when the variable T is replaced by T–TW at a given pressure.58 The collapse is shown in Fig. 3b. A similar collapse was found for the temperature-dependent cluster size of the mobile molecules. Therefore, the breakdown of the SER in supercooled water was connected to the crossing of the Widom line associated with the liquid–liquid phase transition.
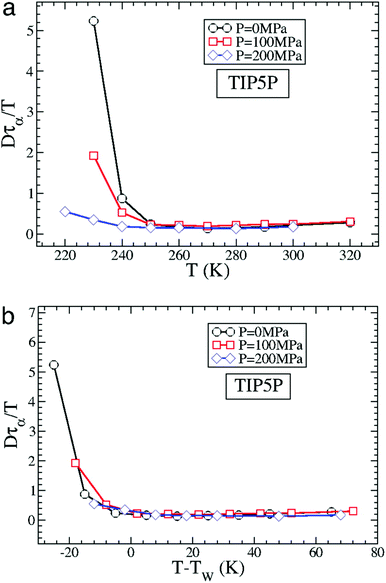 |
| | Fig. 3 How is the SER breakdown at low pressures correlated with the Widom line. (a) Dτα/T as a function of T for P = 0 MPa, 100 MPa, and 200 MPa for the TIP5P model. Here, τα is the α-relaxation time. For all panels, Dτα/T is scaled by its high T value to facilitate the comparison of the different systems. (b) Dτα/T as a function of T–TW(P) for TIP5P. The curves for different pressures overlap on the same master curve when T is replaced by T–TW(P). Adopted with permission from ref. 56. Copyright (2007) National Academy of Sciences, U.S.A. | |
Some separate simulation studies of ST2 and SPC/E models of water provided an interesting insight into the breakdown of SER.57,59 These studies considered two subsets of water molecules: one is highly mobile, and the other has the least mobility. The validities of SER and the Stokes–Einstein–Debye relation (SEDR) for these two separate subsets were checked. (The SEDR connects rotational diffusion with the viscosity of the medium.) Interestingly, both the relations did not hold at low temperatures for both the subsets. This contradicted the notion that the breakdowns of SER and SEDR originate only from the highly mobile molecules. An increasing decoupling between translational and rotational diffusion was found to be similarly strong in both subsets. To make a connection between the dynamical heterogeneities and breakdown of SER and SEDR, the time-dependence of the two relations was studied. Interestingly, both the translation-rotation decoupling and the breakdowns of SER and SEDR are strongest at a time scale corresponding to the end of the cage regime, when diffusion starts. Note that the dynamical heterogeneity is also maximum at the same time scale. This connects the breakdowns of the SER and SEDR with the dynamical heterogeneity of the medium.
Later, the mode-coupling theory-based calculation was performed.61 Also, the study suggested that the violations of SER in the fragile liquid occur differently from that in the strong liquid region. It is worth mentioning that the fragile-to-strong transition of liquid water, observed by Chen et al.,55 was also criticized in many articles.90 Several works explained the above transition in terms of the finite-size effects, which decide the transition from liquid-like motion to localized motion near the glass transition temperature as observed in other nonaqueous glass-forming liquids.91–96 It was argued that confinement can heavily influence the viscosity-controlled relaxation process at low temperatures. Several other groups questioned the analyses of Chen et al. and showed that the possibility of having the fragile-to-strong transition of water at the protein interface depends on the accuracy of the data analysis.97–100 This debate continued attracting researchers to investigate the dynamical anomalies of supercooled water in greater detail.
A combined experiment and simulation study further investigated the microscopic origin of the breakdown of SER in supercooled water.60 The diffusion coefficient starts following a fractional SER with structural relaxation time (D ∼ (〈τT〉/T)−ζ; ζ ≈ 3/5) below 290 K. To understand the origin of this breakdown, FTIR spectra were analyzed to see the effect of temperature on the water OH-stretch over a temperature decreasing from 350 to 200K. The results demonstrated that water forms low-density structure at lower temperature and therefore the breakdown of the SER in water may arise from the variation of the local water structure. An interesting explanation was given by Bagchi and coworkers using a two-state model of water: 5-coordinated high-density water and 4-coordinated low-density water.101,102 They observed that the propagation of the 5-coordination defect occurs in a string-like path, the length of which increases with decreasing temperature. The propagation pathway resembles the Glarum defect.103 The coordination number of the water molecules on the path is changed from 4 to 5 and then reverses back to 4 again. In this process, the tagged water molecule rotates by large angular jump following the Laage–Hynes jump mechanism.104,105 The propagating defect gives rise to dynamical heterogeneity, which may be responsible for the breakdown of SER.
The LLCP and two-state model explanations of SER breakdown were seriously challenged by a study at high temperatures and pressures. The breakdown of both the SER and the SEDR were observed in a “hot liquid” state of water at 400 K and different pressures, ranging up to 3 GPa, the melting point of ice VII.106 While the diffusion decreases and the viscosity increases with increasing pressure, the rate of reduction of diffusion decreases above 1 GPa pressure. This causes the breakdown of the SER. This result challenged the proposed theory, such as the LLCP hypothesis, two-state model, dynamic heterogeneity, etc., for the breakdown of SER in supercooled water.
3.2 Direct verification of SER
Despite many studies provided important insights into the validity of the SER in supercooled water, these were somewhat indirect verifications. This is because of the usage of the average translational relaxation time 〈τT〉 or the α-relaxation time τα in place of the viscosity η. This is based on the assumption that the above relaxation times are linearly proportional to the viscosity η. Although 〈τT〉 is often coupled with η, there are many reports where this coupling does not strictly hold.107,108 Therefore, it needs critical scrutiny and verification of the proportionality of 〈τT〉 with η before using 〈τT〉 in the SER.
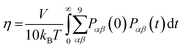
Given this, it was suggestive to measure the viscosity of supercooled water and directly check the validity of SER. Dehaoui et al.54 measured the viscosity of water most accurately at different temperatures down to 238 K. Using the literature diffusion coefficient109 and single molecular rotation time110 the authors checked the validities of SER and SEDR, respectively. As shown in Fig. 4, the SER increasingly breaks down with decreasing temperature while the SEDR remains valid in a wider range of temperatures. Unlike the usual glass formers, which show the breakdown of the SER only below 1.3 Tg,111–117 for water the breakdown starts below 2.1 Tg. In a follow-up experiment, Singh et al.48 measured the viscosity at different T–P thermodynamic state points. As the pressure increases at a constant temperature, the viscosity of water varies through a minimum value. The diffusion coefficient, on the other hand, varies through the maximum at a particular pressure. The locations of the above two extrema are sensitive to temperature. On reducing the temperature from 300 to 240 K, the location of the viscosity minimum shifts towards higher pressure (from 80 MPa to 160 MPa) and the location of the diffusion maximum shifts from 100 MPa to 180 MPa pressure.48 These are the dynamic anomalies, which were explained by the dynamic extension of the thermodynamic two-state model of water.41,45,118 From the available diffusion and viscosity data at different T–P state points the impact of pressure on the SER was also checked. The increasing pressure reduces the extent of breakdown of the SER at low temperatures.
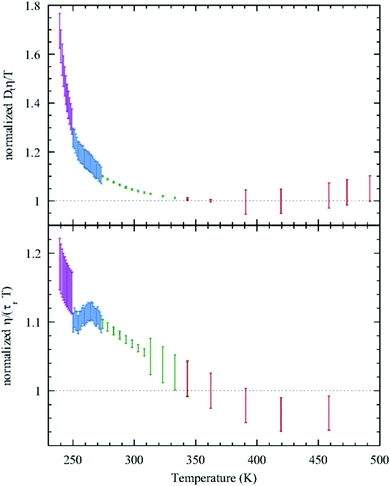 |
| | Fig. 4 Test of the SER (upper panel) and SEDR (lower panel). Dtη/T (upper) and η/(τrT) (lower) were plotted as a function of temperature. Here, the diffusion coefficient was denoted by Dt, while the molecular rotation time was denoted by τr. The data were further normalized by their value at 362.25K. The SER and SEDR relations would thus correspond to the horizontal dotted lines. SER and SEDR hold at high temperatures, but they are violated by around 70% and 18% at low temperatures, respectively. Reprinted with permission from ref. 54. | |
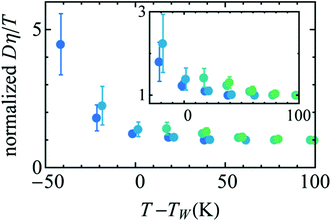
Availability of the accurate viscosity coefficient data of supercooled water at different T–P thermodynamic state points has triggered renewed interest in checking the validity of the SER in supercooled water. Several MD simulation-based investigations62–66,107,119,120 have been carried out to provide more insights into the breakdown. The simulation study of the TIP4P/2005121 model of water showed the breakdown.119 In addition, the above study also focused on the breakdown or preservation of other non-standard forms of SER, like the coupling of diffusion with the H-bond lifetime, α-relaxation time, etc. A separate MD simulation study107 of TIP4P/2005f122 water model reproduced the experimental diffusion and viscosity over a wide range of temperatures. The fact that the α-relaxation time was decoupled from the viscosity at low temperatures suggested that the use of α-relaxation time or average translational relaxation time might not be a foolproof way to check the validity of the SER. A more recent MD simulation study62 of TIP4P/2005121 water has addressed the impact of pressure on the SER breakdown in supercooled water. A dynamic extension of the thermodynamic two-state model of water41,45,118 was used to explain the temperature- and pressure-dependent dynamical properties of water. In the two-state model, liquid water is considered as a mixture of two inter-converting species, a high-density state (HDS) and a low-density state (LDS). The violation of SER at lower temperatures was linked with the Widom line approach. Fig. 5 plots the normalized Dη/T versus T–TW(P). Similar to that in Fig. 3b, an approximate collapse was observed when the normalized Dη/T was plotted as a function of T–TW(P). However, the density dependence was still visible.
 |
| | Fig. 5 Temperature variation of the quantity Dη/T normalized by its value at 300 K, as a function of the distance to the Widom line T–TW(ρ) (see the text for details) for four isochores (from bottom to top: 920.050, 960.090, 999.260, and 1040.59 kg m3). The inset points out the non-perfect collapse of the three isochores. Reprinted from ref. 62, with the permission of AIP Publishing. | |
Although the above studies provided important insights into the breakdown of the SER, the molecular mechanism was still elusive. Although several scenarios, such as the Widom line approach, two-state model of water, the dynamic heterogeneity, etc., were used to explain the breakdown of SER, a quantitative explanation was still necessary. Recently, our group has been able to explain the breakdown using the TJD approach.64–66 The increasing importance of the translation jump-diffusion of water molecules with decreasing temperature was evidenced.64–66,123–125 The presence of jump-diffusion in supercooled water was proposed earlier by many theoretical and simulation studies.124–132 Goldstein's hypothesis133 is worth mentioning. This hypothesis connected the temperature with the nature of translational diffusion of liquid molecules. According to this hypothesis, the translation of the liquid molecules occurs via jumping from one local free energy minima to another in the rugged free energy landscape at a lower temperature. However, with increasing temperature, the molecules gain thermal energy comparable to or higher than the free energy barrier heights and therefore diffuse freely via Brownian motion. Many theoretical and computer simulation studies126–132 supported the above hypothesis and indicated the existence of translational jump in supercooled liquids. Previous studies have shown how the translational jump-diffusion of the solute from one solvent cage to another can be triggered by the translation-coupled-rotational pre-arrangement of nearby solvent water molecules around the solute.124,125 The fragile-to-strong crossover has been seen to originate from the activated jump process, which dominates the dynamics in the deeply supercooled regime.134
Even though earlier studies hinted at the existence of the translational jump-diffusion and its role in various dynamic anomalies in supercooled water, including the breakdown of SER, more direct and quantitative evidence was still lacking. Our group estimated the jump-diffusion coefficient, which emanates from the jump-translation of water molecules, using a quantitative approach.64–66,123 These studies quantified the contribution of jump-diffusion in the breakdown of SER in supercooled water at different T–P thermodynamic state points. Apart from the neat supercooled water, the above method also explained the key aspects of SER breakdown in the binary mixture of water and methanol.66 The contribution of the jump-diffusion was seen to be strongly connected with the structure of the liquid.64–66 We detail the TJD approach and its usefulness for explaining the SER breakdown in the following section.
4. Breakdown of SER: explanation using the TJD approach
4.1 Calculation of diffusion D and viscosity η coefficients
Accurate determination of diffusion and viscosity coefficients is important to check the validity of SER. The diffusion coefficient can be calculated using two routes. In the mean square displacement (MSD) route, the MSD is calculated for the molecules using the following equation,| | 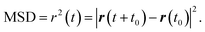 | (8) |
Here, r(t0) and r(t + t0) are the positions of a molecule at times t0 and (t + t0), respectively. The brackets “〈〉” refer to the ensemble average. The simulated time-dependent MSD at long time are then fit to the linear equation, as per Einstein's diffusion equation,| |  | (9) |
The diffusion D is calculated from the slope of the above equation.
The self-diffusion coefficient can also be calculated using the velocity autocorrelation function route,135
| | 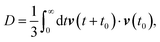 | (10) |
where
v(
t +
t0) and
v(
t0) are the velocities of the particle at time
t +
t0 and time t
0, respectively. We used the MSD route for calculating the diffusion coefficient.
64–66,123,125
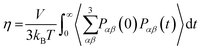
The viscosity coefficient can be calculated using the Green–Kubo formula63,136–138
| |  | (11) |
Here,
kB is the Boltzmann constant,
V is the volume of the box, and
T is the temperature of the system. The brackets “〈
〉” refer to the ensemble average.
Pαβ, the symmetrized traceless portion of the stress tensor
σαβ, can be defined as
| | 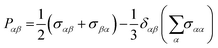 | (12) |
δαβ is the Kronecker delta and there are six, out of the nine, distinct
Pαβ elements. Note that
eqn (11) improves the statistics over the original Green–Kubo relation, which considers the average of only three off-diagonal terms.
| |  | (13) |
However,
eqn (11) and (13) do not result in significantly different
η values when sufficiently long simulation trajectories are examined.
64–66
4.2 The steps of the TJD approach in chronology
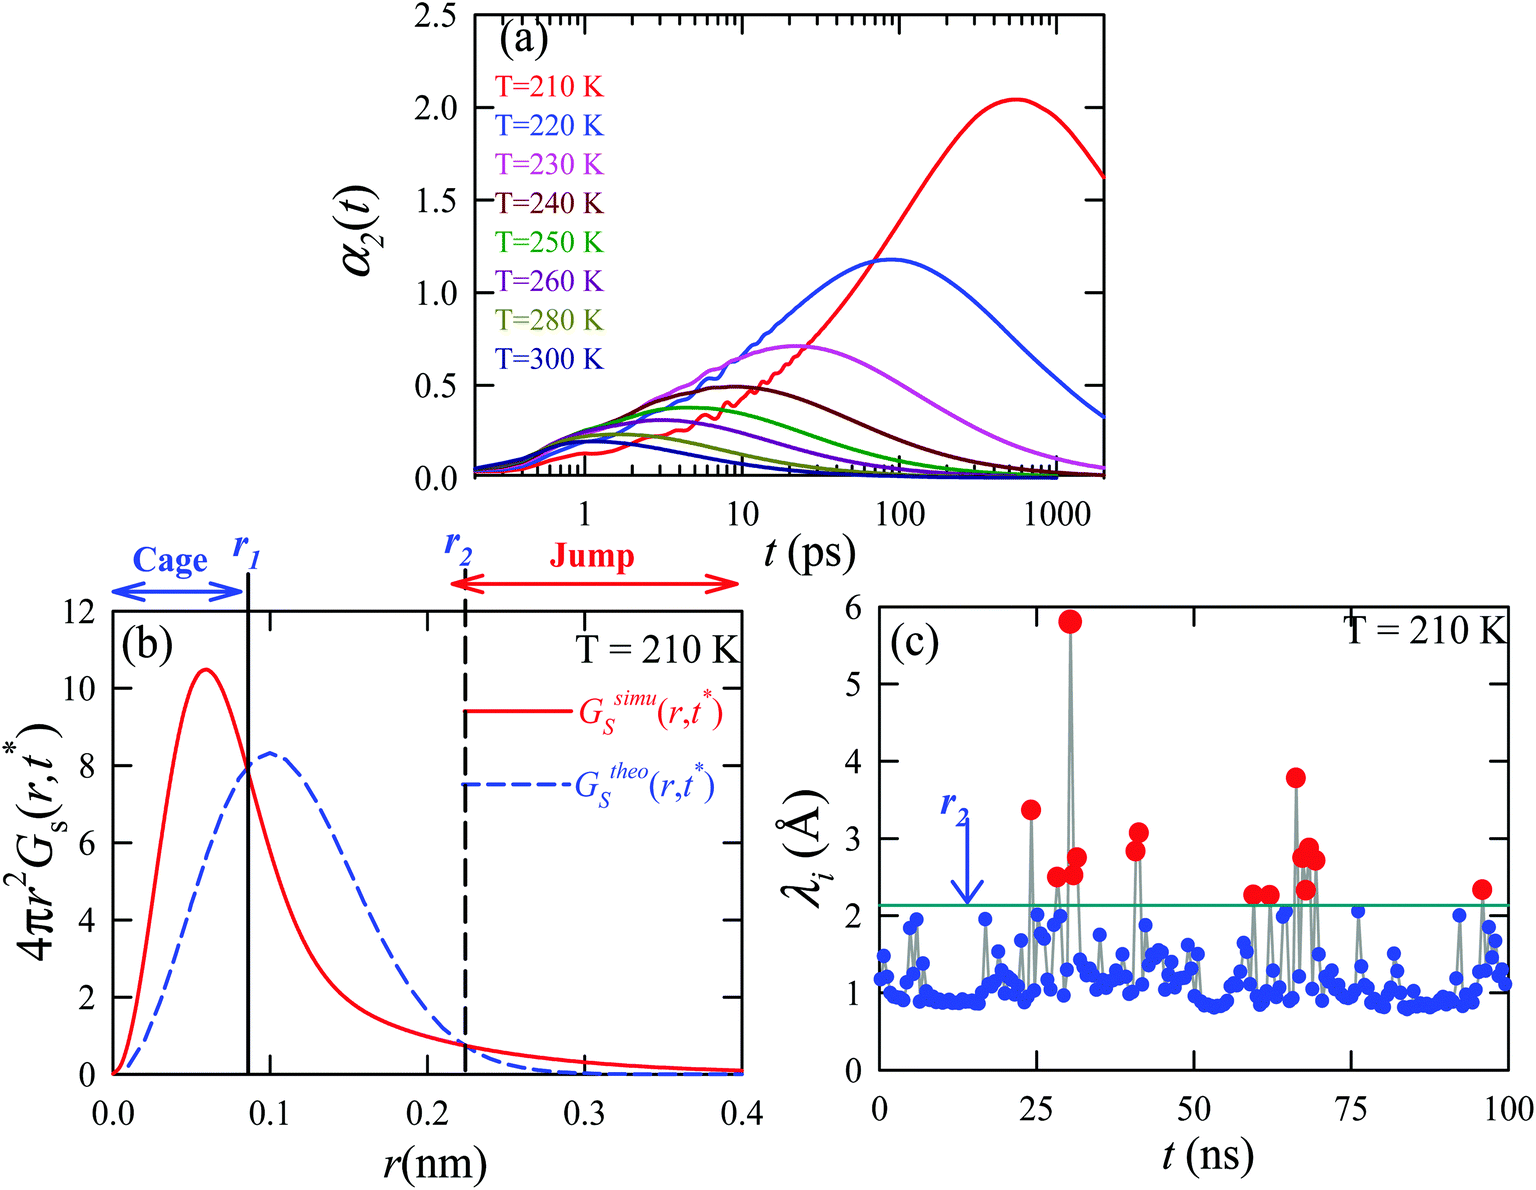
Here, we detail the method of estimating the jump-diffusion coefficient DJump. Accurate identification of a translational jump is one of the most crucial steps. The simplest method is via monitoring the displacement of a molecule from its initial position over time and identifying a jump event by a sudden change of displacement.124,125,139–142 Being a visual identification-based method it cannot quantitatively estimate DJump. In addition, this approach fails to identify all jumps and thus undermines the contribution of DJump in total diffusion.124 Some more quantitative methods are present in the literature.130 The jump-diffusion of a model glass-forming liquid was estimated using a method that assumed that the timescale of fluctuation of a caged particle's position is of the order of the Debye–Waller (DW) factor.130 A translational jump is thus defined by a fluctuation of larger magnitude compared to the DW factor. The oscillator model theory-based approach was used to calculate the jump-diffusion of a small tracer in a glass-forming liquid.143,144 These methods were used in usual glass-forming liquids but not in supercooled water.
Our method of calculating DJump is based on a technique introduced by Raptis et al.145,146 and modified by Araque et al.147 The steps are listed in chronological order.
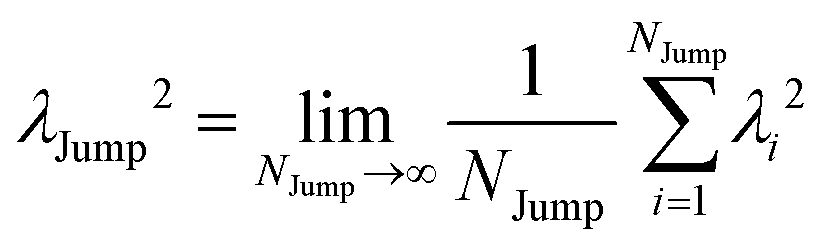
(I) The first step involves the calculation of the non-Gaussian parameter α2(t)135,148 using the following equation,
| | | α2(t) = 3r4(t)/5r2(t)2 − 1, | (14) |
where
r2(
t) = |
r(
t +
t0) −
r(
t0)|
2 and
r4(
t) = |
r(
t +
t0) −
r(
t0)|
4. Here,
r(
t0) and
r(
t +
t0) are the positions of a molecule at time
t0 and (
t +
t0), respectively. The brackets “〈
〉” refer to the ensemble average.
α2(
t) goes through a maximum value at the characteristic time
t =
t*.
(II) The long trajectory of a water molecule is split into smaller trajectory segments, each of duration t*. The consideration of t* comes from the fact that the transition from the sub-diffusive cage regime to the diffusive regime of the mean square displacement (MSD) occurs at time t*. Also, at this time the dynamical heterogeneity is seen to be maximum. However, the results do not change appreciably with a slight deviation of time from t*.64 Let us assume that the splitting of a full molecular trajectory, of duration ttraj, into equal segments of t* length, produces M smaller trajectory segments. Therefore, M = ttraj/t*. Also, in each trajectory segment, we have n number of time steps.
(III) The radii of gyration are calculated for all the M smaller trajectory segments. The radius of gyration for ith smaller trajectory segment Rg,i (1 ≤ i ≤ M) is calculated using the following equation,64–66,145–147
| | 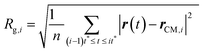 | (15) |
Here, r(t) is the molecule's position at time t and rCM,i is the center-of-mass of the ith trajectory segment, which is calculated using the following equation,64–66,145–147
| |  | (16) |
(IV) The net displacements in the ith trajectory segment λi is twice that of Rg,i
(V) It is obvious that every smaller trajectory segments are not jump-trajectories. Therefore, one needs to categorically identify the jump-trajectory segments. This can be done based on a distance criterion, which is obtained by following the deviation of the self-part of the van Hove correlation function at a time t*, Gs(r,t*), from the Gaussianity.64–66,147Gs(r,t*) provides the probability distribution of displacement at time t* and is calculated using the following equation,64–66,135,148
| | | GsimuS(r,t*) = δ(r − |r(t0) − r(t0 + t*)|) | (18) |
Here,
r(
t0) and
r(
t0 +
t*) are the positions of a molecule at a time
t0 and (
t0 +
t*), respectively. To see the deviation of the simulated self-part of the van Hove correlation function from the Gaussianity, we compare G
simuS(
r,
t*) with the following Gaussian equation,
| |  | (19) |
where
r2(
t*) is the MSD at the time
t*.
r2(
t*) = |
r(
t0+ t*) −
r(
t0)|
2. In presence of the translational jump occurrences,
GsimuS(
r,
t*) has a pronounced tale beyond the distance
r2, where
GsimuS(
r,
t*) crosses
GtheoS(
r,
t*). In this regime, molecules displace more than expected from the Gaussian distribution. Thus we consider a molecular trajectory segment as a jump one if the molecule translates more than
r2 in that segment. Therefore, the
ith trajectory segment is a jump-trajectory if it follows the condition,
λi >
r2.
GsimuS(
r,
t*) also crosses
GtheoS(
r,
t*) at a lower
r-value,
r =
r1, below which the molecules move less than expected from the Gaussian distribution. These trajectories are called cage-trajectories. While the identification of the jump-trajectory segments is the key for calculating the jump-diffusion coefficient, the identification of cage-trajectory segments serves nothing in the TJD approach but visual confirmation of correct classification of different trajectory types using the above protocol (see
Fig. 9).
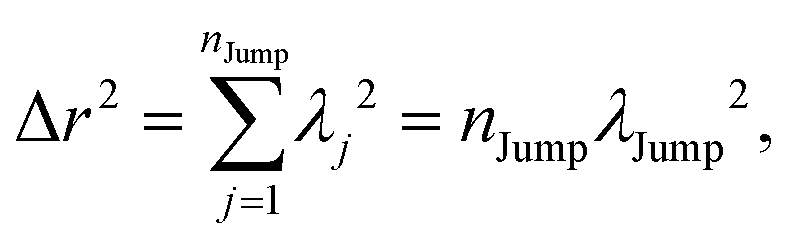
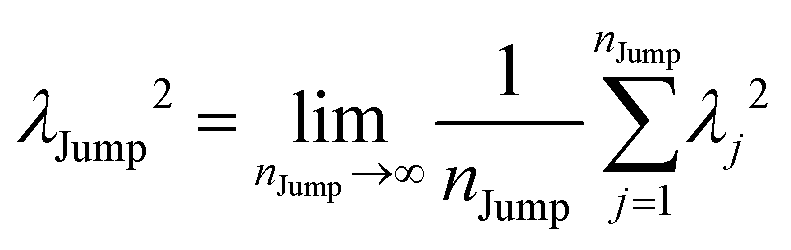
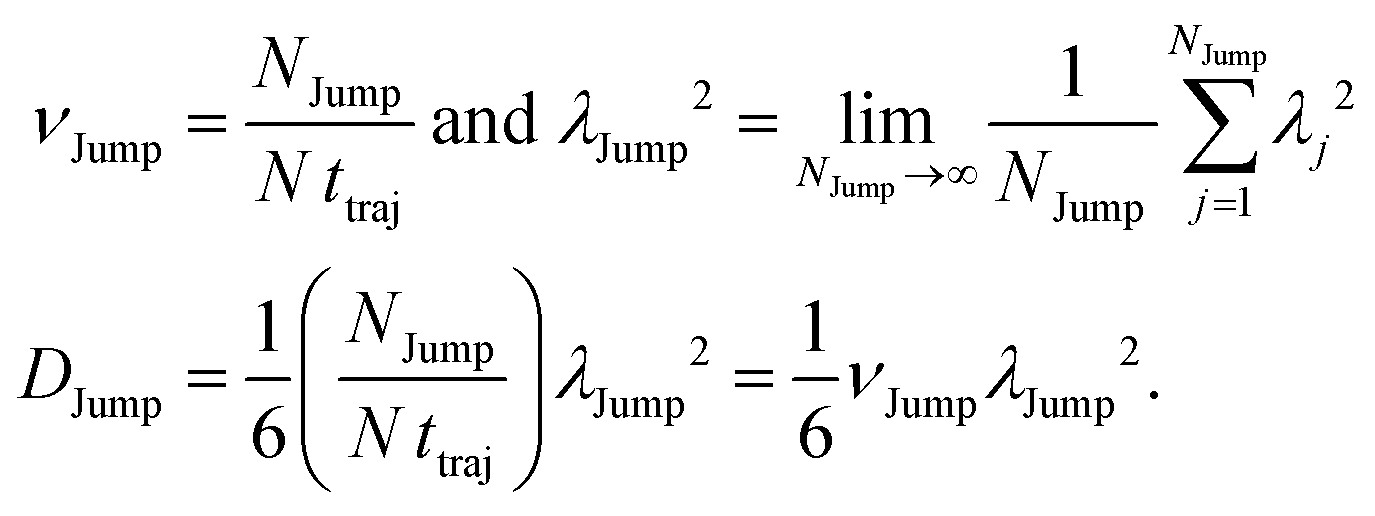
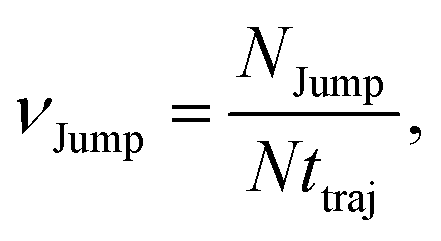
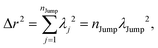
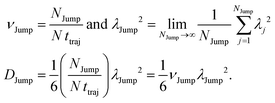
(VI) As the jump-trajectory segments are identified, we count the number of such jump-trajectories for all the molecules present in the system. We assume that a total number of jump trajectory segments for all the molecules is NJump. The jump-diffusion coefficient DJump can be calculated using the jump frequency νJump and average square jump length λJump264–66,123via the following equation,
| | 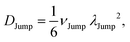 | (20) |
Eqn (20) can be derived from the random walk problem.
64 We have presented the derivation of the equation in the Appendix. Here, the jump frequency,
νJump and average square jump length
λJump2 can be written as,
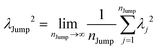
| |  | (21) |
where
NJump is the total number of jump events for all the molecules
N and
ttraj is the full simulation trajectory length.
λj2 is the square jump length for the
jth jump-trajectory segment (1 ≤
j ≤
NJump) of some molecule in the system.
(VII) Note that DJump originates from only the jump-trajectory segments. The remaining trajectory segments provide another component of the total diffusion D. We denote the other component as the residual-diffusion DRes, which emanates from the small-step displacement of the molecules. Therefore, the total diffusion coefficient D can be written as the sum of DJump and DRes. Thus, DRes can be calculated by subtracting DJump from D.64–66,123
Since
DRes emanates from the small-step displacement of the molecules
DRes must follow the SER. One of the key steps of the TJD approach is to check whether
DRes follows SER. We will see in the next sections that indeed
DRes follows the SER. This proves the role of
DJump in the breakdown of SER.
4.2. Applications of the TJD approach
In this section, we discuss some instances, where the TJD approach successfully explained the breakdown of the SER.
4.2.1 Pure supercooled water.
The experiments were performed in pure supercooled water to check the validity of the SER at different temperatures and pressures.48,54 Our first goal was to obtain the simulated diffusion and viscosity coefficient values at different thermodynamic states in good agreement with the experimental data. Water molecules were simulated at various temperatures between 210 K and 300 K at 1 bar pressure. Fig. 6a and b present the Arrhenius plots for simulated D (system-size-corrected64,65,149–151) and η values, which are in excellent agreement with the experimental values,54,109 presented in the same figures. As summarized in Section 4.1, we calculated the diffusion coefficient using the MSD route and viscosity using the Green–Kubo relation.64–66 The simulated D and η values are a good fit to the empirical Vogel–Fulcher–Tamman (VFT) equation.62,64,107,119 We also fit the simulated D and η using the power-law equation,54,152–154 which provides equally good fit over the full temperature range. This is consistent with the experiment.54 The caption of Fig. 6 presents the fitting equations and their parameters for both simulated D and η. These simulated D and η values at different temperatures were used to check the validity of the SER. As per eqn (7), the normalized Dη/T (the normalization was done at 300 K) value must be unity irrespective of the temperature. However, that is not the case here. Fig. 6c shows that the normalized Dη/T starts increasing from unity as the temperature is decreased below 300 K and reaches ∼3.5 at 210 K. This suggests an increasing breakdown of the SER with decreasing temperature. Consistent with the experimental results, the fitting of the simulated D and η values with the equation D ∝ (η/T)ξ provides ξ = −0.85.54,155
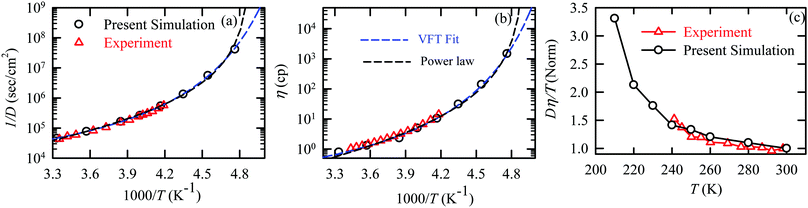 |
| | Fig. 6 The Simulated64,65,149–151 and experimental54,109 transport properties as function of temperature. The Arrhenius plot of diffusion coefficient D (a) and viscosity coefficient η (b). (c) The temperature-dependent normalized Dη/T values where the normalization is done at T = 300 K. The red triangles represent the experimental values, while the simulated values are represented by black circles in all three panels. The simulated diffusion and viscosity values are fitted with the power-law (black dashed line) and VFT equation (blue dashed line) in both (a and b). The fitting parameters of the power-law equation for the diffusion coefficient 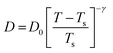 are: γ = −2.60, D0 = 1.71 × 10⁻⁴ cm2 s−1,and Ts = 204.28 K (χ2 = 23.64) and for the viscosity coefficient are: are: γ = −2.60, D0 = 1.71 × 10⁻⁴ cm2 s−1,and Ts = 204.28 K (χ2 = 23.64) and for the viscosity coefficient are: 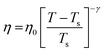 are: γ = 2.97,η0 = 0.065 cp and Ts = 203.24 K(χ2 = 1.95). The simulated singular temperature Ts for both the diffusion and viscosity coefficients are approximately 15 K less than Ts obtained by fitting the experimental data.54 The fitting parameters of the VFT equation for the diffusion coefficient are: γ = 2.97,η0 = 0.065 cp and Ts = 203.24 K(χ2 = 1.95). The simulated singular temperature Ts for both the diffusion and viscosity coefficients are approximately 15 K less than Ts obtained by fitting the experimental data.54 The fitting parameters of the VFT equation for the diffusion coefficient  are: D0 = 3.05 × 10⁻⁴ cm2 s−1, B = 328.34 K, and T0 = 175.54 K (χ2 = 2.576) and for the viscosity coefficient are: D0 = 3.05 × 10⁻⁴ cm2 s−1, B = 328.34 K, and T0 = 175.54 K (χ2 = 2.576) and for the viscosity coefficient  the fitting parameters are: η0 = 3.85 × 10⁻² cp, B = −360.34 K, and T0 = 175.60 K (χ2 = 0.469). The fittings are done using the non-linear chi-square fitting method156 with the weights calculated from the standard errors.64 We have also used the Marquardt–Levenberg algorithm,157,158 which is a least square method, to find the fitting parameters, which are presented in Fig. S1 of the ESI.† Adopted with permission from ref. 64. Copyright (2019) American Chemical Society. the fitting parameters are: η0 = 3.85 × 10⁻² cp, B = −360.34 K, and T0 = 175.60 K (χ2 = 0.469). The fittings are done using the non-linear chi-square fitting method156 with the weights calculated from the standard errors.64 We have also used the Marquardt–Levenberg algorithm,157,158 which is a least square method, to find the fitting parameters, which are presented in Fig. S1 of the ESI.† Adopted with permission from ref. 64. Copyright (2019) American Chemical Society. | |
In separate work,65 the simulated D and η values of water were reported at different T–P thermodynamic state points. The simulated values are consistent with the experiment.48 Ten different temperatures between 220 and 340 K and six different pressures between 0 and 250 MPa were considered. Fig. 7a and b present the pressure-dependent D and η values. Consistent with the experimental result,48,151,159 the pressure-dependent dynamical anomalies are more evident at lower temperatures (T < 270 K). The normalized Dη/T values are presented in Fig. 7c. Above 300 K, the Dη/T value remains almost constant at unity for all pressures. However, Dη/T increases from unity with decreasing temperature, which suggests the breakdown of the SER. The extent of breakdown decreases with increasing pressure.
 |
| | Fig. 7 Pressure dependence diffusion coefficients (a) and viscosity coefficient η (b), and normalized Dη/T values (c) at all temperatures. The normalization of Dη/T values is performed at T = 340 K. Reprinted with permission from ref. 65. Copyright (2019) American Chemical Society. | |
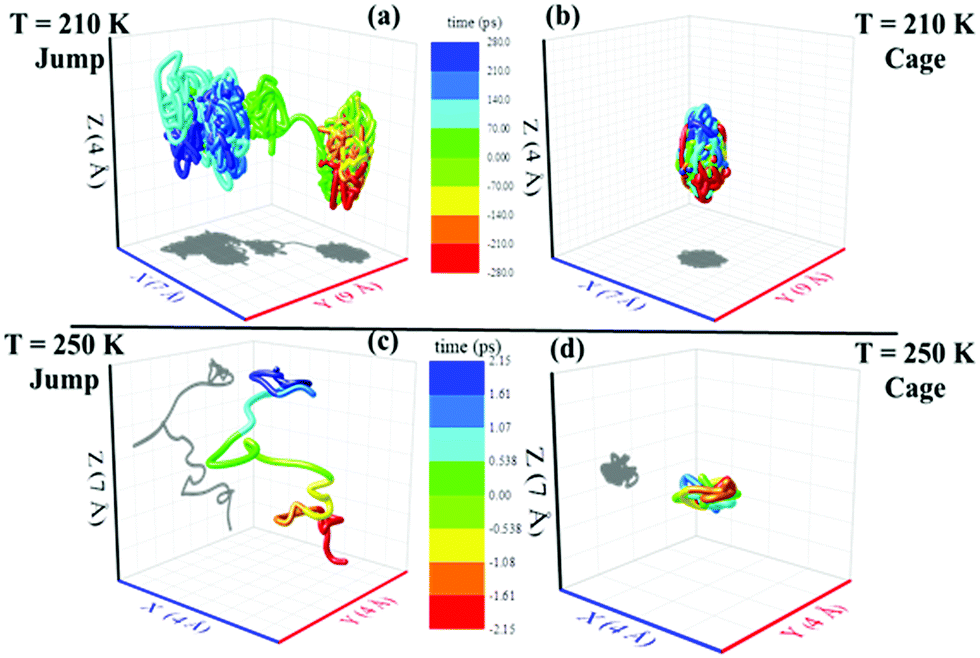
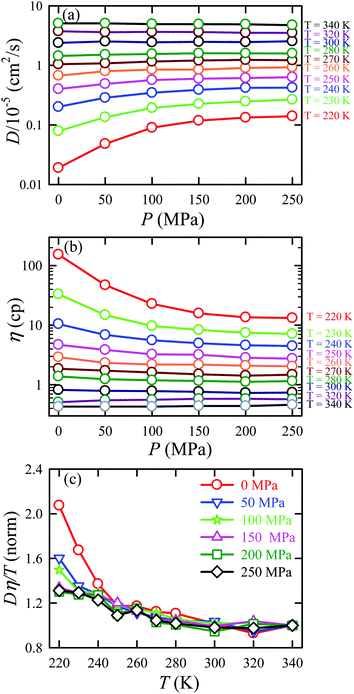
We applied the TJD approach to explaining the breakdown of SER. First, DJump was calculated following the steps, detailed in Section 4.2. Next, the residual-diffusion coefficient DRes was calculated by subtracting DJump from D (eqn (22)). Finally, we checked whether the normalized DResη/T remained unity irrespective of temperature and pressure.64 This would confirm the role of jump-diffusion for the breakdown of the SER in supercooled water. The non-Gaussian parameters α2(t), calculated using eqn (14) for the temperatures between 210 K and 300 K, are presented in Fig. 8a. On decreasing temperature from 300 K to 210 K, the characteristic time t* increases from ∼1 ps to ∼560 ps.64 Also, the increase of pressure decreases t*.65 Following step (I), the simulation trajectories were divided into smaller segments, each of duration t*. As per step (II), Rg,i were calculated for each smaller trajectory segments (eqn (15)). Next, λi was calculated for all water molecules in the ith trajectory segment using eqn (17). The distance criteria for jump-trajectory segment were obtained by comparing the simulated GsimuS(r,t*) (eqn (18)) with the theoretical GtheoS(r,t*) (eqn (19)). A sample comparison is shown in Fig. 8b for T = 210 K and 1 bar pressure. As discussed in step (V), the criteria for a jump-trajectory segment is λi > r2. Fig. 8c presents a sample of λi for a particular water molecule during 100 ns simulation trajectory at 210 K. The jump-trajectories are those for which λi crosses r2 cutoff line. Fig. 9 presents some examples of the jump and cage-trajectory segments at 210 and 250 K temperatures. Clearly the protocol for identification of the jump-trajectory segments seemed working properly.
 |
| | Fig. 8 (a) The non-Gaussian parameters for all the temperatures studied. (b) The comparison between the simulated self-part of the van Hove correlation function GsimuS(r,t*) (solid line) and the corresponding theoretical one (GtheoS(r,t*)) (dashed line) at time t*. (c) The distance traversed by one water molecule, λi, in the ith trajectory segment at 210 K. The peak intensity beyond r2 distance presents the jump-trajectory segments. Reprinted with permission from ref. 64. Copyright (2019) American Chemical Society. | |
 |
| | Fig. 9 Representative jump and cage-trajectories at T = 210 and 250 K. Panels (a) and (c) represent jump-trajectory segments, while panels (b) and (d) represent cage-trajectory segments. The color mapping represents the time evolution of a trajectory. Reprinted with permission from ref. 64. Copyright (2019) American Chemical Society. | |
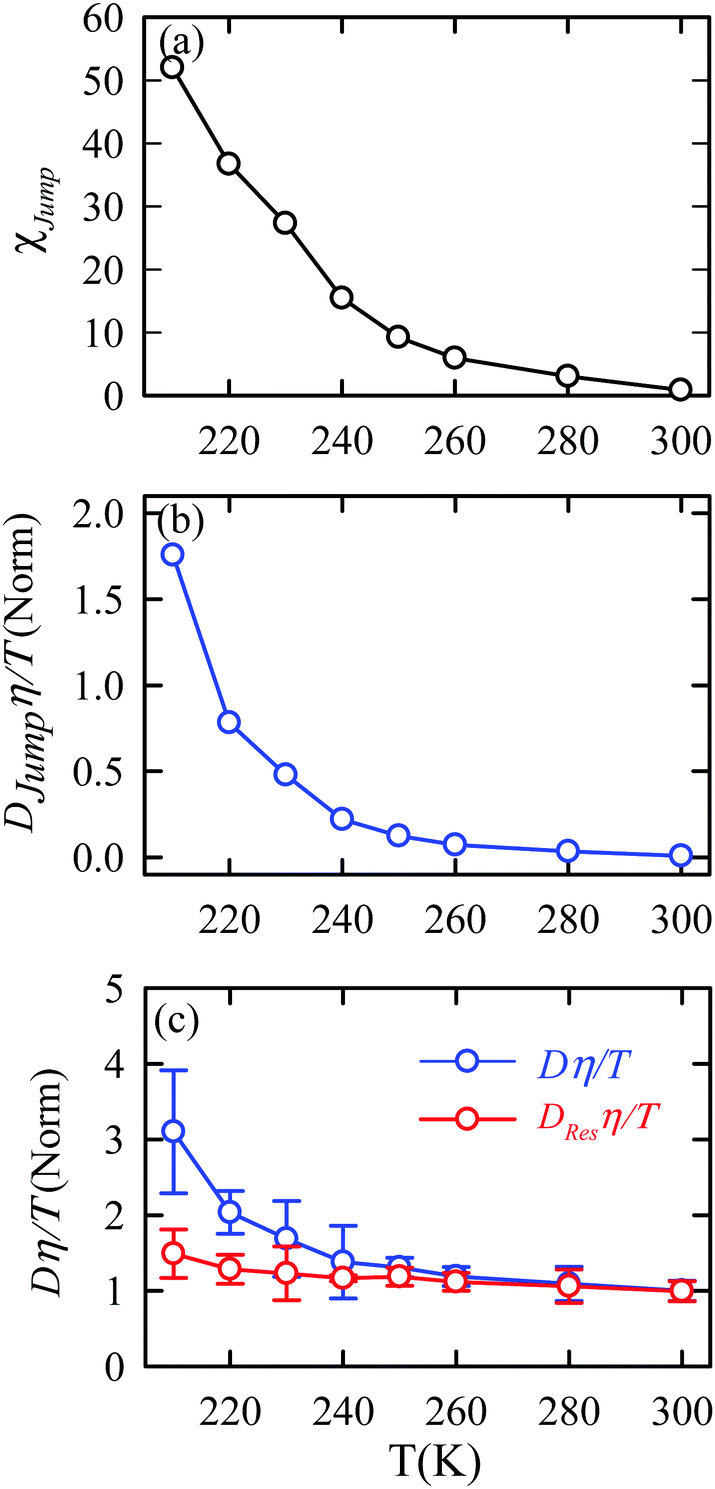
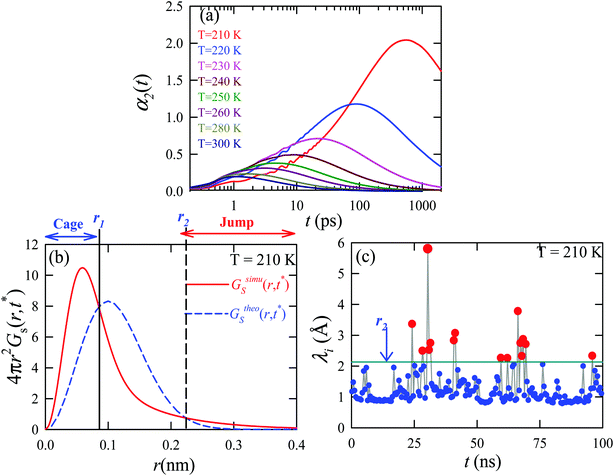
The jump-diffusion coefficient DJump was calculated (eqn (20)) using the jump frequency νJump and average square jump length λJump2 (eqn (21)). Fig. 10a presents χJump = 100 × (DJump/D) as a function of temperature.64–66,123χJump depicts the percentage contribution of the jump-diffusion in total diffusion. Starting from a negligible value at 300 K, χJump increases with decreasing temperature and reaches almost 50% at 210 K.64 The SER for DJump is shown in Fig. 10b. As expected, DJump is strongly decoupled from the viscosity. Finally, eqn (22) was used to calculate the residual-diffusion coefficient DRes by subtracting DJump from D. Fig. 10c plots the normalized DResη/T as a function of temperature. The normalization was done at 300 K. The comparison between Dη/T and DResη/T plots, one of the most important results, shows that while Dη/T increases with decreasing temperature, DResη/T remains almost constant with decreasing temperature.64 This strongly suggests that the jump-diffusion is responsible for the breakdown of the SER since the exclusion of the jump-diffusion leads to the diffusion-viscosity coupling at any temperature.
 |
| | Fig. 10 (a) Temperature dependence of the percentage contribution of jump-diffusion in total diffusion,χJump. (b) Coupling of DJump with the medium viscosity η at different temperatures. (c) Coupling of total diffusion D and the residual-diffusion coefficient DRes with medium viscosity η at different temperatures. The error bars in panel (c) are the standard deviations. Adopted with permission from ref. 64. Copyright (2019) American Chemical Society. | |
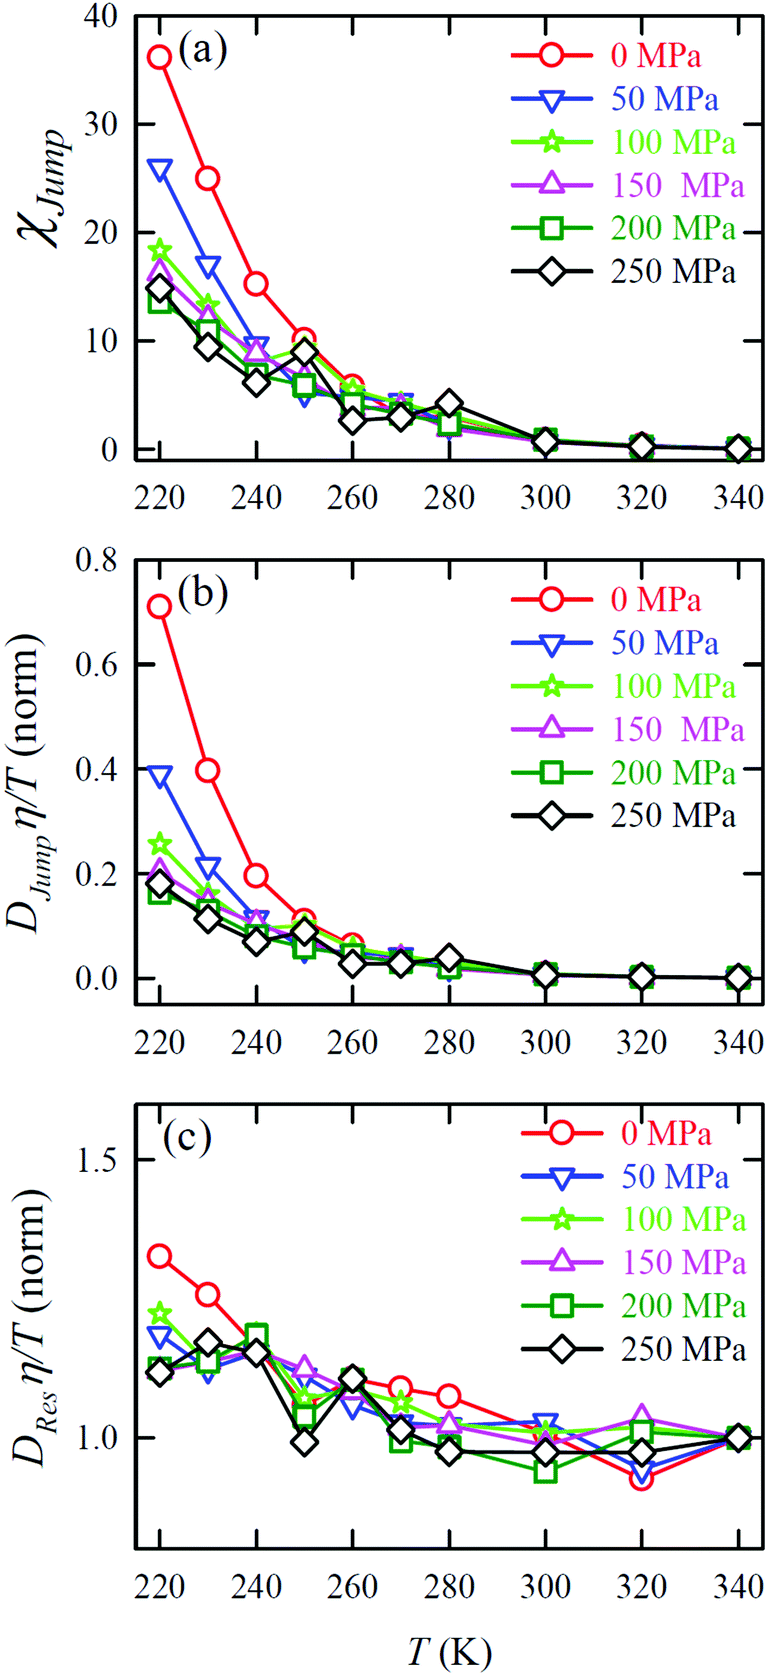
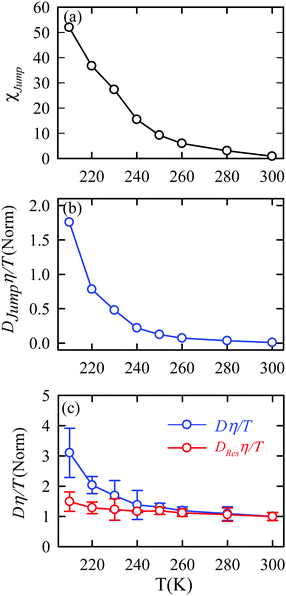
D
Jump was also calculated at different T–P thermodynamic state points in a separate work.65Fig. 11a shows how χJump varies with temperature for different pressures. χJump decreases with increasing pressure at a given temperature. So, the jump-diffusion is more prevalent at lower temperatures and pressures. Fig. 11b plots the normalized DJumpη/T values as a function of temperature for all pressures. Evidently, DJump is strongly decoupled from viscosity at any T–P state points, suggesting DJump as a natural violator of the SER. Fig. 11c presents the normalized DResη/T as a function of temperature for all the pressures. Fascinatingly, the normalized DResη/T for all pressures merged with one other approximately at unity. Therefore DRes couples with the viscosity of the medium sufficiently strongly and follow the SER for all T–P thermodynamic state points. Therefore, these studies provided the most conclusive evidence of the role of translational jump-diffusion of water molecules for the breakdown of the SER.
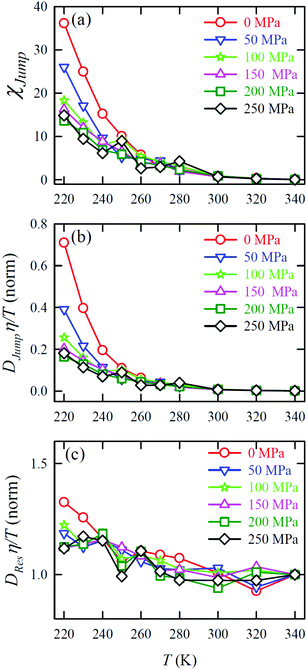 |
| | Fig. 11 (a) Temperature-dependent percentage contributionχJump for different pressures. (b) Normalized DJumpη/T, and (c) Normalized DResη/T as functions of temperature for all pressures. The normalization is done at T = 340 K. Reprinted with permission from ref. 65. Copyright (2019) American Chemical Society. | |
4.2.2 Aqueous binary mixture.
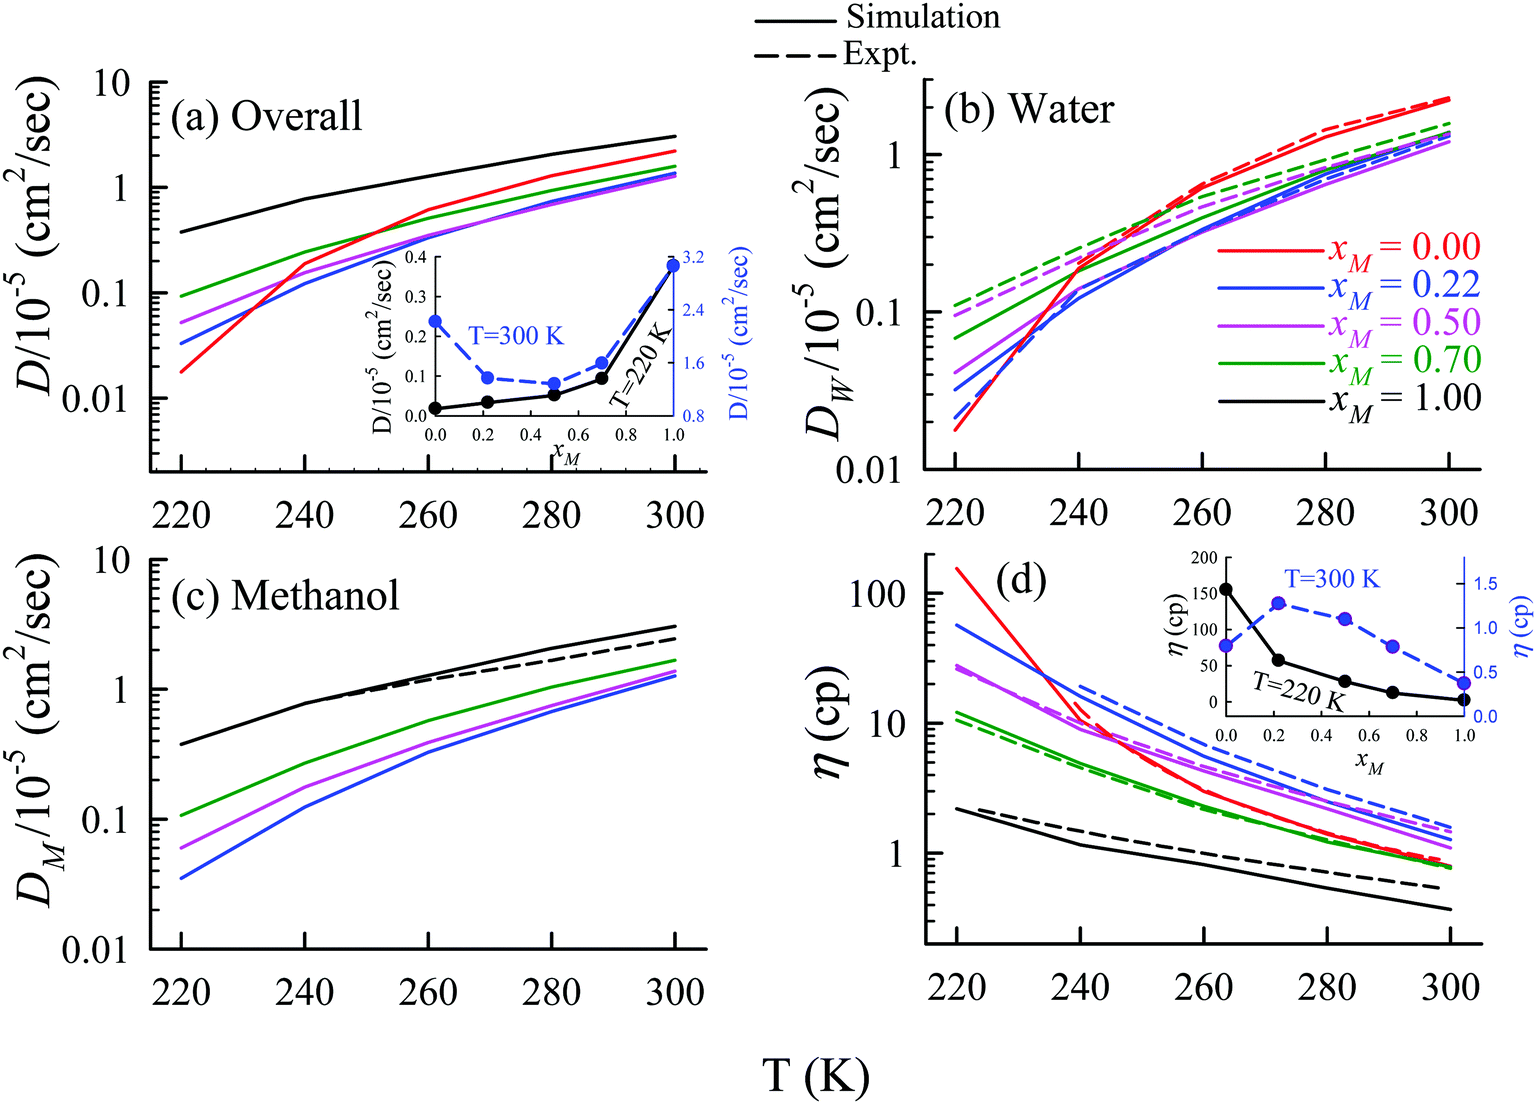
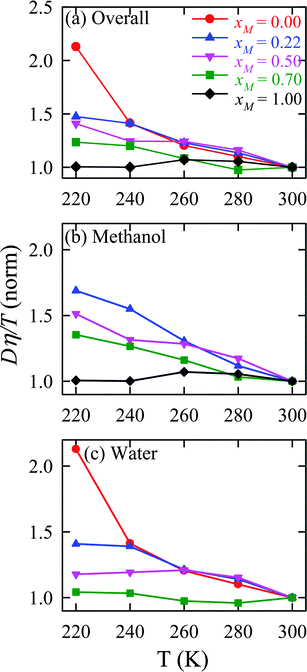
The TJD approach was also used for explaining the breakdown of the SER in a binary mixture of water and methanol.66 The diffusion coefficient of water in water/methanol binary mixture was measured by the NMR-based pulsed gradient stimulated spin-echo technique (1H-PGSTE).160 It is worth mentioning that the proton exchange event from water to the OH group of the methanol molecule may somewhat affect the diffusion coefficient of water. However, this is not clear how this proton exchange biases the measured diffusion coefficient of water. Using the experimentally measured D and η for pure water,54,109,161,162 pure methanol,163–169 and water/methanol binary mixtures160,170–173 of different mixture compositions at different temperatures the role of binary mixture composition on the validity of the SER was investigated.160 The simulated overall diffusion D, diffusion of water DW, diffusion of methanol DM, and η values66 are plotted against temperature for different binary mixture compositions in Fig. 12. We compare the simulated DW of water in the mixture and the simulated DM of methanol in pure methanol with the available expeirmental diffusion coefficients in Fig. 12b and c, respectively. These show reasonably good agreement between the simulated and experimental diffusion values. Some differences between simulation and experimental data are observed at lower temperature especially for the equimolar mixture. Both the simulated D and η values changed non-monotonically with the methanol mole-fraction xM above 250 K. However, the non-monotonicity decreases with decreasing temperature.
 |
| | Fig. 12 Comparison between simulated (solid line) and experimental (dashed line) transport coefficients. (a) Temperature-dependent overall self-diffusion coefficient D for different systems. The inset shows the non-monotonic composition dependence of D at 300 K and monotonic composition dependence at 220 K. (b and c) Temperature-dependent diffusion coefficients of water (DW) and methanol (DM), respectively. (d) Temperature-dependent shear viscosity coefficient (η) for different systems. The inset of (d) shows the non-monotonic composition dependence of η at 300 K and monotonic composition dependence at 220 K. Reprinted with permission from ref. 66. Copyright (2020) American Chemical Society. | |
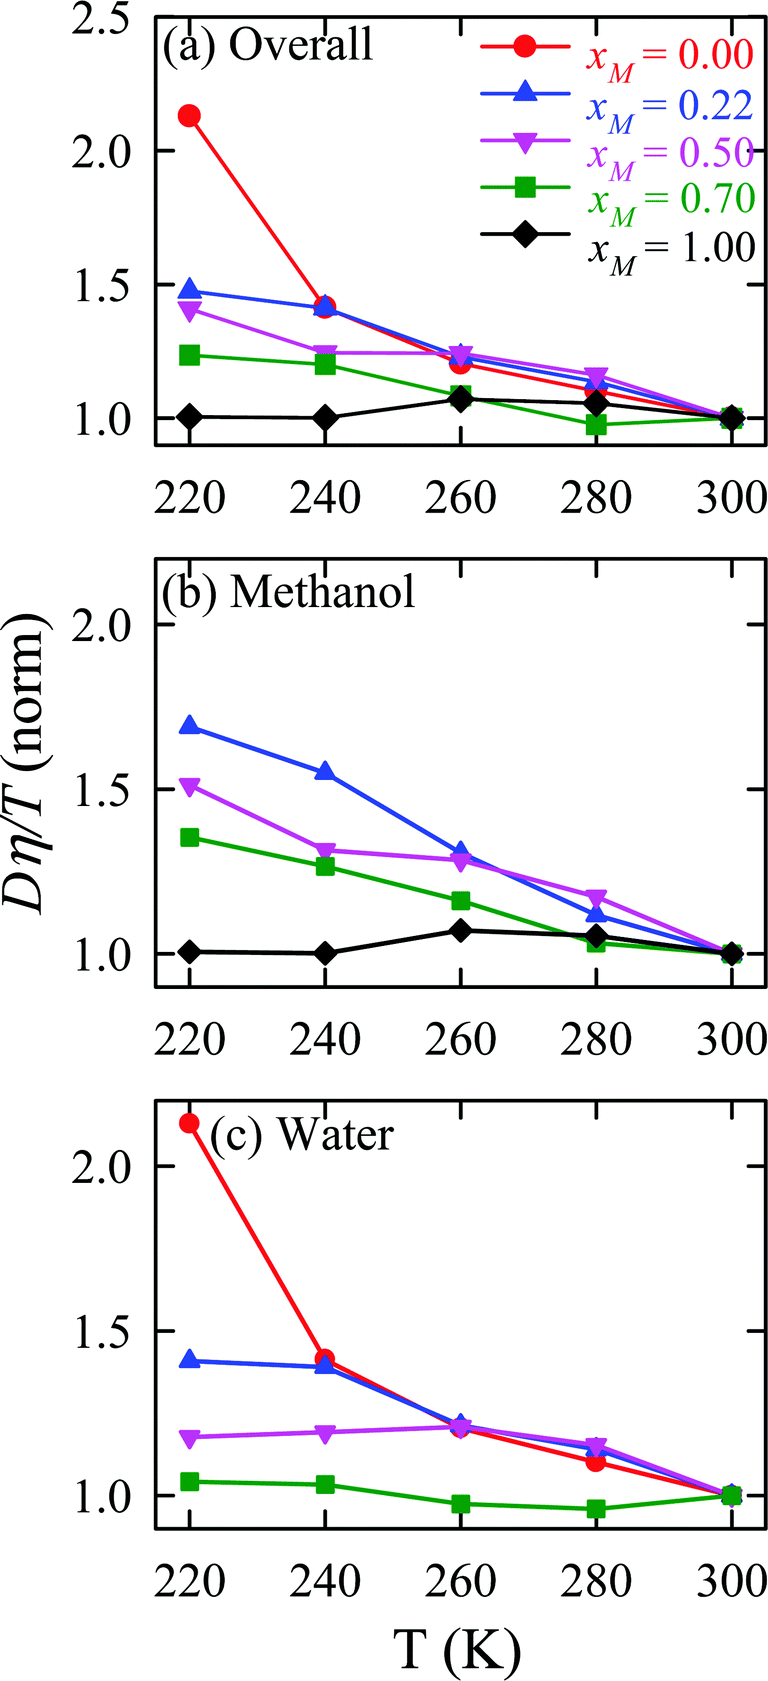
The validity of SER was checked by plotting the normalized Dη/T values in Fig. 13 for the overall system, water, and methanol. In all cases, the normalized Dη/T gradually increase from unity as the temperature was decreased, which suggests increasing violation of the SER. While intense breakdowns of the SER were observed in pure supercooled water, the SER remained almost valid for pure methanol. Methanol concentration had a strong effect on the breakdown of the SER in the water/methanol binary mixture. Above 260 K, the most intense violation of the SER was observed for the equimolar mixture, which is consistent with the experiment.160 However, at the lowest temperature 220 K, the extent of the breakdown of SER decreases with increasing methanol concentration.
 |
| | Fig. 13 Temperature-dependent normalized Dη/T values for (a) the overall system, (b) methanol, and (c) water for different compositions. The normalization is done at 300 K. Reprinted with permission from ref. 66. Copyright (2020) American Chemical Society. | |
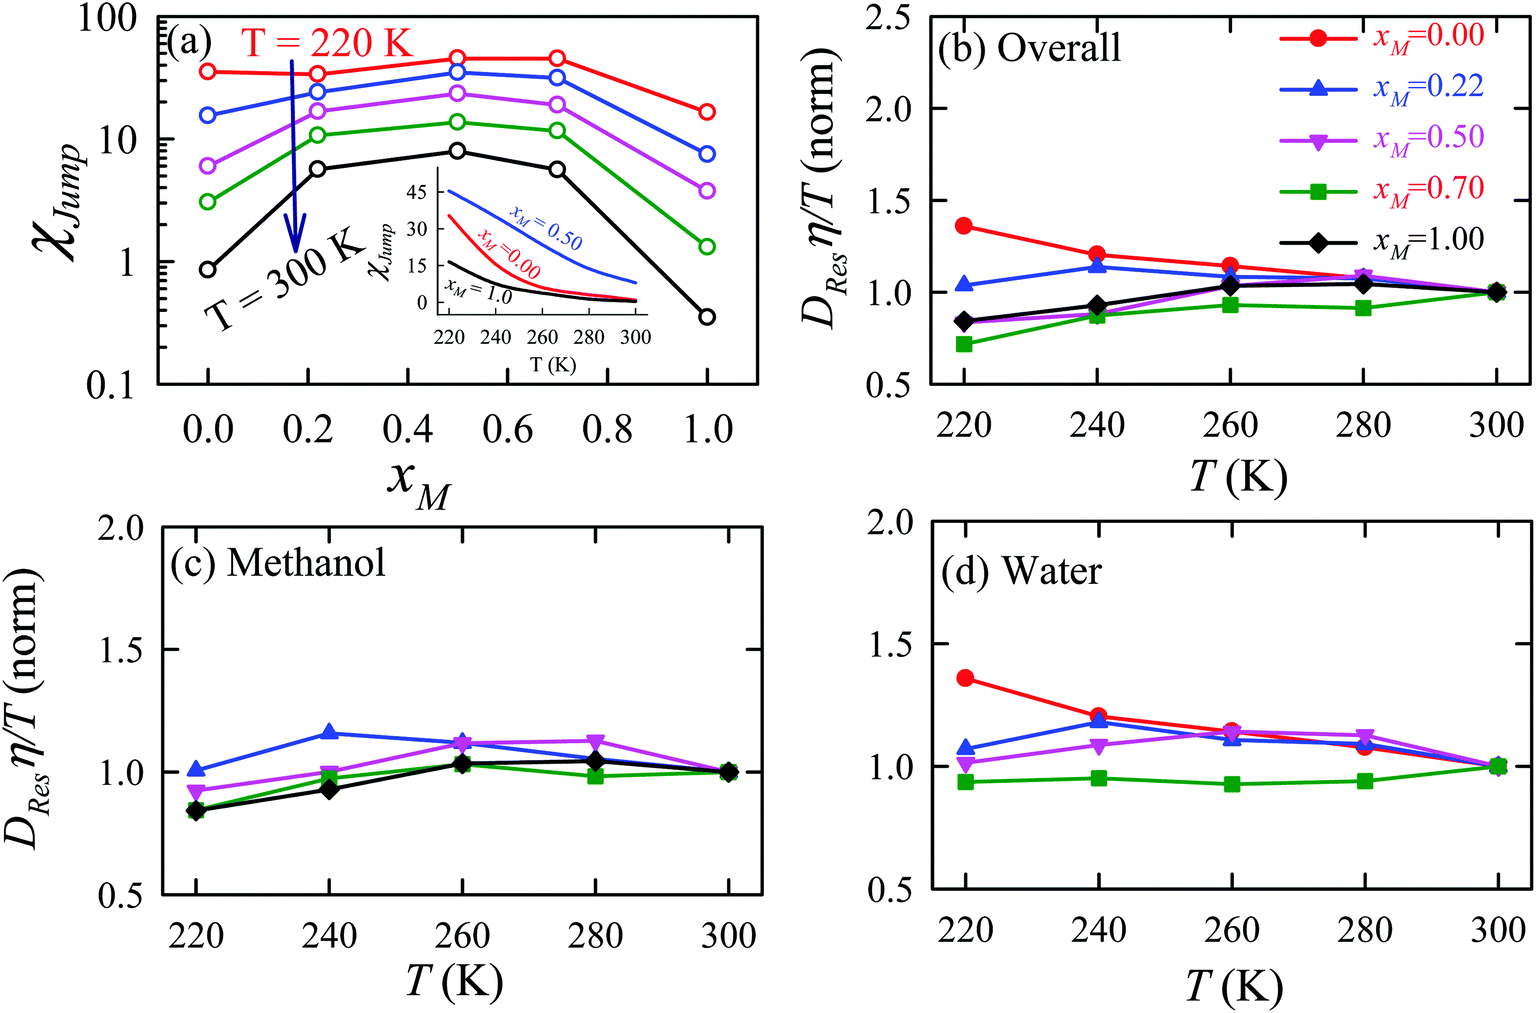
The effect of methanol concentration on the breakdown of the SER in the water/methanol binary mixture was explained using the TJD approach. DJump was calculated for each system using the steps detailed in Section 4.2. Different parameters in the jump-diffusion analysis, like t*, α2(t*), νJumpetc. showed non-monotonic composition dependence with the maximum at xM ∼ 0.5.66 The above non-monotonicity was gradually reduced with decreasing temperature. χJump, for the overall system, is plotted as a function of xM at different temperatures in Fig. 14a. χJump increases with decreasing temperature for all the binary mixture compositions. The composition dependence on χJump was also interesting. At 300 K, for pure water and pure methanol, χJump was negligible, while for the equimolar mixture χJump was ∼8%. This astounding increase of χJump for xM = 0.5 suggested a larger extent of the SER breakdown in the equimolar mixture observed in the experiment. The increase of χJump with decreasing temperature is maximum for pure water. Approximately 40 times increase of χJump was reported for pure water, while the increase is only 6 times for xM = 0.5 due to the decrease of temperature from 300 K to 220 K. Finally, DRes for the overall system, water, and methanol were calculated and the normalized DResη/T values were plotted versus T for different compositions. These are presented in Fig. 14b–d. Interestingly, DRes remains fairly coupled to the viscosity of the medium almost at all temperatures and mixture compositions. This is true for the overall system, water, and methanol. However, the values are somewhat scattered (0.7–1.2) at temperatures below 240 K, particularly for the overall system.
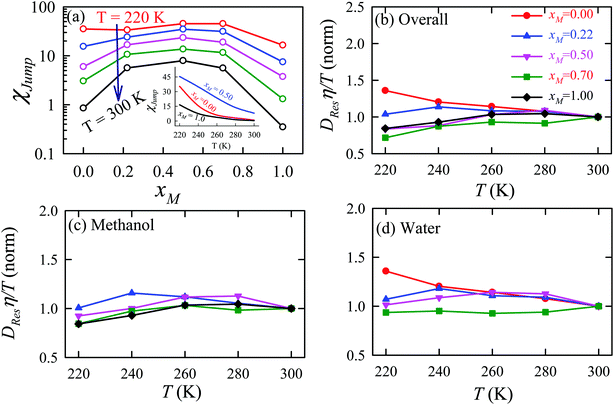 |
| | Fig. 14 (a) Methanol concentration dependences of χJump, the percentage contribution of jump-diffusion DJump in the total diffusion D, at different temperatures: 220 K (red), 240 K (blue), 260 K (pink), 280 K (dark green), and 300 K (black). The inset in panel (a) presents the temperature dependence of χJump at three different mole fractions: pure water, pure methanol, and equimolar water/methanol binary mixture. Temperature-dependent normalized DResη/T for the (b) overall system, (c) methanol, and (d) water. The normalizations were done at 300 K. Adopted with permission from ref. 66. Copyright (2020) American Chemical Society. | |
4.3. Connection between Jump-diffusion and liquid structure
The previous sections have detailed how the TJD approach successfully explained the breakdown of SER in pure supercooled water, and water/methanol binary mixture from the jump-diffusion perspective. The effect of pressure, temperature, and mixture composition on χJump was already revealed. But what is the more fundamental origin of the jump-diffusion? In this section, we put forward some possible connections between the jump-diffusion and water structure. The local structure of water, analyzed by the average number of H-bonds per water molecule nHb and the tetrahedral order parameter q, was examined at different T–P thermodynamic state points. The H-bond between two water molecules was characterized by the following distance and angle criteria:104,174–177rODOA < 3.5 Å, rOAHD < 2.45 Å, and ∠HDODOA < 30°, where the H-bond donor and acceptor are defined by “D” and “A”, respectively. The tetrahedral order parameter q of a tetrahedral structure was calculated using the following equation,178–183| | 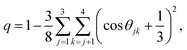 | (23) |
where θjk is the angle between the vectors joining two nearby water molecules with the central water molecule. 〈q〉 = 0 stands for an entirely random configuration, like an ideal gas, while 〈q〉 = 1 represents a perfectly tetrahedral geometry.
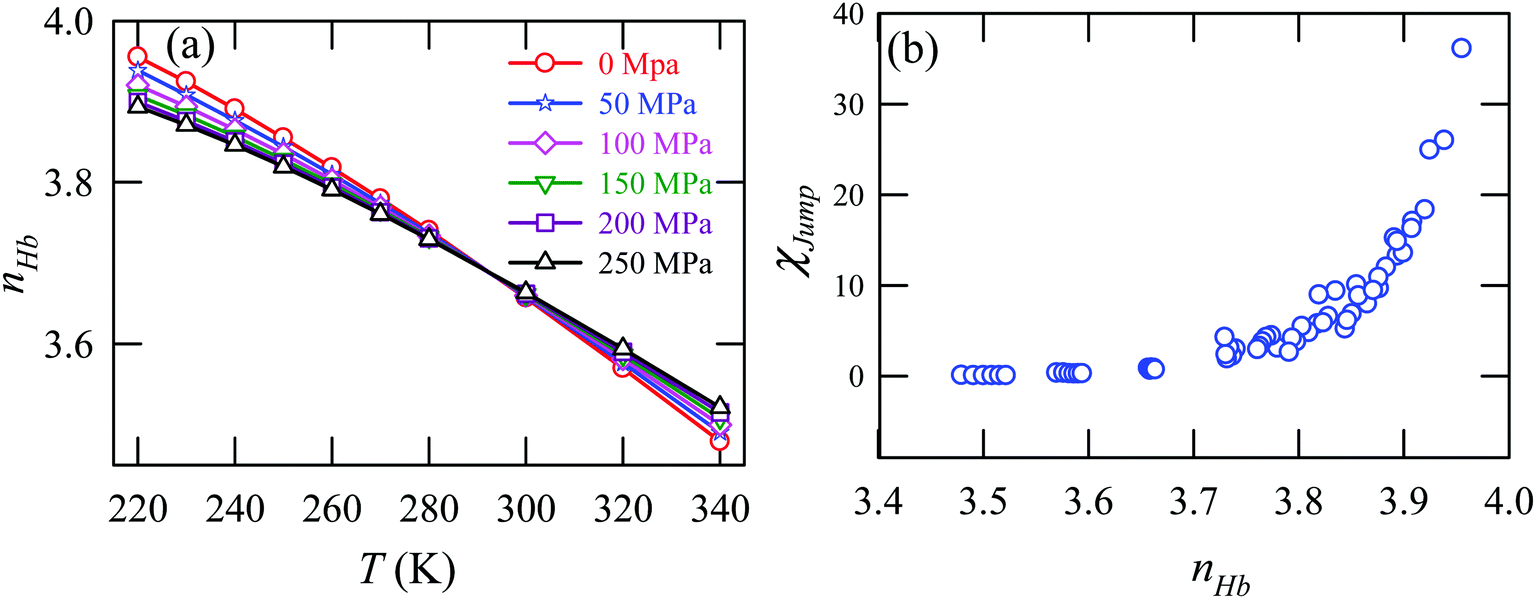
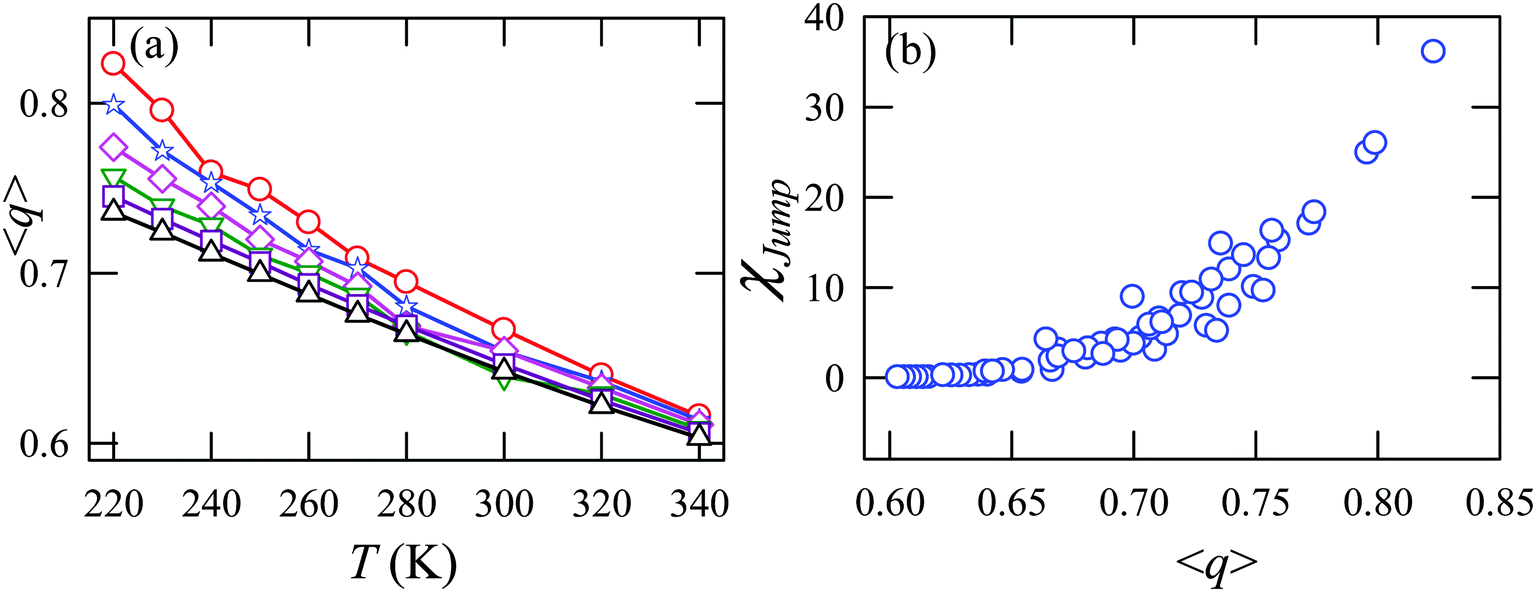
Fig. 15a presents the temperature-dependent nHb of water at different pressures. Evidently, below 290 K, nHb decreases with increasing pressure, while nHb increases with decreasing pressure above 290 K temperature. Fig. 15b shows that χJump behaves systematically with nHb. χJump is increased with nHb almost exponentially irrespective of temperature and pressure. Since nHb is the strength of trapping a water molecule, the more is the value of nHb the larger the trapping force. Therefore, the increase of χJump with the increase of nHb gives a clear sign that the diffusion of a trapped water molecule is more dominated by jump-diffusion. Therefore, the stronger trapping of a molecule triggers more translational-jump-dominated diffusion. The average tetrahedral order parameter 〈q〉 of water is presented in Fig. 16a for different T–P thermodynamic state points. Also, Fig. 16b shows a very strong correlation between 〈q〉 and χJump. As the order of the water molecules increases and water–water H-bond strength increases, the water molecules increasingly diffuse via the jump-diffusion mechanism.
 |
| | Fig. 15 (a) The average number of hydrogen bonds per water molecule nHb at different temperatures and pressures. (b) χJump as a function nHb. Reprinted with permission from ref. 65. Copyright (2019) American Chemical Society. | |
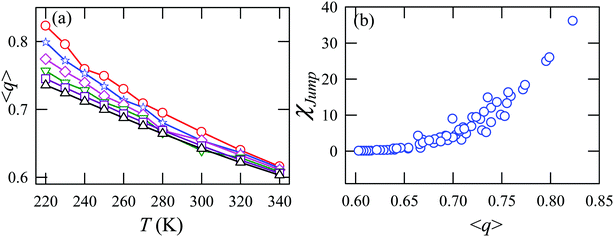 |
| | Fig. 16 (a) The average tetrahedral order parameter 〈q〉 at different temperatures and pressures. (b) χJump as a function of 〈q〉. Reprinted with permission from ref. 65. Copyright (2019) American Chemical Society. | |
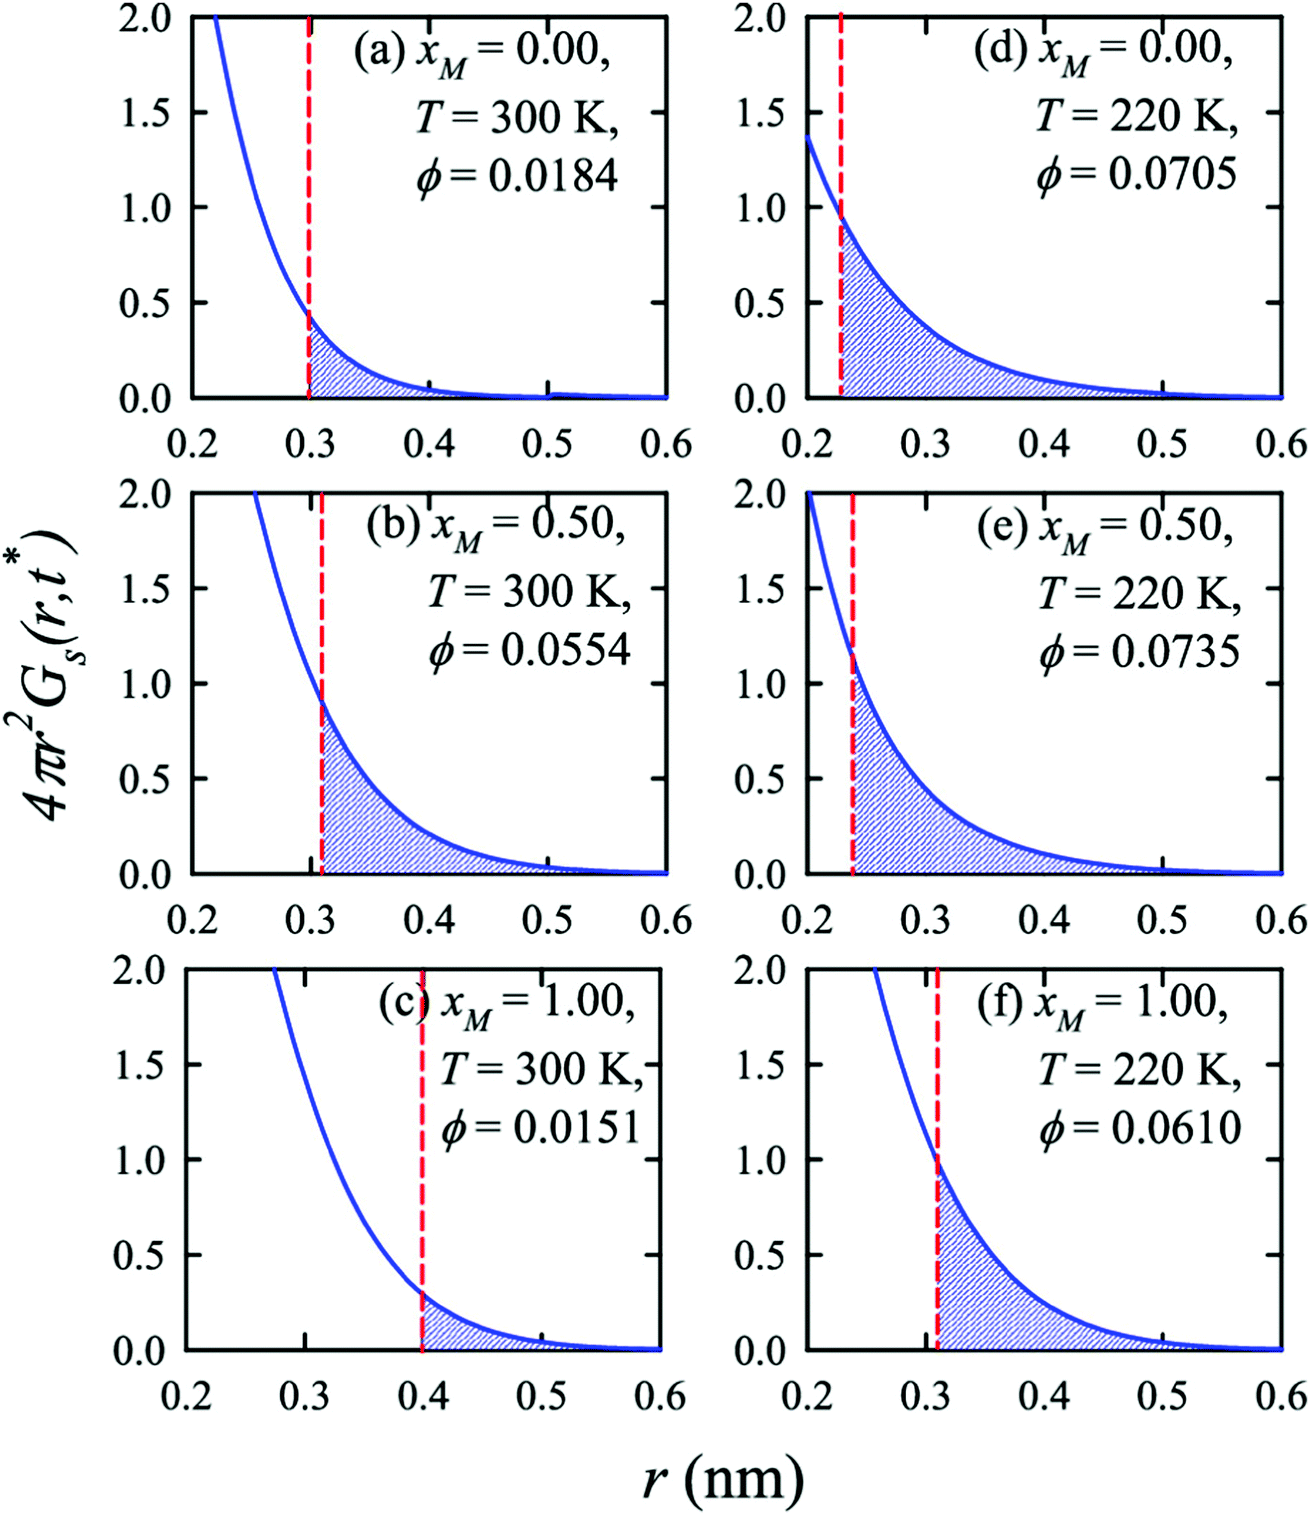
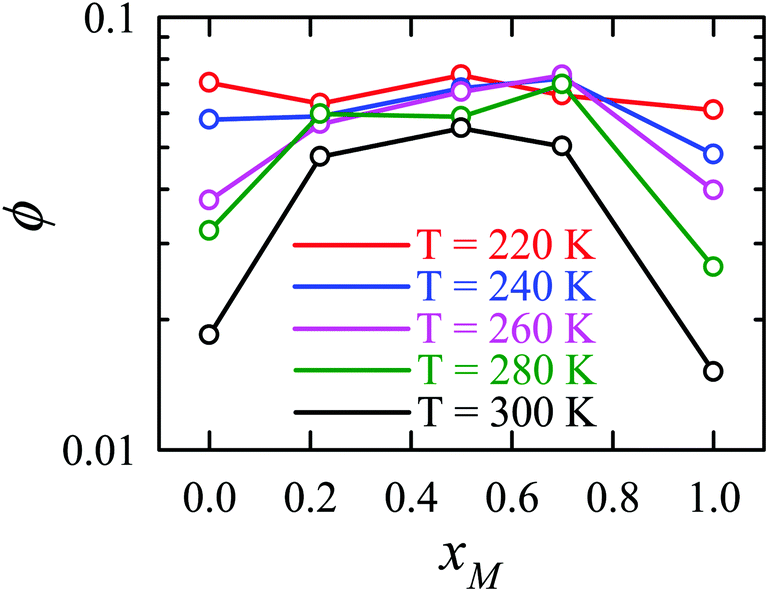
Apart from the H-bonding and the tetrahedral ordering of water, there is another factor that also dictates whether the jump-diffusion is the key diffusion channel in a binary mixture of water and methanol. This is the structural inhomogeneity of the system, particularly for a binary mixture. At 300 K, χJump is maximum (∼8%) for the equimolar mixture. This large increase of χJump at xM = 0.5 is primarily responsible for the maximum SER breakdown for the equimolar mixture as seen in the experiment. However, this non-monotonic behavior is reduced by decreasing the temperature. It was found that the above increase of χJump in the equimolar methanol/water binary mixture is connected to the dynamic heterogeneity, which was measured by the area under the Gs(r,t*) curve ϕ beyond the distance r2,184–187 the distance criteria for jump-diffusion. The enclosed area ϕ is shown in Fig. 17. Fig. 18 presents ϕ as a function of the methanol concentration at different temperatures. The non-monotonic composition dependence of χJump is evident at 300 K. However, the non-monotonicity is reduced by the decrease of temperature. The equimolar water/methanol mixture is dynamically more heterogeneous. Methanol induces micro-heterogeneity in the aqueous solution even at room temperature, which is akin to other similar aqueous binary mixtures.188–201
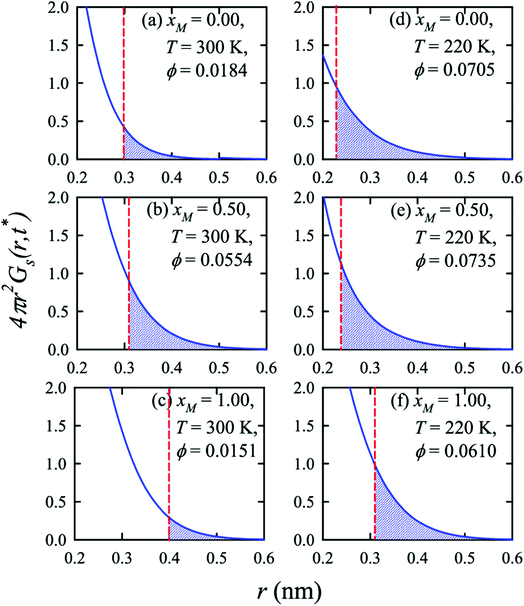 |
| | Fig. 17 Exponential decays of the simulated self part of the van Hove correlation function at time t*, when α2(t) is maximum, for three different compositions (xM = 0.0, 0.5, 1.0) and two temperatures (220 K and 300 K). The shaded part is the area ϕ under a curve beyond r2 distance. The vertical dashed lines indicate the r2 distance. Reprinted with permission from ref. 66. Copyright (2020) American Chemical Society. | |
 |
| | Fig. 18 The area under the curve, shown in Fig. 17, as a function of mixture composition at different temperatures. Reprinted with permission from ref. 66. Copyright (2020) American Chemical Society. | |
5. Conclusion and future scope
In this article, we have reviewed significant works focusing on the breakdown of the SER in supercooled water. Although prior studies have provided some theoretical explanations for the observed breakdown of the SER, we have not yet reached a consensus. Because of the presence of the homogeneous nucleation temperature of the water, it is practically impossible to keep bulk water liquid below TH. To avoid the crystallization of water, earlier experiments considered confined water for studying the SER validity. We have reviewed the studies, which measured the average translational relaxation time instead of viscosity of the medium for checking the validity of SER in indirect means. However, with the progress of advanced experimental techniques, it has been recently possible to measure the viscosity of bulk supercooled water at different T–P thermodynamic state points accurately. The breakdown of SER was observed directly using the measured diffusion and viscosity for the wide range of temperature and pressure. The key findings of these studies are reviewed here.
We have also reviewed the theoretical and MD simulation studies, which significantly contributed to understanding the breakdown of SER. The LLCP-based approach showed the onset of the breakdown of the SER as the crossing of the Widom line. The Dη/T lines for different pressures collapse into one line when the variable T is replaced by T–TW at a given pressure; where TW is the Widom line temperature. The increasing breakdown of SER with decreasing temperature of the supercooled water was linked to the increasing dynamical heterogeneity of the medium. A dynamical version of the thermodynamic two-state model of water was also used to explain the temperature- and pressure-dependent diffusion and viscosity of water. The two-state model considered liquid water to be a mixture of HDS and LDS. The breakdown of the SER at lower temperatures was explained in connection with the Widom line defined by an equal fraction of these two states. However, the above approaches were seriously challenged by a study reporting the breakdown of the SER of water at very high pressure (in the order of GPa) and the temperature at which water cannot be thought of as a mixture of two states.
An alternate explanation for the breakdown of SER was given by our group. This is the TJD approach, which has been reviewed here in detail. First, the steps for estimating the jump-diffusion coefficient are listed. Further, we have detailed few examples, where the TJD approach successfully explained the breakdown of SER in pure supercooled water and water/methanol binary mixture. The translational jump-diffusion coefficient was calculated for supercooled water at different T–P thermodynamic state points and a binary mixture of water and methanol at different temperatures and compositions. The jump-diffusion coefficient was then subtracted from the total diffusion coefficient to obtain the residual-diffusion coefficient. The validity of the SER for the residual-diffusion coefficient, instead of the total diffusion coefficient, proves the role of jump-diffusion in the breakdown of the SER. Finally, we made an effort to connect the jump-diffusion with the microscopic structure of water. As the tagged water molecule is more strongly arrested by neighboring water molecules it diffuses more via jump translation. This correlation is important in explaining the breakdown of the SER in various systems.
We now comment on the timescale relevant to the breakdown of the SER in the general supercooled liquid. Kaufman and coworkers202 calculated frequency-dependent diffusion and viscosity coefficients to check the validity of the generalized SER. The authors found that the SER is valid to a good approximation at the frequencies that are associated with the β-relaxation regime when the particles rattle inside the cage. The authors argued that although the β-relaxation regime is dynamically heterogeneous the SER remains valid and therefore they concluded that the dynamical heterogeneity does not necessitate the breakdown of the SER. This was opposite to the general notion that the breakdown of the SER stems from the heterogeneous dynamics of the system having both highly mobile and least mobile particles.117 Note that the above conclusion was drawn based on the non-Gaussian parameter α2(t). However, there is an intense debate on the actual time scale depicting the dynamical heterogeneity and the SER breakdown. Instead of using α2(t), Szamel and coworkers203 proposed a new non-Gaussian parameter γ(t) that weights the immobile particles which move less than expected from the Gaussian distribution. It was found that γ(t) performs better than α2(t) as far as the heterogeneity timescale is concerned. Although at a higher temperature, the peak positions for α2(t) and γ(t) are same, the peak position of α2(t) increases slower than γ(t) with decreasing temperature. Studies by Kim and Saito investigated the lifetime of dynamical heterogeneity in supercooled liquids using a four-point, three-time density correlation function.204,205 They examined the physical role of the lifetime of dynamical heterogeneity τhetero in the breakdown of SER by calculating the frequency-dependent viscosity and self-diffusion constant.206 At low temperatures, a strong breakdown of SER was observed at lower frequencies. The characteristic time scale of the violation is in accord with τhetero. Therefore the dynamical heterogeneity is directly linked to the violation of the SE relation in supercooled liquids. These studies raised an important point about the actual timescale concerning the dynamic heterogeneity and breakdown of the SER in supercooled water. In the heterogeneous dynamics, the jump diffusion of particles are responsible for the breakdown of the SER. One can address how these different timescales contribute to the breakdown of SER via the present TJD approach.
Finally, we comment here on the future scope of the TJD approach. Even though the above approach has been used only in pure bulk water and a binary mixture of water and methanol, this approach has potential application in various problems. The following are some of the problems one can study using the TJD approach. (i) Although we have considered here only the supercooled water, very similar behaviors are seen for other liquids also. Diffusion in mediums, such as room temperature ionic liquids (RTILs)147,207–212 deep eutectic systems (DES),213–217 phase change material (PCM),218–221 usual glass-forming liquids,222–230 and polymeric material,231–236 show a strong breakdown of the SER. The TJD approach may provide insights into this problem. For understanding in a crowded environment or highly heterogeneous medium, position-dependent diffusion and friction might be relevant.237–242 (ii) The experimental observation on the breakdown of the SER in water at extreme pressure (GPa range) and temperature challenged the usual concept of hot dense water behaving as a simple liquid.106 The LLCP hypothesis and the two-state model of water seem to fail in explaining the breakdown of the SER in the above T–P region. The present TJD approach can provide new insights into the breakdown of the SER in this regime. (iii) Hopping dynamics of molecules in a biological system are important. The hopping of lipid molecules from one domain to another in the biological cell membrane is important in various contexts, such as protein trafficking, cell signaling, etc.243–252 The TJD approach, with necessary modification, can be used for understanding the hopping dynamics of the lipid molecules and elucidating allied biological problems. This approach can be also used to understand the diffusive dynamics of protein and water in its hydration shells188,217,253–257 (iv) The quantum effect on dynamics of water is very important, particularly in the deeply supercooled regime near the glass transition temperature.258 A number of studies have suggested that the quantum fluctuation partially disrupts the H-bonding network of water.258,259 The less structured H-bonding network, compared to that in the classical counterpart, somewhat reduces the viscosity of the medium and enhances the translational and rotational diffusion of the molecules.258,260–268 Although the quantum effects of different dynamical properties of supercooled water are studied the quantum effect on the validity of the SER remains largely unaddressed. This might be an important topic to address in the future using the TJD approach.
Abbreviations
| 1H-PGSTE | 1H-Pulsed gradient stimulated spin-echo technique |
| CPF | Critical-point-free |
| DW | Debye–Waller |
| FTIR | Fourier transform infrared spectroscopy |
| HDL | High-density liquid |
| HDS | High-density state |
| LDL | Low-density liquid |
| LDS | Low-density state |
| LLCP | Liquid–liquid critical point |
| MD | Molecular dynamics |
| MSD | Mean square displacement |
| QENS | Quasi-elastic neutron scattering |
| SER | Stokes–Einstein relation |
| SEDR | Stokes–Einstein–Debye relation |
| SFA | Singularity free approach |
| SLC | Stability-limit conjecture |
| TIP4P/2005 | Transferrable intermolecular potential four point/2005 |
| TIP5P | Transferrable intermolecular potential five point |
| TJD | Translational Jump-diffusion |
| TMD | Temperature of maximum density |
| VFT | Vogel–Fulcher–Tamman |
Conflicts of interest
There are no conflicts to declare.
Appendix
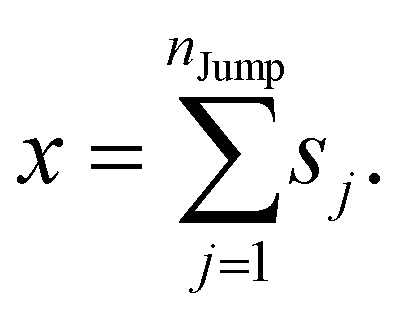
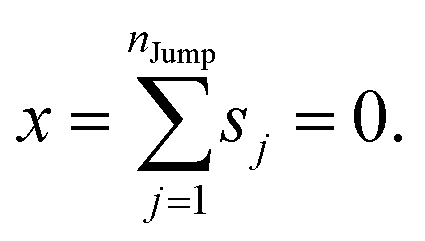
We assume that the translational jumps of molecules are not correlated and statistically independent from each other. Therefore, the current problem effectively turns into the random walk problem.10 For simplicity, we derive for 1D random walk. As per the definition of the random walk, the probability of moving along the positive x-axis is equal to the probability of moving along the negative x-axis. Let us assume the total number of jumps of a molecule is nJump. Let us suppose that a jumping molecule takes displacement sj because of the jth jump occurrence. Note that unlike λi, which is always positive, sj can be either positive or negative. Due to the number of jumps, the effective displacement of a molecule is:| |  | (A1) |
These jumps are assumed to be completely independent of each other. The average over many replicas of the random walk is
| |  | (A2) |
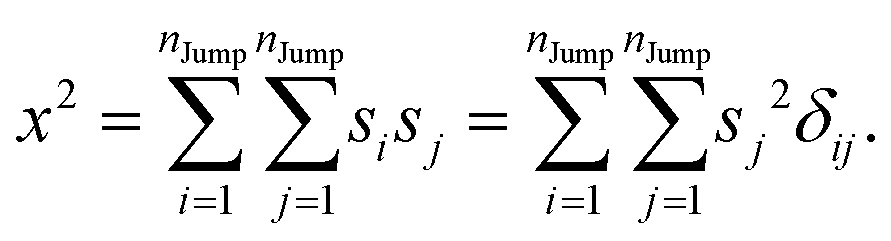
Similarly, we can calculate the average square displacement as
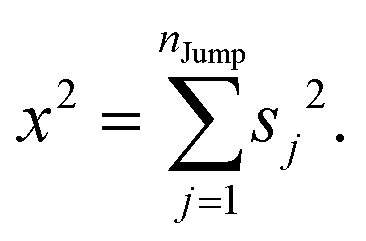
| |  | (A3) |
Therefore, we can write
| |  | (A4) |
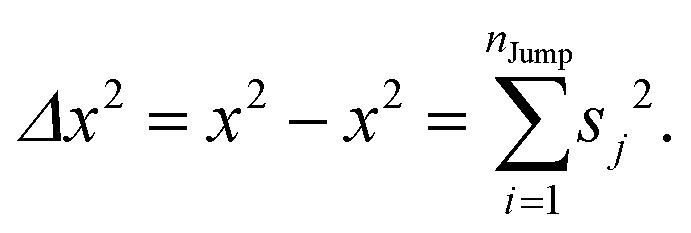
Therefore, the variance can be written as,
| |  | (A5) |
Now, for three dimensions, we can write,
| |  | (A6) |
where
λj2 is square jump distance in three-dimension for the
jth jump-trajectory segment.
λJump2 is the average square jump distance, which can be written as,
| |  | (A7) |
r2 at the final time of the trajectory,
ttraj can be obtained also from Einstein's equation
Comparing
eqn (A6) and (A8), we obtain the expression of
DJump as
| |  | (A9) |
where
νJump, the jump frequency, can be written as,
and
λJump2 is calculated using
eqn (A7).
Although the eqn (A9) is derived for one particle, we can analyze the trajectories of all N molecules, present in the system and calculate the jump-diffusion coefficient using eqn (A9). However, the calculations of νJump and λJump2 consider all jump occurrences in the system. If the total number of jump occurrences is NJump for all the N molecules, we can write the expression of νJump and λJump2 as following,
| |  | (A11) |
Here νJump is the jump frequency (number of jump occurrences per molecule in unit time) and λJump2 is the average square jump length, averaged over all the jump events in the system NJump. So, we can write the expressions of νJump and λJump2 as follows:
| |  | (A12) |
and
| |  | (A13) |
Acknowledgements
We acknowledge IIT Patna and the SERB Early Career Research Award (ECR/2017/002335) for funding. We acknowledge the anonymous reviewers for their great suggestions to improve the quality of the MS. We acknowledge Dr Premashis Manna and Mr Tonmoy Sharma for assisting in curve fitting. We acknowledge Dr Sandipa Indra for her contribution in the initial works on solute's translational jump diffusion in supercooled water. We are grateful to Prof. Pratim K. Chattaraj for his strong support. We thank Prof. James T. Hynes and Prof. Ranjit Biswas for their encouragement. We appreciate Ms Shakkira Erimaban, and Ms Archita Maiti for their valuable inputs. We dedicate this article in memory of S.D.'s beloved grandmother Late Kanak Lata Daschakraborty.
References
- P. Gallo, K. Amann-Winkel, C. A. Angell, M. A. Anisimov, F. d. r. Caupin, C. Chakravarty, E. Lascaris, T. Loerting, A. Z. Panagiotopoulos and J. Russo, Chem. Rev., 2016, 116, 7463–7500 CrossRef CAS PubMed.
-
F. Franks, Water: a matrix of life, Royal Society of Chemistry, 2000 Search PubMed.
-
F. Franks, Water A Comprehensive Treatise: Volume 4: Aqueous Solutions of Amphiphiles and Macromolecules, Springer US, 2013 Search PubMed.
-
P. G. Debenedetti, Metastable liquids: concepts and principles, Princeton University Press, 1996 Search PubMed.
- P. G. Debenedetti, J. Phys.: Condens. Matter, 2003, 15, R1669 CrossRef CAS.
- P. G. Debenedetti and H. E. Stanley, Phys. Today, 2003, 56, 40–46 CrossRef CAS.
- C. A. Angell, Annu. Rev. Phys. Chem., 2004, 55, 559–583 CrossRef PubMed.
- P. Ball, Chem. Rev., 2008, 108, 74–108 CrossRef CAS PubMed.
-
M.-C. Bellissent-Funel, Hydration processes in biology: Theoretical and experimental approaches, IOS Press, 1999 Search PubMed.
-
M. W. Evans, G. W. Robinson, S. Singh and S.-B. Zhu, Water in biology, chemistry and physics: experimental overviews and computational methodologies, World Scientific, 1996 Search PubMed.
- C. A. Angell, Annu. Rev. Phys. Chem., 1983, 34, 593–630 CrossRef CAS.
-
D. S. Eisenberg and W. Kauzmann, The structure and properties of water, Oxford University Press, Oxford, 2005 Search PubMed.
- L. G. M. Pettersson, R. H. Henchman and A. Nilsson, Chem. Rev., 2016, 116, 7459–7462 CrossRef CAS PubMed.
- S. Saito and B. Bagchi, J. Chem. Phys., 2019, 150, 054502 CrossRef PubMed.
- S. Saito, I. Ohmine and B. Bagchi, J. Chem. Phys., 2013, 138, 094503 CrossRef PubMed.
- P. H. Poole, F. Sciortino, U. Essmann and H. E. Stanley, Nature, 1992, 360, 324–328 CrossRef CAS.
- O. Mishima and H. E. Stanley, Nature, 1998, 396, 329–335 CrossRef CAS.
- H. E. Stanley and V. K. Wong, Am. J. Phys., 1972, 40, 927–928 CrossRef.
- P. Kumar and H. E. Stanley, J. Phys. Chem. B, 2011, 115, 14269–14273 CrossRef CAS PubMed.
- C. Angell, W. Sichina and M. Oguni, J. Phys. Chem., 1982, 86, 998–1002 CrossRef CAS.
- H. Sato, K. Watanabe, J. Levelt Sengers, J. S. Gallagher, P. G. Hill, J. Straub and W. Wagner, J. Phys. Chem. Ref. Data, 1991, 20, 1023–1044 CrossRef CAS.
- O. Conde, J. Teixeira and P. Papon, J. Chem. Phys., 1982, 76, 3747–3753 CrossRef CAS.
- H. Kanno and C. Angell, J. Chem. Phys., 1979, 70, 4008–4016 CrossRef CAS.
- C. Bertrand and M. Anisimov, J. Phys. Chem. B, 2011, 115, 14099–14111 CrossRef CAS PubMed.
- C. Jeffery and P. Austin, J. Chem. Phys., 1999, 110, 484–496 CrossRef CAS.
- S. Kiselev, Int. J. Thermophys., 2001, 22, 1421–1433 CrossRef CAS.
- S. Kiselev and J. Ely, J. Chem. Phys., 2002, 116, 5657–5665 CrossRef CAS.
- J. Kalova and R. Mares, Int. J. Thermophys., 2010, 31, 756–765 CrossRef CAS.
- P. H. Poole, F. Sciortino, U. Essmann and H. E. Stanley, Phys. Rev. E: Stat. Phys., Plasmas, Fluids, Relat. Interdiscip. Top., 1993, 48, 3799 CrossRef CAS PubMed.
- P. H. Poole, U. Essmann, F. Sciortino and H. E. Stanley, Phys. Rev. E: Stat., Nonlinear, Soft Matter Phys., 1993, 48, 4605 CrossRef CAS PubMed.
- F. Sciortino, P. H. Poole, U. Essmann and H. Stanley, Phys. Rev. E: Stat. Phys., Plasmas, Fluids, Relat. Interdiscip. Top., 1997, 55, 727 CrossRef CAS.
- S. Sastry, P. G. Debenedetti, F. Sciortino and H. E. Stanley, Phys. Rev. E: Stat. Phys., Plasmas, Fluids, Relat. Interdiscip. Top., 1996, 53, 6144 CrossRef CAS PubMed.
- C. A. Angell, Science, 2008, 319, 582–587 CrossRef CAS PubMed.
- P. Chitnelawong, F. Sciortino and P. H. Poole, J. Chem. Phys., 2019, 150, 234502 CrossRef PubMed.
- R. J. Speedy, J. Phys. Chem., 1982, 86, 982–991 CrossRef CAS.
- E. Lascaris, Phys. Rev. Lett., 2016, 116, 125701 CrossRef PubMed.
- D. Fuentevilla and M. Anisimov, Phys. Rev. Lett., 2006, 97, 195702 CrossRef CAS PubMed.
- V. Holten and M. Anisimov, Sci. Rep., 2012, 2, 1–7 Search PubMed.
- H. Stanley, P. Kumar, G. Franzese, L. Xu, Z. Yan, M. G. Mazza, S. Buldyrev, S.-H. Chen and F. Mallamace, Eur. Phys. J.: Spec. Top., 2008, 161, 1–17 Search PubMed.
- L. Xu, P. Kumar, S. V. Buldyrev, S.-H. Chen, P. H. Poole, F. Sciortino and H. E. Stanley, Proc. Natl. Acad. Sci. U. S. A., 2005, 102, 16558–16562 CrossRef CAS PubMed.
- H. Tanaka, J. Chem. Phys., 2000, 112, 799–809 CrossRef CAS.
- H. Tanaka, Phys. Rev. B: Condens. Matter Mater. Phys., 2002, 66, 064202 CrossRef.
- H. Tanaka, Eur. Phys. J. E: Soft Matter Biol. Phys., 2012, 35, 113 CrossRef PubMed.
- R. Shi and H. Tanaka, Proc. Natl. Acad. Sci. U. S. A., 2020, 117, 26591–26599 CrossRef CAS PubMed.
- V. Holten, J. V. Sengers and M. A. Anisimov, J. Phys. Chem. Ref. Data, 2014, 43, 043101 CrossRef.
- P. H. Poole, F. Sciortino, T. Grande, H. E. Stanley and C. A. Angell, Phys. Rev. Lett., 1994, 73, 1632–1635 CrossRef CAS PubMed.
-
F. Caupin and M. A. Anisimov, 2021, arXiv:2104.08117.
- L. P. Singh, B. Issenmann and F. Caupin, Proc. Natl. Acad. Sci. U. S. A., 2017, 114, 4312–4317 CrossRef CAS PubMed.
- K. Ito, C. T. Moynihan and C. A. Angell, Nature, 1999, 398, 492–495 CrossRef CAS.
- Y. Zhang, M. Lagi, E. Fratini, P. Baglioni, E. Mamontov and S.-H. Chen, Phys. Rev. E: Stat., Nonlinear, Soft Matter Phys., 2009, 79, 040201 CrossRef PubMed.
- P. Gallo, M. Rovere and S. H. Chen, J. Phys. Chem. Lett., 2010, 1, 729–733 CrossRef CAS.
- Z. Wang, P. Le, K. Ito, J. B. Leão, M. Tyagi and S.-H. Chen, J. Chem. Phys., 2015, 143, 114508 CrossRef PubMed.
- M. D. Marzio, G. Camisasca, M. Rovere and P. Gallo, J. Chem. Phys., 2016, 144, 074503 CrossRef PubMed.
- A. Dehaoui, B. Issenmann and F. Caupin, Proc. Natl. Acad. Sci. U. S. A., 2015, 112, 12020–12025 CrossRef CAS PubMed.
- S.-H. Chen, F. Mallamace, C.-Y. Mou, M. Broccio, C. Corsaro, A. Faraone and L. Liu, Proc. Natl. Acad. Sci. U. S. A., 2006, 103, 12974–12978 CrossRef CAS PubMed.
- P. Kumar, Proc. Natl. Acad. Sci. U. S. A., 2006, 103, 12955–12956 CrossRef CAS PubMed.
- S. R. Becker, P. H. Poole and F. W. Starr, Phys. Rev. Lett., 2006, 97, 055901 CrossRef PubMed.
- P. Kumar, S. V. Buldyrev, S. R. Becker, P. H. Poole, F. W. Starr and H. E. Stanley, Proc. Natl. Acad. Sci. U. S. A., 2007, 104, 9575–9579 CrossRef CAS.
- M. G. Mazza, N. Giovambattista, H. E. Stanley and F. W. Starr, Phys. Rev. E: Stat., Nonlinear, Soft Matter Phys., 2007, 76, 031203 CrossRef PubMed.
- L. Xu, F. Mallamace, Z. Yan, F. W. Starr, S. V. Buldyrev and H. Eugene Stanley, Nat. Phys., 2009, 5, 565–569 Search PubMed.
- S. H. Chong, S. H. Chen and F. Mallamace, J. Phys.: Condens. Matter, 2009, 21, 504101 CrossRef PubMed.
- P. Montero de Hijes, E. Sanz, L. Joly, C. Valeriani and F. Caupin, J. Chem. Phys., 2018, 149, 094503 CrossRef PubMed.
- N. Galamba, J. Phys.: Condens. Matter, 2016, 29, 015101 CrossRef PubMed.
- S. Dueby, V. Dubey and S. Daschakraborty, J. Phys. Chem. B, 2019, 123, 7178–7189 CrossRef CAS PubMed.
- V. Dubey, S. Erimban, S. Indra and S. Daschakraborty, J. Phys. Chem. B, 2019, 123, 10089–10099 CrossRef CAS PubMed.
- V. Dubey and S. Daschakraborty, J. Phys. Chem. B, 2020, 124, 10398–10408 CrossRef CAS PubMed.
- S. Chandrasekhar, Rev. Mod. Phys., 1943, 15, 1–89 CrossRef.
- S. Chandrasekhar, Rev. Mod. Phys., 1949, 21, 383–388 CrossRef.
-
A. Einstein and R. Fürth, Investigations on the theory of Brownian movement, Dover Publications, New York, N.Y., 1956 Search PubMed.
-
D. S. Ray, 1999, arXiv preprint physics/9903033.
- C. Goy, M. A. C. Potenza, S. Dedera, M. Tomut, E. Guillerm, A. Kalinin, K.-O. Voss, A. Schottelius, N. Petridis, A. Prosvetov, G. Tejeda, J. M. Fernández, C. Trautmann, F. Caupin, U. Glasmacher and R. E. Grisenti, Phys. Rev. Lett., 2018, 120, 015501 CrossRef CAS PubMed.
- D. Rosenfeld and W. L. Woodley, Nature, 2000, 405, 440–442 CrossRef CAS PubMed.
- B. Riechers, F. Wittbracht, A. Hütten and T. Koop, Phys. Chem. Chem. Phys., 2013, 15, 5873–5887 RSC.
- P. Taborek, Phys. Rev. B: Condens. Matter Mater. Phys., 1985, 32, 5902–5906 CrossRef CAS PubMed.
- D. E. Hare and C. M. Sorensen, J. Chem. Phys., 1986, 84, 5085–5089 CrossRef CAS.
- B. J. Mason, Adv. Phys., 1958, 7, 221–234 CrossRef CAS.
- H. Kanno, R. J. Speedy and C. A. Angell, Science, 1975, 189, 880–881 CrossRef CAS PubMed.
- N. J. Hestand and J. L. Skinner, J. Chem. Phys., 2018, 149, 140901 CrossRef PubMed.
- J. A. Sellberg, C. Huang, T. A. McQueen, N. D. Loh, H. Laksmono, D. Schlesinger, R. G. Sierra, D. Nordlund, C. Y. Hampton, D. Starodub, D. P. DePonte, M. Beye, C. Chen, A. V. Martin, A. Barty, K. T. Wikfeldt, T. M. Weiss, C. Caronna, J. Feldkamp, L. B. Skinner, M. M. Seibert, M. Messerschmidt, G. J. Williams, S. Boutet, L. G. M. Pettersson, M. J. Bogan and A. Nilsson, Nature, 2014, 510, 381–384 CrossRef CAS PubMed.
- R. Bergman and J. Swenson, Nature, 2000, 403, 283–286 CrossRef CAS PubMed.
- K. Koga, H. Tanaka and X. C. Zeng, Nature, 2000, 408, 564–567 CrossRef CAS PubMed.
- B. Webber and J. Dore, J. Phys.: Condens. Matter, 2004, 16, S5449–S5470 CrossRef CAS.
- J. Dore, Chem. Phys., 2000, 258, 327–347 CrossRef CAS.
- S. Cerveny, F. Mallamace, J. Swenson, M. Vogel and L. Xu, Chem. Rev., 2016, 116, 7608–7625 CrossRef CAS PubMed.
- L. Berthier, G. Biroli, J.-P. Bouchaud, L. Cipelletti, D. E. Masri, D. L'Hôte, F. Ladieu and M. Pierno, Science, 2005, 310, 1797–1800 CrossRef CAS PubMed.
- F. H. Stillinger and J. A. Hodgdon, Phys. Rev. E: Stat. Phys., Plasmas, Fluids, Relat. Interdiscip. Top., 1994, 50, 2064–2068 CrossRef CAS PubMed.
- G. Tarjus and D. Kivelson, J. Chem. Phys., 1995, 103, 3071–3073 CrossRef CAS.
- E. R. Weeks, J. C. Crocker, A. C. Levitt, A. Schofield and D. A. Weitz, Science, 2000, 287, 627–631 CrossRef CAS PubMed.
- K. L. Ngai, Philos. Mag. B, 1999, 79, 1783–1797 CrossRef CAS.
- F. Bruni, R. Mancinelli and M. A. Ricci, Phys. Chem. Chem. Phys., 2011, 13, 19773–19779 RSC.
- S. Cerveny, J. Colmenero and A. Alegría, Phys. Rev. Lett., 2006, 97, 189802 CrossRef PubMed.
- M. Tyagi, A. Arbe, J. Colmenero, B. Frick and J. R. Stewart, Macromolecules, 2006, 39, 3007–3018 CrossRef CAS.
- A. C. Genix, A. Arbe, F. Alvarez, J. Colmenero, W. Schweika and D. Richter, Macromolecules, 2006, 39, 3947–3958 CrossRef CAS.
- J. Swenson, Phys. Rev. Lett., 2006, 97, 189801 CrossRef PubMed.
- J. Swenson and J. Teixeira, J. Chem. Phys., 2010, 132, 014508 CrossRef PubMed.
- S. Capaccioli, K. L. Ngai, S. Ancherbak, P. A. Rolla and N. Shinyashiki, J. Non-Cryst. Solids, 2011, 357, 641–654 CrossRef CAS.
- W. Doster, S. Busch, A. M. Gaspar, M. S. Appavou, J. Wuttke and H. Scheer, Phys. Rev. Lett., 2010, 104, 098101 CrossRef CAS PubMed.
- S. Khodadadi, S. Pawlus and A. P. Sokolov, J. Phys. Chem. B, 2008, 112, 14273–14280 CrossRef CAS PubMed.
- S. Khodadadi, S. Pawlus, J. H. Roh, V. G. Sakai, E. Mamontov and A. P. Sokolov, J. Chem. Phys., 2008, 128, 195106 CrossRef CAS PubMed.
- M. G. Mazza, K. Stokely, S. E. Pagnotta, F. Bruni, H. E. Stanley and G. Franzese, Proc. Natl. Acad. Sci. U. S. A., 2011, 108, 19873–19878 CrossRef CAS PubMed.
- B. Jana and B. Bagchi, J. Phys. Chem. B, 2009, 113, 2221–2224 CrossRef CAS PubMed.
- B. Jana, R. S. Singh and B. Bagchi, Phys. Chem. Chem. Phys., 2011, 13, 16220–16226 RSC.
- S. H. Glarum, J. Chem. Phys., 1960, 33, 1371–1375 CrossRef CAS.
- D. Laage and J. T. Hynes, Science, 2006, 311, 832–835 CrossRef CAS PubMed.
- D. Laage and J. T. Hynes, J. Phys. Chem. B, 2008, 112, 14230–14242 CrossRef CAS PubMed.
- L. E. Bove, S. Klotz, T. Strässle, M. Koza, J. Teixeira and A. M. Saitta, Phys. Rev. Lett., 2013, 111, 185901 CrossRef CAS PubMed.
- E. Guillaud, S. Merabia, D. de Ligny and L. Joly, Phys. Chem. Chem. Phys., 2017, 19, 2124–2130 RSC.
- Z. Shi, P. G. Debenedetti and F. H. Stillinger, J. Chem. Phys., 2013, 138, 12A526 CrossRef PubMed.
- W. S. Price, H. Ide and Y. Arata, J. Phys. Chem. A, 1999, 103, 448–450 CrossRef CAS.
- J. Qvist, C. Mattea, E. P. Sunde and B. Halle, J. Chem. Phys., 2012, 136, 204505 CrossRef PubMed.
- F. Fujara, B. Geil, H. Sillescu and G. Fleischer, Z. Phys. B: Condens. Matter, 1992, 88, 195–204 CrossRef CAS.
- I. Chang, F. Fujara, B. Geil, G. Heuberger, T. Mangel and H. Sillescu, J. Non-Cryst. Solids, 1994, 172, 248–255 CrossRef.
- I. Chang and H. Sillescu, J. Phys. Chem. B, 1997, 101, 8794–8801 CrossRef CAS.
- M. T. Cicerone and M. D. Ediger, J. Chem. Phys., 1996, 104, 7210–7218 CrossRef CAS.
- S. F. Swallen, P. A. Bonvallet, R. J. McMahon and M. D. Ediger, Phys. Rev. Lett., 2003, 90, 015901 CrossRef PubMed.
- S. F. Swallen and M. D. Ediger, Soft Matter, 2011, 7, 10339–10344 RSC.
- M. D. Ediger, Annu. Rev. Phys. Chem., 2000, 51, 99–128 CrossRef CAS PubMed.
- M. Vedamuthu, S. Singh and G. W. Robinson, J. Phys. Chem., 1994, 98, 2222–2230 CrossRef CAS.
- T. Kawasaki and K. Kim, Sci. Adv., 2017, 3, e1700399 CrossRef PubMed.
- T. Kawasaki and K. Kim, J. Stat. Mech.: Theory Exp., 2019, 2019, 084004 CrossRef.
- J. L. Abascal and C. Vega, J. Chem. Phys., 2005, 123, 234505 CrossRef CAS PubMed.
- M. A. González and J. L. F. Abascal, J. Chem. Phys., 2011, 135, 224516 CrossRef PubMed.
- V. Dubey, S. Dueby, S. Erimban and S. Daschakraborty, J. Indian Chem. Soc., 2019, 96, 741–751 CAS.
- V. Dubey, N. Kumar and S. Daschakraborty, J. Phys. Chem. B, 2018, 122, 7569–7583 CrossRef CAS PubMed.
- S. Indra and S. Daschakraborty, Chem. Phys. Lett., 2017, 685, 322–327 CrossRef CAS.
- S. Sastry, P. G. Debenedetti and F. H. Stillinger, Nature, 1998, 393, 554–557 CrossRef CAS.
- A. Mukherjee, S. Bhattacharyya and B. Bagchi, J. Chem. Phys., 2002, 116, 4577–4586 CrossRef CAS.
- S. Bhattacharyya and B. Bagchi, Phys. Rev. Lett., 2002, 89, 025504 CrossRef PubMed.
- M. T. Cicerone, Q. Zhong and M. Tyagi, Phys. Rev. Lett., 2014, 113, 117801 CrossRef PubMed.
- R. Pastore, A. Coniglio and M. Pica Ciamarra, Soft Matter, 2014, 10, 5724–5728 RSC.
- M. P. Ciamarra, R. Pastore and A. Coniglio, Soft Matter, 2016, 12, 358–366 RSC.
- S. M. Bhattacharyya, B. Bagchi and P. G. Wolynes, Proc. Natl. Acad. Sci. U. S. A., 2008, 105, 16077–16082 CrossRef CAS PubMed.
- M. Goldstein, J. Chem. Phys., 1969, 51, 3728–3739 CrossRef CAS.
- M. D. Marzio, G. Camisasca, M. Rovere and P. Gallo, J. Chem. Phys., 2017, 146, 084502 CrossRef PubMed.
- A. Rahman, Phys. Rev., 1964, 136, A405–A411 CrossRef.
- T. Chen, B. Smit and A. T. Bell, J. Chem. Phys., 2009, 131, 246101 CrossRef PubMed.
- P. J. Daivis and D. J. Evans, J. Chem. Phys., 1994, 100, 541–547 CrossRef CAS.
- M. Mondello and G. S. Grest, J. Chem. Phys., 1997, 106, 9327–9336 CrossRef CAS.
- F. Müller-Plathe, S. C. Rogers and W. F. van Gunsteren, Chem. Phys. Lett., 1992, 199, 237–243 CrossRef.
- H. Takeuchi, J. Chem. Phys., 1990, 93, 2062–2067 CrossRef CAS.
- S. Bhattacharyya, A. Mukherjee and B. Bagchi, J. Chem. Phys., 2002, 117, 2741–2746 CrossRef CAS.
- E. Tocci, D. Hofmann, D. Paul, N. Russo and E. Drioli, Polymer, 2001, 42, 521–533 CrossRef CAS.
- S. Acharya, M. K. Nandi, A. Mandal, S. Sarkar and S. M. Bhattacharyya, J. Phys. Chem. B, 2015, 119, 11169–11175 CrossRef CAS PubMed.
- A. V. Anil Kumar and S. K. Bhatia, J. Phys. Chem. B, 2006, 110, 3109–3113 CrossRef PubMed.
- T. E. Raptis, V. E. Raptis and J. Samios, J. Phys. Chem. B, 2007, 111, 13683–13693 CrossRef CAS PubMed.
- T. E. Raptis, V. E. Raptis and J. Samios, Mol. Phys., 2012, 110, 1171–1178 CrossRef CAS.
- J. C. Araque, S. K. Yadav, M. Shadeck, M. Maroncelli and C. J. Margulis, J. Phys. Chem. B, 2015, 119, 7015–7029 CrossRef CAS PubMed.
- M. S. Shell, P. G. Debenedetti and F. H. Stillinger, J. Phys.: Condens. Matter, 2005, 17, S4035 CrossRef CAS.
- S. Sengupta and S. Karmakar, J. Chem. Phys., 2014, 140, 224505 CrossRef PubMed.
- I.-C. Yeh and G. Hummer, J. Phys. Chem. B, 2004, 108, 15873–15879 CrossRef CAS.
- S. Tazi, A. Boţan, M. Salanne, V. Marry, P. Turq and B. Rotenberg, J. Phys.: Condens. Matter, 2012, 24, 284117 CrossRef PubMed.
- R. Torre, P. Bartolini and R. Righini, Nature, 2004, 428, 296–299 CrossRef CAS PubMed.
- A. Taschin, P. Bartolini, R. Eramo, R. Righini and R. Torre, Nat. Commun., 2013, 4, 1–8 Search PubMed.
- R. J. Speedy and C. A. Angell, J. Chem. Phys., 1976, 65, 851–858 CrossRef CAS.
- F. Mallamace, C. Branca, C. Corsaro, N. Leone, J. Spooren, S.-H. Chen and H. E. Stanley, Proc. Natl. Acad. Sci. U. S. A., 2010, 107, 22457–22462 CrossRef CAS PubMed.
-
N. Brahms, Generalized Nonlinear Non-analytic Chi-Square Fitting, MATLAB Central File Exchange, 2021 Search PubMed.
-
W. H. Press, S. A. Teukolsky, W. T. Vetterling and B. P. Flannery, Numerical Recipes 3rd Edition: The Art of Scientific Computing, Cambridge University Press, 2007 Search PubMed.
- D. W. Marquardt, J. Soc. Ind. Appl. Math., 1963, 11, 431–441 CrossRef.
- K. R. Harris and P. J. Newitt, J. Chem. Eng. Data, 1997, 42, 346–348 CrossRef CAS.
- C. Corsaro, E. Fazio and D. Mallamace, J. Chem. Phys., 2019, 150, 234506 CrossRef CAS PubMed.
- J. Simpson and H. Carr, Phys. Rev., 1958, 111, 1201 CrossRef CAS.
- C. Cho, J. Urquidi, S. Singh and G. W. Robinson, J. Phys. Chem. B, 1999, 103, 1991–1994 CrossRef CAS.
- F. Kurata, T. W. Yergovich and G. W. Swift, J. Chem. Eng. Data, 1971, 16, 222–226 CrossRef CAS.
- S. Mikhail and W. Kimel, J. Chem. Eng. Data, 1961, 6, 533–537 CrossRef CAS.
- R. L. Hurle, A. J. Easteal and L. A. Woolf, J. Chem. Soc., Faraday Trans. 1, 1985, 81, 769–779 RSC.
- G. Guevara-Carrion, J. Vrabec and H. Hasse, J. Chem. Phys., 2011, 134, 074508 CrossRef PubMed.
- N. Asahi and Y. Nakamura, J. Chem. Phys., 1998, 109, 9879–9887 CrossRef CAS.
- N. Karger, T. Vardag and H. D. Lüdemann, J. Chem. Phys., 1990, 93, 3437–3444 CrossRef CAS.
- C. Corsaro, R. Maisano, D. Mallamace and G. Dugo, Phys. A, 2013, 392, 596–601 CrossRef CAS.
- F. Kurata, T. W. Yergovich and G. W. Swift, J. Chem. Eng. Data, 1971, 16, 222–226 CrossRef CAS.
- S. Z. Mikhail and W. R. Kimel, J. Chem. Eng. Data, 1961, 6, 533–537 CrossRef CAS.
- D. Bulone, C. Spinnato, F. Madonia and M. U. Palma, J. Chem. Phys., 1989, 91, 408–415 CrossRef CAS.
- H. Kubota, S. Tsuda, M. Murata, T. Yamamoto, Y. Tanaka and T. Makita, Rev. Phys. Chem. Jpn., 1980, 49, 59–69 Search PubMed.
- R. Rey, K. B. Møller and J. T. Hynes, J. Phys. Chem. A, 2002, 106, 11993–11996 CrossRef CAS.
- C. P. Lawrence and J. L. Skinner, J. Chem. Phys., 2003, 118, 264–272 CrossRef CAS.
- A. Luzar and D. Chandler, Nature, 1996, 379, 55 CrossRef CAS.
- J. D. Eaves, J. J. Loparo, C. J. Fecko, S. T. Roberts, A. Tokmakoff and P. L. Geissler, Proc. Natl. Acad. Sci. U. S. A., 2005, 102, 13019–13022 CrossRef CAS PubMed.
- N. Galamba, J. Phys. Chem. B, 2013, 117, 2153–2159 CrossRef CAS PubMed.
- J. R. Errington and P. G. Debenedetti, Nature, 2001, 409, 318–321 CrossRef CAS PubMed.
- P. L. Chau and A. J. Hardwick, Mol. Phys., 1998, 93, 511–518 CrossRef CAS.
- S. Chatterjee, P. G. Debenedetti, F. H. Stillinger and R. M. Lynden-Bell, J. Chem. Phys., 2008, 128, 124511 CrossRef PubMed.
- S. Daschakraborty, J. Chem. Phys., 2018, 148, 134501 CrossRef PubMed.
- R. Shi, J. Russo and H. Tanaka, J. Chem. Phys., 2018, 149, 224502 CrossRef PubMed.
- B. P. Bhowmik, I. Tah and S. Karmakar, Phys. Rev. E, 2018, 98, 022122 CrossRef CAS PubMed.
- T. Pal and R. Biswas, J. Chem. Phys., 2014, 141, 104501 CrossRef PubMed.
- T. Pal and R. Biswas, J. Phys. Chem. B, 2015, 119, 15683–15695 CrossRef CAS PubMed.
- S. Indra and R. Biswas, J. Phys. Chem. B, 2016, 120, 11214–11228 CrossRef CAS PubMed.
-
B. Bagchi, Water in biological and chemical processes: from structure and dynamics to function, Cambridge University Press 2013 Search PubMed.
- S. Roy, S. Banerjee, N. Biyani, B. Jana and B. Bagchi, J. Phys. Chem. B, 2011, 115, 685–692 CrossRef CAS PubMed.
- M. K. Hazra and B. Bagchi, J. Chem. Phys., 2018, 149, 084501 CrossRef PubMed.
- V. V. Chaban, Phys. Chem. Chem. Phys., 2018, 20, 23754–23761 RSC.
- S. Kumar, S. Sarkar and B. Bagchi, J. Chem. Phys., 2020, 152, 164507 CrossRef CAS PubMed.
- S. Sarkar, S. Banerjee, S. Roy, R. Ghosh, P. Ray and B. Bagchi, J. Chem. Sci., 2015, 127, 49–59 CrossRef CAS.
- T. Pradhan, P. Ghoshal and R. Biswas, J. Chem. Sci., 2008, 120, 275–287 CrossRef CAS.
- S. Indra and R. Biswas, J. Chem. Phys., 2015, 142, 204501 CrossRef PubMed.
- T. Pradhan, P. Ghoshal and R. Biswas, J. Phys. Chem. A, 2008, 112, 915–924 CrossRef CAS PubMed.
- S. Indra, B. Guchhait and R. Biswas, J. Chem. Phys., 2016, 144, 124506 CrossRef PubMed.
- S. Indra and R. Biswas, Mol. Simul., 2015, 41, 471–482 CrossRef CAS.
- S. Banerjee, J. Furtado and B. Bagchi, J. Chem. Phys., 2014, 140, 194502 CrossRef PubMed.
- S. Banerjee, R. Ghosh and B. Bagchi, J. Phys. Chem. B, 2012, 116, 3713–3722 CrossRef CAS PubMed.
- D. Banik, A. Roy, N. Kundu and N. Sarkar, J. Phys. Chem. B, 2015, 119, 9905–9919 CrossRef CAS PubMed.
- R. Zangi and L. J. Kaufman, Phys. Rev. E: Stat., Nonlinear, Soft Matter Phys., 2007, 75, 051501 CrossRef PubMed.
- E. Flenner and G. Szamel, Phys. Rev. E: Stat., Nonlinear, Soft Matter Phys., 2005, 72, 011205 CrossRef PubMed.
- K. Kim and S. Saito, Phys. Rev. E: Stat., Nonlinear, Soft Matter Phys., 2009, 79, 060501 CrossRef PubMed.
- K. Kim and S. Saito, J. Chem. Phys., 2010, 133, 044511 CrossRef PubMed.
- K. Kim and S. Saito, J. Phys. Soc. Jpn., 2010, 79, 093601 CrossRef.
- K. R. Harris, J. Chem. Phys., 2009, 131, 054503 CrossRef PubMed.
- D. Jeong, M. Y. Choi, H. J. Kim and Y. Jung, Phys. Chem. Chem. Phys., 2010, 12, 2001–2010 RSC.
- M. Sha, X. Ma, N. Li, F. Luo, G. Zhu and M. D. Fayer, J. Chem. Phys., 2019, 151, 154502 CrossRef PubMed.
- T. Köddermann, R. Ludwig and D. Paschek, ChemPhysChem, 2008, 9, 1851–1858 CrossRef PubMed.
- K. R. Harris, J. Phys. Chem. B, 2010, 114, 9572–9577 CrossRef CAS PubMed.
- S. K. Das, P. K. Sahu and M. Sarkar, J. Phys. Chem. B, 2013, 117, 636–647 CrossRef CAS PubMed.
- N. Subba, K. Polok, P. Piatkowski, B. Ratajska-Gadomska, R. Biswas, W. Gadomski and P. Sen, J. Phys. Chem. B, 2019, 123, 9212–9221 CrossRef CAS PubMed.
- R. Biswas, A. Das and H. Shirota, J. Chem. Phys., 2014, 141, 134506 CrossRef PubMed.
- Y. Wang, W. Chen, Q. Zhao, G. Jin, Z. Xue, Y. Wang and T. Mu, Phys. Chem. Chem. Phys., 2020, 22, 25760–25768 RSC.
- B. B. Hansen, S. Spittle, B. Chen, D. Poe, Y. Zhang, J. M. Klein, A. Horton, L. Adhikari, T. Zelovich, B. W. Doherty, B. Gurkan, E. J. Maginn, A. Ragauskas, M. Dadmun, T. A. Zawodzinski, G. A. Baker, M. E. Tuckerman, R. F. Savinell and J. R. Sangoro, Chem. Rev., 2021, 121, 1232–1285 CrossRef CAS PubMed.
- A. Maity, S. Sarkar, L. Theeyancheri and R. Chakrabarti, ChemPhysChem, 2020, 21, 552–567 CrossRef CAS PubMed.
- S. Wei, Z. Evenson, M. Stolpe, P. Lucas and C. A. Angell, Sci. Adv., 2018, 4, eaat8632 CrossRef CAS PubMed.
- G. C. Sosso, J. Colombo, J. Behler, E. Del Gado and M. Bernasconi, J. Phys. Chem. B, 2014, 118, 13621–13628 CrossRef CAS PubMed.
- S. Wei, C. Persch, M. Stolpe, Z. Evenson, G. Coleman, P. Lucas and M. Wuttig, Acta Mater., 2020, 195, 491–500 CrossRef CAS.
- G. C. Sosso, J. Behler and M. Bernasconi, Phys. Status Solidi B, 2012, 249, 1880–1885 CrossRef CAS.
- N. Ohtori, S. Miyamoto and Y. Ishii, Phys. Rev. E, 2017, 95, 052122 CrossRef PubMed.
- S. Pan, Z. W. Wu, W. H. Wang, M. Z. Li and L. Xu, Sci. Rep., 2017, 7, 39938 CrossRef CAS PubMed.
- S. Sengupta, S. Karmakar, C. Dasgupta and S. Sastry, J. Chem. Phys., 2013, 138, 12A548 CrossRef PubMed.
- M. Sharma and S. Yashonath, J. Phys. Chem. B, 2006, 110, 17207–17211 CrossRef CAS PubMed.
- M. K. Nandi and S. Maitra Bhattacharyya, J. Phys.: Condens. Matter, 2019, 32, 064001 CrossRef PubMed.
- A. D. S. Parmar, S. Sengupta and S. Sastry, Phys. Rev. Lett., 2017, 119, 056001 CrossRef PubMed.
- L. Costigliola, D. M. Heyes, T. B. Schrøder and J. C. Dyre, J. Chem. Phys., 2019, 150, 021101 CrossRef PubMed.
- A. Das and S. M. Ali, AIP Adv., 2020, 10, 045327 CrossRef CAS.
- T. C. Chan, H. T. Li and K. Y. Li, J. Phys. Chem. B, 2015, 119, 15718–15728 CrossRef CAS PubMed.
- P. Kumar, L. Theeyancheri, S. Chaki and R. Chakrabarti, Soft Matter, 2019, 15, 8992–9002 RSC.
- S. Chaki and R. Chakrabarti, Soft Matter, 2020, 16, 7103–7115 RSC.
- J. Świergiel, L. Bouteiller and J. Jadżyn, Soft Matter, 2014, 10, 8457–8463 RSC.
- B. Carroll, V. Bocharova, J.-M. Y. Carrillo, A. Kisliuk, S. Cheng, U. Yamamoto, K. S. Schweizer, B. G. Sumpter and A. P. Sokolov, Macromolecules, 2018, 51, 2268–2275 CrossRef CAS.
- Y. Jung, J. P. Garrahan and D. Chandler, J. Chem. Phys., 2005, 123, 084509 CrossRef PubMed.
- N. Samanta and R. Chakrabarti, Soft Matter, 2016, 12, 8554–8563 RSC.
- A. Bhattacharyay, J. Phys. A: Math. Theor., 2020, 53, 075002 CrossRef.
- L. P. Faucheux and A. J. Libchaber, Phys. Rev. E: Stat. Phys., Plasmas, Fluids, Relat. Interdiscip. Top., 1994, 49, 5158–5163 CrossRef CAS PubMed.
- P. Lançon, G. Batrouni, L. Lobry and N. Ostrowsky, Europhys. Lett., 2001, 54, 28–34 CrossRef.
- G. Volpe, L. Helden, T. Brettschneider, J. Wehr and C. Bechinger, Phys. Rev. Lett., 2010, 104, 170602 CrossRef PubMed.
- M. Wolfson, C. Liepold, B. Lin and S. A. Rice, J. Chem. Phys., 2018, 148, 194901 CrossRef PubMed.
- A. G. Cherstvy, A. V. Chechkin and R. Metzler, New J. Phys., 2013, 15, 083039 CrossRef.
- T. Apajalahti, P. Niemelä, P. N. Govindan, M. S. Miettinen, E. Salonen, S.-J. Marrink and I. Vattulainen, Faraday Discuss., 2010, 144, 411–430 RSC.
- S. Chiantia, J. Ries, N. Kahya and P. Schwille, ChemPhysChem, 2006, 7, 2409–2418 CrossRef CAS PubMed.
- T. Fujiwara, K. Ritchie, H. Murakoshi, K. Jacobson and A. Kusumi, J. Cell Biol., 2002, 157, 1071–1082 CrossRef CAS PubMed.
- G. de Wit, J. S. H. Danial, P. Kukura and M. I. Wallace, Proc. Natl. Acad. Sci. U. S. A., 2015, 112, 12299–12303 CrossRef CAS PubMed.
- J.-H. Jeon, H. M.-S. Monne, M. Javanainen and R. Metzler, Phys. Rev. Lett., 2012, 109, 188103 CrossRef PubMed.
- E. Sezgin, I. Levental, S. Mayor and C. Eggeling, Nat. Rev. Mol. Cell Biol., 2017, 18, 361–374 CrossRef CAS PubMed.
- R. Regmi, P. M. Winkler, V. Flauraud, K. J. E. Borgman, C. Manzo, J. Brugger, H. Rigneault, J. Wenger and M. F. García-Parajo, Nano Lett., 2017, 17, 6295–6302 CrossRef CAS PubMed.
- N. K. Sarangi, K. G. Ayappa and J. K. Basu, Sci. Rep., 2017, 7, 11173 CrossRef PubMed.
- Y.-H. Liao, C.-H. Lin, C.-Y. Cheng, W. C. Wong, J.-Y. Juo and C.-L. Hsieh, ACS Nano, 2019, 13, 10918–10928 CrossRef CAS PubMed.
- G. de Wit, D. Albrecht, H. Ewers and P. Kukura, Biophys. J., 2018, 114, 2945–2950 CrossRef CAS PubMed.
- E. Yamamoto, T. Akimoto, A. Mitsutake and R. Metzler, Phys. Rev. Lett., 2021, 126, 128101 CrossRef CAS PubMed.
- D. Laage, T. Elsaesser and J. T. Hynes, Chem. Rev., 2017, 117, 10694–10725 CrossRef CAS PubMed.
- B. Bagchi, Proc. Natl. Acad. Sci. U. S. A., 2016, 113, 8355–8357 CrossRef CAS PubMed.
- N. Nandi and B. Bagchi, J. Phys. Chem. B, 1997, 101, 10954–10961 CrossRef CAS.
- S. K. Pal, J. Peon, B. Bagchi and A. H. Zewail, J. Phys. Chem. B, 2002, 106, 12376–12395 CrossRef CAS.
- A. L. Agapov, A. I. Kolesnikov, V. N. Novikov, R. Richert and A. P. Sokolov, Phys. Rev. E: Stat., Nonlinear, Soft Matter Phys., 2015, 91, 022312 CrossRef CAS PubMed.
- A. Wallqvist and B. J. Berne, Chem. Phys. Lett., 1985, 117, 214–219 CrossRef CAS.
- S. Habershon, T. E. Markland and D. E. Manolopoulos, J. Chem. Phys., 2009, 131, 024501 CrossRef PubMed.
- J. Lobaugh and G. A. Voth, J. Chem. Phys., 1997, 106, 2400–2410 CrossRef CAS.
- L. H. d. l. Peña and P. G. Kusalik, J. Chem. Phys., 2004, 121, 5992–6002 CrossRef PubMed.
- T. F. M. Iii and D. E. Manolopoulos, J. Chem. Phys., 2005, 123, 154504 CrossRef PubMed.
- L. H. d. l. Peña and P. G. Kusalik, J. Chem. Phys., 2006, 125, 054512 CrossRef PubMed.
- F. Paesani, W. Zhang, D. A. Case, T. E. Cheatham III and G. A. Voth, J. Chem. Phys., 2006, 125, 184507 CrossRef PubMed.
- F. Paesani, S. Iuchi and G. A. Voth, J. Chem. Phys., 2007, 127, 074506 CrossRef PubMed.
- B. Guillot and Y. Guissani, J. Chem. Phys., 1998, 108, 10162–10174 CrossRef CAS.
- J. A. Poulsen, G. Nyman and P. J. Rossky, Proc. Natl. Acad. Sci. U. S. A., 2005, 102, 6709–6714 CrossRef CAS PubMed.
Footnote |
| † Electronic supplementary information (ESI) available: Simulated and experimental transport properties, which are fitted with VFT and power law. See DOI: 10.1039/d1cp02202d |
|
| This journal is © the Owner Societies 2021 |
Click here to see how this site uses Cookies. View our privacy policy here. 
 ,
Shivam
Dueby
and
Snehasis
Daschakraborty
,
Shivam
Dueby
and
Snehasis
Daschakraborty


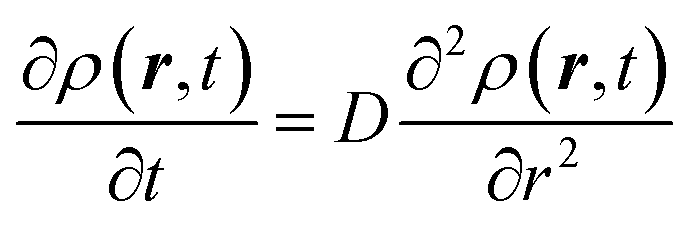

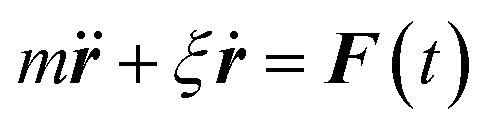
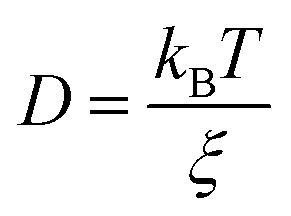
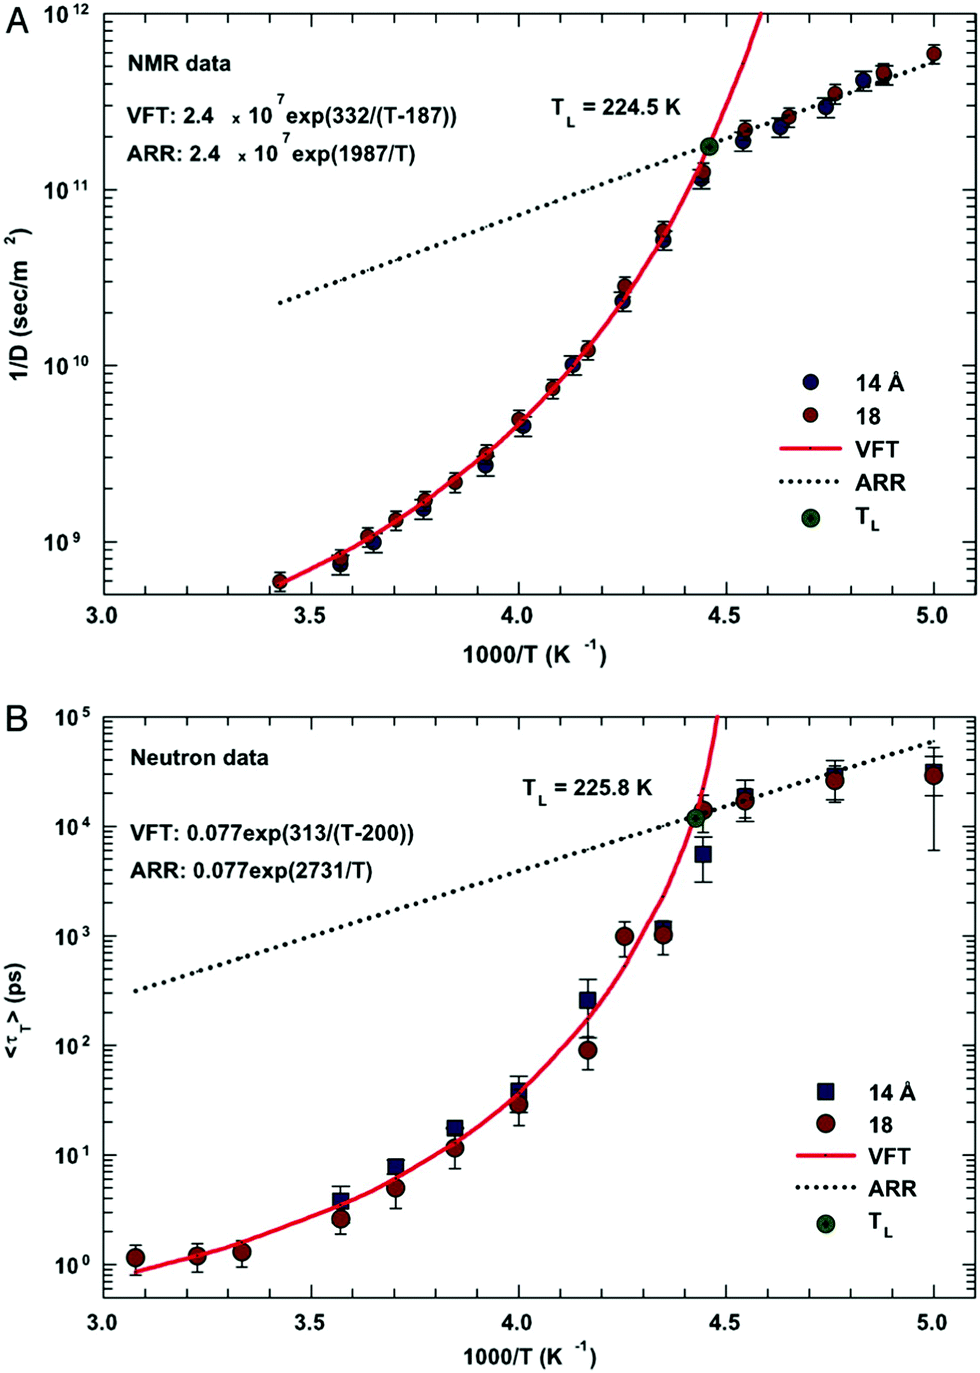
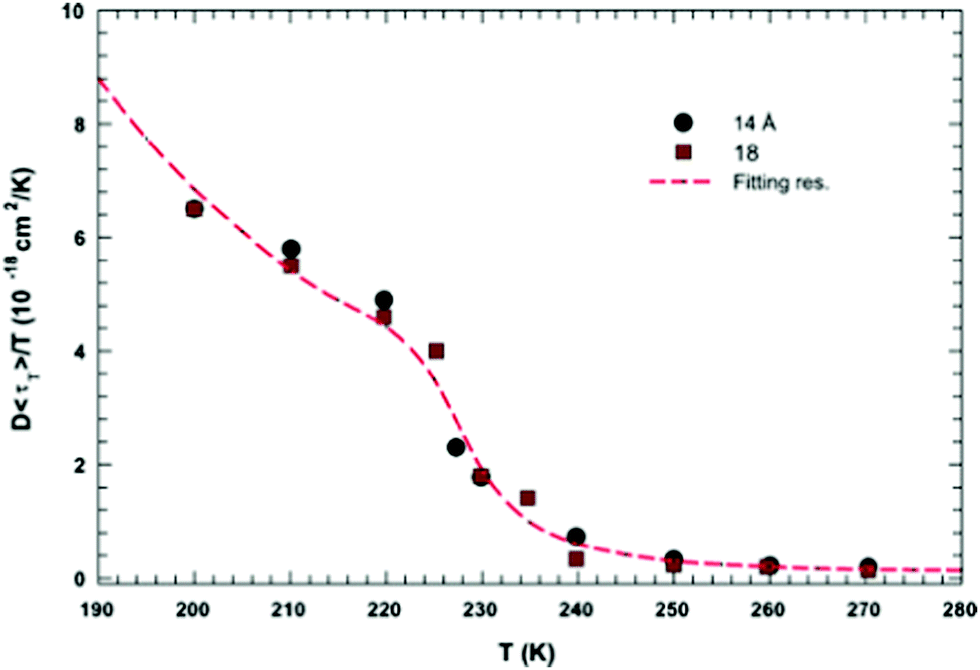
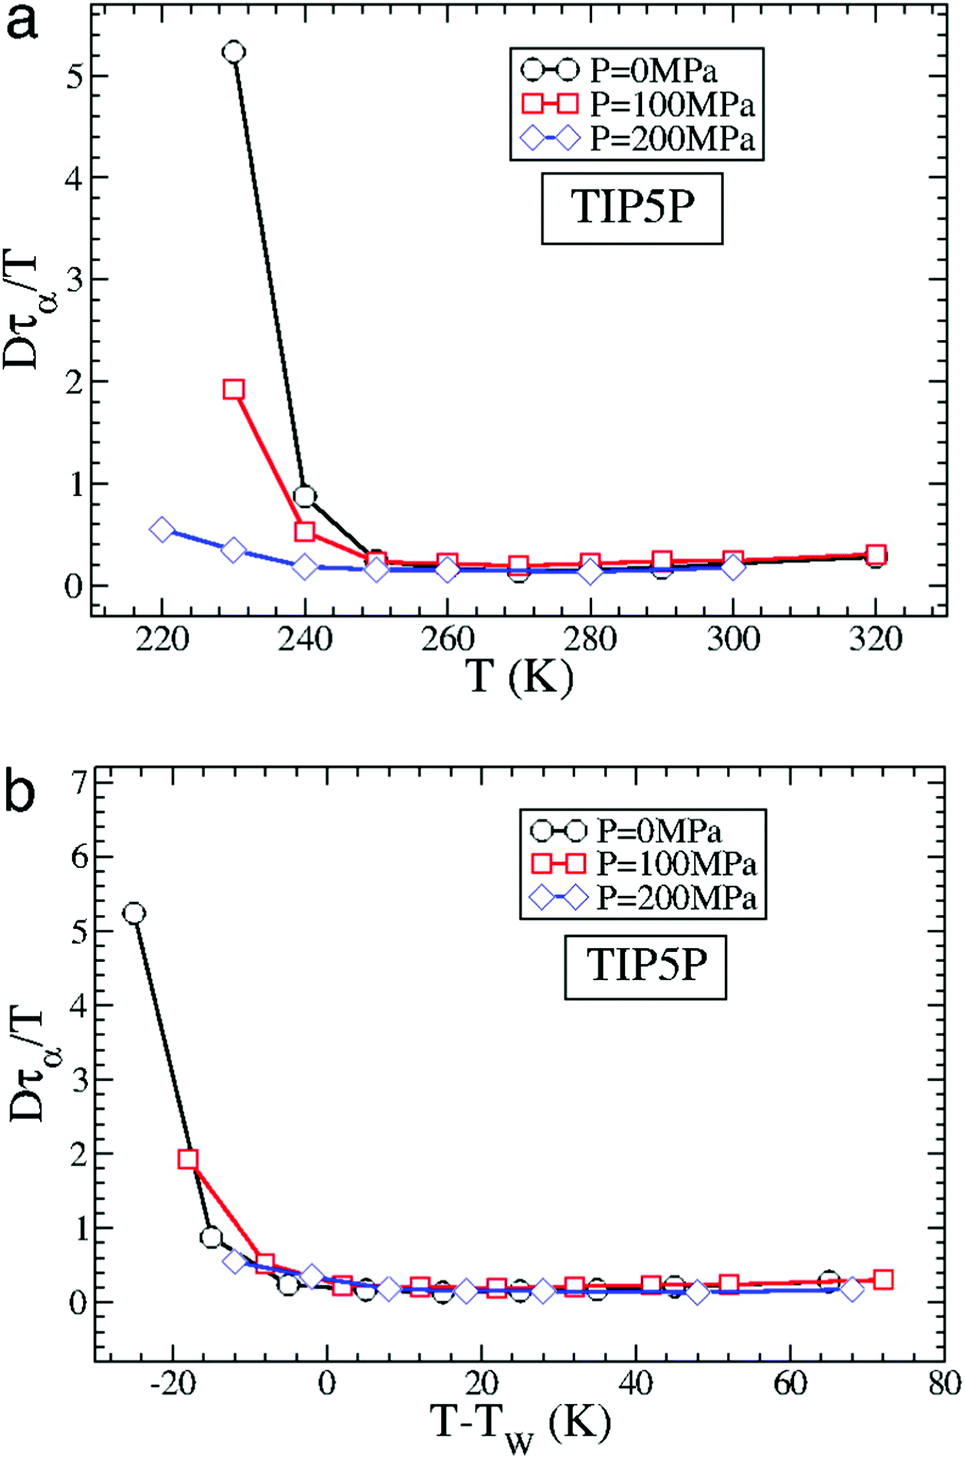
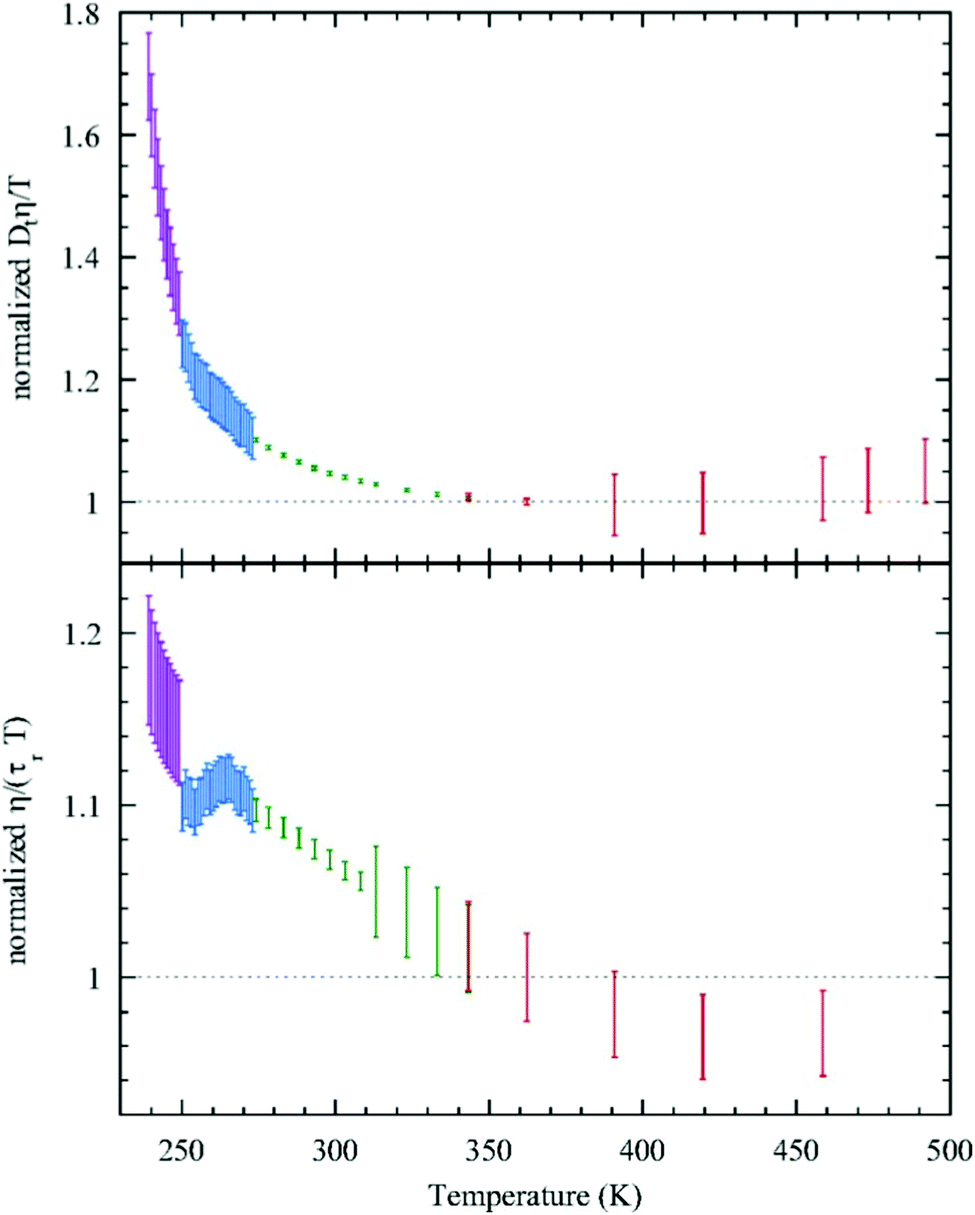
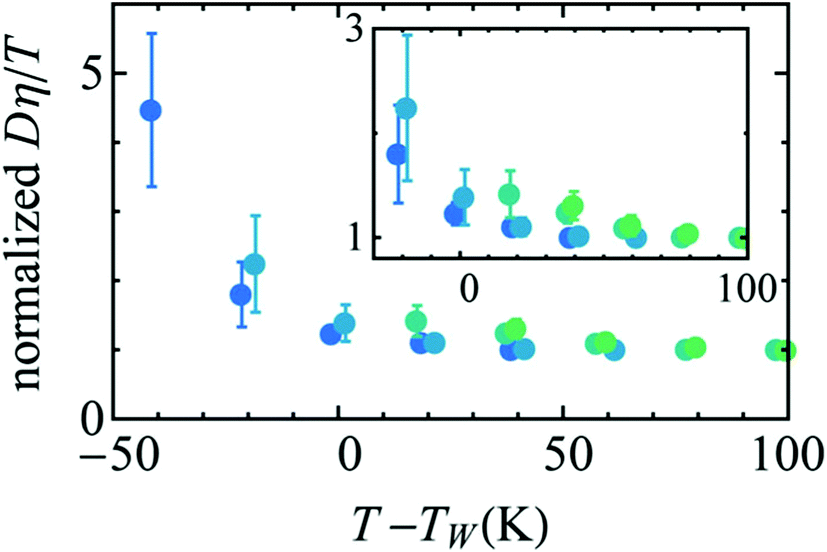

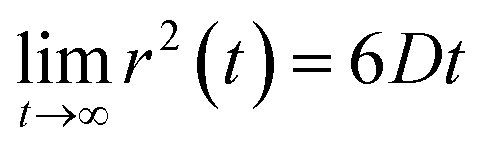
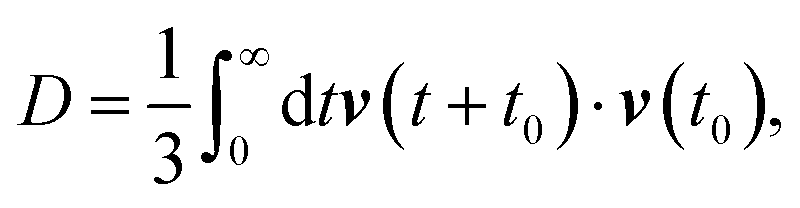
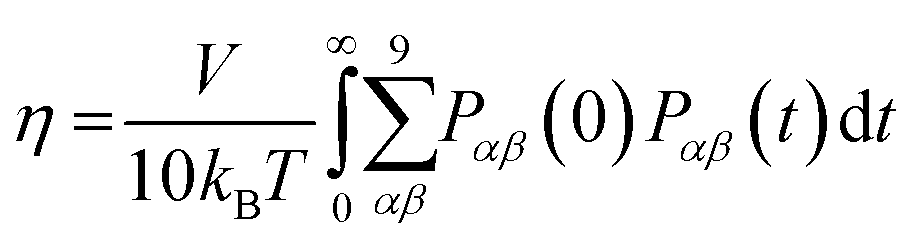
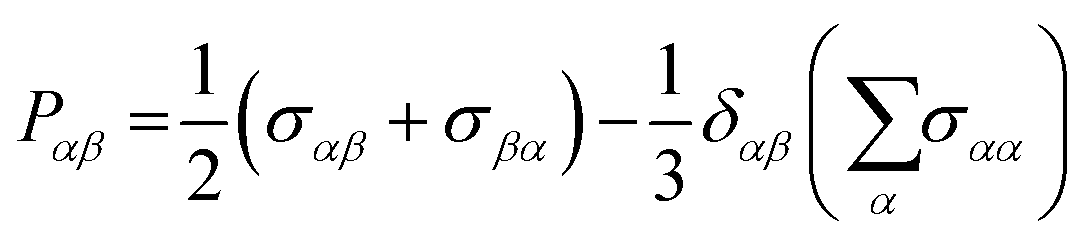
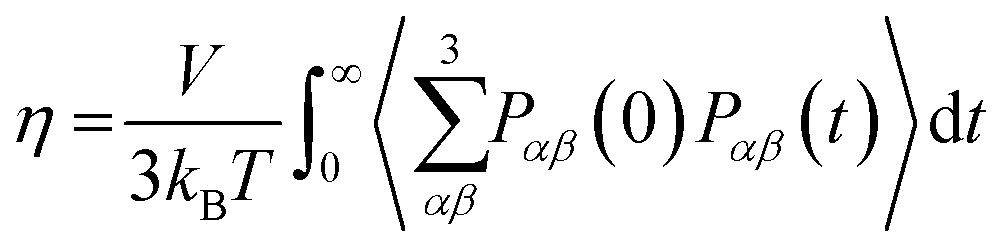


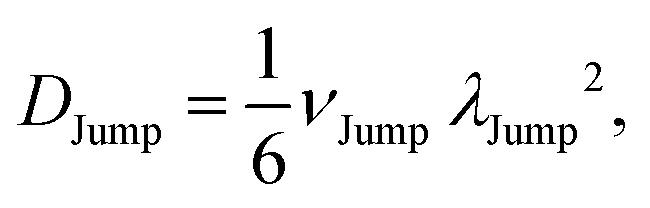
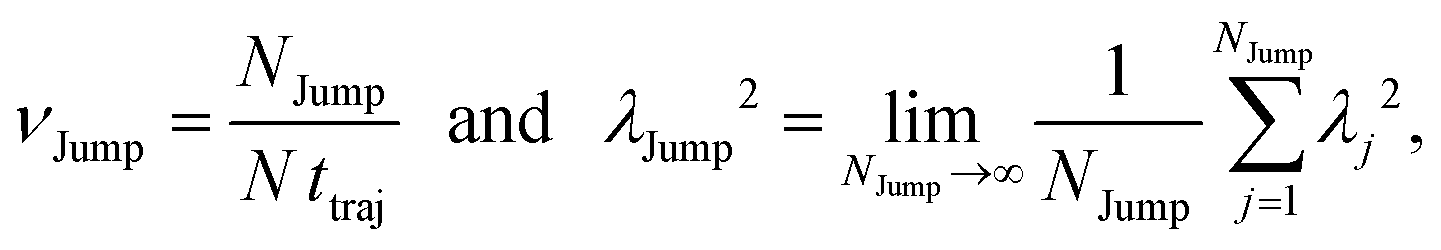
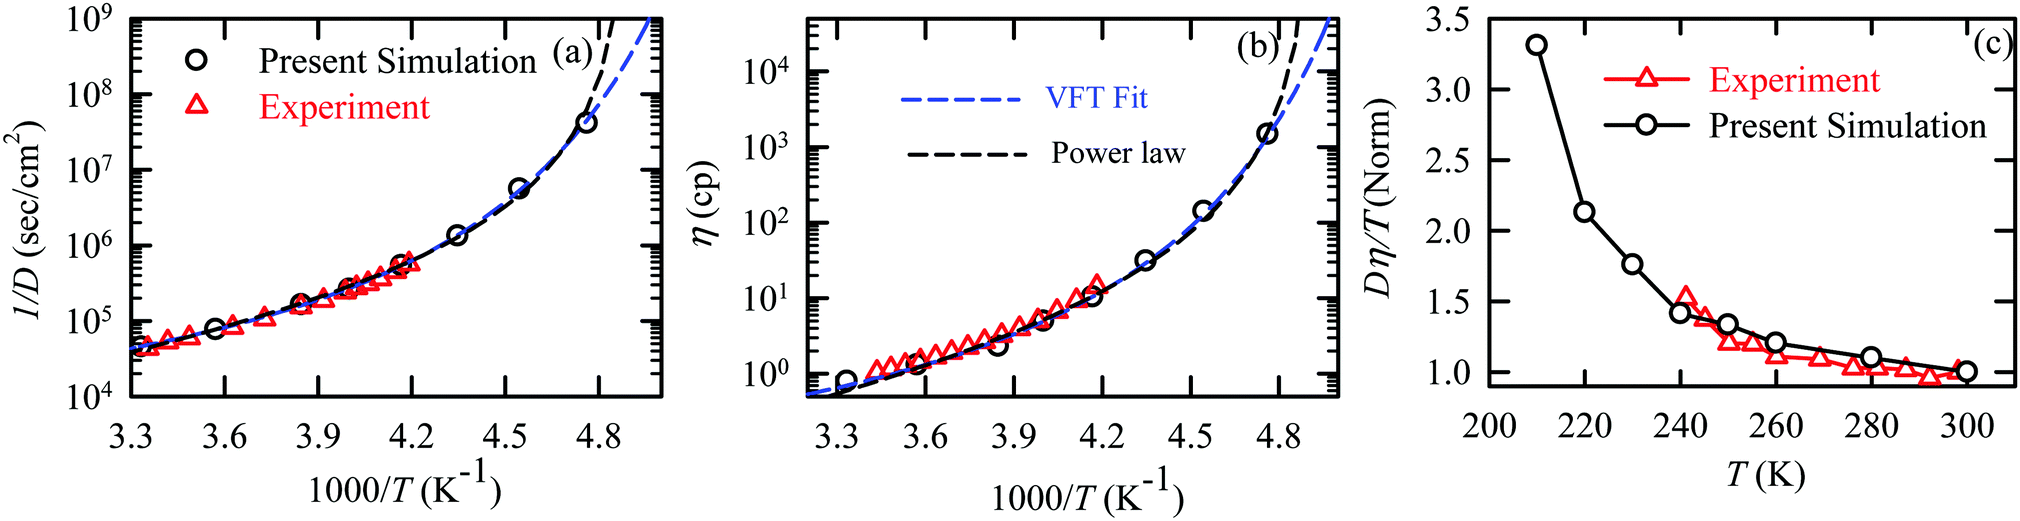
 are: γ = −2.60, D0 = 1.71 × 10⁻⁴ cm2 s−1,and Ts = 204.28 K (χ2 = 23.64) and for the viscosity coefficient are:
  are: γ = 2.97,η0 = 0.065 cp and Ts = 203.24 K(χ2 = 1.95). The simulated singular temperature Ts for both the diffusion and viscosity coefficients are approximately 15 K less than Ts obtained by fitting the experimental data.54 The fitting parameters of the VFT equation for the diffusion coefficient
  are: D0 = 3.05 × 10⁻⁴ cm2 s−1, B = 328.34 K, and T0 = 175.54 K (χ2 = 2.576) and for the viscosity coefficient
  the fitting parameters are: η0 = 3.85 × 10⁻² cp, B = −360.34 K, and T0 = 175.60 K (χ2 = 0.469). The fittings are done using the non-linear chi-square fitting method156 with the weights calculated from the standard errors.64 We have also used the Marquardt–Levenberg algorithm,157,158 which is a least square method, to find the fitting parameters, which are presented in Fig. S1 of the ESI.† Adopted with permission from ref. 64. Copyright (2019) American Chemical Society.